



Abstract
In the actual production process, time-varying and nonlinear problems are numerous important problems to be considered, in view of these problems, a process monitoring approach based on locally weighted probabilistic kernel principal component analysis (LWPKPCA) is proposed. First, the method selects the normal process data with a high similarity to the test samples as training data of the local model, and continuously updates the local model according to the test samples to build an accurate time-varying model. Second, by weighting the data of different importance, the role of data similar to test samples in the modeling process is strengthened. Third, the LWPKPCA model is applied to process monitoring, the monitoring indicators are established in a high-dimensional space and used to detect faults. Finally, on the basis of LWPKPCA, the penicillin fermentation process (PFP) is taken to evaluate the monitoring performance of the proposed methods. According to the comparison of the experiment results, the detection rate and accuracy rate of the LWPKPCA method is considerably better than those of probabilistic principal component analysis and probabilistic kernel principal component analysis methods. The results demonstrate that the proposed method is suitable for processing time-varying data with nonlinear characteristics, and the LWPKPCA process monitoring method is effective for improving the performance of fault detection.
Keywords
Introduction
In recent years, to ensure a safe and stable operation of an industrial production process and improve the product quality, numerous process monitoring methods have been applied to the production process [1–7]. Among them, process monitoring methods based on multivariate statistical analysis have been widely studied, such as the principal component analysis (PCA) [8], partial least squares (PLS) [9], and independent component analysis [10] methods. Among these process-monitoring methods, the PCA method is a more mature multivariate statistical process monitoring method, which has been widely used in the field of process monitoring.
However, the random noise of process data is common due to the measurement error of sensors, disturbance of the production environment, and random interference of the data transmission process. Most of the traditional process monitoring models are established based on the projection method or discrimination method, ignoring the impact of noise, so that they cannot accurately describe the industrial process data. In the industrial process, almost all process variables are acquired in a noise environment, which implies that process variables and noise variables are random variables in essence. In this case, a method based on a probabilistic model has been introduced [11,12]. In the probabilistic model, both process variables and noise variables can be used as random variables. Hence, the probabilistic model can explain the process data more accurately and reasonably. Therefore, probabilistic models based on PCA and PLS are being constantly proposed [13,14]. For example, Zheng et al. extended the basic semi-supervised probabilistic PLS model to the mixture form, and carried out the performance evaluation with a detailed industrial case study [15]. Zhang et al. proposed a mixture of probabilistic PCA method, and adopted this approach in a practical coal pulverizing system [16].
In addition to the random noise of industrial process data, in the actual production process, there are still numerous important problems to be considered, such as the time-varying problem of production process data. Owing to the change in the production process environment and aging of equipment, the operation state of the production process often changes frequently. Under such circumstances, the traditional process monitoring method based on a static model cannot be applied to the current process with state changes, because it cannot effectively monitor the production process. To solve this problem, the process monitoring model needs to be updated and corrected in time. Common methods include the recursive learning method [17] and just-in-time learning method [18–20]. The recursive learning method is suitable for slow time-varying processes. When a sudden change appears in an industrial process, the adaptive ability of the recursive learning method will be limited. Therefore, the just-in-time learning method has been proposed to overcome the defects of the recursive learning method. The real-time learning method can establish a real-time model for time-varying processes, so that it has been widely used in nonlinear and time-varying processes. For example, Yuan et al. proposed a just-time learning method based on a local weighted kernel principal component regression model and double-layer local weighted principal component regression model, which was applied to the process of soft sensing [21,22]. Zhang et al. proposed a double-level locally weighted extreme learning machine method, which assigned different weights to the training samples according to their double-level similarity values, and was tested using one numerical system, the industrial debutanizer column plant and the industrial polypropylene production process [23].
Morever, with the increasing complexity of industrial production, the variables in the industrial process usually exhibit a nonlinear relationship, while the traditional PCA method can only effectively extract the linear features of process data. To solve this problem, scholars gradually explore the monitoring methods of nonlinear processes. Common methods include the neural network, kernel, and local linear model methods. Among them, the kernel method has been rapidly developed because of its better generalization ability [24]. Scholars continue to explore the combination of kernel methods with traditional process monitoring methods and apply them to the production process [25]. For example, Tang et al. used multikernel principal component analysis stages with additional robustness to distortions in feature extraction to enhance the energy of spectrum symptom and overcome the tricky issues of low-speed machinery [26].
Inspired by the abovementioned literature survey, to address the time-varying and nonlinear characteristics of data in an industrial process, in this paper, a fault detection method based on locally weighted probabilistic kernel principal component analysis (LWPKPCA) is proposed. First, the normal process data with a high similarity to the new testing sample are selected as a training dataset of the local model. The weight for the new testing sample is assigned according to the different importance of local training data. Second, the expectation-maximization algorithm is introduced to estimate the parameters in the local model to acquire the optimal model parameter set, and thus an accurate local linear time-varying model is then constructed through self-renewal. Third, by the application of the local weighting method and kernel function, this method is suitable for industrial processes with time-varying and nonlinear data characteristics. Owing to the reference of the expectation maximization (EM) algorithm, this method can address process data containing random noise and missing values.
The main contributions of this study are summarized as follows. (1) A novel fault detection method based on LWPKPCA is proposed. (2) The detection and procedures of the proposed method are summarized. (3) Comparative studies of the proposed method are presented based on the penicillin fermentation process (PFP).
The remainder of this paper is organized as follows. In Section 2, the LWPKPCA model is proposed, and the construction of the model and optimization of parameters are described in detail. In the following section, the process monitoring approach based on LWPKPCA is researched. The process monitoring procedure based on this method is presented. In Section 4, the performance of the LWPKPCA method is verified by an application research in the PFP. Finally, the conclusions are summarized in the last section.
Locally weighted probabilistic kernel principal component analysis approach
With an input data set X ∈ Rm×N, where m represents the number of variables and N represents the number of samples, a nonlinear mapping Φ (·): X → Φ (X) is used to map the input variables to the high-dimensional feature space, where Φ (X) = [Φ (x1) , ⋯ , Φ (x
N
)] ∈ RD×N and D is the dimension of the data in the high-dimensional space. The kernel matrix
Assuming that the input variables
Therefore,
We can obtain the conditional probability distribution of
Using the probability distribution of t and Eq. (3), the posteriori distribution of t is obtained:
In the modeling phase, first, we calculate the similarity between training samples and test samples x q , and then determine the weight w i (i = 1, \dots ,N) of each training sample according to the similarity. Assuming that there are N samples in the process history data, we sort by descending the weights of each training sample, and select the n samples with the highest similarity to the test samples as a training dataset of the local model.
In the LWPKPCA model, before the estimation of the model parameters, we map the input variables in the training samples to the high-dimensional space and use the weighted average of the input variables and weighted centralization kernel matrix to centralize the input variables. The weighted average of the input variables is expressed by [21]
The weighted centralization kernel matrix is expressed by
After the weighted centralization of the input variables, we can obtain the weighted log likelihood function lnP (
In the M step, the method of maximizing the weighted log likelihood function is used to estimate the model parameters. The weighted log likelihood function is expressed as
Assuming that the partial derivative of the weighted log likelihood function for each parameter is set to zero, the updated parameters can be obtained:
In this section, the LWPKPCA model is applied to process monitoring. First, two statistics T2 and SPE are introduced as monitoring indicators in the high-dimensional space. For a new sample
The main steps of process monitoring based on LWPKPCA include the modeling phase and fault detection phase. Its process is shown in Fig. 1.

Monitoring procedure of LWPKPCA.
The modeling phase can be summarized by the following steps. Collect N normal samples and new testing sample Select n samples with the highest similarity to the new testing samples as local model training data Calculate the matrix Perform weighted centralization on the matrix K0 according to Eq. (6). Update the estimates of parameters Calculate the confidence limits of the statistics T2 and SPE.
For a new sample, the monitoring phase mainly includes the following steps: Compute kernel vector k ( Perform weighted centering on k ( Calculate the statistics T2 and SPE of new samples using Eqs. (14) and (15). If the statistics T2 and SPE are lower than the corresponding control limit, the sample is normal data. If the statistics T2 and SPE exceed its control limit, a fault occurs in the process.
Using the actual industrial process as a background, this section introduces the LWPKPCA method in the process monitoring of PFP, and verifies the fault detection performance of the LWPKCA method by comparing it to probabilistic principal component analysis (PPCA) and probabilistic kernel principal component analysis (PKPCA) methods.
Penicillin is produced by microbial fermentation. Because penicillin has significant economic and social benefits, PFP has attracted an extensive attention. PFP is a complex biochemical process [33–38]. Its flow chart is shown in Fig. 2. There are two main operation phases in PFP, the bacterial growth phase and penicillin fermentation phase. As the data generated by PFP under diverse operation modes and conditions are time-varying and nonlinear, this section verifies the proposed fault detection method with PFP.
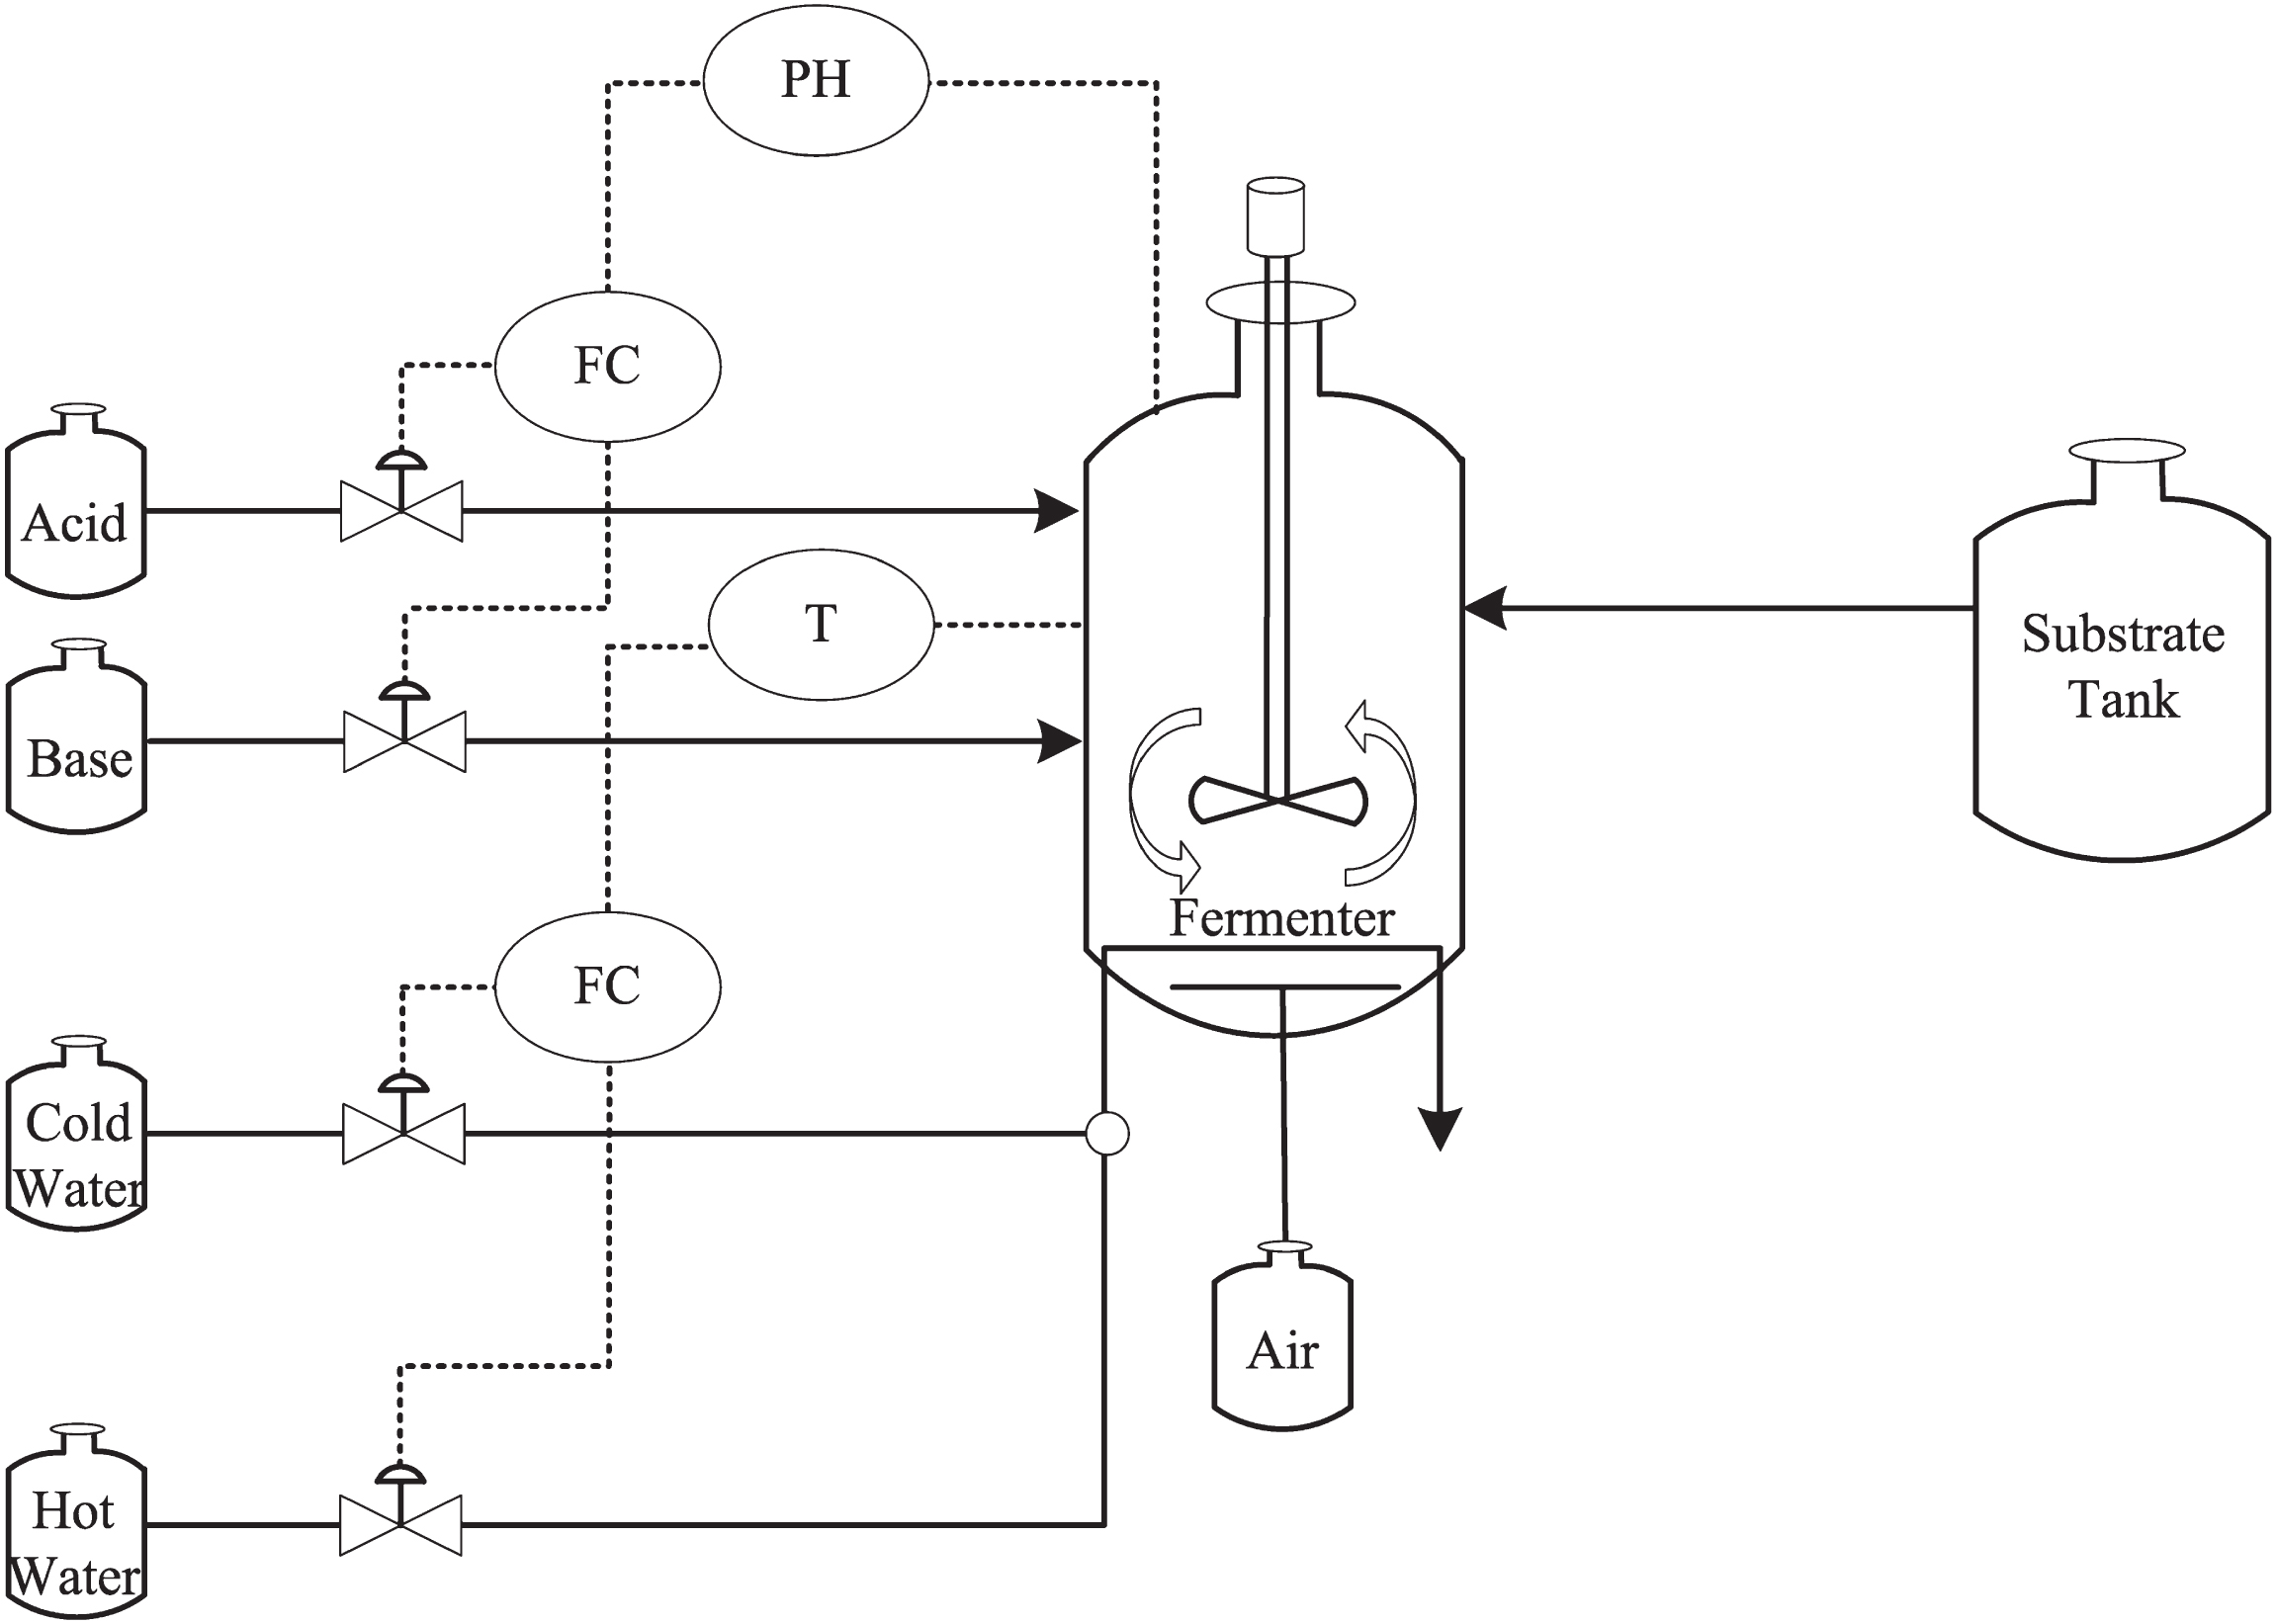
PFP diagram.
The data used in this simulation are generated by the simulation platform Pensim V2.0, which is the most influential penicillin simulation platform worldwide. The mechanism, internal structure, variables, and parameter settings of the simulation platform Pensim have been described by Reference [39]. The simulation of PFP can be easily realized on this simulation platform. Relevant researches proved the practicability and effectiveness of the simulation platform. According to the empirical values of process parameters and fault simulation parameter settings [33,35,36], the parameter values of the PFP in this paper are selected, and the training data and test data are acquired by setting the initial conditions, set points, types of temperature controller and pH controller, as well as the type and amplitude (slope) of faults. In this simulation, the aeration rate, agitator power, substrate feed rate, penicillin concentration, culture volume, and acid flow rate are selected as monitoring variables. Two types of faults in Table 1 are introduced to verify the effectiveness of the LWPKPCA method. The normal mode and two faults are described below. In the normal mode, the initial conditions, set points, and types of temperature controller are the default settings. A proportional integral derivative (PID) controller is used to adjust the pH value. Fault 1 is caused by the slope fault of the agitator power; the fault slope is set to 0.9. Fault 2 is caused by a step fault of the aeration rate; the fault amplitude is set to 2%. Each operation mode operates approximately 500 h, while the sampling interval is 1 h.
Description of the two selected fault types for the PFP
In this simulation, the number of local model training samples n is set to 100, the number of latent variables is set to 1, and the Euclidean distance between training samples and test samples in the original space is selected as a similarity measure [40].
Further, the fault detection performance of the LWPKPCA method is verified by comparison to the PPCA and PKPCA methods. For fault 1, the process monitoring results of the PPCA method are shown in Figs. 3 and 4. It can be seen from the figures that there are many false diagnoses in the T2 statistic, which indicates that the detection performance of the PPCA method is low, mainly because this method cannot effectively extract the nonlinear features in the process data, and the process monitoring model is not suitable for time-varying processes. The process monitoring results of the PKPCA method are shown in Figs. 5 and 6. It can be seen from the figures that the detection effect of the SPE statistics is good, while the detection performance of the T2 statistics is low, mainly because, although this method extracts the nonlinear features in the process data, the monitoring model is not a time-varying model, so that it cannot effectively address the time-varying problem of process data. In contrast, as shown in Figs. 7 and 8, the T2 and SPE statistics of the LWPKPCA method can effectively detect the fault data from the 61st to the 500th sample. Although the detection rate of the SPE statistic in the LWPKPCA method is slightly lower than that of the PKPCA method, the other performance indices of the LWPKPCA method are significantly improved. The simulation results show that, when the local weighted model is constructed, the LWPKPCA method can effectively find the historical data with a similar structure to the test sample by calculating the Euclidean distance between the training sample and test sample as a similarity measure. Simultaneously, using the weight of the historical data with a high similarity to the test sample, a local linearized time-varying model is constructed around the test samples to effectively address the time-varying and nonlinear problems of process data. Therefore, the fault detection ability of this method is improved.
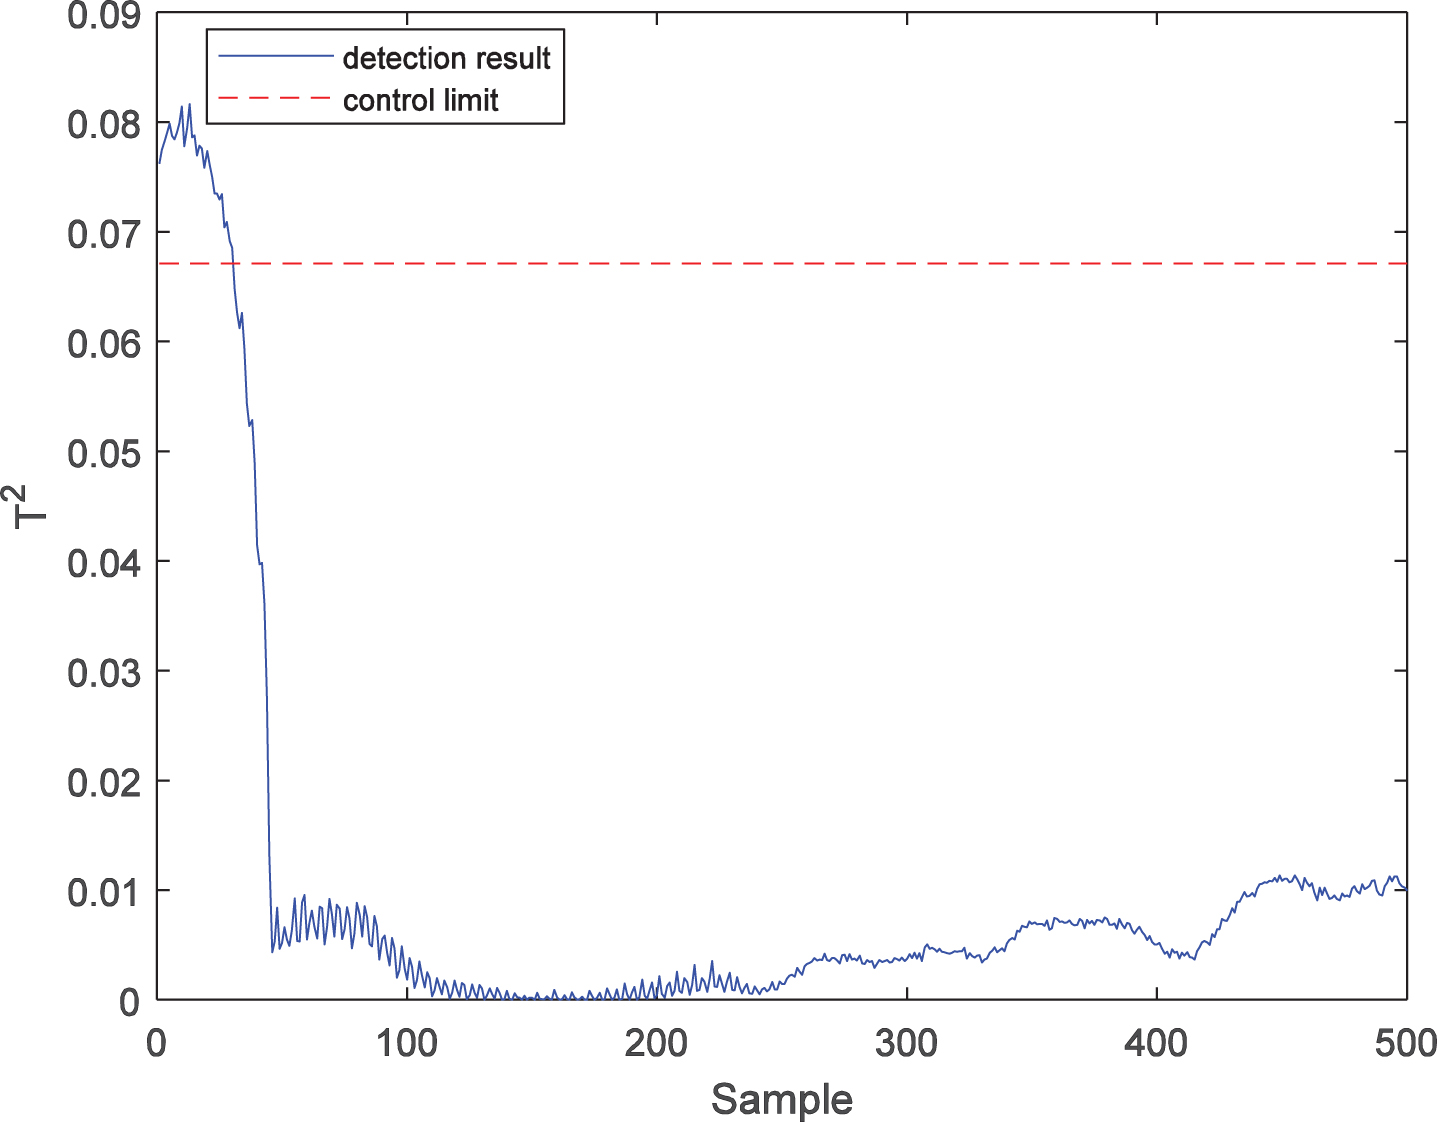
T2 statistic detection result of fault 1 with PPCA.
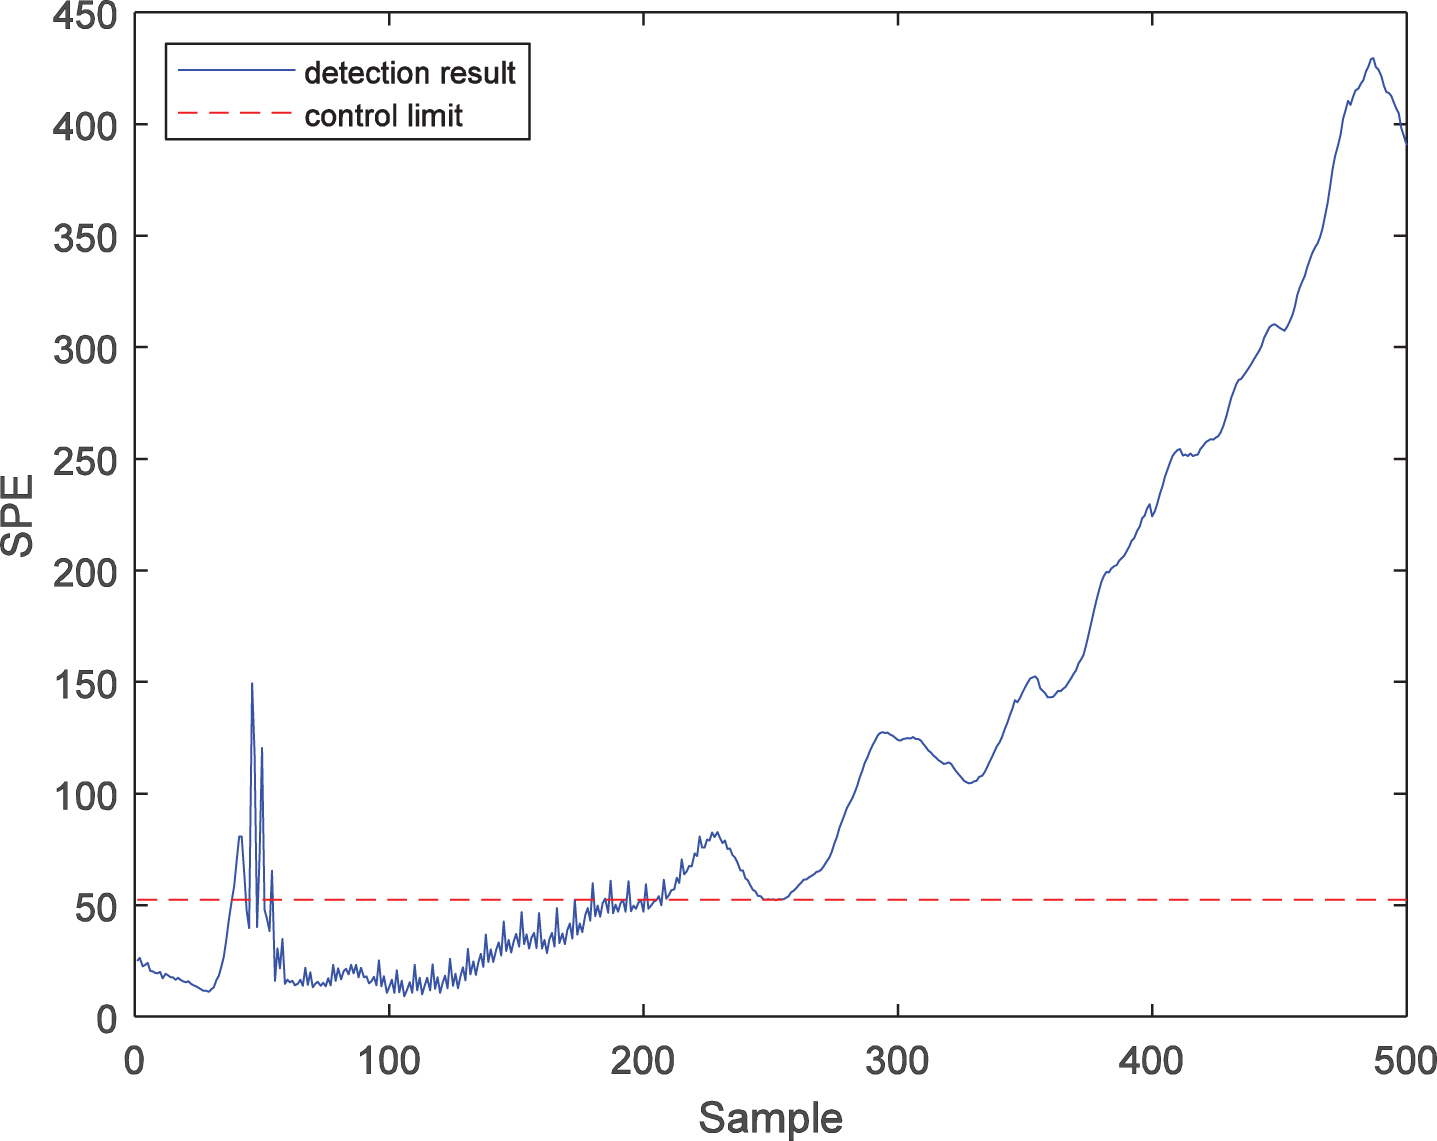
SPE statistic detection result of fault 1 with PPCA.
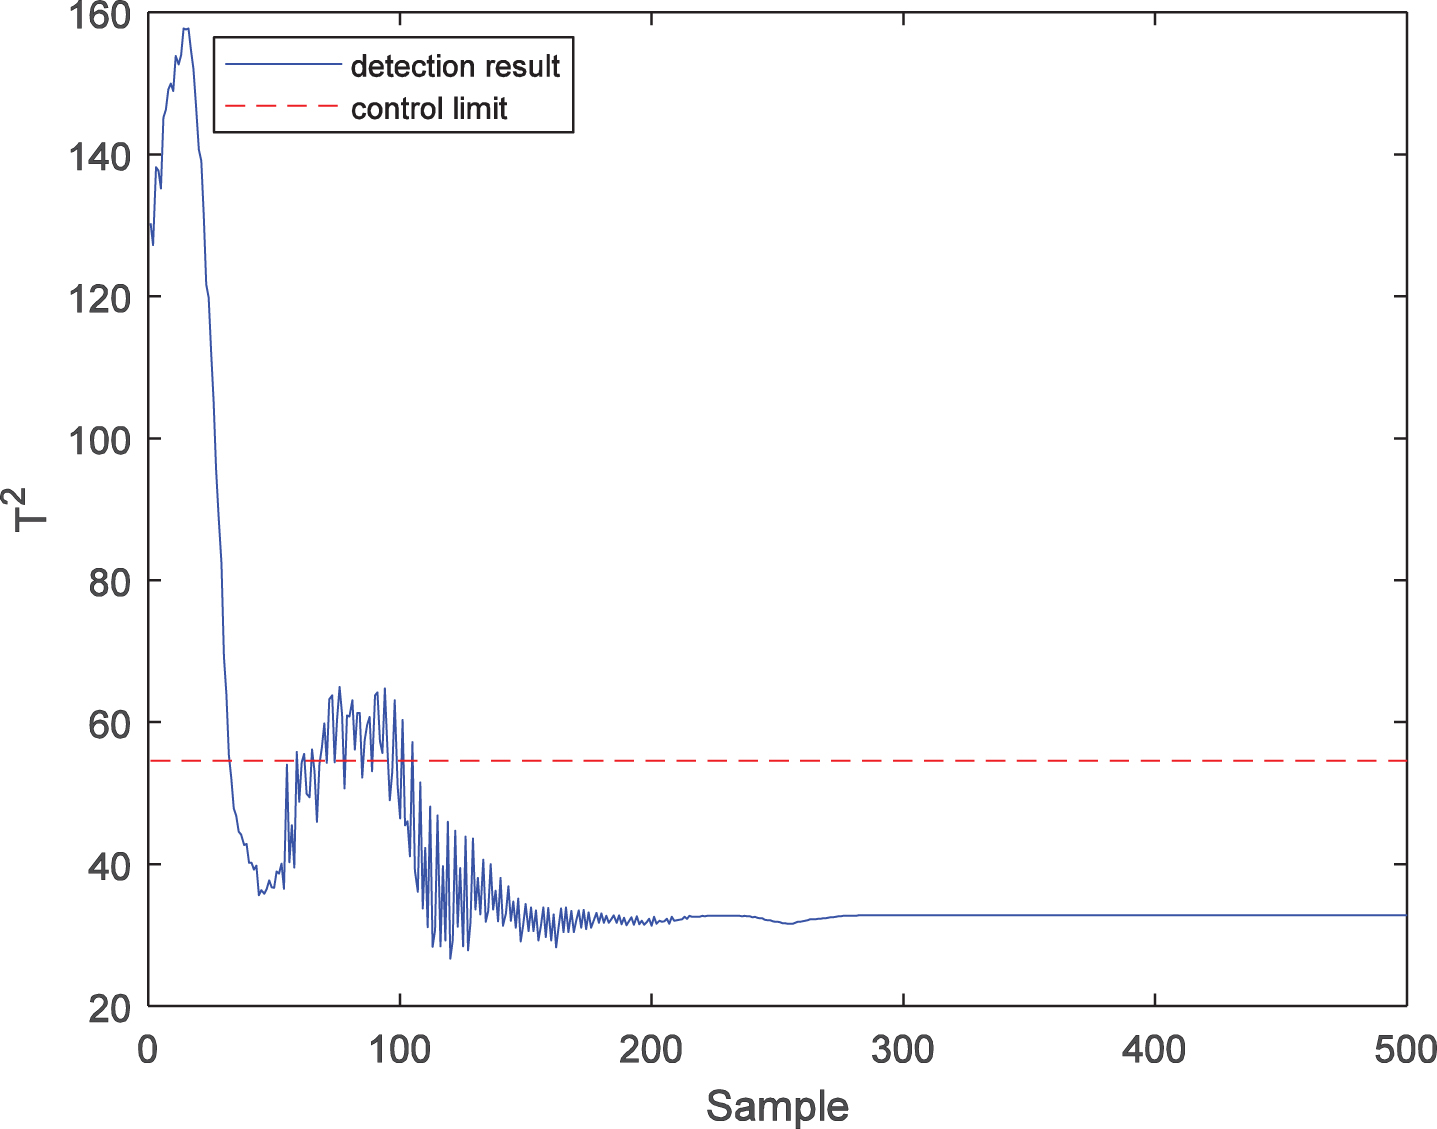
T2 statistic detection result of fault 1 with PKPCA.
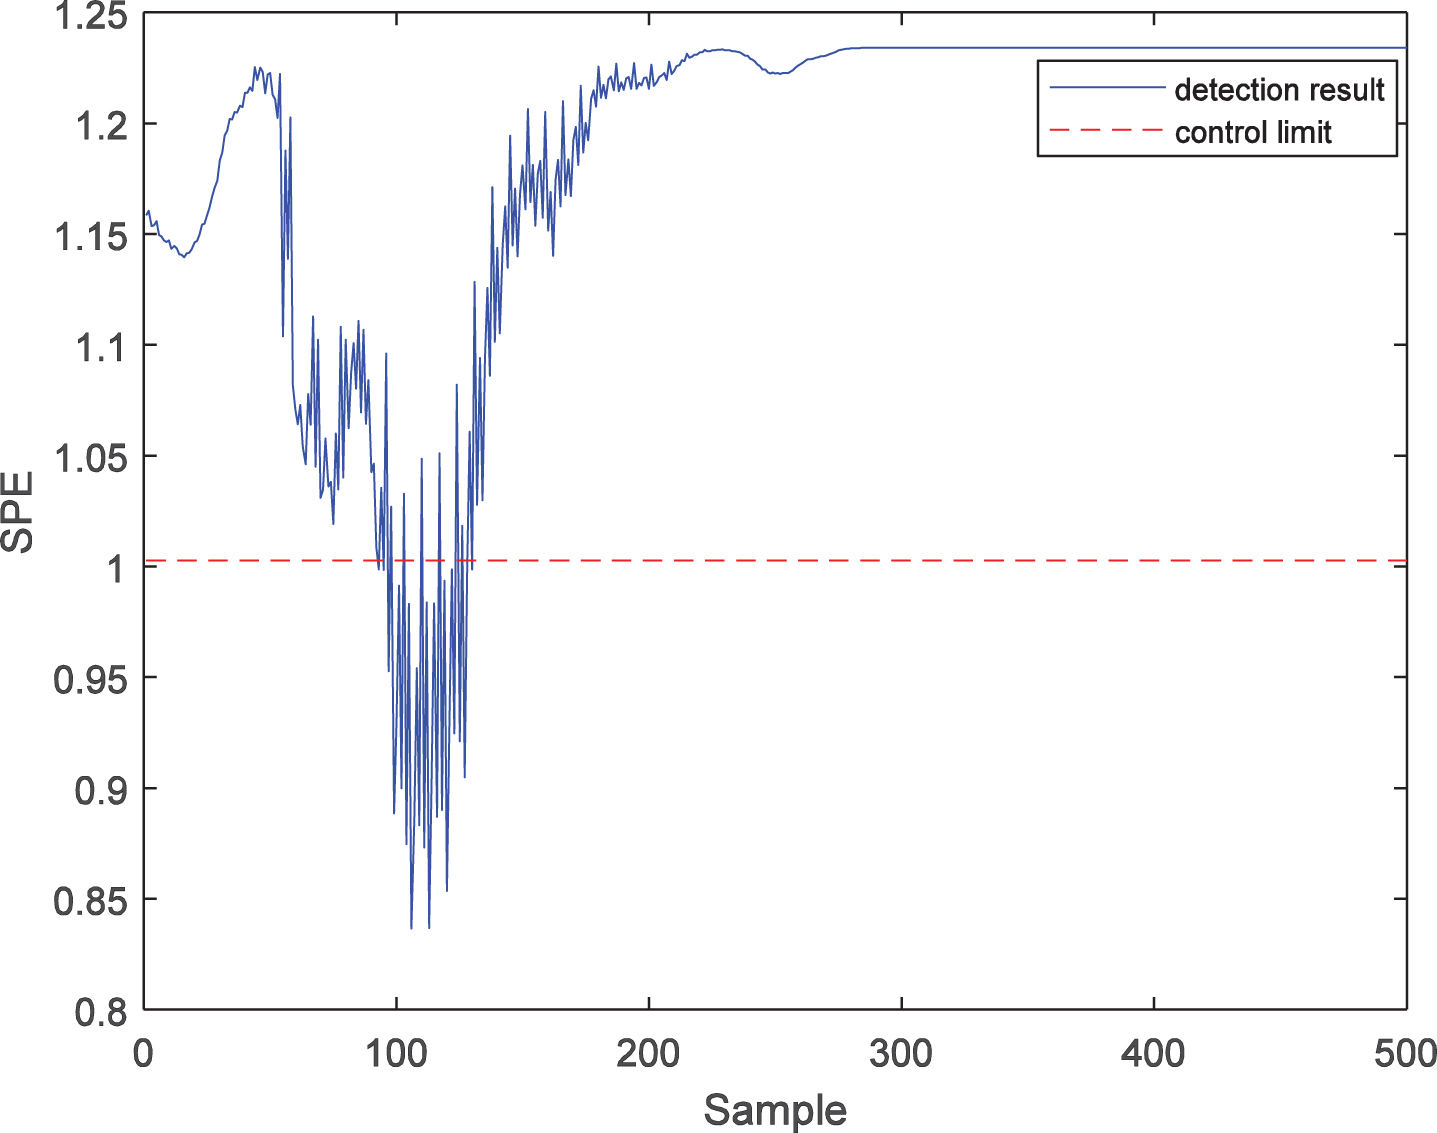
SPE statistic detection result of fault 1 with PKPCA.
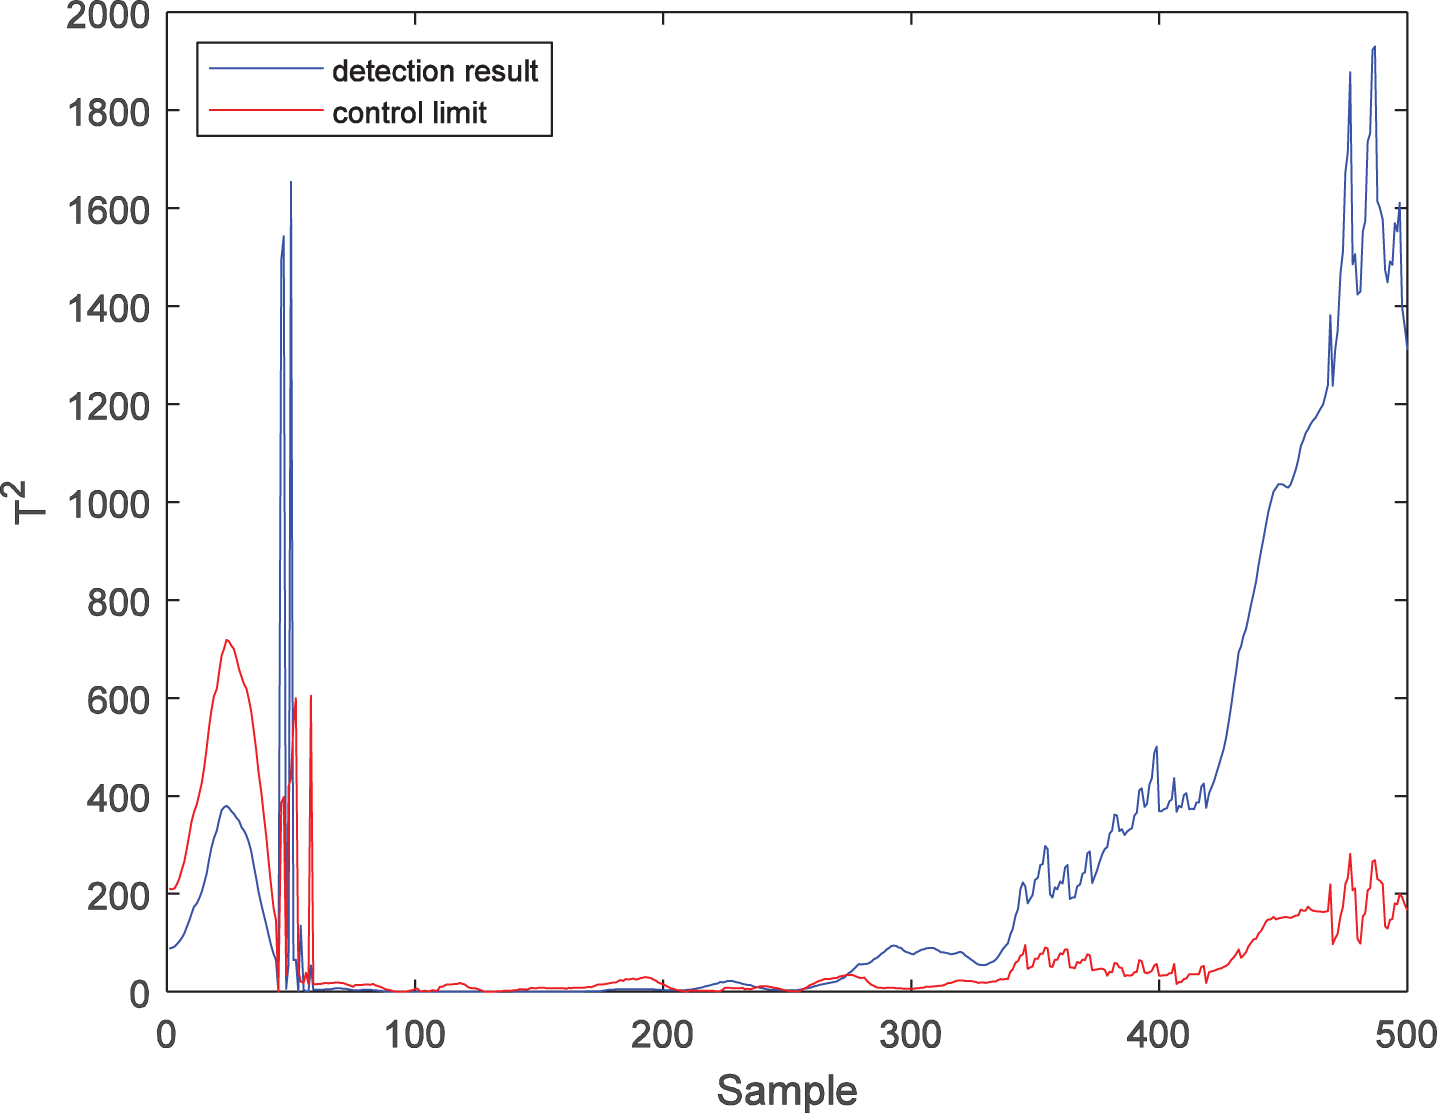
T2 statistic detection result of fault 1 with LWPKPCA.

SPE statistic detection result of fault 1 with LWPKPCA.
T2 statistic detection result of fault 2 with PPCA.

SPE statistic detection result of fault 2 with PPCA.

T2 statistic detection result of fault 2 with PKPCA.
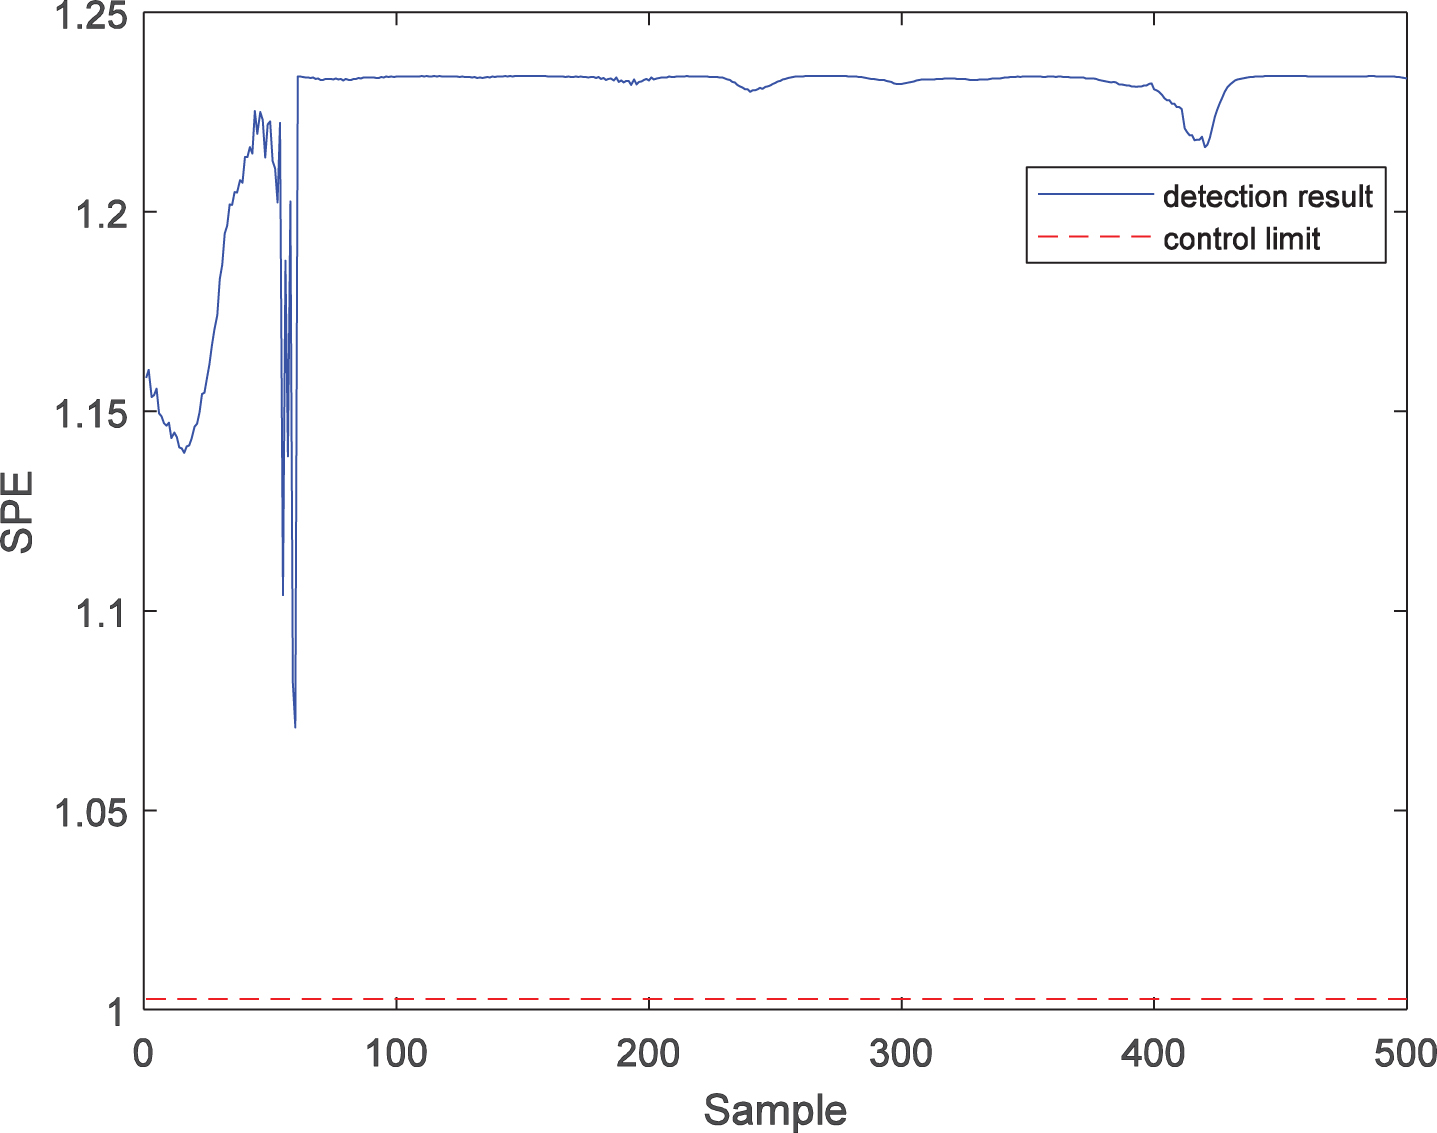
SPE statistic detection result of fault 2 with PKPCA.
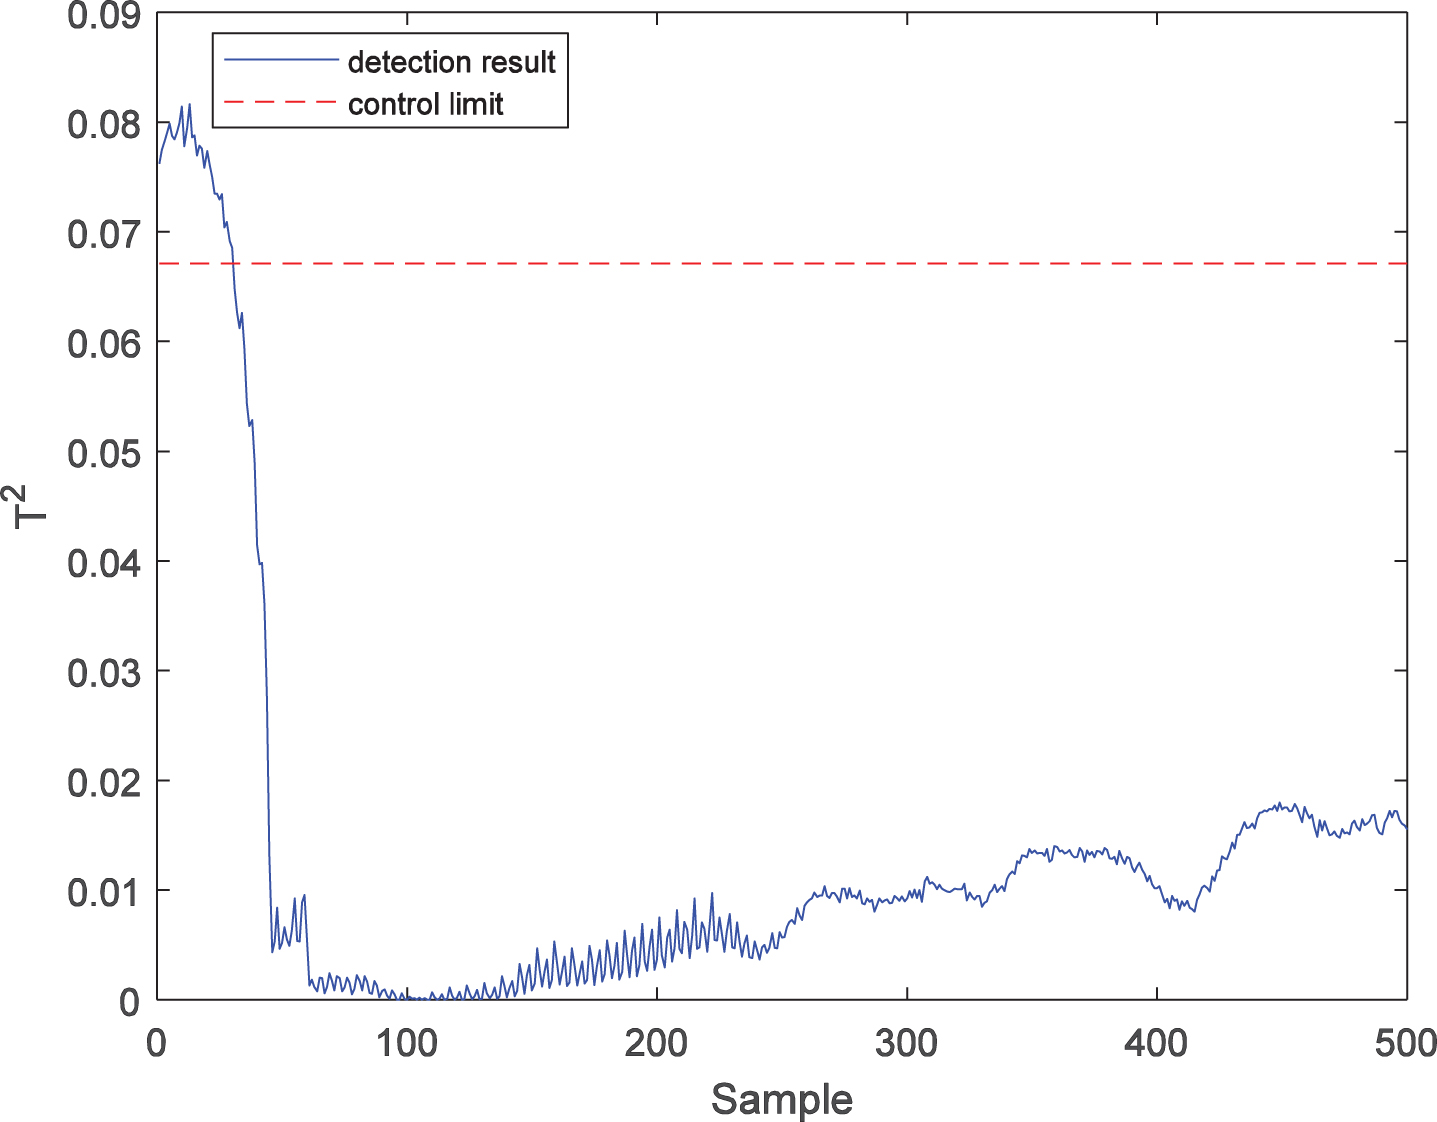
Further, the LWPKPCA method is introduced to fault 2. Similarly, 500 samples are collected as test samples, in which fault 2 starts from the 61st sample to the end. In this simulation, the number of local model training samples n is 100, while the number of latent variables is 1. The fault detection results of the PPCA, PKPCA, and LWPKPCA methods are shown in Figs. 9 to 14. Figures 9 and 10 show that there are many false diagnoses in the T2 statistic of the PPCA method and that the fault detection performance is low. Figures 11 and 12 show that the detection performance of the SPE statistics in PKPCA is good, but there are a large number of false diagnoses in the T2 statistics, and the fault detection performance is low. In contrast, the results in Figs. 13 and 14 show that the T2 and SPE statistics of the LWPKPCA method can timely and effectively detect the fault data starting from the 61st sample. Both T2 and SPE statistics have a high accuracy. The fault detection ability is significantly improved. For faults 1 and 2, the fault detection performances for the three methods are shown in Table 2. According to the comparison of the results, the fault detection performance of the LWPKPCA method is considerably better than those of the other two methods.
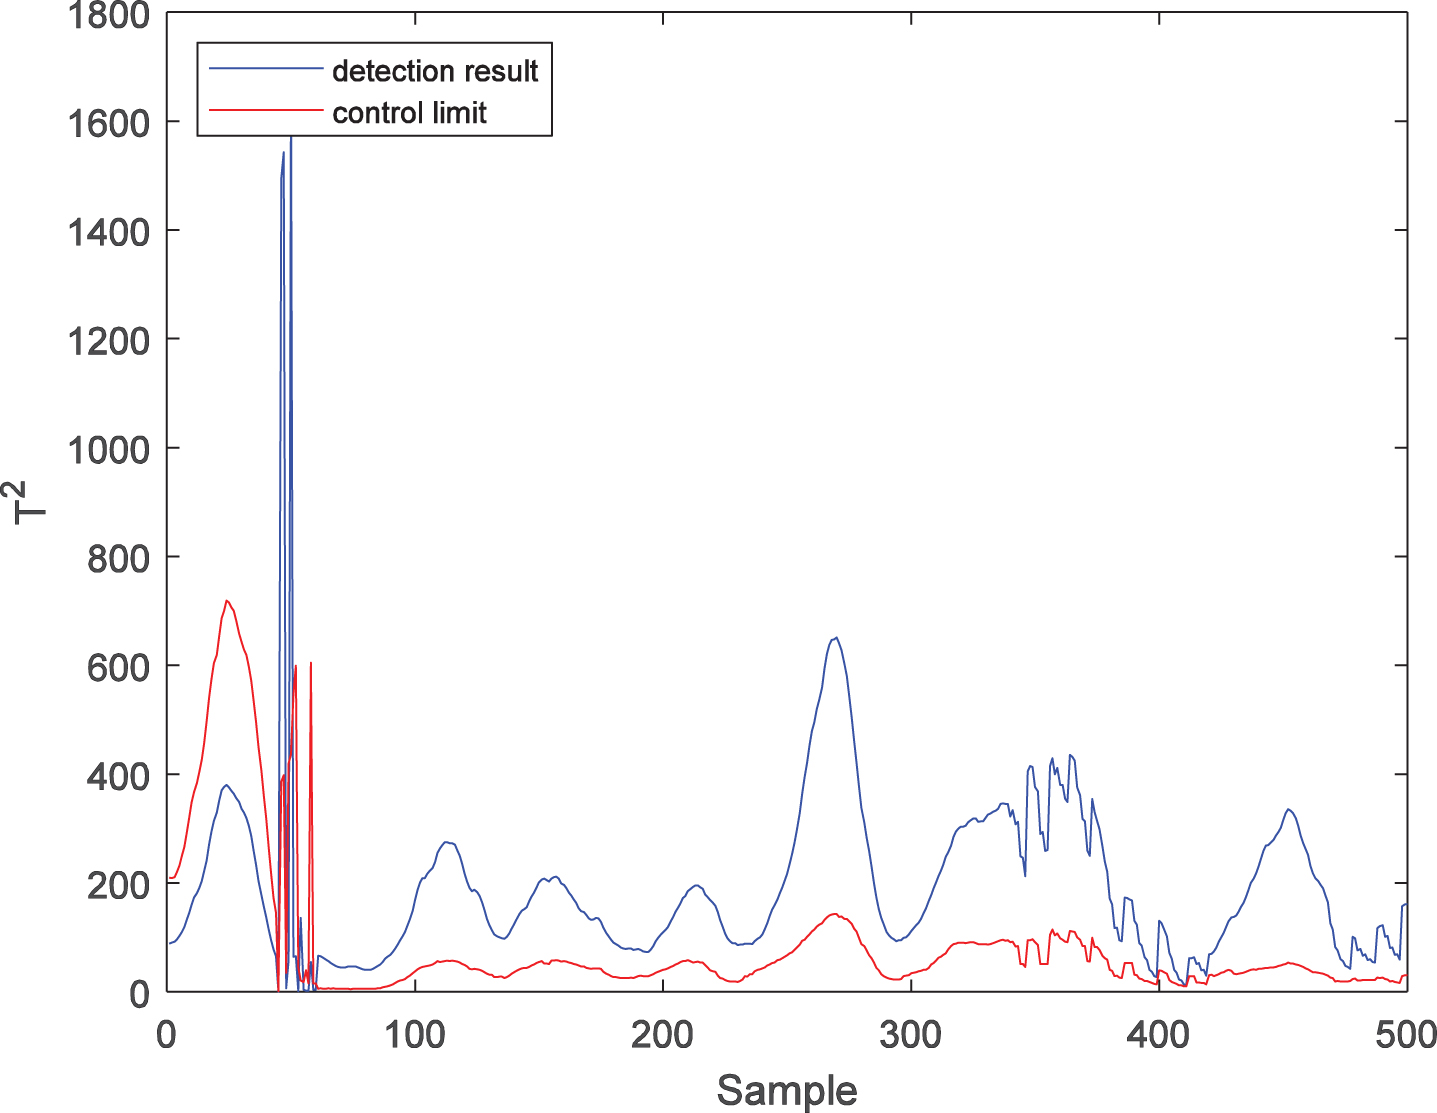
T2 statistic detection result of fault 2 with LWPKPCA.
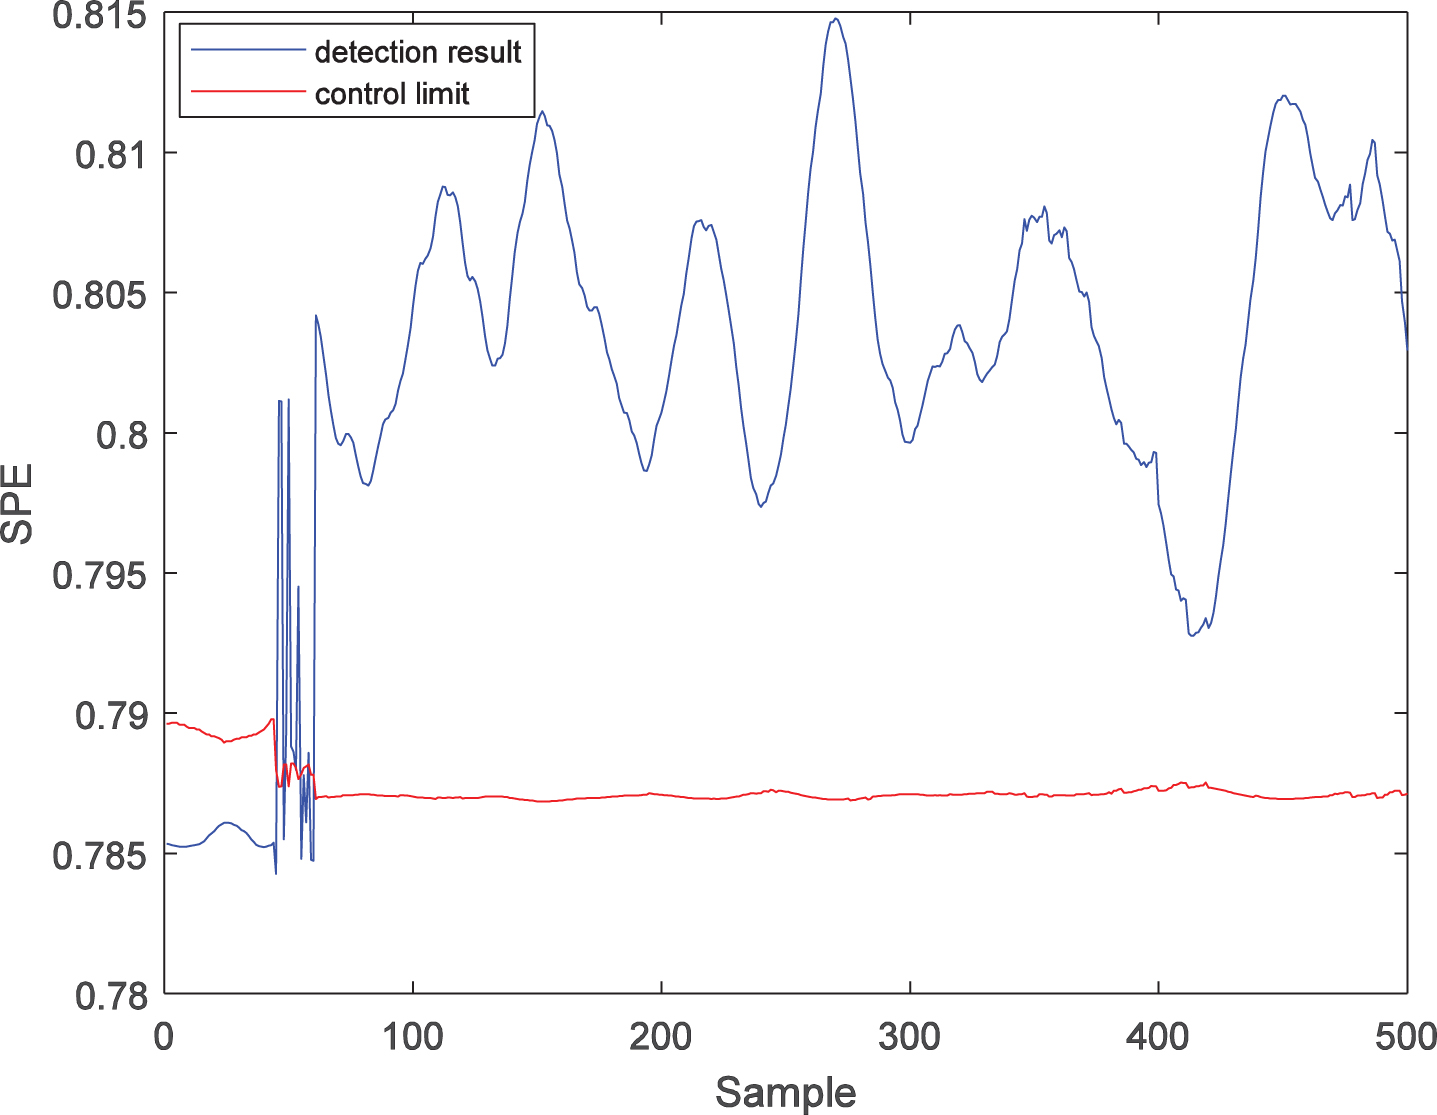
SPE statistic detection result of fault 2 with LWPKPCA.
Fault detection performances of the three methods in PFP (%)
To address the time-varying and nonlinear characteristics of data in an industrial process, a process monitoring method based on LWPKPCA was studied. First, in the LWPKPCA model, the normal process data with a high similarity to the test samples is selected as training data of the local model, and the local model is continuously updated according to the test samples to build an accurate time-varying model. Second, by the application of the local weighting method and kernel function, this method is suitable for industrial processes with time-varying and nonlinear data characteristics. Third, owing to the reference of the EM algorithm, this method can address process data containing random noise and missing values. Finally, the LWPKPCA model is applied to process monitoring, and a fault detection procedure based on LWPKPCA is proposed. The application research on PFP verified the effectiveness of the fault detection based on LWPKPCA. The simulation results showed that the LWPKPCA method can improve the fault detection performances of nonlinear time-varying process data. Compared to traditional methods, the LWPKPCA method significantly improves the accuracy of fault detection, and has theoretical significance and practical application value. Although the proposed method yields encouraging results, more related fault diagnosis methods, including fault isolation and identification will be required to develop in future.
Footnotes
Acknowledgments
This study was supported by the National Natural Science Foundation of China under Grant 61733003, the Natural Science Foundation of Liaoning Province under Grant 2022-BS-211, and the Basic Scientific Research Project of Liaoning Provincial Department of Education under Grant LJKMZ20220776 and LJKZ0105.