
Abstract
Friction stir welding (FSW) is a complex thermo-mechanical coupling process. Tensile strength is an important evaluation index of the mechanical properties of welded joints. How to realize the real-time prediction of tensile strength of the friction stir welded joints to reflect the dynamic change of welding state is a problem in the field. To solve this problem, this paper presents a multi-scale one-dimensional convolutional neural network (Multi-scale 1D CNN) prediction model using time series data of temperature and axial force as inputs to realize the online prediction of tensile strength of welded joints. Firstly, FSW experiments are carried out to obtain time series data of temperature and axial force. Tensile strength values of the welded joints is obtained by tensile tests. The time series data and tensile strength values are fused as a dataset. Then Multi-scale 1D CNN, traditional 1D CNN and Multi-channel 1D CNN prediction models are established and trained with the dataset, respectively. Finally, by comparing the prediction performance of the three models, Multi-scale 1D CNN is proved to be more suitable for analyzing time series data to feedback the dynamic change of tensile strength of the joints during welding.
Introduction
AA2219 aluminum alloy has good weldability, high stress corrosion resistance and high specific strength. It is widely used in the field of aerospace, and its main processing method is welding. FSW is a mature solid-state welding method. The heat during FSW comes from the friction between the welding tool and the weldment and the plastic deformation of the metal material [1]. Compared with traditional fusion welding, FSW has lower heat input, which effectively solves the problems of large plate deformation, slow welding speed and low production efficiency during traditional welding of low melting point alloys such as aluminum alloy and magnesium alloy. The welded joint has the advantages of small grain size, small residual stress and good tensile strength. Therefore, FSW is the preferred technology for 2219 aluminum alloy welding. However, FSW is a multivariable coupling process. The wormholes, kissing bonds and defects caused by lack of penetration during the welding process affect the performance of the joint [2]. Surface defects can be found by visual inspection, while internal defects are usually tested by post-weld testing. Nondestructive testing methods for internal defects include X-ray and ultrasonic nondestructive testing. The destructive testing methods include tensile tests and metallography. Due to the high cost of welding, it is not recommended to evaluate the quality of the joint by destructive methods. In addition, the existing non-destructive testing methods are cumbersome and costly, so many scholars have explored methods to predict the tensile strength of FSW joints.
FSW process parameters include rotational speed, welding speed [3], tilt angle, dwell time, etc. Many scholars have explored the relationship between welding process parameters and mechanical properties of welded joints. Shettigar [4] developed an artificial neural network (ANN) model between welding process parameters and tensile strength of welded joints, and the maximum prediction error reached 4.9%. Shanavas [5] used the fuzzy logic model to predict friction stir welded joints tensile strength of AA 5052 H32 aluminum alloy, and the error was less than 4%. Shanavas [6] also developed a multi-layer feedforward neural network to predict the welded tensile strength of AA 5052-H32 aluminum alloy. The result shows that the prediction error of the constructed model is less than 5 %. Upender [7] established a machine learning model to predict the tensile strength of IS: 65032 aluminum alloy FSW joints. Kamal [8] established a tensile strength prediction model for AA2219 FSW. Shehabeldeen [9] established a tensile strength prediction model of AA6061-T6 aluminum alloy FSW joints based on random vector function chain neural network.
At present, the prediction of tensile strength based on welding process parameters is not accurate enough. On the one hand, under the condition of constant welding speed and rotational speed, the welding process is also affected by the change of the wear degree of tool and external interference. These factors have no specific change rules and have certain randomness, which cannot be used as the input of neural network. On the other hand, welding with the same process parameters does not necessarily reproduce the welding results [10]. Therefore, the prediction of tensile strength by welding process parameters cannot accurately reflect the dynamic change of tensile strength during welding.
In order to achieve real-time feedback of the tensile strength, it is necessary to determine the physical quantities that directly affect the post-welded performance and change in real-time. Many scholars have explored the direct influencing factors of tensile strength. Many scholars have explored the direct influencing factors of tensile strength. Xiao [11] studied the mechanical properties of 2024-7075 dissimilar alloy FSW joints under different heat inputs. The results show that too low heat input and poor material fluidity lead to poor mechanical properties of the joint. Yang [12] pointed out that the temperature distribution in the weld area during FSW ultimately affects the mechanical properties of joints. Abolusoro [13] measured the thermal cycle curves of the shoulder edge of 7075 and 6101 aluminum alloy under different tool rotational speeds using K-type thermocouples. It was found that the increase of heat input led to the decrease of grain bonding force and the tensile strength of the joints. Rose [14] found that the axial force had a significant effect on the formation of defects and tensile properties in the stirring zone during AZ61A magnesium alloy FSW. Ramachandran [15] studied the effect of axial force on the tensile strength of 3 mm thick AA5052-H32 aluminum alloy and HSLA steel FSW joints. It was found that with the increase of axial force, the welded tensile strength increased first and then decreased. Ramanmoorthi [16] found that the axial force greatly affected the mechanical properties of AA5086 and AA6063 aluminum alloys after FSW.
The above studies show that the tensile strength of FSW joints is directly affected by axial force and heat input during welding. Some scholars have done research on predicting tensile strength by axial force or heat input. Bipul [10] pointed out that the axial force signal could fully reflect the change of the welding process. The author established a FSW tensile strength prediction model based on support vector machine with welding process parameters and axial force signal as inputs. The result shows that real-time signal can better predict the welding quality. Yu [17] believed that rotational speed, welding speed and axial force were important process parameters affecting mechanical properties of FSW welded joints. Heidarzadeh [18] established a prediction model for predicting the tensile strength of pure copper FSW with axial force and welding process parameters as inputs. Based on ANN, Palanivel [19] established a prediction model with tool rotational speed, welding speed and axial force as inputs to predict the tensile strength of AA6351-T6 and AA5083H111 aluminum alloys FSW joints. Babu [20] used infrared thermal imager to record the surface temperature of the weldment during FSW, and established a prediction model to study the relationship between peak temperature and welding process parameters and the influence of the two on the quality of the joint. De [21] considered the influence of peak temperature on the joint performance of AA5754 H111 aluminum alloy during FSW, and used artificial neural network to predict the tensile strength of the joints.
The real-time signal during the welding process can reflect the welding state [10]. Although the existing research also uses the axial force or the temperature as the input of the prediction model to predict the tensile strength, most methods do not correlate the tensile strength with the real-time data of temperature and axial force. Therefore, the changes during FSW cannot be fed back in real-time. During FSW, when the tangential direction of the rotating tool is the same as the welding feed direction, this position is called the advancing side (AS). Conversely, if the two directions are opposite, this position is called the retreating side (RS). Considering the practical application of engineering, this paper uses infrared thermal imager to measure the temperature time series data at the AS and RS feature points by non-contact measurement to characterize the real-time heat input in the weld area during FSW. The axial force is measured by the force sensor. Three structural prediction models are established and trained, namely traditional 1D CNN, Multi-scale 1D CNN and Multi-channel 1D CNN. The inputs are the time series data, including the temperature at AS and RS feature points and the axial force during FSW process, and the output is the tensile strength of the joints. The tensile strength prediction model with better all-around performance is selected to predict the tensile strength of welded joints online.
Materials and methods
Traditional 1D CNN
1D CNN is suitable for analyzing sensor time series data, such as data from the force sensor or accelerometer. Therefore, in this paper, 1D CNN is used to extract the features of time series data, including the temperature at AS and RS feature points and axial force. The prediction process is shown in Fig. 1. Batch normalization(BN) [22] is used to accelerate the convergence rate of the network.
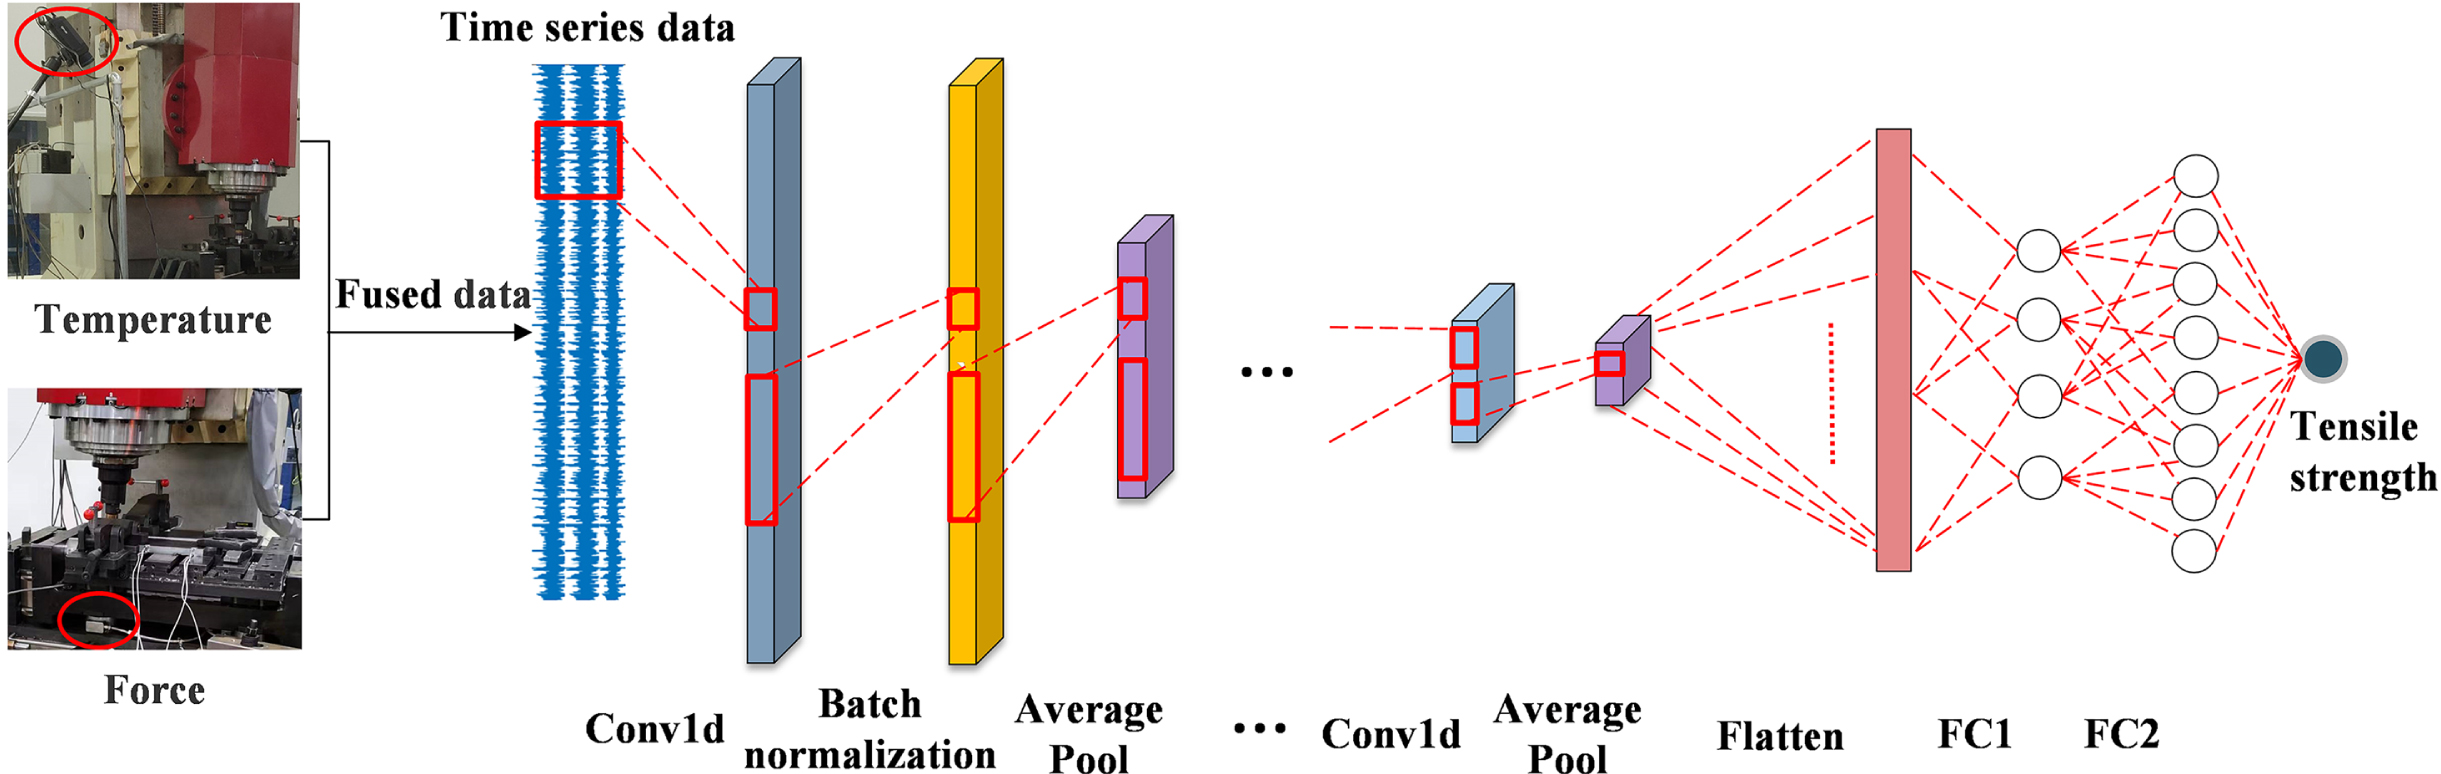
Prediction process of the welded joints tensile strength.
1D CNN consists of input layers, convolutional layers, pooling layers, fully connected layers, and output layers, the structure of traditional 1D CNN is shown in Fig. 2.

1D CNN structure.
① The function of the convolutional layer is the internal operation of multiplying the input samples and the convolution kernel. The convolutional layer performs convolution operations on the input samples to generate a feature map or vector. The layer formula is as Equation (1):
Where
② The pooling layer’s purpose is to minimize the size of the feature vector or feature map produced by the convolutional layer. Maximum pooling, average pooling, and Lp pooling are the three categories of the pooling method. Maximum pooling refers to choosing the feature area’s maximum value as a new feature, average pooling refers to selecting the feature area’s average value as a new feature, and Lp pooling refers to computing a new feature map by emphasizing the feature area’s central value. The maximum pooling method’s calculating formula is written as Equation (2):
Where
③ The output of the convolutional layer or the pooling layer serves as the input of the fully connected layer (FC), which summarizes the data features to create an entire feature vector.
④ The output layer’s function is to give each character weight to produce one or more output categories.
Multi-channel 1D CNN can extract the features of each dimension of multi-dimensional data, and the fusion layer splices the features extracted from each channel, and finally establishes the input-output relationship to achieve prediction. The axial force and temperature data during FSW process are collected by different sensors. Each group of time series data is input into the corresponding channel of the multi-channel 1D CNN. According to the channel data characteristics, the network structure of each channel can be adjusted respectively to better extract the sequence data features. The structure of Multi-channel 1D CNN is shown in Fig. 3.
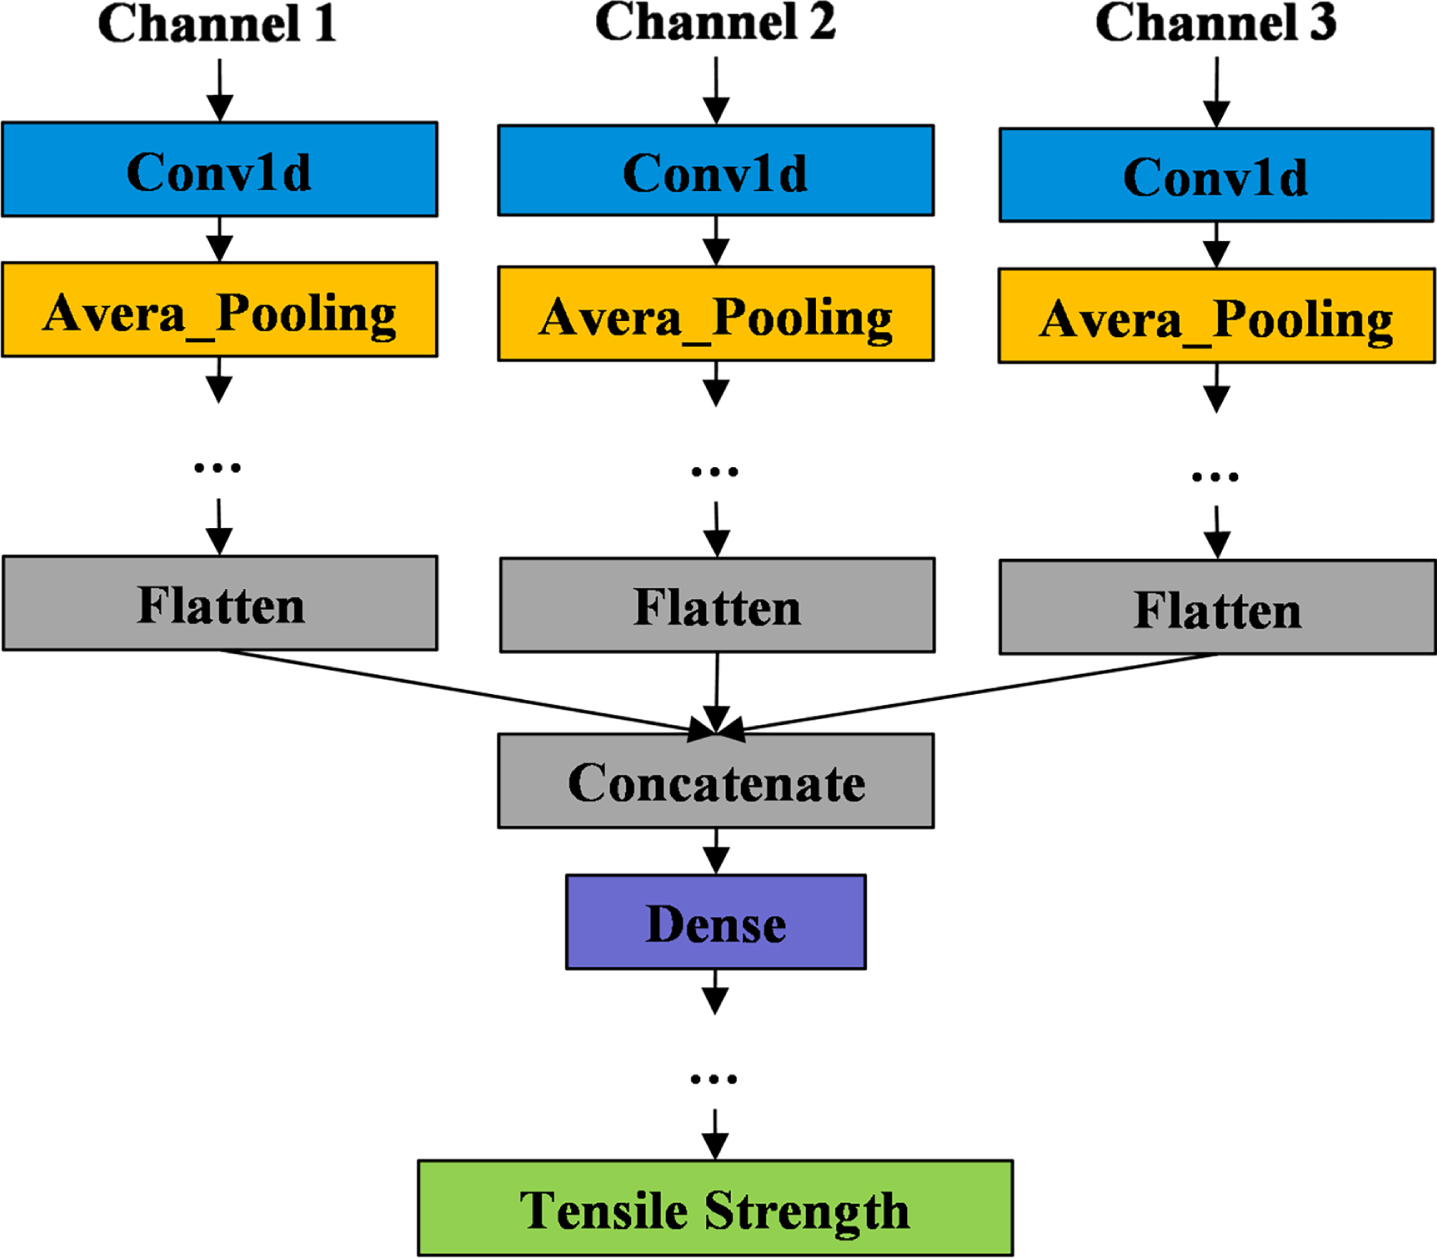
Multi-channel 1D CNN structure.
Multi-scale 1D CNN has multi-size convolution kernels which can extract sequence data features of different fineness. The larger convolution kernel obtains a larger receptive field and can learn longer time range information. The smaller the scale of the convolution kernel, the finer the extracted features. For the temperature and axial force time series data during FSW, the large-size convolution kernel can extract the heat accumulation effect information in the welding area. The small-size convolution kernel can extract the mutation characteristics of temperature and axial force during welding. The structure of Multi-scale 1D CNN is shown in Fig. 4.
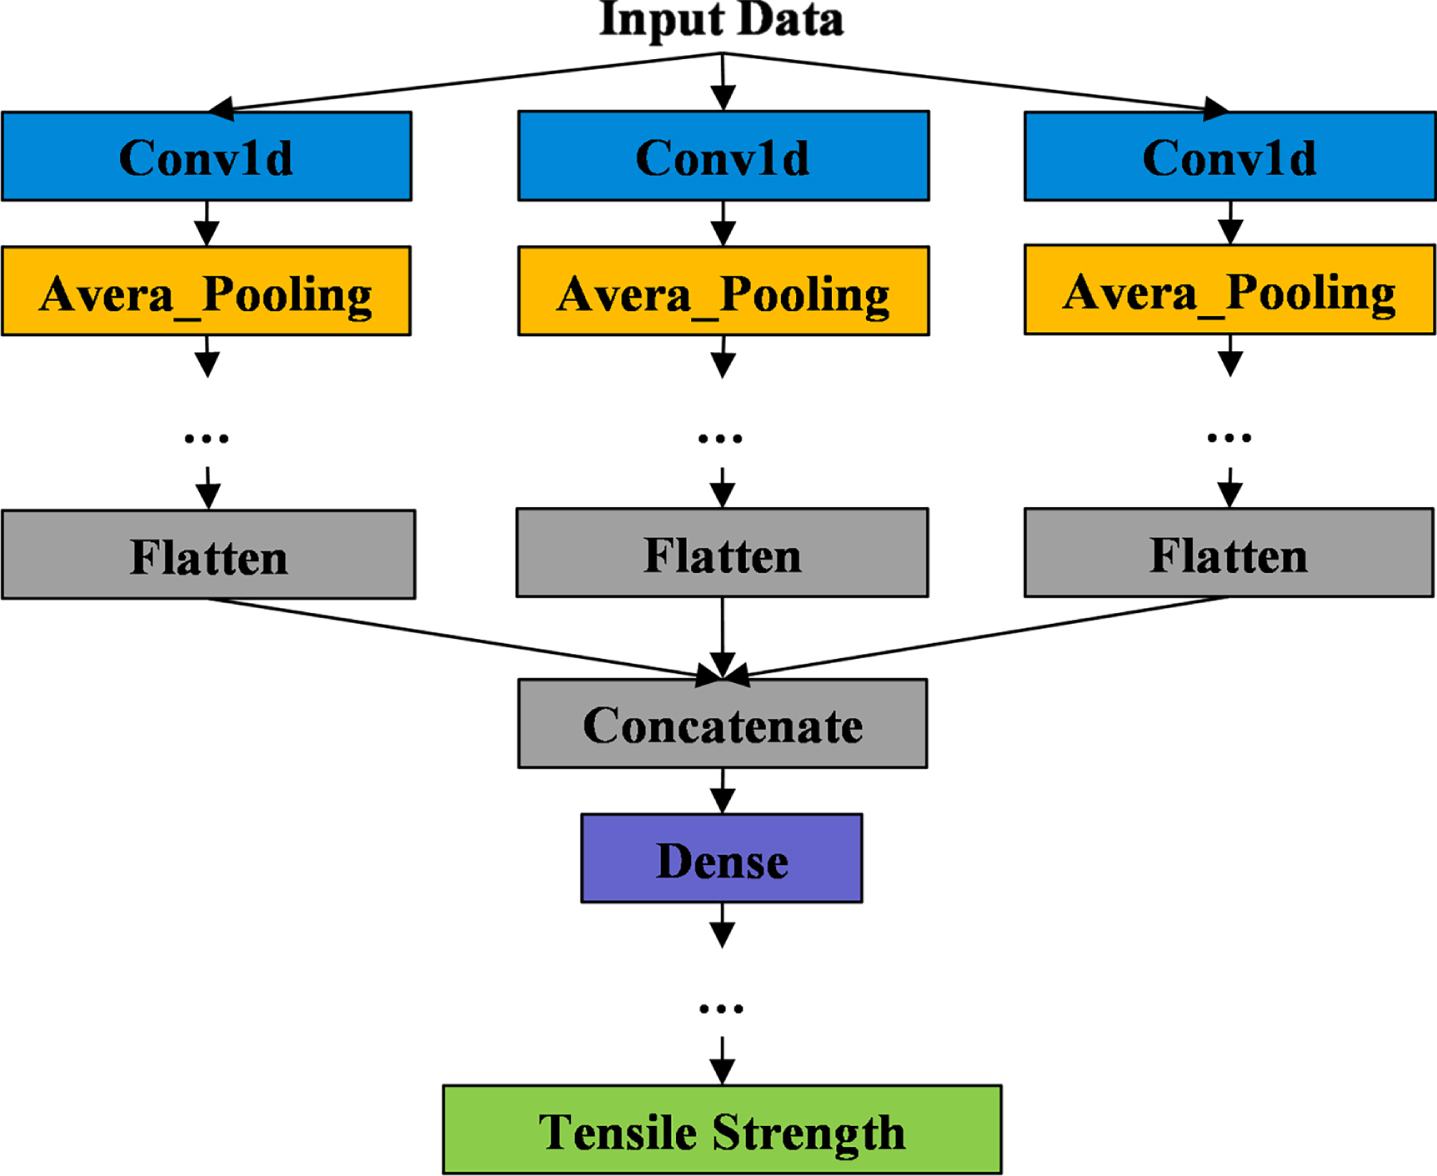
Multi-scale 1D CNN structure.
FSW experiment and data acquisition
The FSW experiment is carried out on the FSW-5M type FSW machine of Shanghai Top Numerical Control Technology Co., Ltd. The weldment material is 2219-T8 aluminum alloy. Table 1 shows chemical compositions of 2219-T8 aluminum alloy. Experimental site is shown in Fig. 5. Table 2 shows welding process parameters of this experiment. All-factor welding experiments are carried out in the range of rotational speed of 300-450 r/min and welding speed of 75-125 mm/min [23]. Different welding process parameter combinations produce corresponding welding temperature and axial force signals to explore the influence of different welding temperature and axial force signals on tensile strength. During FSW, press amount is constant. The axial force is acquired by the C2 series force sensor of the German HBM company. FLIRA615 infrared thermal imager is employed to collect the temperature at AS and RS feature points. The position of the feature points is shown in Fig. 6(a). The tool used in the experiment is shown in Fig. 6(b). The shoulder diameter of the tool is 32 mm, the needle length is 17.8 mm, the root radius of the needle is 7.5 mm, and the end radius is 3.75 mm. The tool has a leftward screw thread, and the inclination angle of the tool is 2.5°. Welding process parameters of the experiment are shown in Fig. 6(c).
Chemical compositions of 2219-T8 aluminum alloy
Chemical compositions of 2219-T8 aluminum alloy
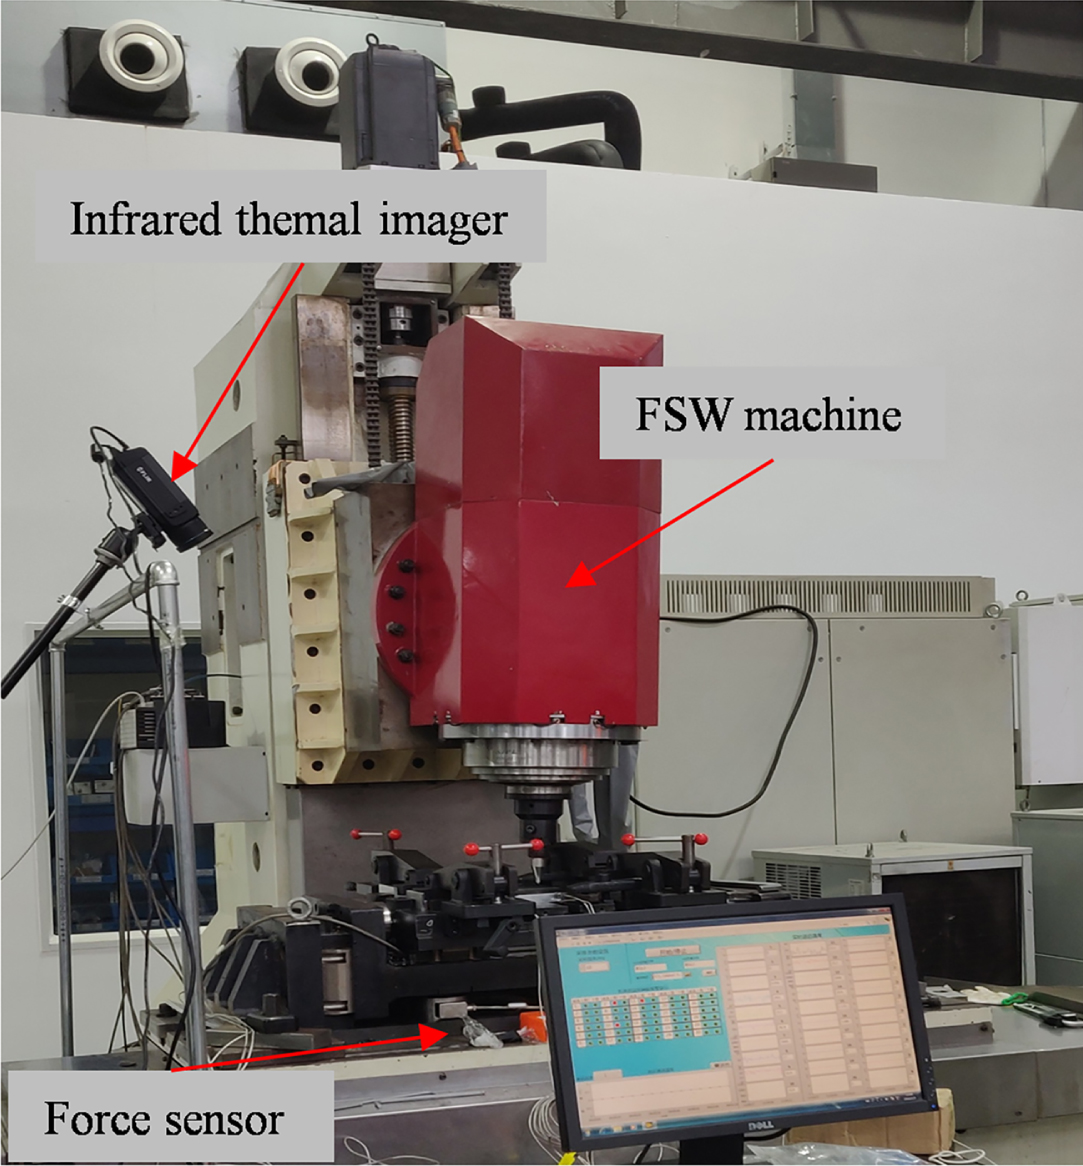
Experimental site.
Welding process parameters

Welding experiment.
The size of the weldment is 400 mm×240 mm×18 mm, the surface of the weldment is coated with layers to improve the temperature measurement accuracy. Figure 7(a) shows the FSW joint. Figure 7(b) shows the cutting scheme. The sample size is chosen in accordance with “GB/T228.1-2021 National Standard of the People’s Republic of China Metal Materials Room Temperature Tensile Test Method”. Figure 7(c) illustrates the size of the sample. The tensile strength values of joints are measured on the Instron tensile testing machine.
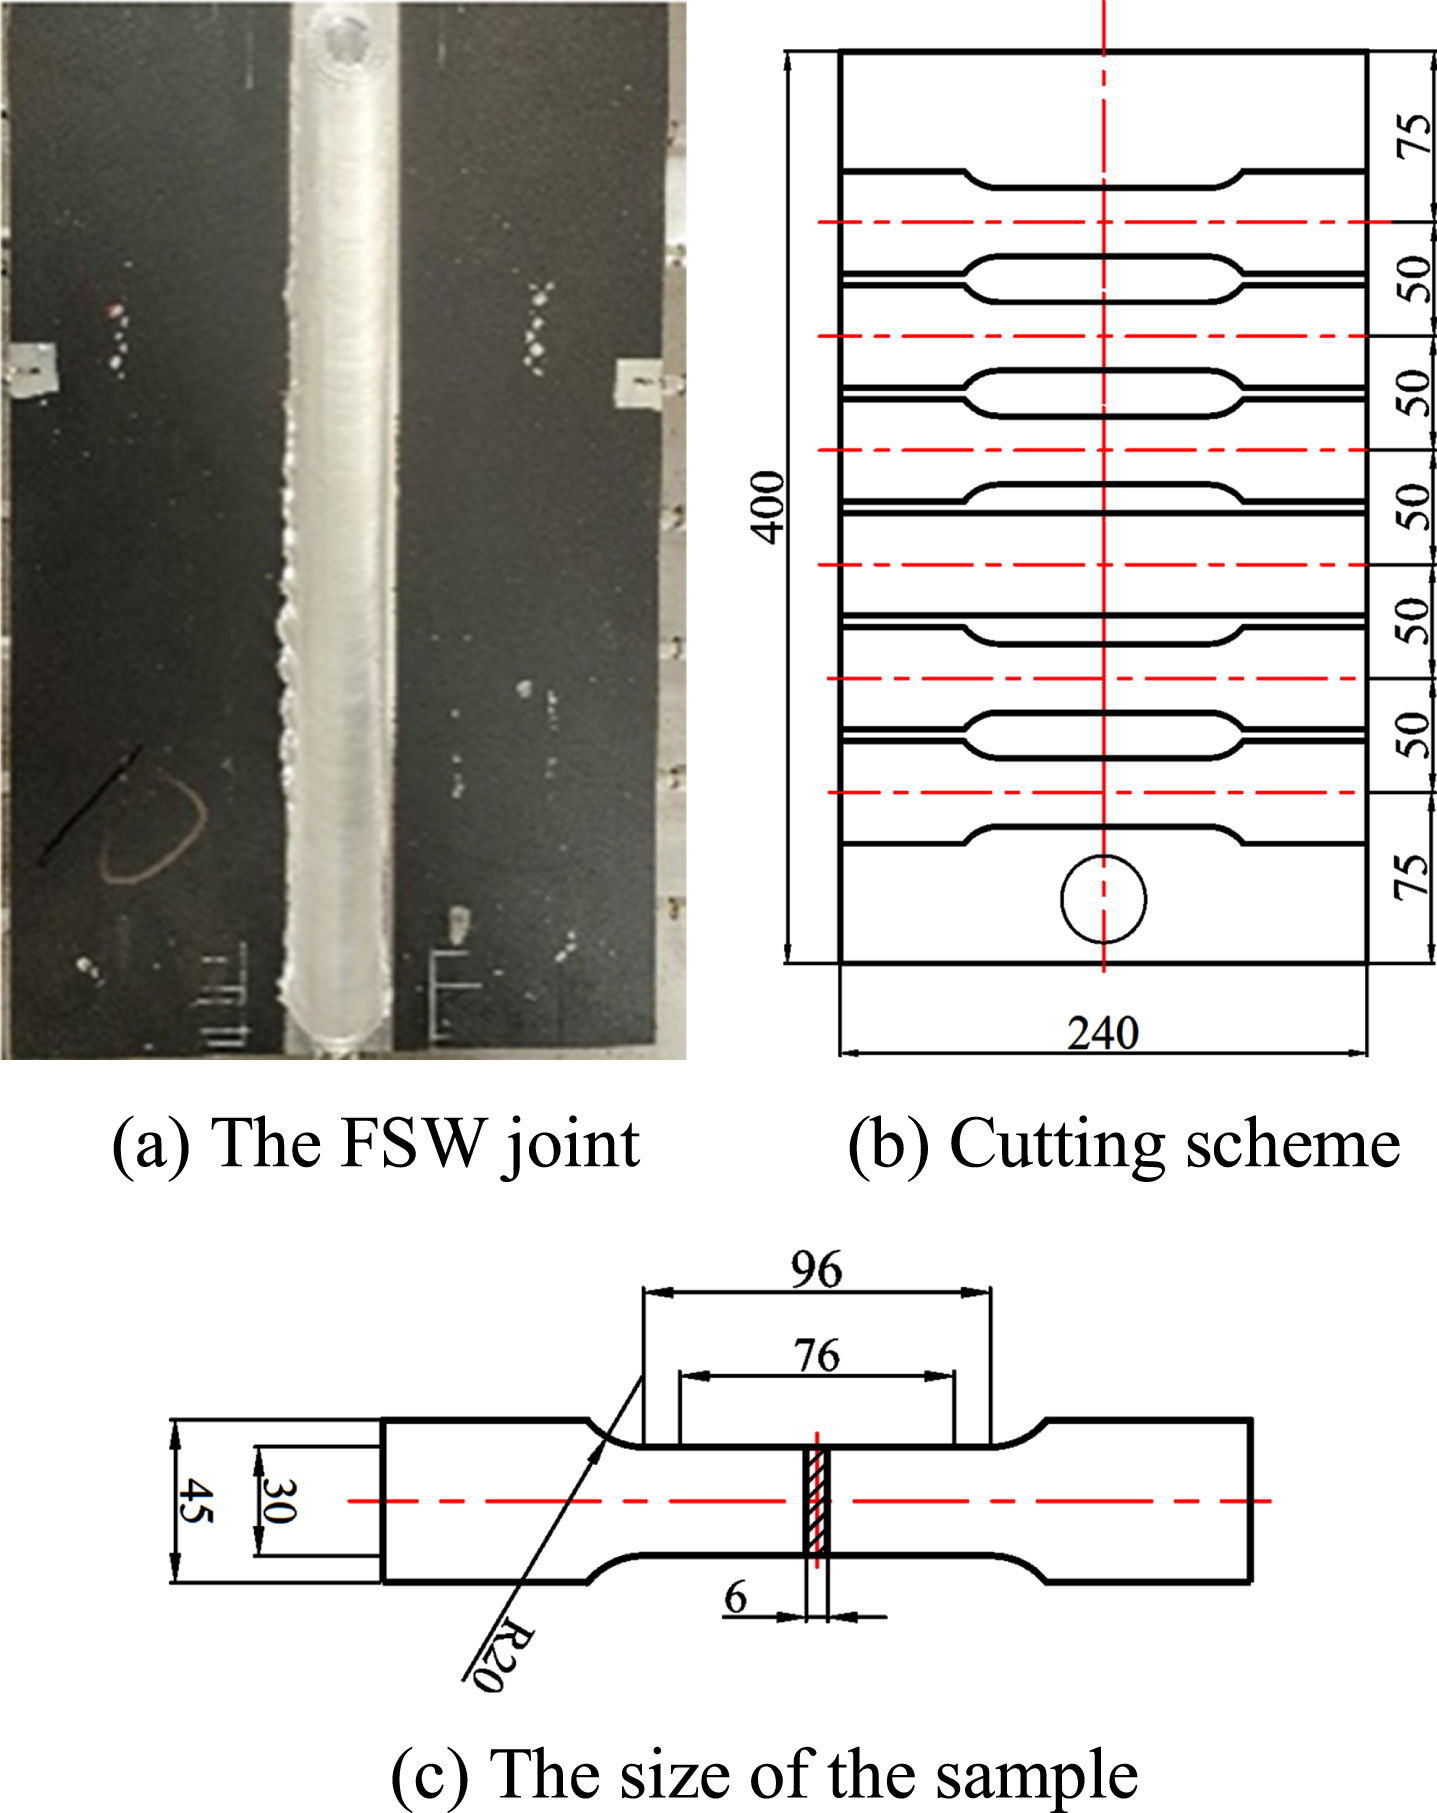
Preparation process of tensile sample.
The force sensor and infrared thermal imager have different sampling frequencies. To realize tensile strength prediction of welded joints, it is indispensable to fuse the multi-source data, including axial force, the temperature at AS and RS feature points, and the tensile strength of the joints. Resampling function in Python is used to process temperature and axial force time series data to complete time synchronization. The unified sampling frequency is 2 HZ. These data are grouped according to the interception positions of the tensile samples, corresponding to the data of tensile strength. The invalid data is deleted and the dataset is completed. The dataset contains 50 samples. Each sample includes three categories of data of the temperature at AS and RS feature points and axial force. Each category consists of a 15-second time series data. Table 3 displays a sample of the fused dataset.
A sample of the fused dataset
A sample of the fused dataset
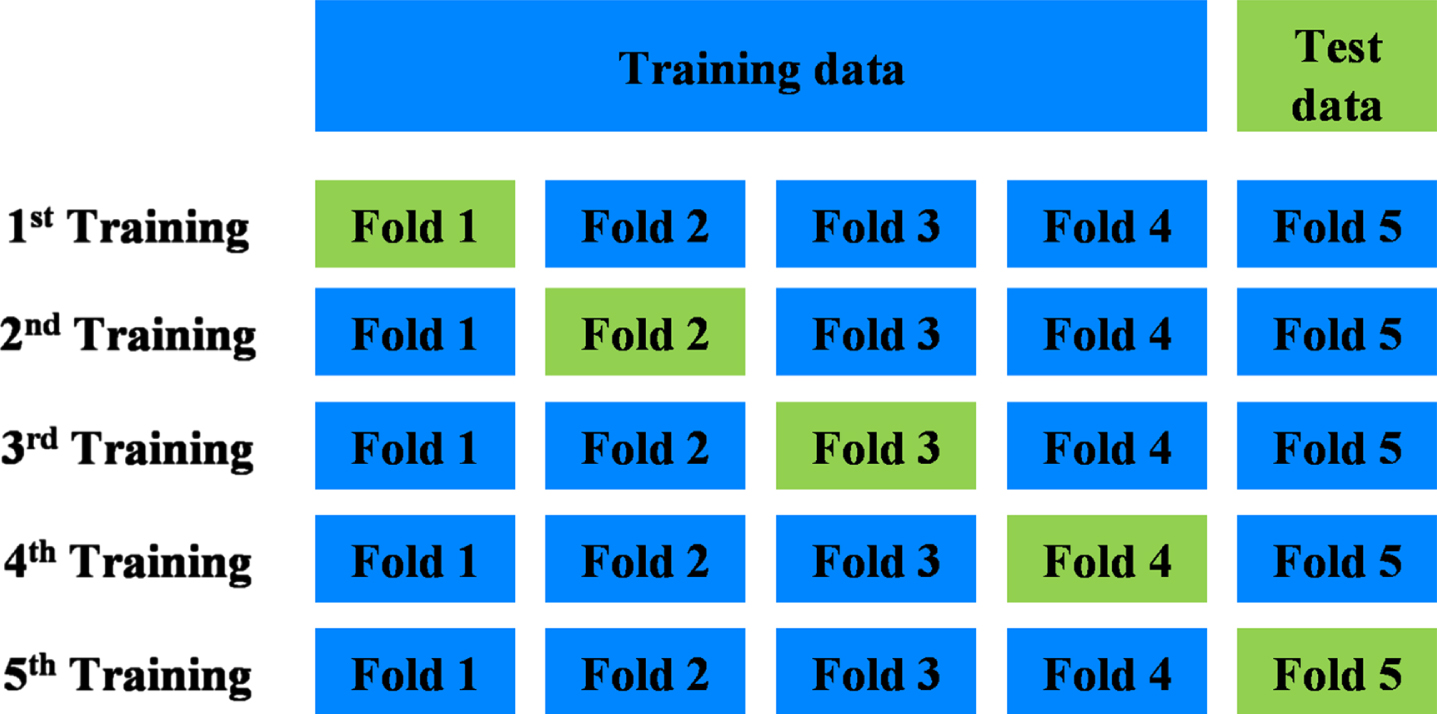
The K-fold cross-validation is used to divide the dataset. In this paper, the K value is 5. The 5-fold cross-validation divides the 50 samples in the dataset into five subsets and trains the model five times. For each time of model training, four subsets are chosen as training data, while the remaining subsets are used as test data, as shown in Fig. 8. In the case of the limited dataset, 5-fold cross-validation reduces bias, improves the generalization ability of the model, and avoids overfitting.
5-fold cross-validation.
The 1D CNN prediction model created in this paper uses the time series data of the axial force and the temperature as inputs, and the tensile strength as output. The following are some criteria for building models: Convolutional layer’s sizes and numbers of convolution kernels; Kinds of activation function; The network’s layer structure (numbers of convolutional layers, numbers of fully connected layers, etc.); Dropout coefficient.
The following are some model training parameters:
① Batch size; ② Learning rate; ③ Iterations.
Presetting the parameters above, Multi-scale 1D CNN, Multi-channel 1D CNN, and traditional 1D CNN tensile strength prediction models are built. Input and output data are normalized in the dataset. The normalized dataset is used to train models. The Huber robust loss function is used as the objective function. The Huber loss curve’s convergence and the model’s predictive capability are used to determine the best parameters of the model. When optimizing the parameters, the numbers of convolution kernels and the types of activation functions are primarily adjusted. Then adjust additional parameters, such as learning rate. The prediction errors of the models under each group of parameters are compared. Finally, the prediction models with the smallest prediction error of the three structural networks are saved, respectively.
Results and discussion
After parameters optimization, Fig. 9 shows the convergent training loss curves of the three prediction models’ five-fold cross-validation. It is clear from the comparison of the five training loss curves that Multi-scale 1D CNN and 1D CNN have faster convergence speeds than Multi-channel 1D CNN. In addition to the 5th training, Multi-scale 1D CNN has more significant loss curves convergence on the other four validation sets than Multi-channel 1D CNN and 1D CNN.
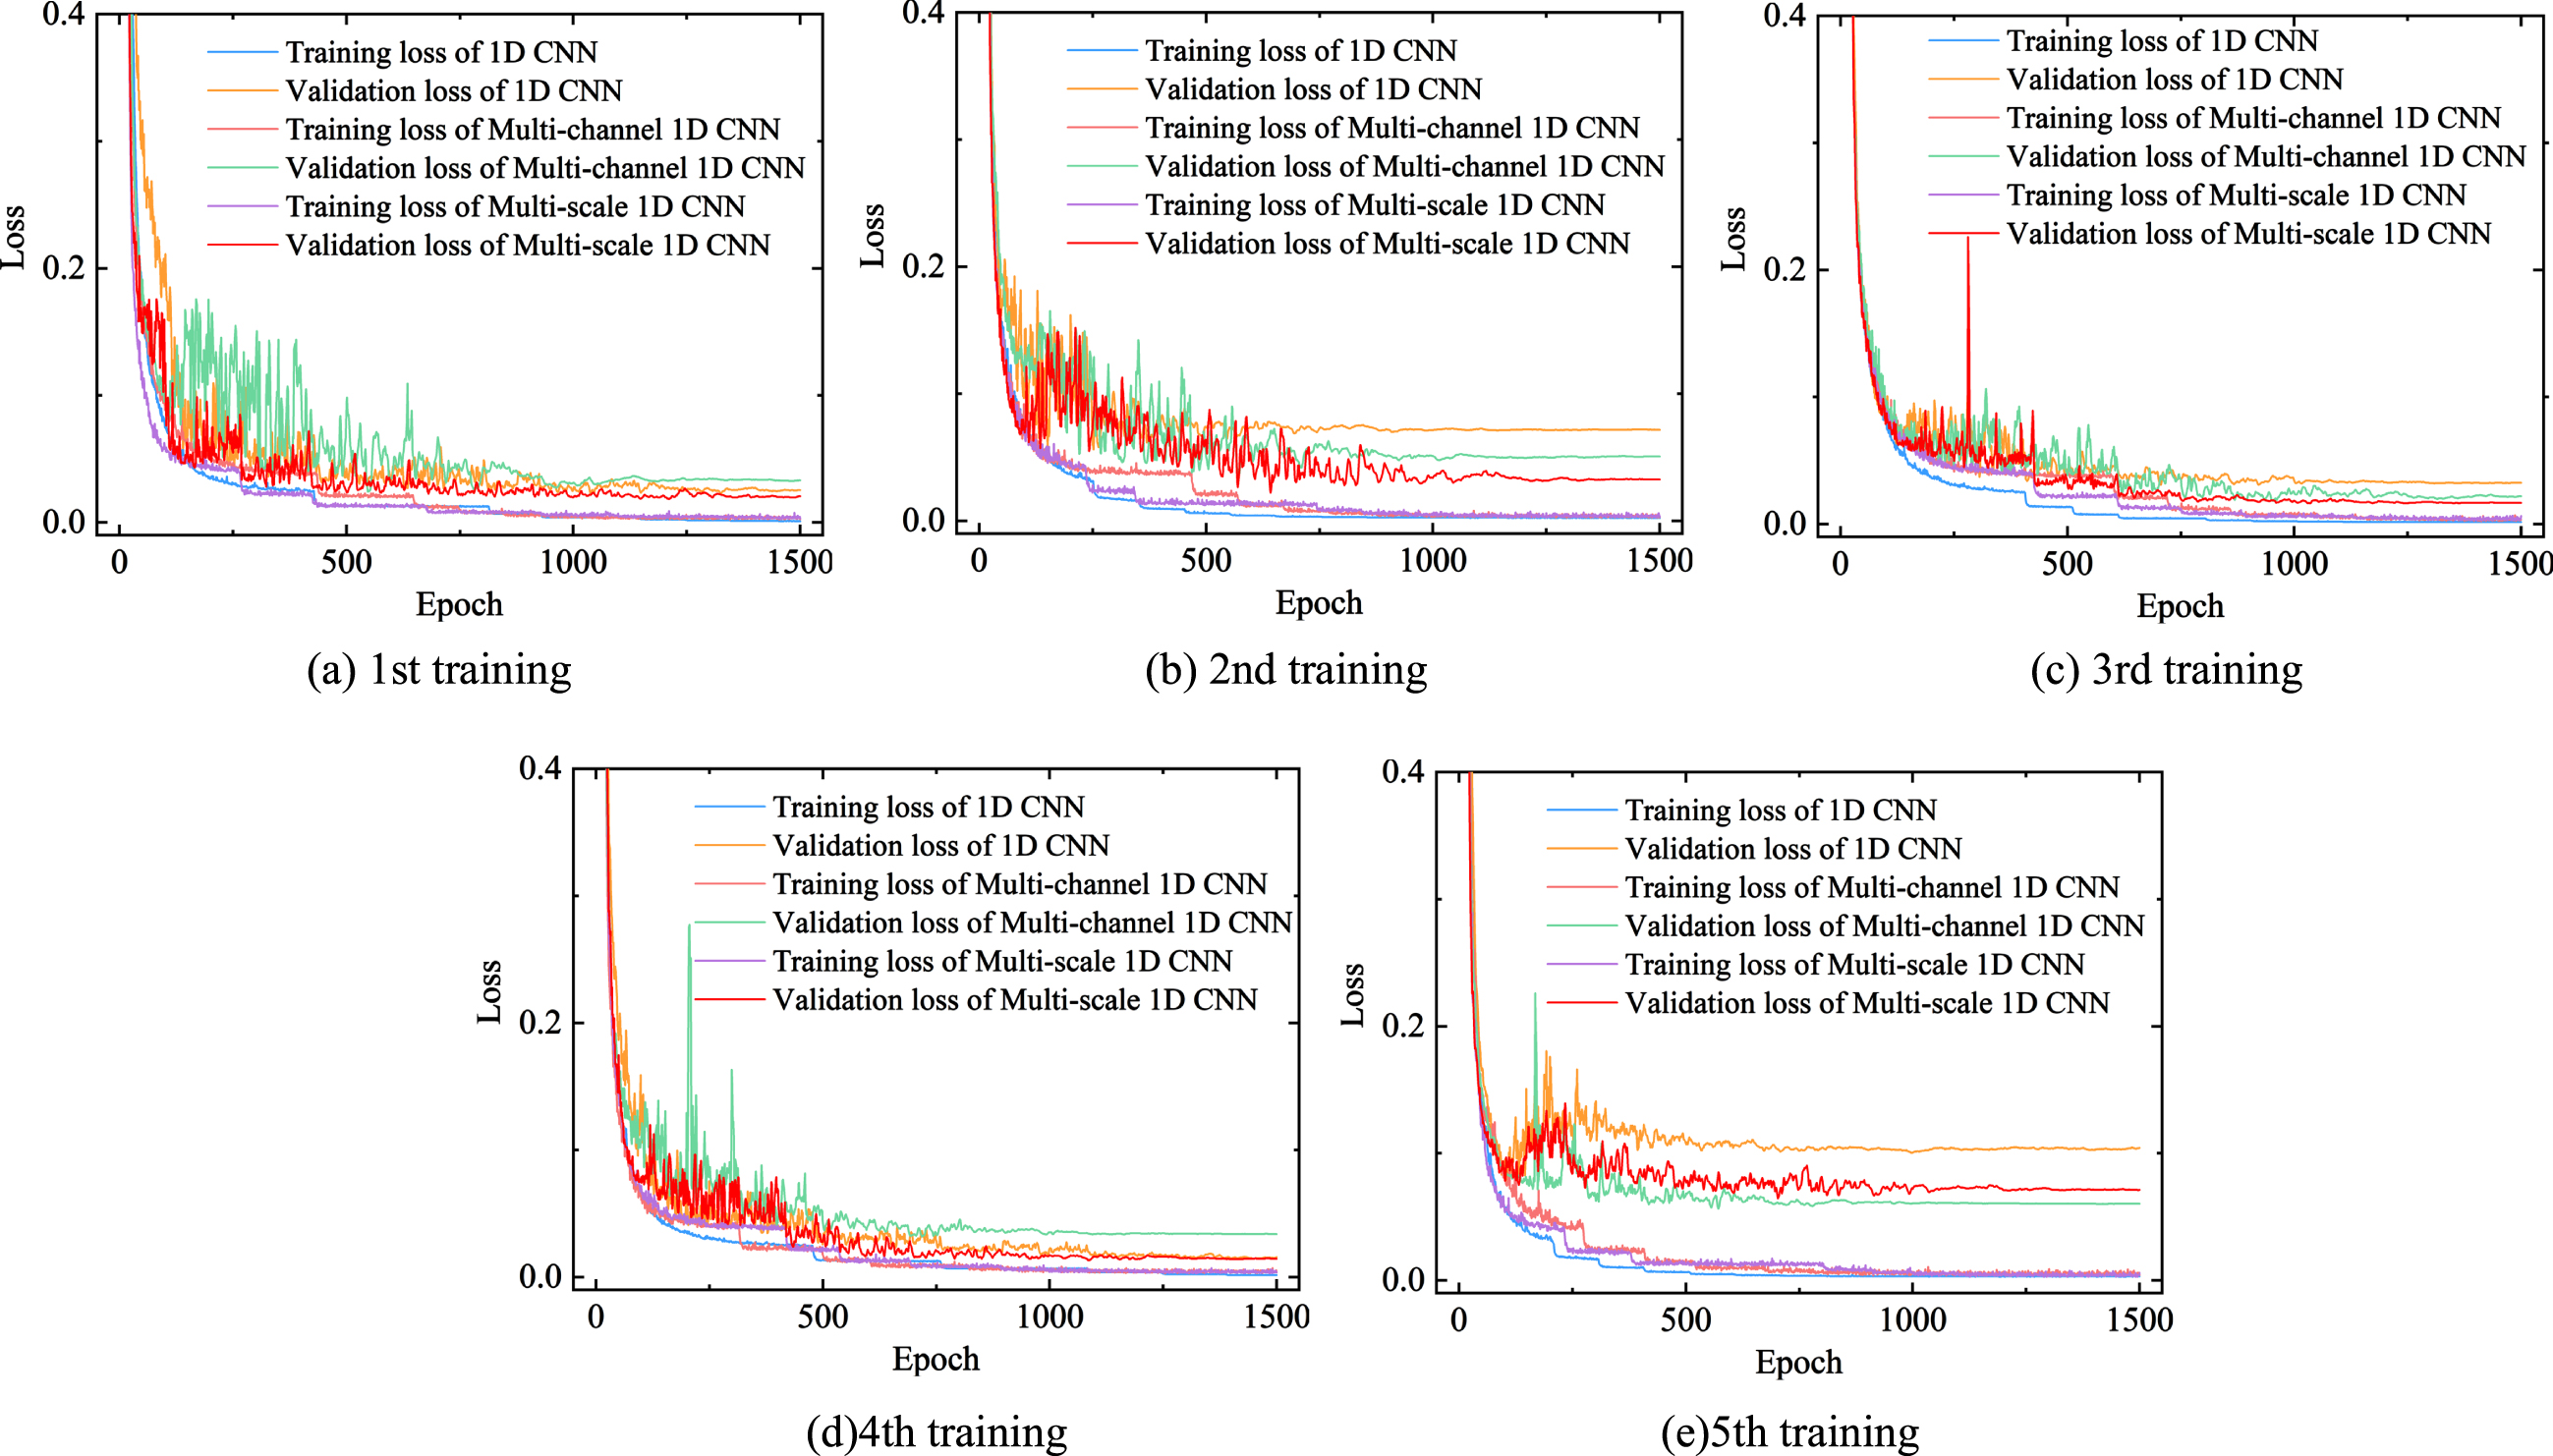
Five-fold cross-validation training loss curves.
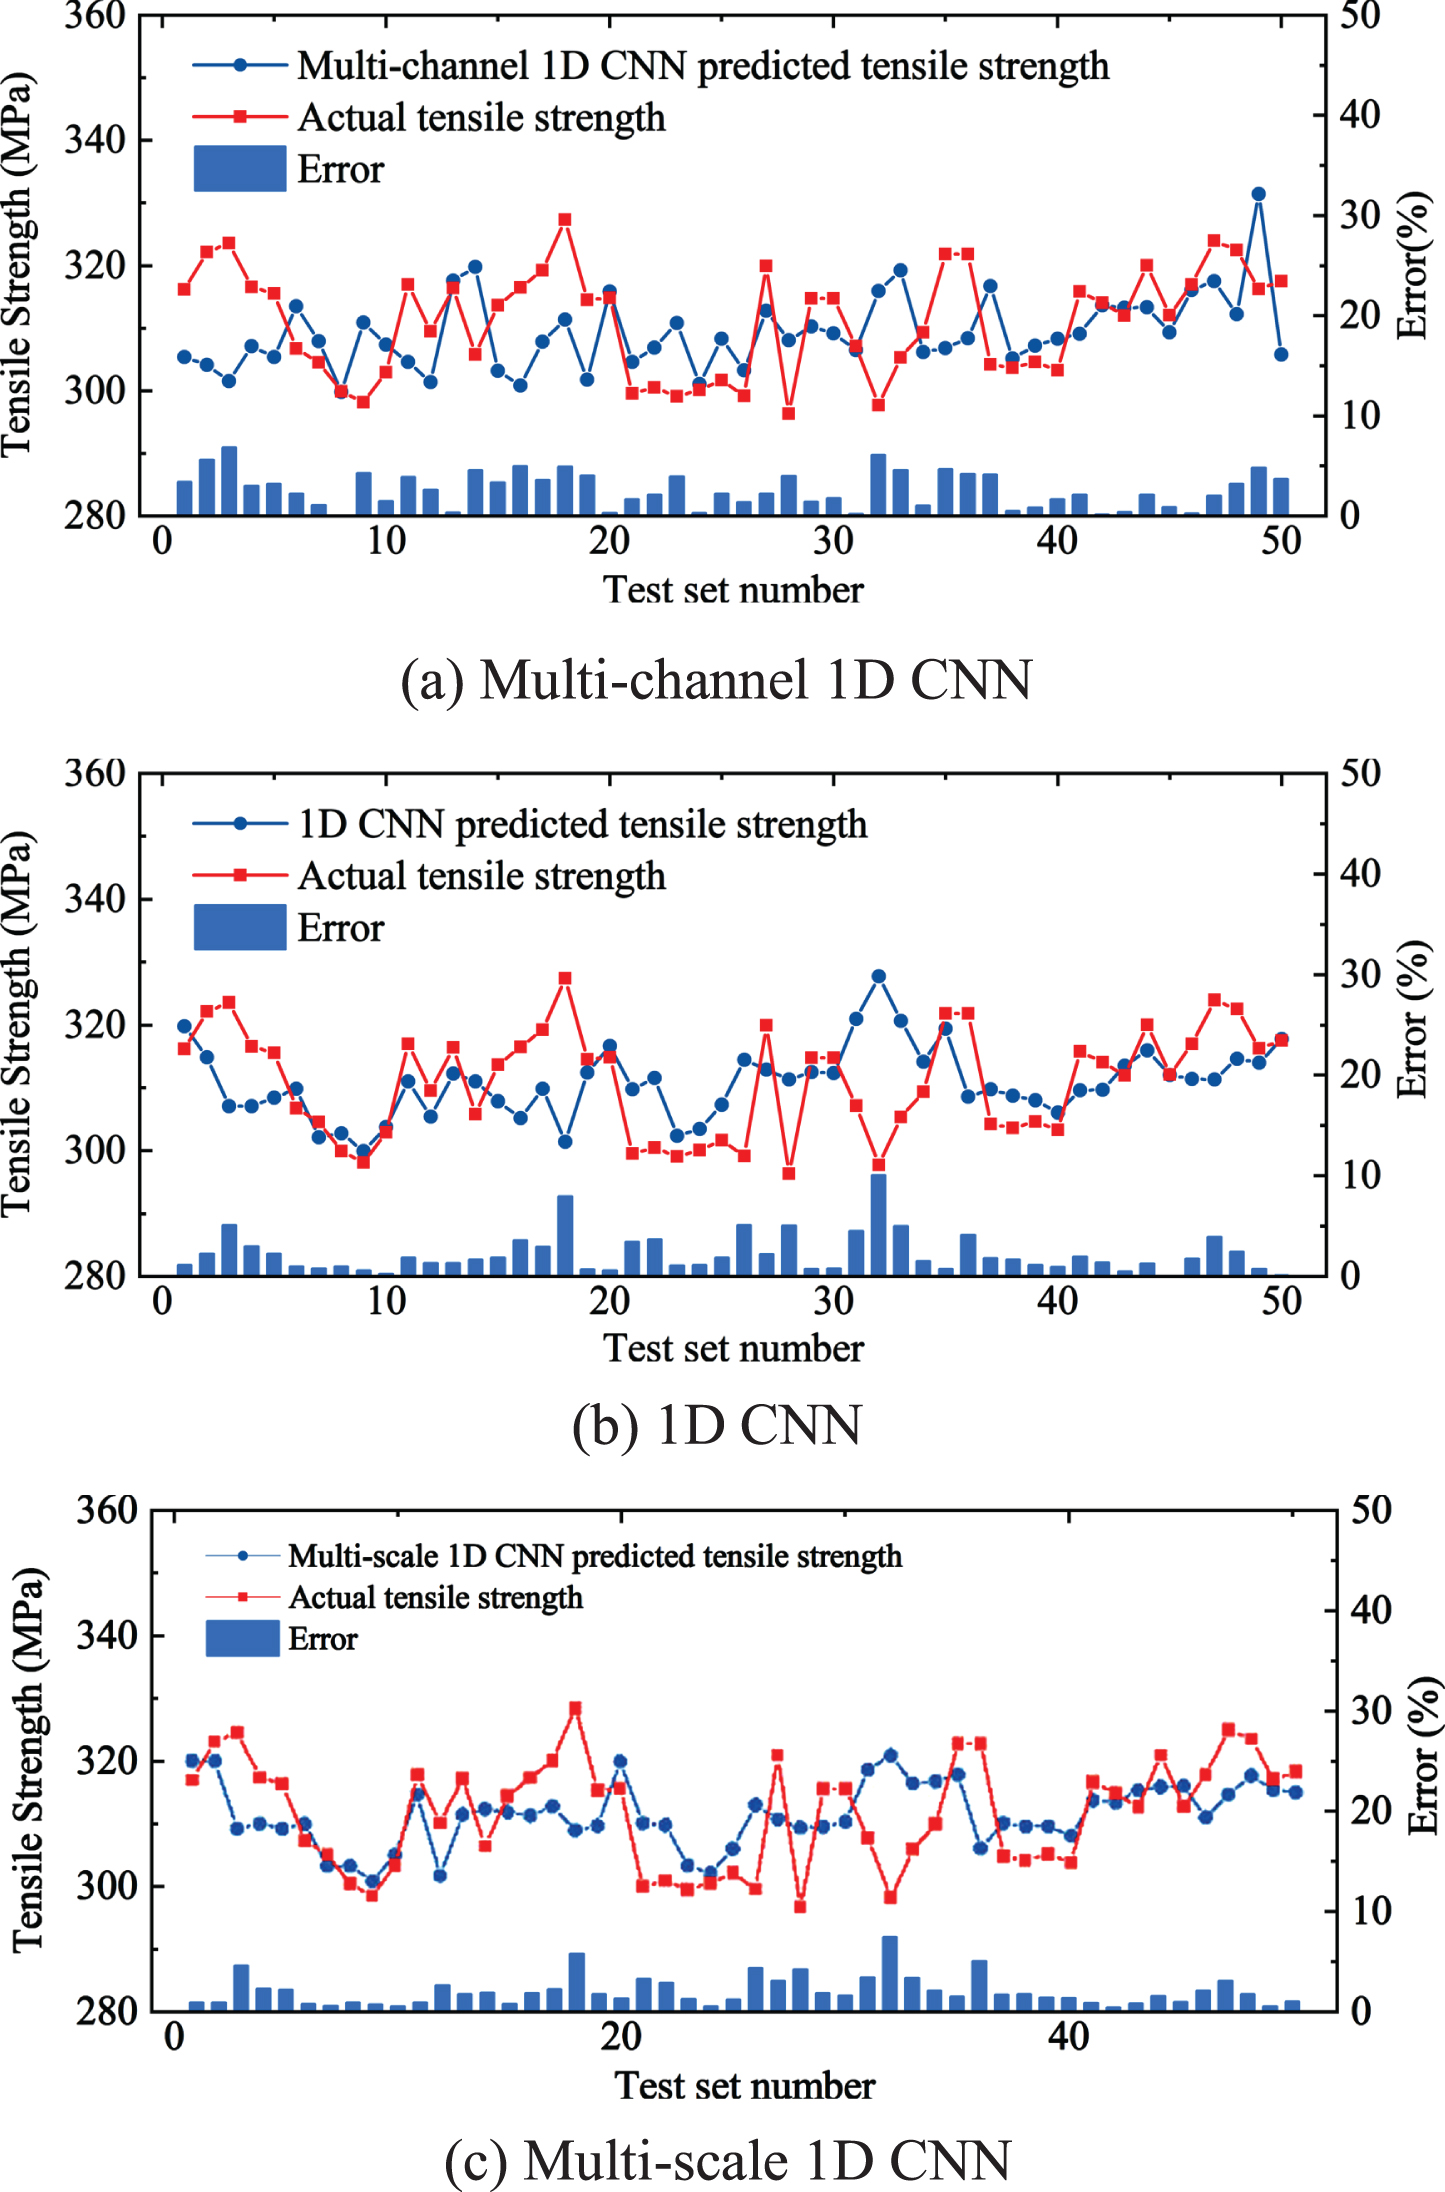
Each prediction model generates 50 sets of tensile strength prediction values and relative errors after being trained five times, as shown in Fig. 10. The relative error comparison of the three networks is shown in Fig. 11. Table 4 lists the evaluation metrics. Compared with the other two networks, the MAPE, RMSE, and MAE of Multi-scale 1D CNN are 2.05%, 7.849, and 6.378, respectively, which are more excellent. Additionally, the model’s capacity for generalization is better. Due to its superior overall performance, Multi-scale 1D CNN is selected as the tensile strength prediction model, and its construction is shown in Fig. 12.
Test set prediction results.

The relative errors of the prediction models.
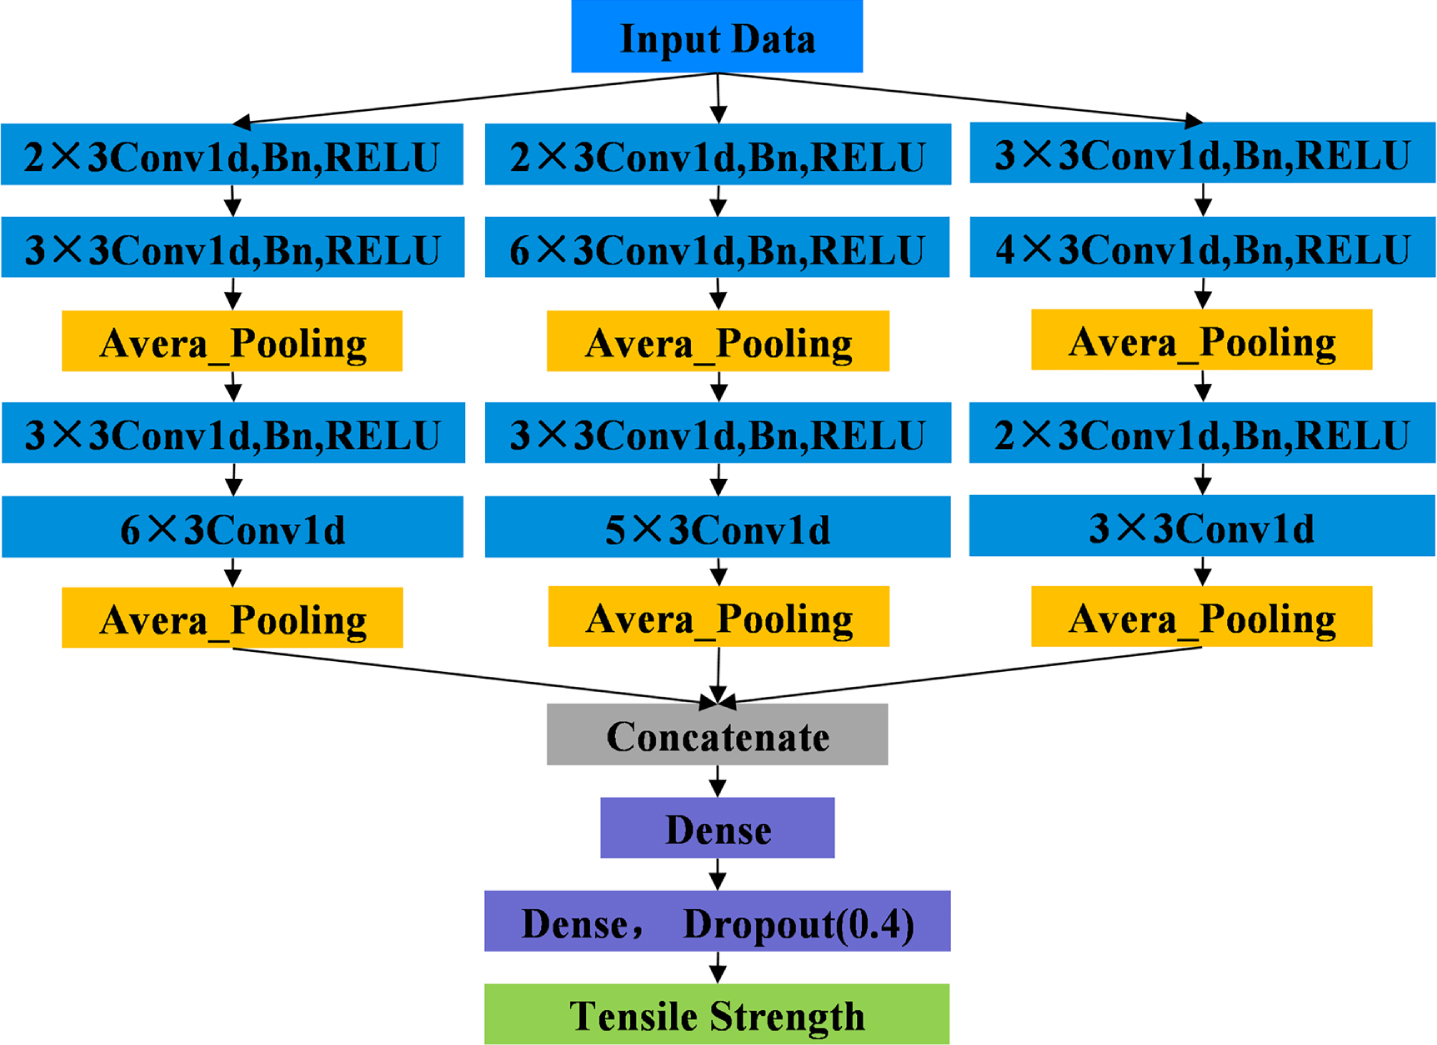
Multi-scale 1D CNN structure.
Performance of 1D CNN models with different structures
This paper focuses on the online prediction of the tensile strength of FSW joints, and explores the physical quantities and prediction models that can be used for tensile strength online prediction, so as to timely feedback the dynamic changes of the welding state. 1D CNN, Multi-channel 1D CNN, and Multi-scale 1D CNN prediction models are created. Models are trained and optimized with the dataset of axial force, temperature and tensile strength. Compared with the other two networks, the MAPE, RMSE, and MAE of Multi-scale 1D CNN are 2.05%, 7.849, and 6.378, respectively, which are more excellent. Therefore, Multi-scale 1D CNN can be used to extract the features of the temperature at AS and RS feature points and axial force time series data to predict the tensile strength of welded joints. The research results verify the feasibility of predicting tensile strength by using time series data of axial force and welding temperature, which lays a foundation for online predicting and monitoring of FSW.
Footnotes
Acknowledgments
The research was supported by the National Key Research and Development Program of China (Grant No. 2019YFA0709003) and Natural Science Foundation of Liaoning Province of China (2023-MS-101). The financial contributions are gratefully acknowledged.