Different preferences of the indicators would be showed in some situations. However, the preferences are not considered into the traditional possibility functions, which are always assumed to be the linear functions. It might not be proper to analyze all kinds of indicators with the traditional possibility functions. Therefore, the universal possibility functions are provided. Due to the multiple uncertain features of the indicators, then the universal possibility functions are extended for the generalized grey numbers. According to the importance of indicators and the time, the weights of indicators and the time are given respectively. Next, generalized grey dynamic clustering models with preferences are proposed. At last, the effectiveness of the suggested methods is verified via the case illustration and comparative analysis.
In the economics and management, most of the objects need to be evaluated during a period of time rather than at a certain moment. Therefore, the dynamic evaluations are always considered. Different from the static evaluations, the ‘time’ is one of the most important factors in the dynamic evaluations. The evaluated results are obtained via analyzing the objects and the indicators at different time. For example, Li et al. [1] proposed the dynamic evaluation method on dissemination capability of microblog users based on topic segmentation. Wang et al. [2] investigated the time-sensitive markdown strategies for perishable products based on dynamic quality evaluation. Tsai & Lin [3] considered dynamic analysis and reliability evaluation for an eccentric speed reducer based on fem. Wu et al. [4] used the DEA(Data Envelopment Analysis) window analysis for efficiency evaluation and dynamic evolution of China’s regional green economy. Xu et al. [5] formulated a dynamic multi-dimension trust model for information service quality evaluation. Zhang et al. [6] adopted dynamic two-stage DEA approach to evaluate the efficiency of Chinese regional industrial systems. Alizadeh et al. [7] developed a dynamic network-based data envelopment analysis approach for performance evaluation of complex electricity generation systems.
When the enough data cannot be obtained, then the grey methods are always considered in the dynamic evaluations. Jiang [8] proposed the dynamic grey target evaluation method with multiple reference points for new R&D (Research and Experimental development) institution performance. Li et al. [9] developed the dynamic Hierarchy-Grey relation analysis for real-time warning and risk assessment of tailings dam disaster status. Zhang et al. [10] formulated the dynamic comprehensive evaluation model of multi-source uncertain indexes based on the generalized grey incentive factors. Yang et al. [11] provided the condition assessment method of transformers based on optimal weight and dynamic grey target with interval grey number. Yu et al. [12] used a novel grey dynamic double incentive decision-making model to evaluated High-Quality development of manufacturing industry. To the best of knowledge, most of the grey dynamic evaluation methods extend the grey correlation analysis models. However, it is difficult to determine the resolution coefficient which affects the effectiveness and accuracy of the results. As another evaluation model of grey methods, the grey clustering model with possibility functions has more advantages comparing to the grey correlation analysis model [13]. Hence, the grey clustering model with possibility functions would be considered in this paper.
For the indicators of objects, some scholars found that the observed values always have the multiple uncertain features due to the types of indicators and data sources. Yang & John [14] proved that the multiple numbers, such as the grey numbers, fuzzy numbers, random numbers, can be interchangeable under the certain situations. Then, Zhang et al. [15] firstly proposed the concept of generalized grey numbers for multiple uncertain data. Based on the generalized grey numbers, Zhang developed respectively the clustering model of generalized grey entropy weight [16] and weight allocation model [17]. Cai et al. [18] formulated the generalized grey target model based on the principal component weight. Shao et al. [19] investigated the reliability function and convergence of Weibull distribution with multiple uncertain data. To the best of our knowledge, besides the multiple uncertain features, different preferences of the indicators would be showed in some situations. For example, the decision-makers have strict preferences about the quality indicator of an aircraft but relaxed preferences about the appearance of an equipment. However, the possibility functions are always assumed to be the linear functions by most of the scholars. The preferences of the indicators cannot be presented effectively.
The motivation of this paper mainly comes from the literature [15], where the clustering models with generalized possibility functions have been provided for the evaluation of the uncertain data. However, the indicators varying with the time have not been considered. Therefore, we investigate the generalized grey dynamic clustering models with preferences. Firstly, the preferences of indicators are considered into traditional possibility functions and the universal possibility functions are provided. Then, due to the multiple uncertain features of indicators, the universal possibility functions are extended for the generalized grey numbers. According to the importance of indicators and time, the weights of the indicators and time are given. Based on the above factors, the generalized grey dynamic clustering models with preferences are formulated. At last, the suggested models are illustrated via the evaluations of C919 suppliers.
The outline of this paper is as follows: Section 2 provides the generalized universal possibility functions. Section 3 formulates the clustering models. Section 4 illustrates the provided models in evaluating the suppliers of the C919 and demonstrates the effectiveness of derived methods. Section 5 presents the conclusions and future work.
Generalized universal possibility functions
The preferences of decision-makers are not considered into the traditional possibility functions, which are always assumed as the linear functions. Hence, we consider the possibility functions are continuous curve functions and propose the universal possibility functions for the grey numbers.
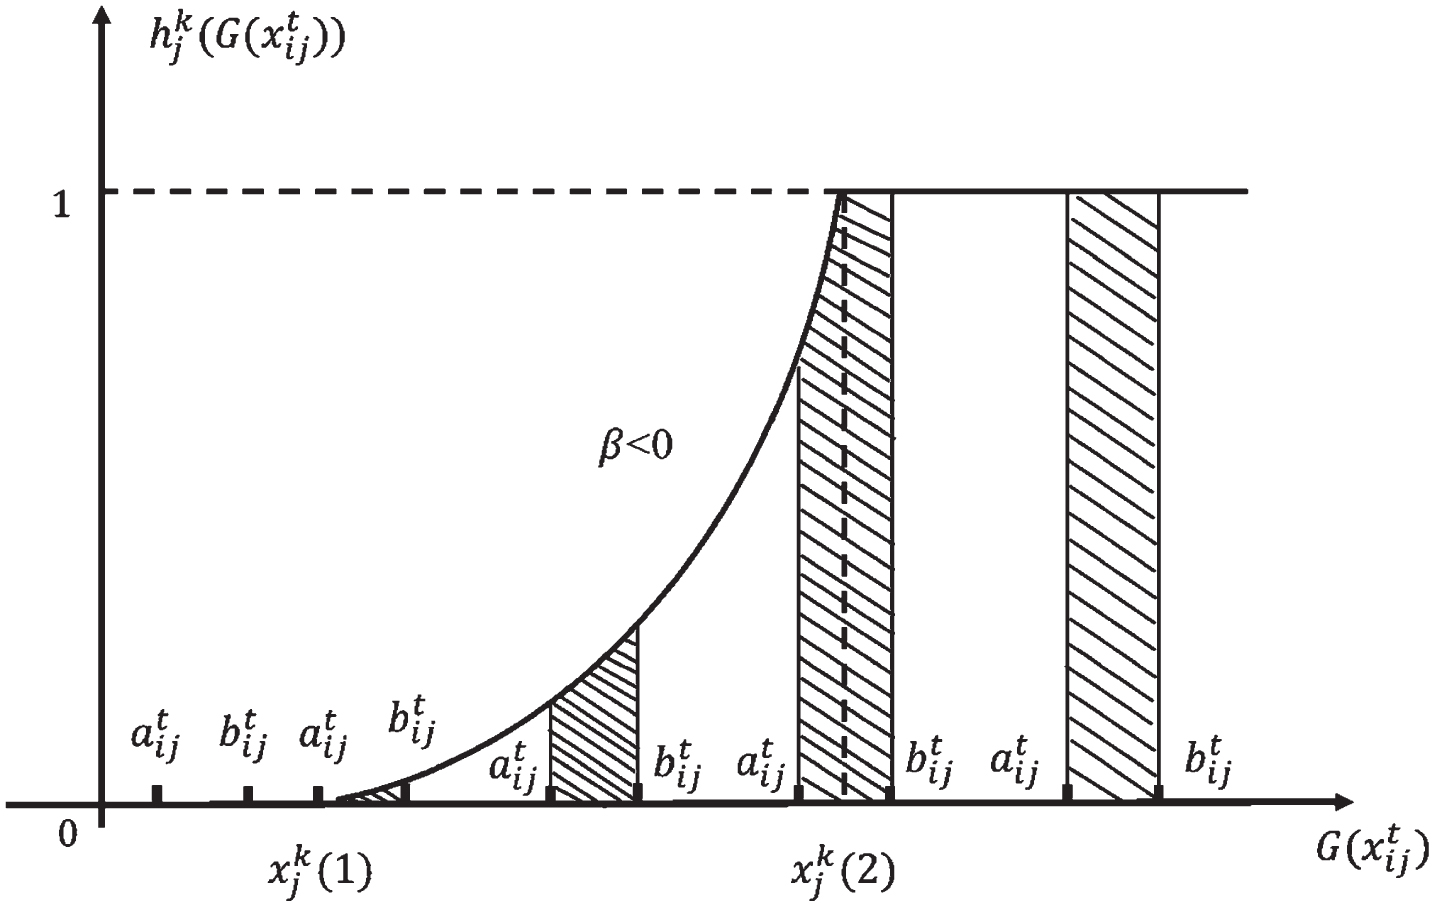
Suppose there are n clustering objects, m clustering indicators, and s grey classes. Let be the universal possibility functions of indicator j subject to grey class k, where x represents the observed value of the indicator, j = 1, 2, ⋯ , m and k = 1, 2, ⋯ , s. , , , are turning points. β represents the clustering preference. We denote the L (x) and R (x) as follows:
when β → 0, becomes the traditional typical possibility function. When β < 0, the preference is relaxed, then L (x) and R (x) are convex functions. when β > 0, the preference is strict, then L (x) and R (x) are concave functions.
Definition 1. The typical universal possibility function is
Definition 2. The universal possibility function of lower measurement is
Definition 3. The universal possibility function of moderate measurement is
Definition 4. The universal possibility function of upper measurement is
However, most of the indicators have the feature of multiple uncertainties. Therefore, we develop the generalized universal possibility functions for the generalized grey numbers.
Definition 5. [15] Let U be the finite domain, and A be a multiple uncertain set which includes random number, fuzzy number, interval-valued fuzzy number and grey number, besides A ⊆ U. If x is an element and x ∈ U, the generalized grey numbers G (⊗ A (x)) ∈ D [0, 1] ± can be used to represent the value of characteristic function at x with respect to A,
where i = 1, 2, ⋯ , n, n is an integer, ai, bi ∈ R and bi-1 ⩽ ai ⩽ bi ⩽ ai+1. δA (x), μA (x), MA (x), represent the random numbers, fuzzy numbers, interval-valued fuzzy numbers and grey numbers respectively. D [0, 1] ± refers to the set of all generalized interval grey numbers within the interval [0,1].
Then, according to definition 5, denote the observed value of indicator j of object i at time t by a generalized grey number .
Proposition 1.The generalized universal possibility function of upper measurement is
As shown in Fig. 1, it is easily obtained the proposition 1.
The generalized universal possibility function of upper measurement.
In a similar way, we can obtain other three kinds of generalized universal possibility functions.
Proposition 2.The generalized typical universal possibility function is
Proposition 3.The generalized universal possibility function of lower measurement is
Proposition 4.The generalized universal possibility function of moderate measurement is
Clustering models
In this paper, the weights of indicators and the time will be considered.
Definition 6. Denote for the generalized typical universal possibility function; Denote for the generalized universal possibility function of lower measurement; Denote for the generalized typical universal possibility function of upper measurement and moderate measurement. Then, is called the critical value of the indicator j subject to the grey class k.
Definition 7. If is the critical value of the indicator j subject to the grey class k. Then, the generalized grey weight of the indicator j subject to the grey class k is
Definition 8. If is the observed value of indicator j of object i at time t, is the generalized grey possibility function of indicator j subject the grey class k, and is the generalized grey weight of the indicator j subject to the grey class k. Then
is the generalized grey universal clustering coefficient of the object i subject to the grey class k at time t.
In order to reveal the importance of the objects at different times, we continue to consider the time weight. The formula of the degree of time τ is given as follows [20]:
which represents the preference of the time order in the operator aggregation process. When τ is closer to 0, it pays more attention to the recent information. When τ is closer to 1, it pays more attention to the distant information.
According to the thought from [20], we determine the time weight vt considering the importance of the time and minimum volatility. Therefore, we formulate the model with mean value and variance as follows:
Definition 9. If is the generalized grey universal clustering coefficient of the object i subject to the grey class k at time t, then the generalized grey dynamic clustering coefficient of the object i subject to the grey class k is
where t = 1, 2, ⋯ , T.
Definition 10. The generalized grey dynamic clustering coefficient matrix is
For the comparison of , it should be transformed into the generalized standard grey number , and let via the grey kernel [15].
Definition 11. If , then the object i belong to the grey class k*.
Then, we give the following steps to show how to use the proposed clustering methods:
Step one: According to the preference of the decision-makers, the clustering preference β is given and the universal possibility functions are obtained according to the Definition 1–4.
Step two: The generalized universal possibility function values are obtained via the Proposition 1–4.
Step three: According to the Definition 6–8, the generalized grey universal clustering coefficients are obtained.
The observed values of the supplier S1
x1
x2
x3
x4
x5
2018
0.871
0.865
0.859
[0.766,0.779]
[0.782,0.814]
2019
0.905
0.908
0.827
[0.812,0.826]
[0.802,0.822]
2020
0.962
0.951
0.970
[0.901,0.922]
[0.892,0.905]
2021
0.972
0.965
0.958
[0.911,0.924]
[0.904,0.917]
2022
0.904
0.921
0.918
[0.801.0.829]
[0.906,0.918]
The observed values of the supplier S2
x1
x2
x3
x4
x5
2018
0.940
0.948
0.951
[0.842,0.850]
[0.845,0.858]
2019
0.942
0.954
0.956
[0.847,0.857]
[0.852,0.864]
2020
0.795
0.810
0.807
[0.706,0.716]
[0.682,0.702]
2021
0.781
0.796
0.809
[0.714,0.721]
[0.659,0.676]
2022
0.775
0.782
0.801
[0.718,0.722]
[0.679,0.687]
The observed values of the supplier S3
x1
x2
x3
x4
x5
2018
0.862
0.884
0.910
[0.765,0.781]
[0.801,0.816]
2019
0.946
0.958
0.941
[0.890,0.906]
[0.912,0.927]
2020
0.818
0.792
0.809
[0.621,0.647]
[0.675,0.682]
2021
0.795
0.728
0.781
[0.614,0.627]
[0.651,0.668]
2022
0.957
0.946
0.968
[0.879,0.885]
[0.904,0.925]
Step four: Combining the formula (14) and (15), the time weights of the indicators can be obtained.
Step five: According to the Definition 9-10, we can obtain the generalized grey dynamic clustering coefficient matrix.
Step six: The clustering results of the objects can be obtained via the Definition 11.
Case illustration
The effective collaboration and cooperation between manufacturers and suppliers contribute to the development of C919 of Commercial Aircraft Corporation of China. Therefore, the evaluation of the suppliers makes sense for the success of development projects. To the best of our knowledge, the observed values of the C919 evaluation indicators have the multiple uncertain features due to the differences of indicator attributes and data resources. Because of the high requirement, the decision-makers always have the strict preference. However, it is difficult for the decision-makers to evaluate the suppliers at one certain year. For example, the supplier A may be the best in 2021, but the supplier B may be the best in 2022. Therefore, the decision-makers usually evaluate the suppliers via the performance of several years rather than one year. However, the traditional clustering methods cannot effectively solve these problems. Then, we illustrate the suggested methods for the evaluation of C919 suppliers based on the assumed data.
From the work in [10], we can obtain that the main indicators of suppliers are product quality level x1, satisfaction of customer x2, delivery punctuality x3, effectiveness of cooperation x4, and production level x5. In addition, we assume that there are three suppliers and the observed values of five years are presented as follows:
Suppose that β = 8.0 and the grey classes include the excellent, good, qualified, unqualified. The universal possibility functions are given as follows:
, , , , ;
, , , , ;
, , , , ;
, , , , .
Then, the generalized universal possibility function values are presented as follows:
According to the formula (12), the generalized grey weight of the indicator j subject to the grey class k can be obtained.
According to the definition 6–8, the generalized grey universal clustering coefficient can be obtained.
According to the formula (15), we focus on the recent information and let τ = 0.470, then, the time weight can be obtained.
Via the definition 10, the generalized grey dynamic clustering coefficient matrix is
And, the standard form of the matrix is:
From it, it is easily obtained that S1 and S3 belong to the ‘excellent’, but S2 belongs to the ‘unqualified’. As can be seen in above tables, S1 and S3 have satisfactory performances in recent years. However, S2 has poor performances. If the time weight is not considered, then the evaluations of three suppliers for five years are presented as follows:
From Table 4, it is difficult to evaluate three suppliers if the traditional methods are used. Therefore, we provide the effective and reasonable methods.
The evaluations of three suppliers for five years
2018
2019
2020
2021
2022
S1
good
good
excellent
excellent
good
S2
excellent
excellent
qualified
qualified
qualified
S3
good
excellent
qualified
qualified
excellent
Conclusions
In this paper, we consider the preferences of indicators into the traditional possibility functions, and the universal possibility functions have been provided. Then, due to the multiple uncertain features of the indicators, the universal possibility functions have been extended for the generalized grey numbers. According to the importance of the indicators and time, the weights of the indicators and time have been given respectively. Based on the above factors, the generalized grey dynamic clustering models with preferences have been formulated. At last, the suggested models have been illustrated via the evaluations of C919 suppliers. From the illustration, it exists considerable differences for the evaluation of each time if the traditional methods are adopted. It is difficult to evaluate the objects if the decision-makers consider the performances of a period of times. But the suggested models can obtain the reasonable results. Therefore, the effectiveness of the suggested models has been verified. However, the weight method of this paper cannot reveal the information of observed values. Some literatures have showed that the entropy weight can effectively represent the information of observed values. It might be interesting to investigate generalized grey dynamic clustering methods with the entropy weight in the future.
Footnotes
Acknowledgments
This research is partially supported by the project of the National Natural Science Foundation of China (Grant No: 72271124, 52232014, 72071111).
References
1.
LiK., ZhuH., ZhangY.et al., Dynamic evaluation method on dissemination capability of microblog users based on topic segmentation, Physica A: Statistical Mechanics and its Applications608 (2022), 128264.1–12.
2.
WangJ.T., ZhangS., WuC.H.et al., Time-sensitive markdown strategies for perishable products based on dynamic quality evaluation, Kybernetes50(1) (2021), 165–180.
3.
TsaiY.T. and LinK.H., Dynamic analysis and reliability evaluation for an eccentric speed reducer based on fem, Journal of Mechanics36(3) (2020), 1–9.
4.
WuD., WangY. and QianW., Efficiency evaluation and dynamic evolution of China’s regional economy: A method based on the Super-PEBM model and DEA window analysis, Journal of Cleaner Production264 (2020), 121630:1–19green.
5.
XuZ., LiX., XiongW.et al., A dynamic multi-dimension trust model for information service quality evaluation, Procedia Computer Science187 (2021), 601–606.
6.
ZhangL., ZhaoL. and ZhaY., Efficiency evaluation of Chinese regional industrial systems using a dynamic two-stage DEA approach, Socio-Economic Planning Sciences2021(1) (2021), 101031.1–12.
7.
AlizadehR., BeiraghR.G., SoltanisehatL.et al., Performance evaluation of complex electricity generation systems: A dynamic network-based data envelopment analysis approach, Energy Economics (2020), 104894.1–15.
8.
JiangL., A dynamic grey target evaluation method with multiple reference points for new R&D institution performance, Journal of Intelligent & Fuzzy Systems: Applications in Engineering and Technology40(3) (2021), 3831–3847.
9.
LiW., YeY., HuN.et al., Real-Time warning and risk assessment of tailings dam disaster status based on dynamic Hierarchy-Grey relation analysis, Complexity2019(9) (2019), 1–14.
10.
ZhangQ., FangZ., CaiJ.et al., Research on the dynamic comprehensive evaluation model of multi-source uncertain indexes based on the generalized grey incentive factors, Systems Engineering and Electronics41(3) (2019), 586–593.
11.
YangH., DingY., ZhouJ.et al., A condition assessment method of transformers based on optimal weight and dynamic grey target with interval grey number, Power System Protection and Control47(7) (2019), 66–74.
12.
YuP., YangY., MaH.et al., Evaluation of High-Quality development of manufacturing industry using a novel grey dynamic double incentive decision-making model, Mathematical Problems in Engineering2022 (2022), 1–10.
13.
LiuS.F., YangY.J. and WuL.F., The theory of grey system and its application, Beijing: Science Press, 2014.
14.
YangY. and JohnR., Grey sets and greyness, Information Sciences185(1) (2012), 249–264.
15.
ZhangQ., FangZ., LiuS.et al., On variable weight clustering model of generalized interval grey numbers for multiple uncertain data[J], The Journal of Grey System31(1) (2019), 84–99.
16.
ZhangQ., FangZ.G. and CaiJ.J., A clustering model of generalized interval grey entropy weight based on multivariate heterogeneous uncertainty case learning, Control and Decision33(8) (2018), 1481–1488.
17.
ZhangQ., FangZ.G. and TaoL.Y., Research on the weight allocation of generalized interval grey number entropy in the series-parallel case index system, Systems Engineering Theory and Practice38(8) (2018), 2057–2067.
18.
CaiJ.J., FangZ.G. and ZhangQ., Research on generalized grey target decision model based on principal component weight of improved regulating variables, System Engineering Theory and Practice40(11) (2020), 2991–2999.
19.
ShaoH., FangZ.G. and ZhangQ., Study on the reliability function and convergence of Weibull distribution with multi-source heterogeneous data, Mathematics in Practice and Theory48(7) (2018), 182–191.
20.
YagerR.R., On ordered weighted averaging aggregation operators in multicriteria decisionmaking, IEEE Transactions on Systems, Man and Cybernetics18(1) (1988), 183–190.