



Abstract
Accessible products play an essential role in the lives of people with disabilities. This paper aims to identify key user satisfaction with accessible products factors affecting the use of accessible products by people with disabilities that influence user satisfaction. The extended model incorporates the essential elements of the TAM, TPB, and PR models and user satisfaction as an external variable. Data were collected from 339 users of accessible products. Structural equation modeling was used to identify significant variables in this study. SEM considered “behavioral intention” to be the most important among them. This study generated design strategies based on significant factors analyzed in the findings and validated the design cases using the PSSUQ questionnaire, which showed that users had better user satisfaction when using accessible products with the new design strategies.
Keywords
Introduction
According to the United Nations Development Programmer, people with disabilities are the world’s largest minority group, numbering as many as 1 billion or. occupied 15% of the global population [1]. A disability limits a person’s activities due to underlying physical and/or intellectual pathologies and impairments [2]. With the development of the “disability” model, disability today is not only interpreted as a behavioral impairment caused by individual factors but also considers the impact of environmental factors on a person’s physical functioning, activity, and health. The impact of disability on a person’s actions is diverse; it does not allow for a dichotomy in the concept of disability [2], which means that functional limitations in the lives of people with disabilities can be more complicated. The World Health Organization’s development of the Functioning, Disability, and Health (ICF) model [3] interprets the terminology of disability as disability (Body functions, Body structures, Impairments), Activity limitations, and Participation Restrictions. By complementing the influence of environmental and personal factors on activity levels, ICF gradually replaced the International Classification of Impairments, Disabilities and Handicaps (ICIDH) Models [3] to provide more comprehensive information with the International Classification of Diseases (ICD). The complementary information is available to assist for disability classification and health planning management [2].
Nowadays, the needs of products for users with disabilities have become more complex. The first category being generic product design solutions for different disability groups. Michael Jones et al. [4] examined the current state of smartphone mobile health software applications (mHealth apps) used by users with disabilities. They found that people with disabilities were underrepresented in the growth of mHealth, implying a need for better product service solutions for users with disabilities. Erin Radcliffe et al. [5] then evaluated the accessibility and usability of the mHealth app for users with disabilities. The three disability groups that were recruited (visual, dexterity, and cognitive impairment) provided low satisfaction ratings and experienced varying degrees of challenges when using the app. Jennifer A. Gray et al. [6] reviewed the applicability of sports-related apparatus in the architectural environment to people with disabilities. They found that only one-third of all apparatus reviewed contained disability-specific items. In addition to the evaluation and review efforts, many researchers have proposed solutions for accessible products or services with generalizability. Diego M.M. et al. [7] designed a mobile application for accessible beach tourism information using the beaches of the Murcia region in Spain as a case study. The application not only helps people with disabilities to use tourism resources but also raises awareness of local government and business to create and improve accessible services. At the same time, they also designed an accessible information system for business organization applications [8] to help businesses improve accessibility. Further, Malan Zhang et al. [9] designed an application for the International Classification of Functioning, Disability, and Health Rehabilitation and successfully applied it in practice.
The second type of product is a service solution designed for a specific group of people with disabilities, such as accessible products for the visually and hearing impaired to meet their travel needs. Seyed Ali Cheraghi et al. [10] designed an indoor wayfinding system called BVID, which helps people to navigate between any two points in an indoor environment. In addition, Kabalan Chaccour et al. [11], used an indoor camera with a smartphone to provide a mobile navigation application for visually impaired users. Using computer vision, Eunjeong Ko et al. [12] developed a wayfinding application based on a smartphone system whose users could locate their path with 97% accuracy. Jin Liu et al. [13] conducted a review on sensor technology-based electronic travel devices for the visually impaired, where the primary devices are from the U.S. Most of the devices are wearable and provide travel assistance to the blind in the form of sensory substitution. When it comes to the needs of people with hearing impairment, the main objective of the program proposed by the researchers is to improve the communication between people with hearing impairment and those who can hear. Seongjae Lee et al. [14] proposed a portable device and user interface to facilitate two-way communication between hearing-impaired and hearing people. It can be applied to different domains and scenarios as an efficient solution. Woo-Lin Kim et al. [15] developed an application based on Android that converts external speech into text and displays it to hearing-impaired users but only solves the problem of one-way communication. Setha Pan-ngum et al. [16] designed a low-cost hearing assistive system for classrooms of hearing-impaired students that significantly improved the hearing of hearing-impaired students and was evaluated for usability through long-term use. In response to the physical activity needs of individuals with physical disabilities, Sara H Olsen et al. [17] examined the preferences of users with physical disabilities for the content, interface, and functionality of physical activity apps. They found that users were very interested in a fitness app designed for people with physical disabilities and valued user experience, social engagement, and gamification features. Dahlia Kairy et al. [18] have designed an application for users with physical disabilities called OnRoule, which is designed to provide users with accessible information in public places so that they can quickly find places they are interested in and can move around efficiently.
From the previous research, it is clear that people with disabilities have diversity, including physical disability, cognitive impairment, hearing impairment, visual impairment, etc. Researchers must conduct sufficient research and studies with various types of disabled users to understand their needs and the use of accessible products. Many scholars who research in accessibility design are more often targeting a specific group of people with disabilities. Research on a particular group can make the research questions more detailed, and the problems solved more targeted toward a solution for one group. However, it is challenging to research other types of disabilities to solve some of the broader issues in accessibility design and to make more designs available to a broader population. When designing for users with disabilities, there are fewer general accessibility product design theories for designers to refer to. The research process for people with disabilities also has specific challenges, such as the complexity of the research process for people with disabilities and the difficulty of data collection. By combining TAM, TPB, and PR models, this study investigates user satisfaction with accessible products, which can form the basis for a universal design theory to solve the problems in accessible design that can affect most special groups. The human-computer interaction framework proposed in this study can form a specific accessibility product design strategy to help designers to optimize the human-computer interaction of accessible products with a particular design to improve user satisfaction of people with disabilities. The significance of this study is to conduct research with generalized value for socially disadvantaged groups, which can help designers and scholars to have a more comprehensive understanding of user satisfaction with accessible products and help them to better design for disabled users, as well as provide a specific design basis for related accessibility designs.
Theoretical basis
Structural equation model (SEM)
Structural equation modeling (SEM) was introduced in 1973 by the Swedish statistician Joreskog. K.G. It refers to equations that use parameters to analyze observable or latent variables [19]. SEM integrates path analysis and confirmatory factor analysis (CFA), which can test traditional models and perform tests of complex relationships and models applied in different contexts. Among the choices of SEM variables can be theoretical constructs such as intelligence, discrimination, socialization, behavioral motivation, personal fulfillment, satisfaction, and/or attitude [20].
The essential components of SEM are divided into two parts: measurement equations and structural equations. The measurement equation expresses the relationship between latent variables and indicators, and the structural equation describes the relationship between latent and measured variables. Its establishment process is roughly divided into constructing a theoretical model, formulating research hypotheses, sample data collection, model evaluation and revision, hypothesis testing, and conclusion analysis. Hansi Chen et al. [21] analyzed user consumption preferences by introducing an artificial neural network (ANN) in SEM to establish a mapping relationship between product parameters/attributes and consumer preferences. Rosemary R. Seva et al. [22] validated the Usability Perception and Emotion Enhancement Model (UPEEM) using SEM to assess the apparent usability and affective quality considered in product design. When user satisfaction is used to build a user model and analyze the needs of user groups, the design process can be overwhelmed by too many user needs, and designers cannot grasp the design focus and entry point. By combining SEM with a design focus, designers can find the most suitable solution.
Technology acceptance model (TAM)
The Technology Acceptance Model (TAM), proposed by Davis et al. [23] in 1989, is a theoretical model used to analyze the crucial factors affecting user acceptance of new technologies, as shown in Fig. 1. TAM can help researchers to extend various complex user behavior models and analyze the characteristics of user behavior toward new technologies. TAM has undergone several refinements since its development, and its two core determinants are perceived usefulness (PU) and perceived ease of use (PEOU) [24]. In the later TAM2 [25], it added the factor of the subjective norm (SN) to the influence of PU and PEOU. SN aims to capture the influence of society and those around it to force end users to evaluate and accept IT actively. TAM can explain why users use IT software and analyze the factors related to user trust and reliance in the software. Ciro Troise et al. [26] built a research framework using TAM and TPB to analyze the main drivers of users’ intention to use meal delivery apps and combined perceived risk as a contextual factor for the study. Da Tao et al. [27] studied the acceptance of health information portals by young Internet users by combining usability and social cognitive theory with TAM. Ke Chen et al. [28] used TAM to assess the acceptance of emerging technologies among older adults in Hong Kong and validated it using SEM. TAM can be a good analysis of user acceptance of new technologies in the design process, so it is chosen as the primary theoretical model in this study.
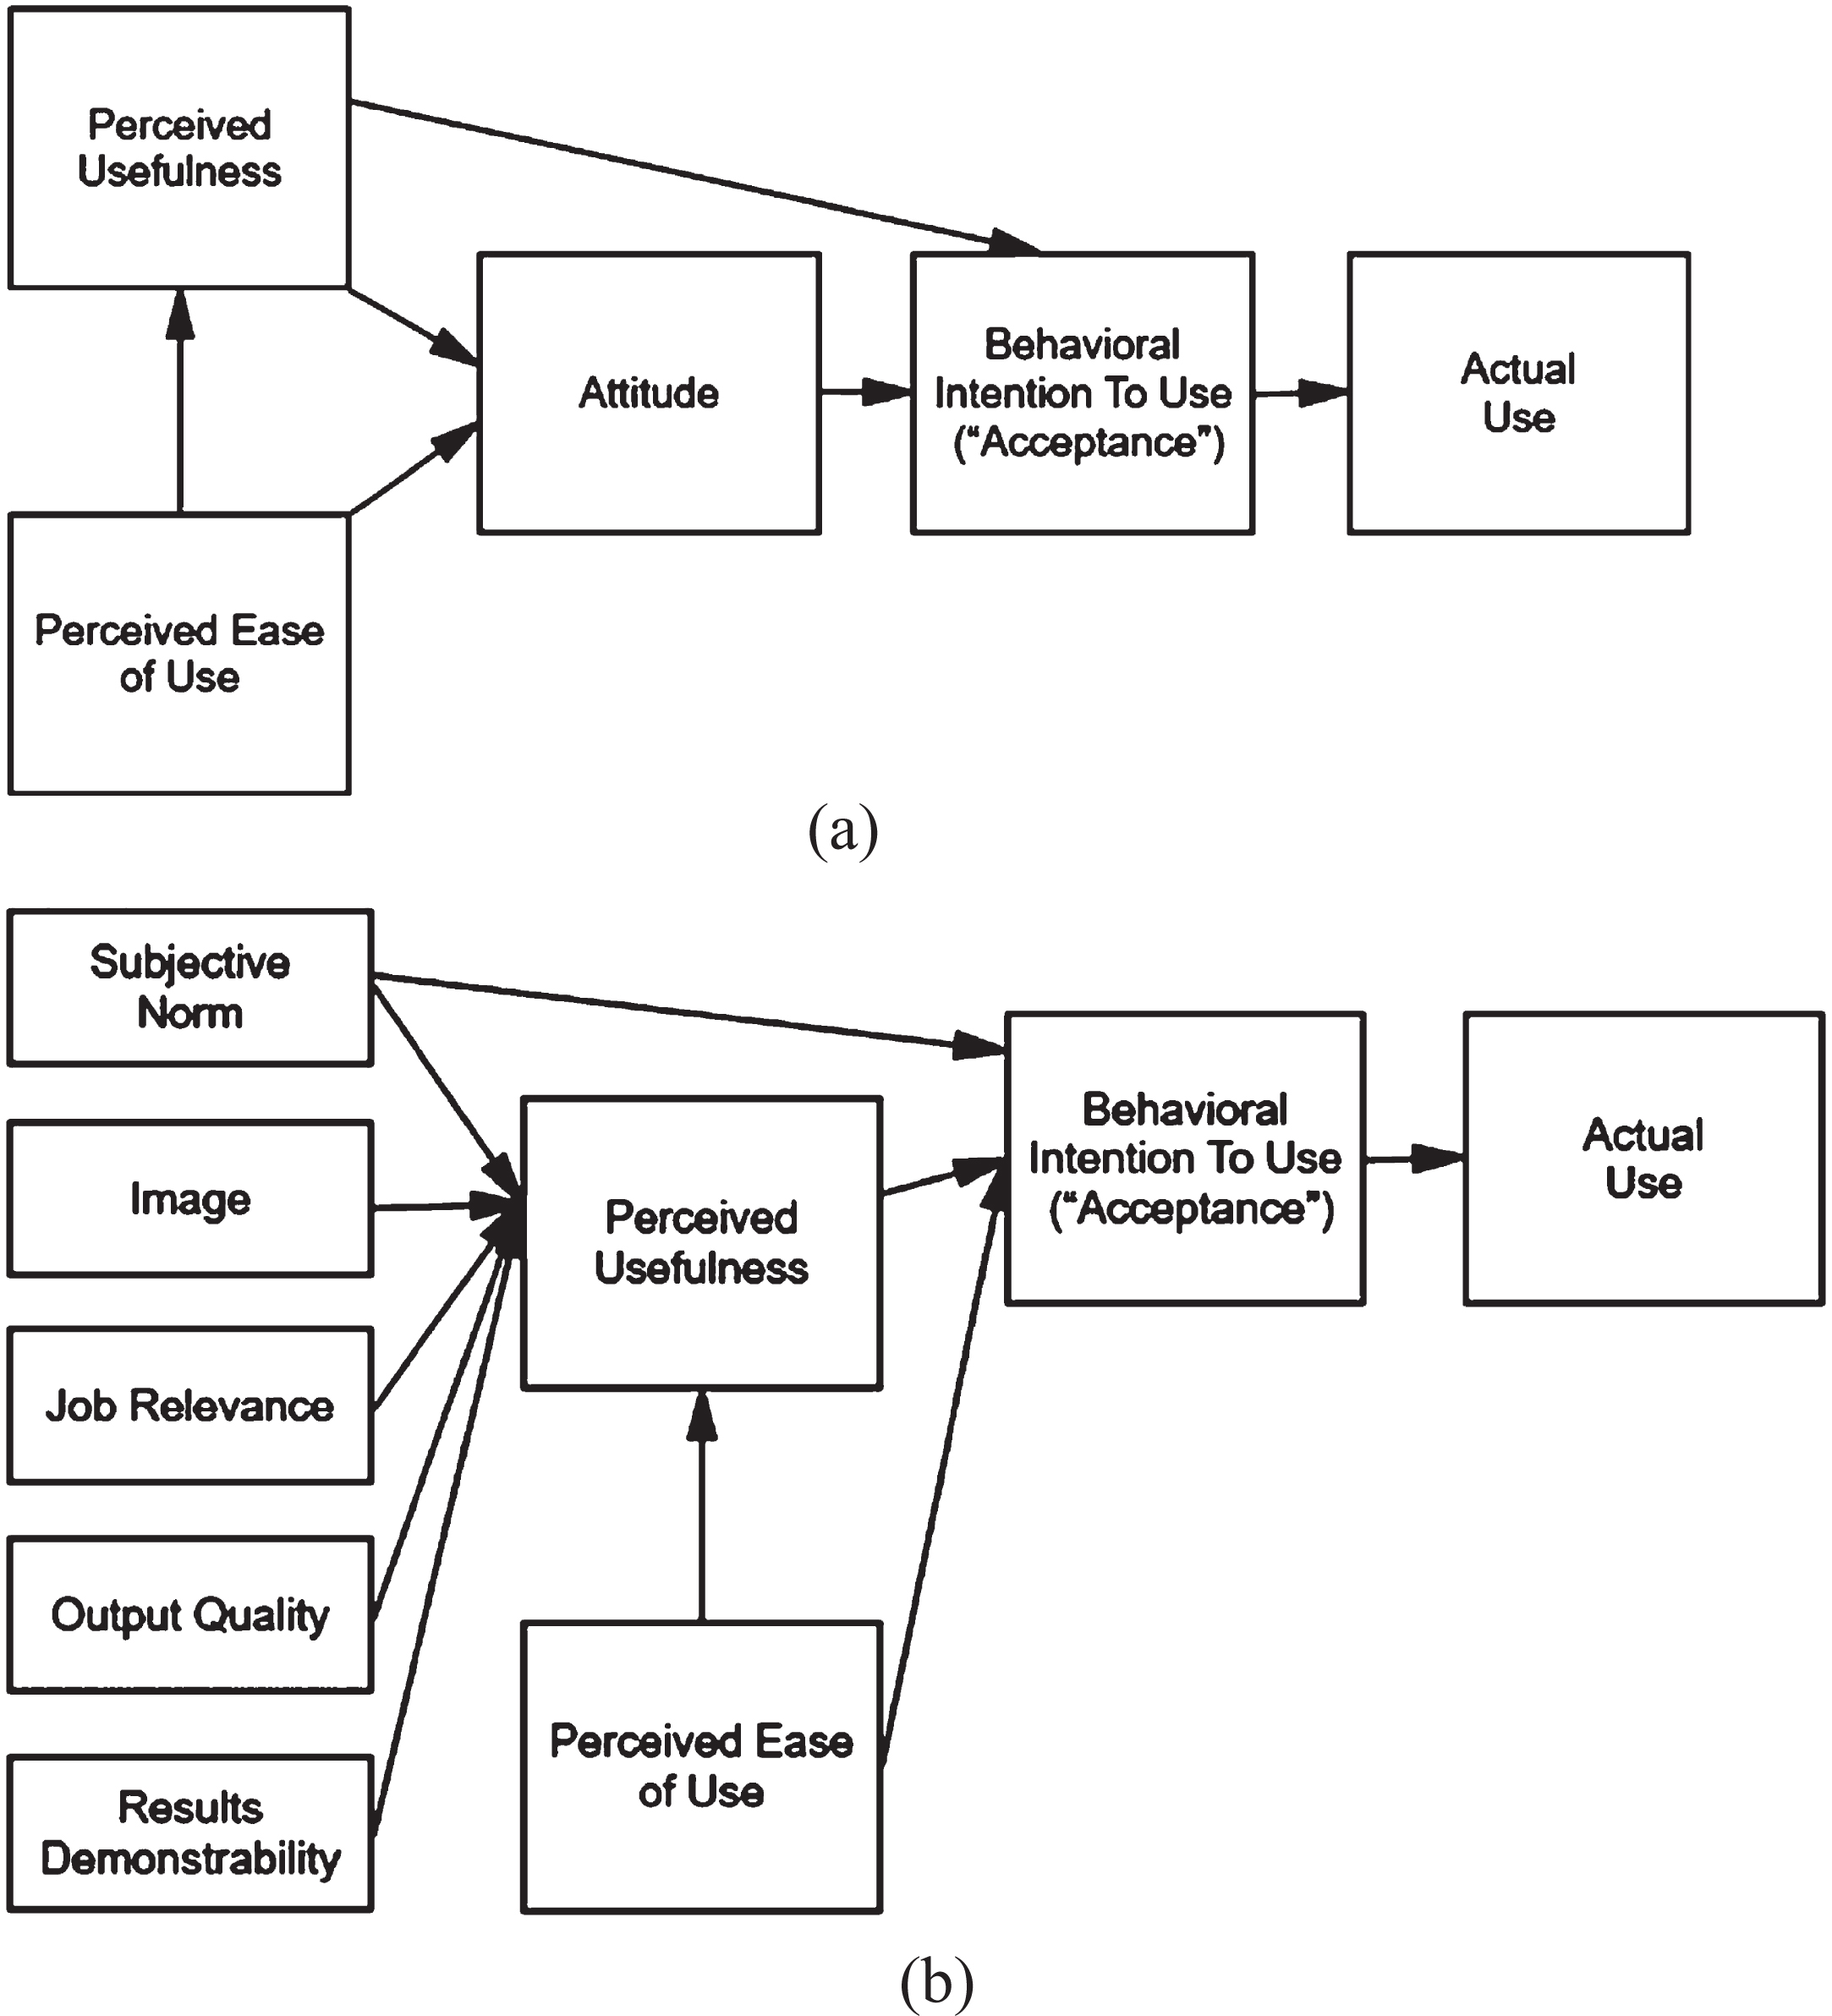
Theoretical illustration related to technology acceptance model: (a) TAM; (b) TAM2.
The Theory of Behavior (TPB) model is an extended model based on the Theory of Reasoned action (TRA) [29], as shown in Fig. 2. The TRA model, one of the most influential technology adoption models in social psychology, uses two variables, attitude toward behavior (ATB) and subjective norm (SN), as determinants of behavioral intentions. TPB, often used to explain behavioral intentions and behaviors, adds a new variable of perceived behavioral control (PBC) to the TRA model, providing several successful predictions of users’ behavioral intentions through the analysis of 3 variables: attitudes, normative beliefs, and control beliefs [30]. Hamide R. S et al. [31] designed a behavioral model of sustainable consumption of organic products using TPB, consisting of three stages: cognitive, motivational, and volitional. Hagger et al. [32] used TPB in their study of physical activity participation in individuals without disabilities and successfully explained statistically significant differences in users’ participation in physical activity. T. Nicole Kirk et al. [33] then conducted a review to assess the empirical literature on the use of TPB in the context of physical activity beliefs and behaviors of people with disabilities. Therefore, TPB can explain users’ behavioral attitudes in studying users’ intention to use accessible design.
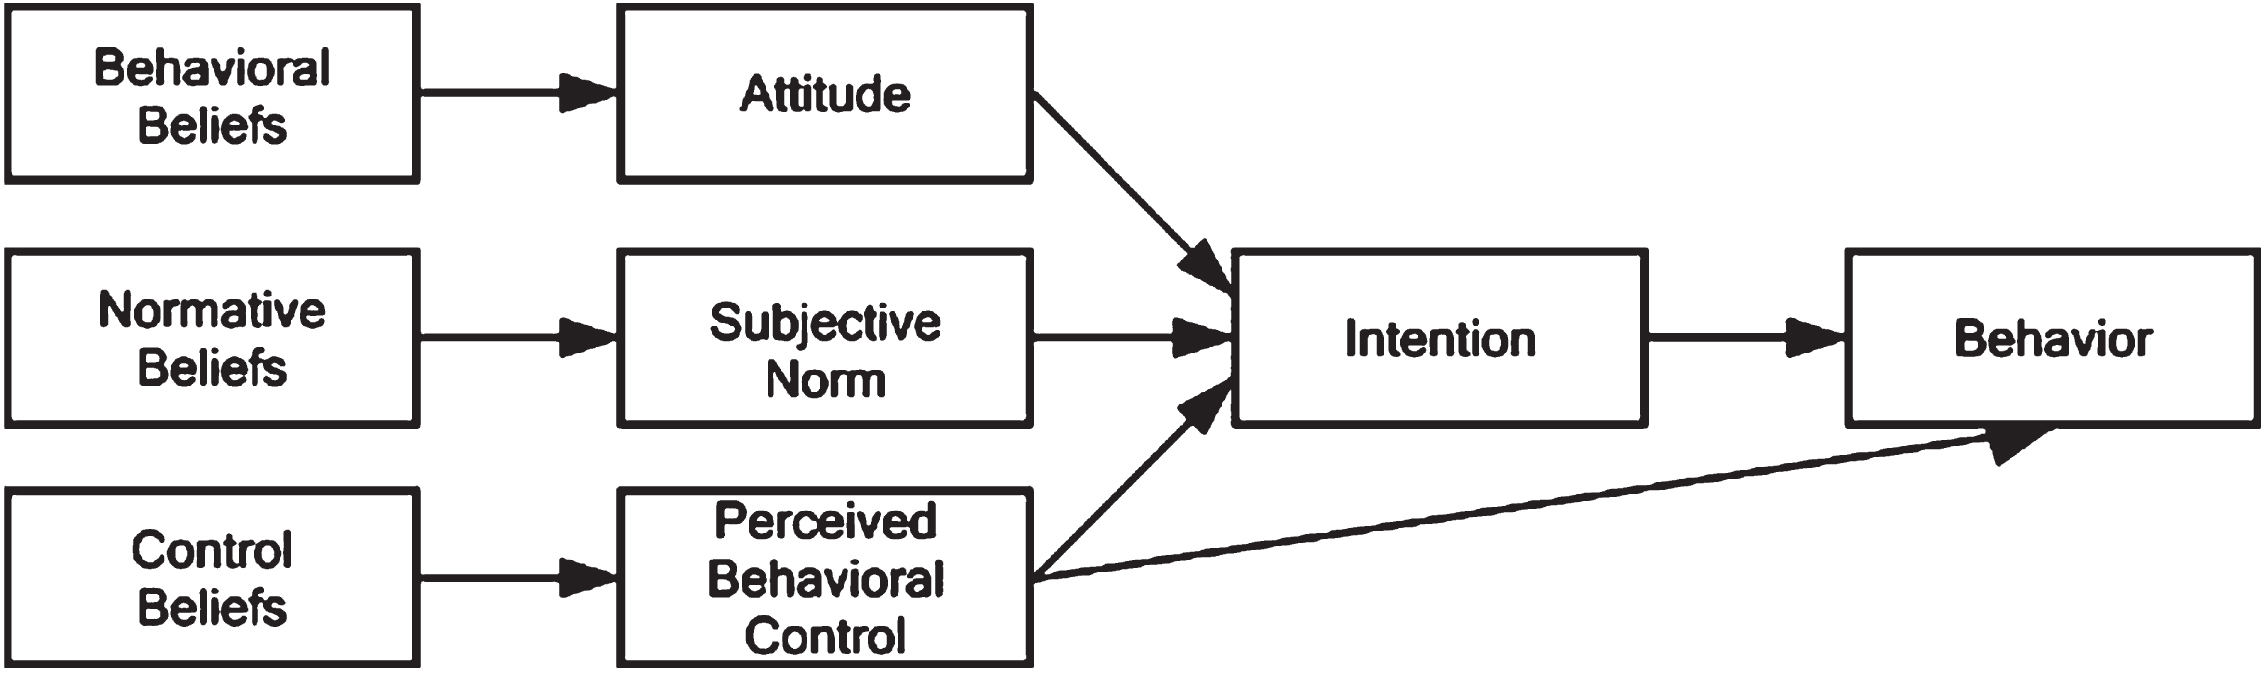
Illustration of the theory related to Theory of Planned Behavior (TPB).
Perceived risk (PR) was initially born in psychology and first proposed by Harvard scholar Bauer [34] in 1960. It reflects the losses consumers would consider for their purchases and thus influences their buying behavior [35]. The factors related to products or services in perceived risk contain functional loss, financial loss, time loss, opportunity loss, and product risk [36]. PR can be used in combination with TAM and TPB. Huey-Kuo Chen et al. [37] investigated the interrelationship between motorcycle express cargo delivery service (MECDS) usage factors using a framework based on the TPB, TAM, and PR. AlHadid et al. [38] integrated UTAUT, TPB, TAM, and PR to investigate the various factors affecting the use of SANAD applications as a health protection tool and validated the model using SEM. PR can significantly negatively impact users’ purchase intention, so this study uses PR as the underlying theoretical model.
Development of hypotheses
Research rationale
The TAM/TPB/PR model is used in this study because these models have been widely used to explain user behavior and satisfaction, especially in information systems and consumer behavior research. The TAM model mainly explains the determinants of technology acceptance. In contrast, the TPB model further extends the TAM model by adding the variable of perceived behavioral control to predict users’ behavioral intentions more accurately. The PR model complements the missing risk factors in the TAM and TPB models and plays a vital role in explaining user satisfaction. In user research other models exist for user satisfaction research. They include SERVQUAL [39], Customer Value Model [40], and Expectation-Confirmation Model [41]. The SERVQUAL model is mainly used to assess the relationship between service quality and user satisfaction and to predict user satisfaction by evaluating five aspects of service quality (reliability, responsiveness, assurance, empathy, and perceptibility). However, the model needs to be more relevant and accurately reflect the characteristics of different service types. Explaining the causal relationship between service quality and user satisfaction is difficult. The customer value model mainly considers the relationship between users’ perceived value and satisfaction and includes several factors such as product and service quality, price, convenience, and brand image. This model may have significant differences in the influencing factors for different products and services, which is difficult to quantify and cannot provide a direct basis for decision-making. The expectation-confirmation model mainly considers the relationship between users’ expectations and the experience of a product or service to assess users’ satisfaction and loyalty. On the other hand, this model cannot accurately reflect the changing trend of user satisfaction or explain factors affecting user expectations.
Compared with other models, the advantages of TAM, TPB, and PR models are that the variables and relationships of TAM, TPB, and PR models are highly explanatory, which can explain the factors influencing user behavior and satisfaction and provide references for formulating relevant strategies. TAM, TPB, and PR models have been validated in many empirical studies and can effectively predict user behavior and satisfaction. TPB and PR models can also be flexibly extended and adapted to different research scenarios and questions according to actual research needs. The TAM/TPB/PR models can model the unique needs of people with disabilities when considering user behavior. For example, the perceived risk model can evaluate the potential losses and difficulties of people with disabilities in purchasing products or services.
In contrast, the TPB model can consider factors such as behavioral attitudes, subjective norms, and perceived behavioral control of people with disabilities, making the research more relevant. TAM, TPB, and PR models impact multiple factors on user satisfaction and can be considered integrated, thus providing a more comprehensive analysis of user satisfaction. For example, the TAM model considers the influence of system ease of use and usefulness on user satisfaction, the TPB model considers the impact of users’ attitudes, normative beliefs, and behavioral control beliefs on user behavior, and the PR model considers the influence of users’ perceived risk on purchase behavior. All are easily applied to different research objects and domains, and thus are highly scalable.
In this study, the main reason for using SEM structural equation model to calculate user needs is that SEM can consider the relationship between multiple variables simultaneously and evaluate the model holistically. In addition, SEM can be used to verify the model’s fit and the causal relationship between the variables in the model, which can improve the reliability and accuracy of the model. Compared with other methods, such as multiple regression or logistic regression analysis, SEM can explain the model more comprehensively and precisely and assess the model fit and prediction more accurately.
TAM, TPB, PR models, and SEM structural equation models are reliable research methods for explaining and predicting user behavior and satisfaction. However, different research questions and data characteristics may require different modeling methods and techniques, which must be selected case by case. Therefore, when using these methods, the data must be fully analyzed, explored, adjusted, and improved according to the actual situation to improve the reliability and validity of the researchresults.
Research model construction
This study draws on TAM and TPB’s analysis of factors related to user satisfaction, combined with the analysis of factors related to perceived risk (PR). Finally, it extracts six factors to constitute the model based on the literature review results. Among them, the strength of user willingness to use (i.e., the level of user satisfaction) as the outcome measure includes perceived usefulness, perceived ease of use, subjective norm, behavioral intention, and perceived behavioral control as direct positive influence factors, and perceived risk as the direct negative influence factor, which will directly reduce the user’s final willingness to use. According to their logical relationships, this paper establishes a model, as shown in Fig. 3. The research design flow of this paper is shown in Fig. 4.
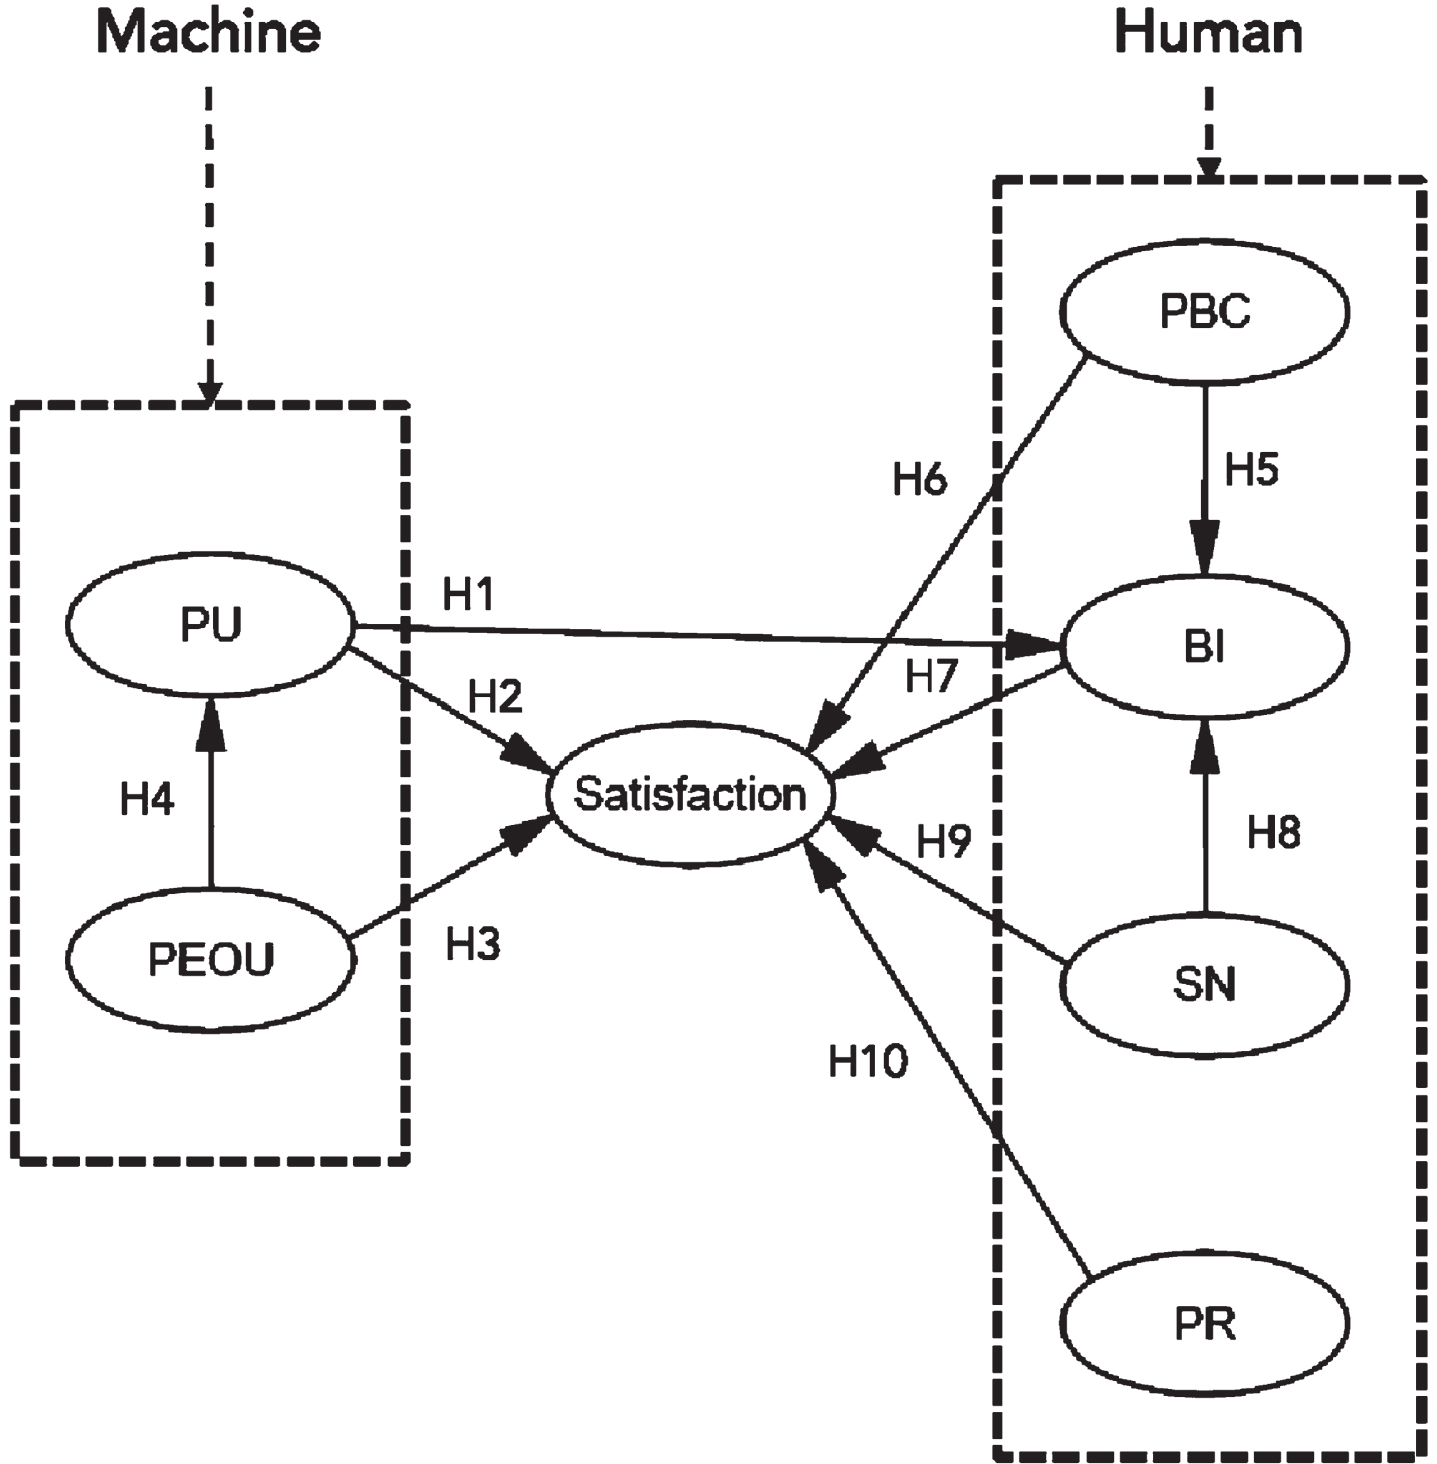
User satisfaction model of accessible products.
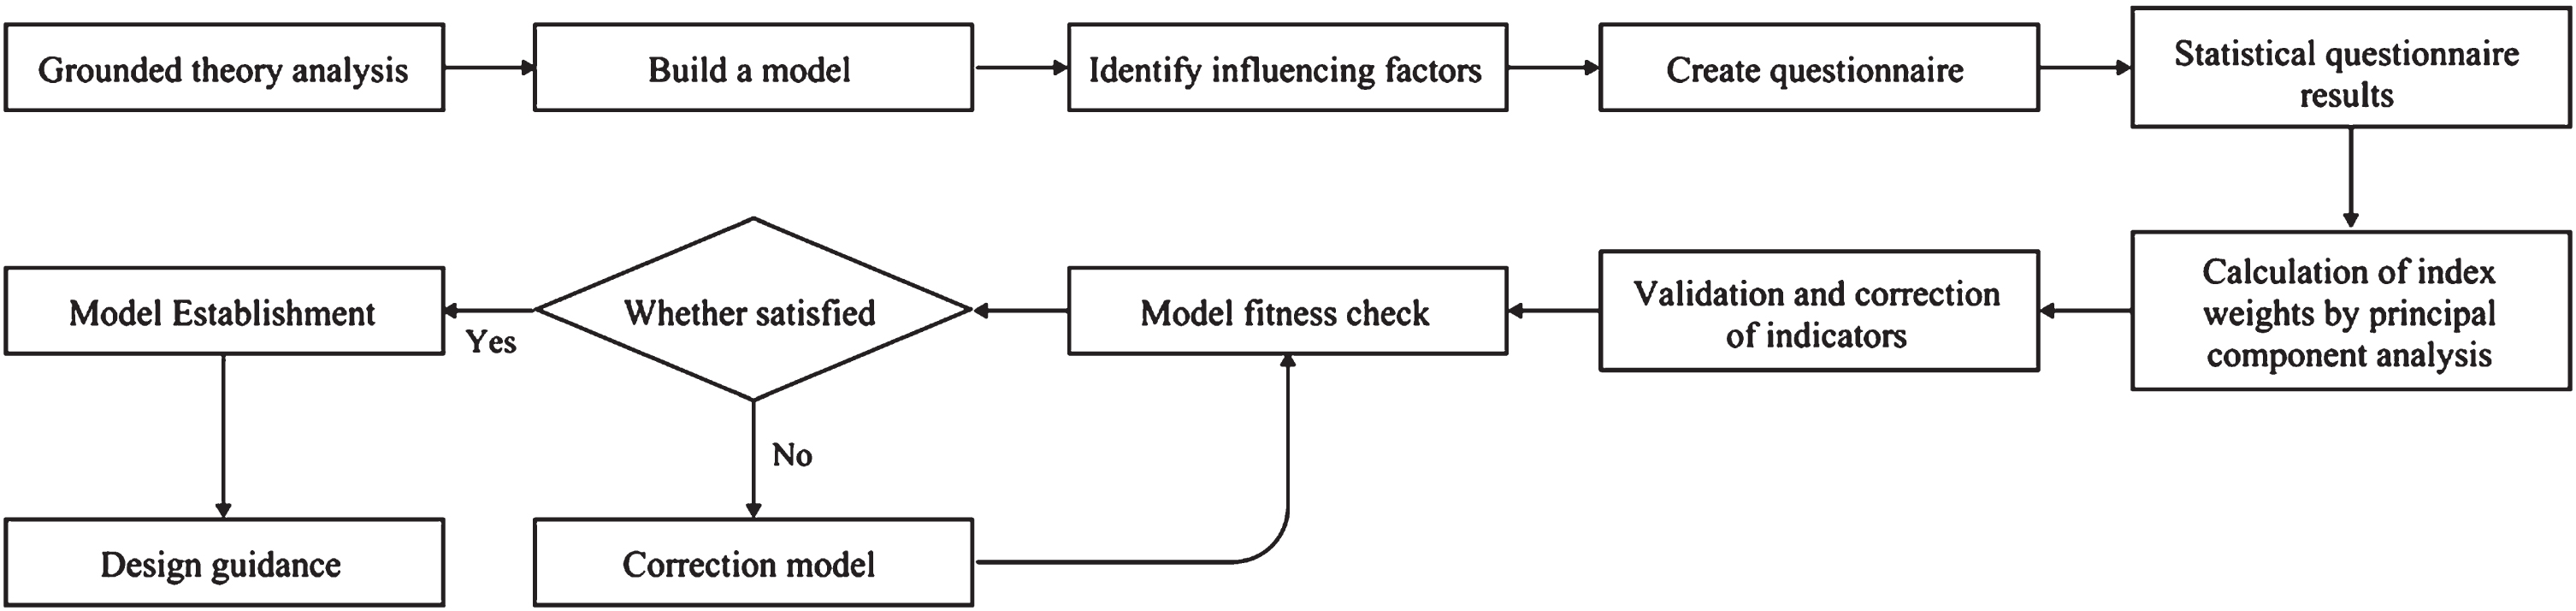
Research design process.
Human-computer interaction is one of the essential processes in the design of accessible products. HCI was first used in 1976 and popularized in the book “The Psychology of Human-Computer Interaction,” [42] published in 1983. The human-machine system is an organic whole composed of a human and the machine they use, i.e., a reasonably functioning system composed of the functions of human and machine communicating with each other, and interlocking and complementing each other. Donghee Shin et al. [43] proposed that in human-machine interaction, algorithmic platforms must improve algorithmic transparency and increase users’ awareness of algorithms through user education and that machines, as part of a human-machine system, must provide positive feedback to users to help them improve the device, creating an excellent positive cycle. [44] Donghee Shin also argued that a human-machine system composed of artificial intelligence should not be just a computer program but an ecosystem interacting with the body, environment, and society. Zheng Huang et al. [45] evaluated user satisfaction and efficiency when operating the device with one hand and two hands using the post-study questionnaire (PSSUQ). Dong-Hee Shin [46] classified user satisfaction into reliability, security, ease of use, and personalization. It proposed an IoT quality-of-experience measurement framework that consists of four main sizes and ten sub-dimensions. In Dong-Hee Shin’s study, the framework can be used to evaluate and compare user experience quality of different IoT devices. In developing and designing human-computer systems, many researchers [47] have also attempted to construct survey instruments such as the System Usability Scale (SUS) to reliably capture users’ subjective assessments of product or service usability. A. A. Karpov et al. [48] argue that most human-computer interactions are designed mainly for experienced users or professional operators. However, usually, they do not apply to older adults and people with limited physical or sensory abilities, which means that human-computer design in accessible products is often not very well developed. Therefore, there is a need to enhance the analysis of human-computer system factors in accessible products.
The model divides the extracted six factors into two human-machine dimensions; in the human-machine system, whether a product can effectively perform its functions and make the service easy to use for the user can influence the user’s willingness to use a product or service. The definitions of perceived usefulness and perceived ease of use explain the cost of time or effort consumed by the user when using information technology in terms of the perceived increase in efficiency compared to the original technology. Perceived usefulness reflects the product’s effectiveness, and perceived ease of use reflects the product’s portability, both of which can be summarized as influencing factors at the product or service (i.e., machine) level. Subjective norms refer to the perceptions of people around the user regarding the value or acceptability of relevant behavioral choices in their lives [33]. According to the TPB interpretation, the level of support from those around them influences the motivation and attitude of the user to engage in the behavior. Perceived behavioral control is defined as the degree of confidence users have in successfully engaging in the behavior [49]. As an outcome factor of TPB, behavioral intention is significantly influenced by subjective norms and perceived behavioral control and directly responds to the user’s performance on behavioral intention. Perceived risk reflects the possible adverse effects that users perceive themselves to be subjected to while using a product. It also affects their satisfaction with service in terms of subjective intention. In summary, at the user (i.e., human) level, subjective norms, perceived behavioral control, behavioral intention, and perceived risk are all more related to the user’s subjective willingness and can all be classified as essential factors in this level. The purpose of dividing the model into human-machine levels is to improve the use of the human-machine system in accessible products, to make up for the deficiency of traditional human-machine interface in general, and to form a more scientific and reasonable design model, to improve users’ satisfaction with accessible products.
Hypothetical user satisfaction is the pleasure, and positive emotions users experience when using a technology or service [50]. It reflects users’ willingness and motivation to continue participating in activities in the future and can measure whether a service meets users’ expectations [51]. In related studies, a certain amount of literature has adopted user satisfaction as a dependent variable for various products [52–54]. This study identified perceived usefulness, behavioral intention, subjective norm, and perceived risk in user satisfaction.
Perceived usefulness (PU)
This variable is one of the most frequently cited variables in the study of user adoption intention behavior. Perceived usefulness is defined by Holden et al. [24] as the subjectively perceived increase in efficiency of the user in using an information technology compared to the original technology. According to the TAM model, users are ultimately willing to use new technology mainly because of its value and perceived usefulness. The effect of perceived usefulness on willingness to use and satisfaction has been verified in related studies [55, 56]. In this study, we define perceived usefulness as the extent to which an individual believes using an accessible product will improve his/her quality of life. When a user has a more positive perception of the usability of an accessible product, he/she is more likely to use the accessible product and will have higher user satisfaction.
H1: Perceived usefulness has a significant positive effect on behavioral intention.
H2: Perceived usefulness has a significant positive effect on user satisfaction.
Perceived ease of use (PEOU)
Perceived ease of use is a relatively common variable in studies of user adoption behavior, defined as the cost of time or effort perceived by the user [57]. Perceived ease of use is defined in the context of accessible product use as the difficulty a user can perceive when using or learning how to use it. In Fred D. Davis’ study [58], the effect of perceived ease of use on user acceptance was verified, and it was found that perceived ease of use also affects perceived usefulness. Wei Liu et al. [59] verified that perceived ease of use significantly positively affected the subjective well-being and satisfaction of older adults using age-appropriate apps. Therefore, we hypothesize that the stronger the user’s perception of ease of use when using an accessible product, the greater their perception of usefulness will be, and they will feel a higher sense satisfaction.
H3: Perceived ease of use has a significant positive effect on user satisfaction.
H4: Perceived ease of use has a significant positive effect on perceived usefulness.
Perceptual behavior control (PBC)
Ajzen [29, 60]. defines perceived behavioral control as the strength of one’s belief in one’s ability to engage in a behavior successfully. According to the TPB model, perceived behavioral control is a belief factor that can directly influence behavioral intention [33]. When a user has a sufficiently high belief factor, his/her willingness to use increases, leading to behavioral engagement. Many studies [30, 61] have been conducted to confirm the effect of perceived behavioral control and willingness to use. In this study, perceived behavioral control is defined as the user’s perception of whether he or she has sufficient conditions or ability to use the accessible product. Perceived behavioral control is considered a subjective feeling of users. We hypothesize that users will have a stronger intention to use accessible products and will increase their satisfaction when they have higher perceived behavioral control.
H5: Perceived behavioral control has a significant positive effect on behavioral intention.
H6: Perceived behavioral control has a significant positive effect on user satisfaction.
Behavioral intentions (BI)
In TPB’s interpretation, behavioral intentions can be defined as the effort people are willing or plan to make to achieve the behavior [33]. According to Ajzen’s interpretation [60], the stronger people’s intentions to engage in a behavior, the more likely they are to persist in it. In this study, behavioral intention is defined as the degree of effort a user subjectively intends to put into using an accessible product. When a user has a solid intention to use a product or service, his/her satisfaction with the behavior increases.
H7: Behavioral intention has a significant positive effect on user satisfaction.
Subjective norms (SN)
Subjective norms are defined as the degree of support for those more important to them as perceived by the individual user [62]. In this study, subjective norms were defined as whether the use of accessible products would receive influence from friends, relatives, colleagues, or people who are important to them. T. Nicole Kirk and Justin A. Haegele [33] verified the significant effect of subjective norms and users’ positive intentions toward behavior. Based on the interpretation of the TPB model, we hypothesize that users are more likely to be willing to use an accessible product and have a positive attitude toward the behavior when the people around them support their behavior.
H8: Subjective norms have a significant positive effect on behavioral intention.
H9: Subjective norms have a significant positive effect on user satisfaction.
Perceived risk (PR)
Perceived risk is a combination of uncertainty and the severity of the outcome involved [34]. J. PAUL PETER [35] believes that perceived risk directly impacts user acceptance of a product. In this study, perceived risk is defined as the likelihood and unpredictability of impending risk perceived by users when using accessible products. Perceived risk is classified into functionality, privacy, and security. We hypothesized that the higher the subjective risk perceived by users while using the accessible products, would correlate with a decrease in satisfaction with the behavior and would subsequently generate unpleasant emotions.
H10: Perceived risk has a significant negative effect on user satisfaction.
Data analysis and results
Data collection and sample data
The sample data for this study was obtained from 54 users who were using or had used the accessibility product. In the first phase, a pilot study was conducted with 50 online users to refine the statements used in the questionnaire and conduct validity and reliability tests. Based on the pilot study, the second phase of the study was conducted with a sample of 352 users who are using or have used accessible products. Through a web-based questionnaire, we put the questionnaire to staff who are engaged in accessibility design and a group of disabled people with different characteristics and needs, and the main distribution areas of the research subjects are Wuhan, Beijing and Hangzhou cities in China. The conceptual model for the variable measurement study included routine information about the individual, six independent variables, and one dependent variable. Three questions measured each variable, and in all questions, we used a 7-point Likert scale for scoring (a score of 1 indicates strong opposition to the statement, while a score of 7 indicates strong agreement). All questions used in the survey were selected and optimized from the literature review, and the questions and sources used in this study are shown in Table 1.
Question items and sources used in the questionnaire
Question items and sources used in the questionnaire
A total of 352 questionnaires were distributed in this study, and after excluding incomplete and unqualified questionnaires, the total valid sample was 339, and the effective rate of the questionnaire was 96.3%. In the questionnaire, the proportion of male participants was 51.9% and females 48.1%; the most significant proportion was between 21 and 30 years old, 30.4%; corporate employees were the main participants of this questionnaire, accounting for about 46.3%; in terms of education, the most extensive base of users received undergraduate education, accounting for 33.9%; in terms of monthly income level, 17.1% of participants belonged to the range of 9001 15000 RMB. To summarize, the data shows that the main group participating in the survey is between 21 and 30 years old, most of whom are corporate employees. This group of consumers is more curious about new items, has specific purchasing power, and has better transferable software usage skills. These people use accessibility features more frequently and will become one of the main groups of accessibility product users in the future. The specific information of the sample’s descriptive statistics is shown in Table 2.
Description of statistical quantities
Description of statistical quantities
In this study, a full scale containing 21 items was established. In order to ensure the internal consistency of the scale, the internal consistency reliability Cronbach’s Alpha values of each variable were calculated using SPSS 27. 0 software for internal consistency testing before conducting exploratory factor analysis, and the results of the reliability analysis of the variables are shown in Table 3. Cronbach’s alpha is greater than 0. 7. The result is considered to be in the ideal range. The combined reliability CR values of each potential variable are more significant than 0. 8, which indicates that the data quality of this research is good and the reliability is high.
Reliability analysis
Reliability analysis
KMO and Barlett’s sphericity test
KMO and Bartlett’s sphericity test was used to test the suitability of the questionnaire results for SEM analysis [75]. The KMO and Barlett’s sphericity tests were performed on the total table, and the validation results are shown in Table 4, with a KMO value of 0.751, which is greater than 0.7, and a Barlett’s sphericity test chi-square value of 6234.345. The significance level was 0.000 < 0.001, indicating that the statistical tests for the total table were significant and that the dimensions were suitable for validity analysis.
KMO and Barlett’s spherical test for user satisfaction
KMO and Barlett’s spherical test for user satisfaction
Exploratory factor analysis was performed on the samples, as shown in Table 5, and Fig. 5 shows the Mgravel diagram. The factors were extracted by the principal component analysis method, and the cumulative variance contribution rate reached 87.994%, indicating that the original data could be more adequately reflected by the public factors extracted by the orthogonal rotation method, and the final seven were extracted. The factor composition is consistent with the hypothesis proposed in the model, indicating that user satisfaction has good structural validity.
Total variance explained
Total variance explained
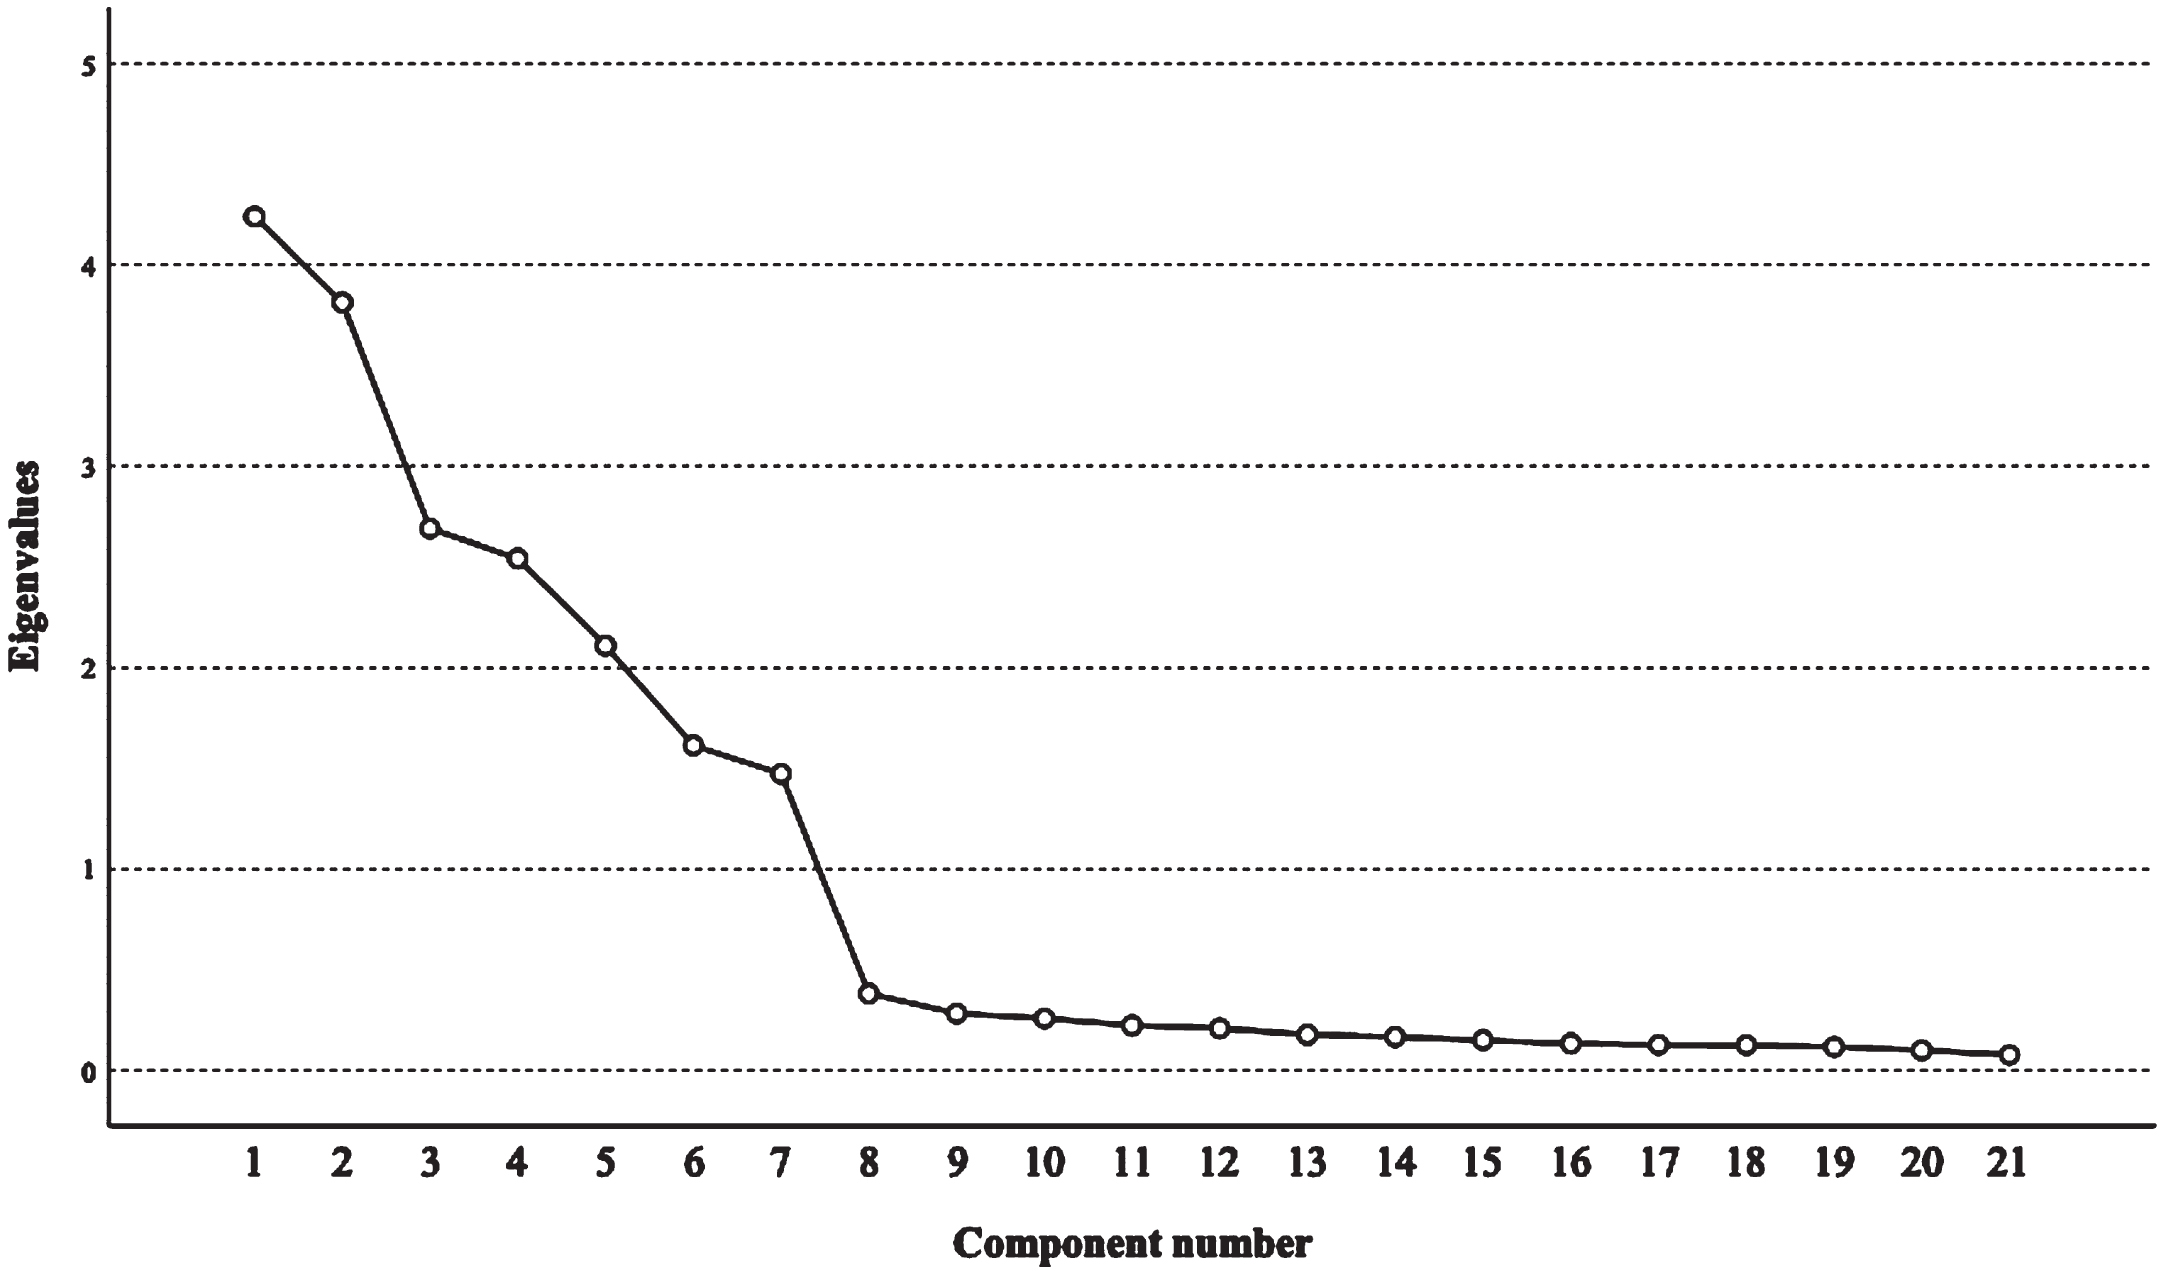
Mgravel diagram.
Structural validity
In this study, a factor model of factors influencing user satisfaction with accessible products based on the results of exploratory factor analysis and validated factor analysis was conducted by AMOS 28.0 software. The fitting results of the factor model are shown in Table 6.
Table of overall fitting coefficients
Table of overall fitting coefficients
From Table 6, the value of CMIN/DF is 3.262, which is less than 3.5, with acceptable adaptation; RMSEA is 0.082, which is less than 0.085, with good adaptation; GFI is 0.869, which is greater than 0.85, with ideal adaptation; AGFI is 0.825, which is greater than 0.8, with good adaptation of results; IFI is 0.937, which is greater than 0.9, with good adaptation of results. The CFI is 0.937, greater than 0.9, and the results are well adapted; the TLI is 0.923, greater than 0.9, and the results are well adapted. Collectively, the overall model fit of the model is good.
In this study, CFA analysis was performed for all dimensions, and the six dimensions of the model were PU, PEOU, PBC, BI, SN, PR, and SA, and the loadings for all dimensions ranged from 0.65 to 0.9 and reached significance. Their compositional reliabilities ranged from 0.6 to 0.9, respectively, and the mean-variance extractions ranged from 0.71 to 0.86, meeting Fornell and Larcker’s [76] criteria: factor loadings greater than 0.5; compositional reliabilities greater than 0.6; mean-variance extractions greater than 0.5; and the square of the multivariate correlation coefficient greater than 0.5. All dimensions of this model meet the criteria, so all seven dimensions have convergence calibration.
Potential conformational surface confidence analysis
Potential conformational surface confidence analysis
As can be seen from Table 8, there are significant correlations between PU, PEOU, PBC, BI, SN, PR, and SA (p < 0.01), and in addition, the absolute values of the correlation coefficients are less than 0.5 and all are less than the square root of the corresponding AVE. The latent variables were correlated with each other and distinguished from each other, indicating that the scale data were ideal in terms of the degree of separation.
Degree of the zone distribution
Degree of the zone distribution
*Represents a p-value less than 0.01; the diagonal line is the AVE evaluation variance extracted.
According to Table 9 and Fig. 6, it can be seen that 7 of the described paths are significant, which contain five positive effects and two negative effects. Among the seven path coefficients, perceived usefulness (PU), perceived ease of use (PEOU), perceived behavioral control (PBC), behavioral intention (BI), and subjective norm (SN) have significant positive effects on user satisfaction (SA) of accessible products, which indicates that considering these factors and designing them in a targeted way when designing accessible products can improve user satisfaction. Perceived risk (PR) has a significant negative effect on user satisfaction (SA), which indicates that when designing accessible products, it is necessary to consider reducing users’ perceived risk factors to improve user satisfaction. Perceived ease of use (PU) has a significant negative effect on perceived usefulness (PEOU), which indicates that the functionality of accessible products decreases as the ease-of-use increases.
Hypothetical path
Hypothetical path
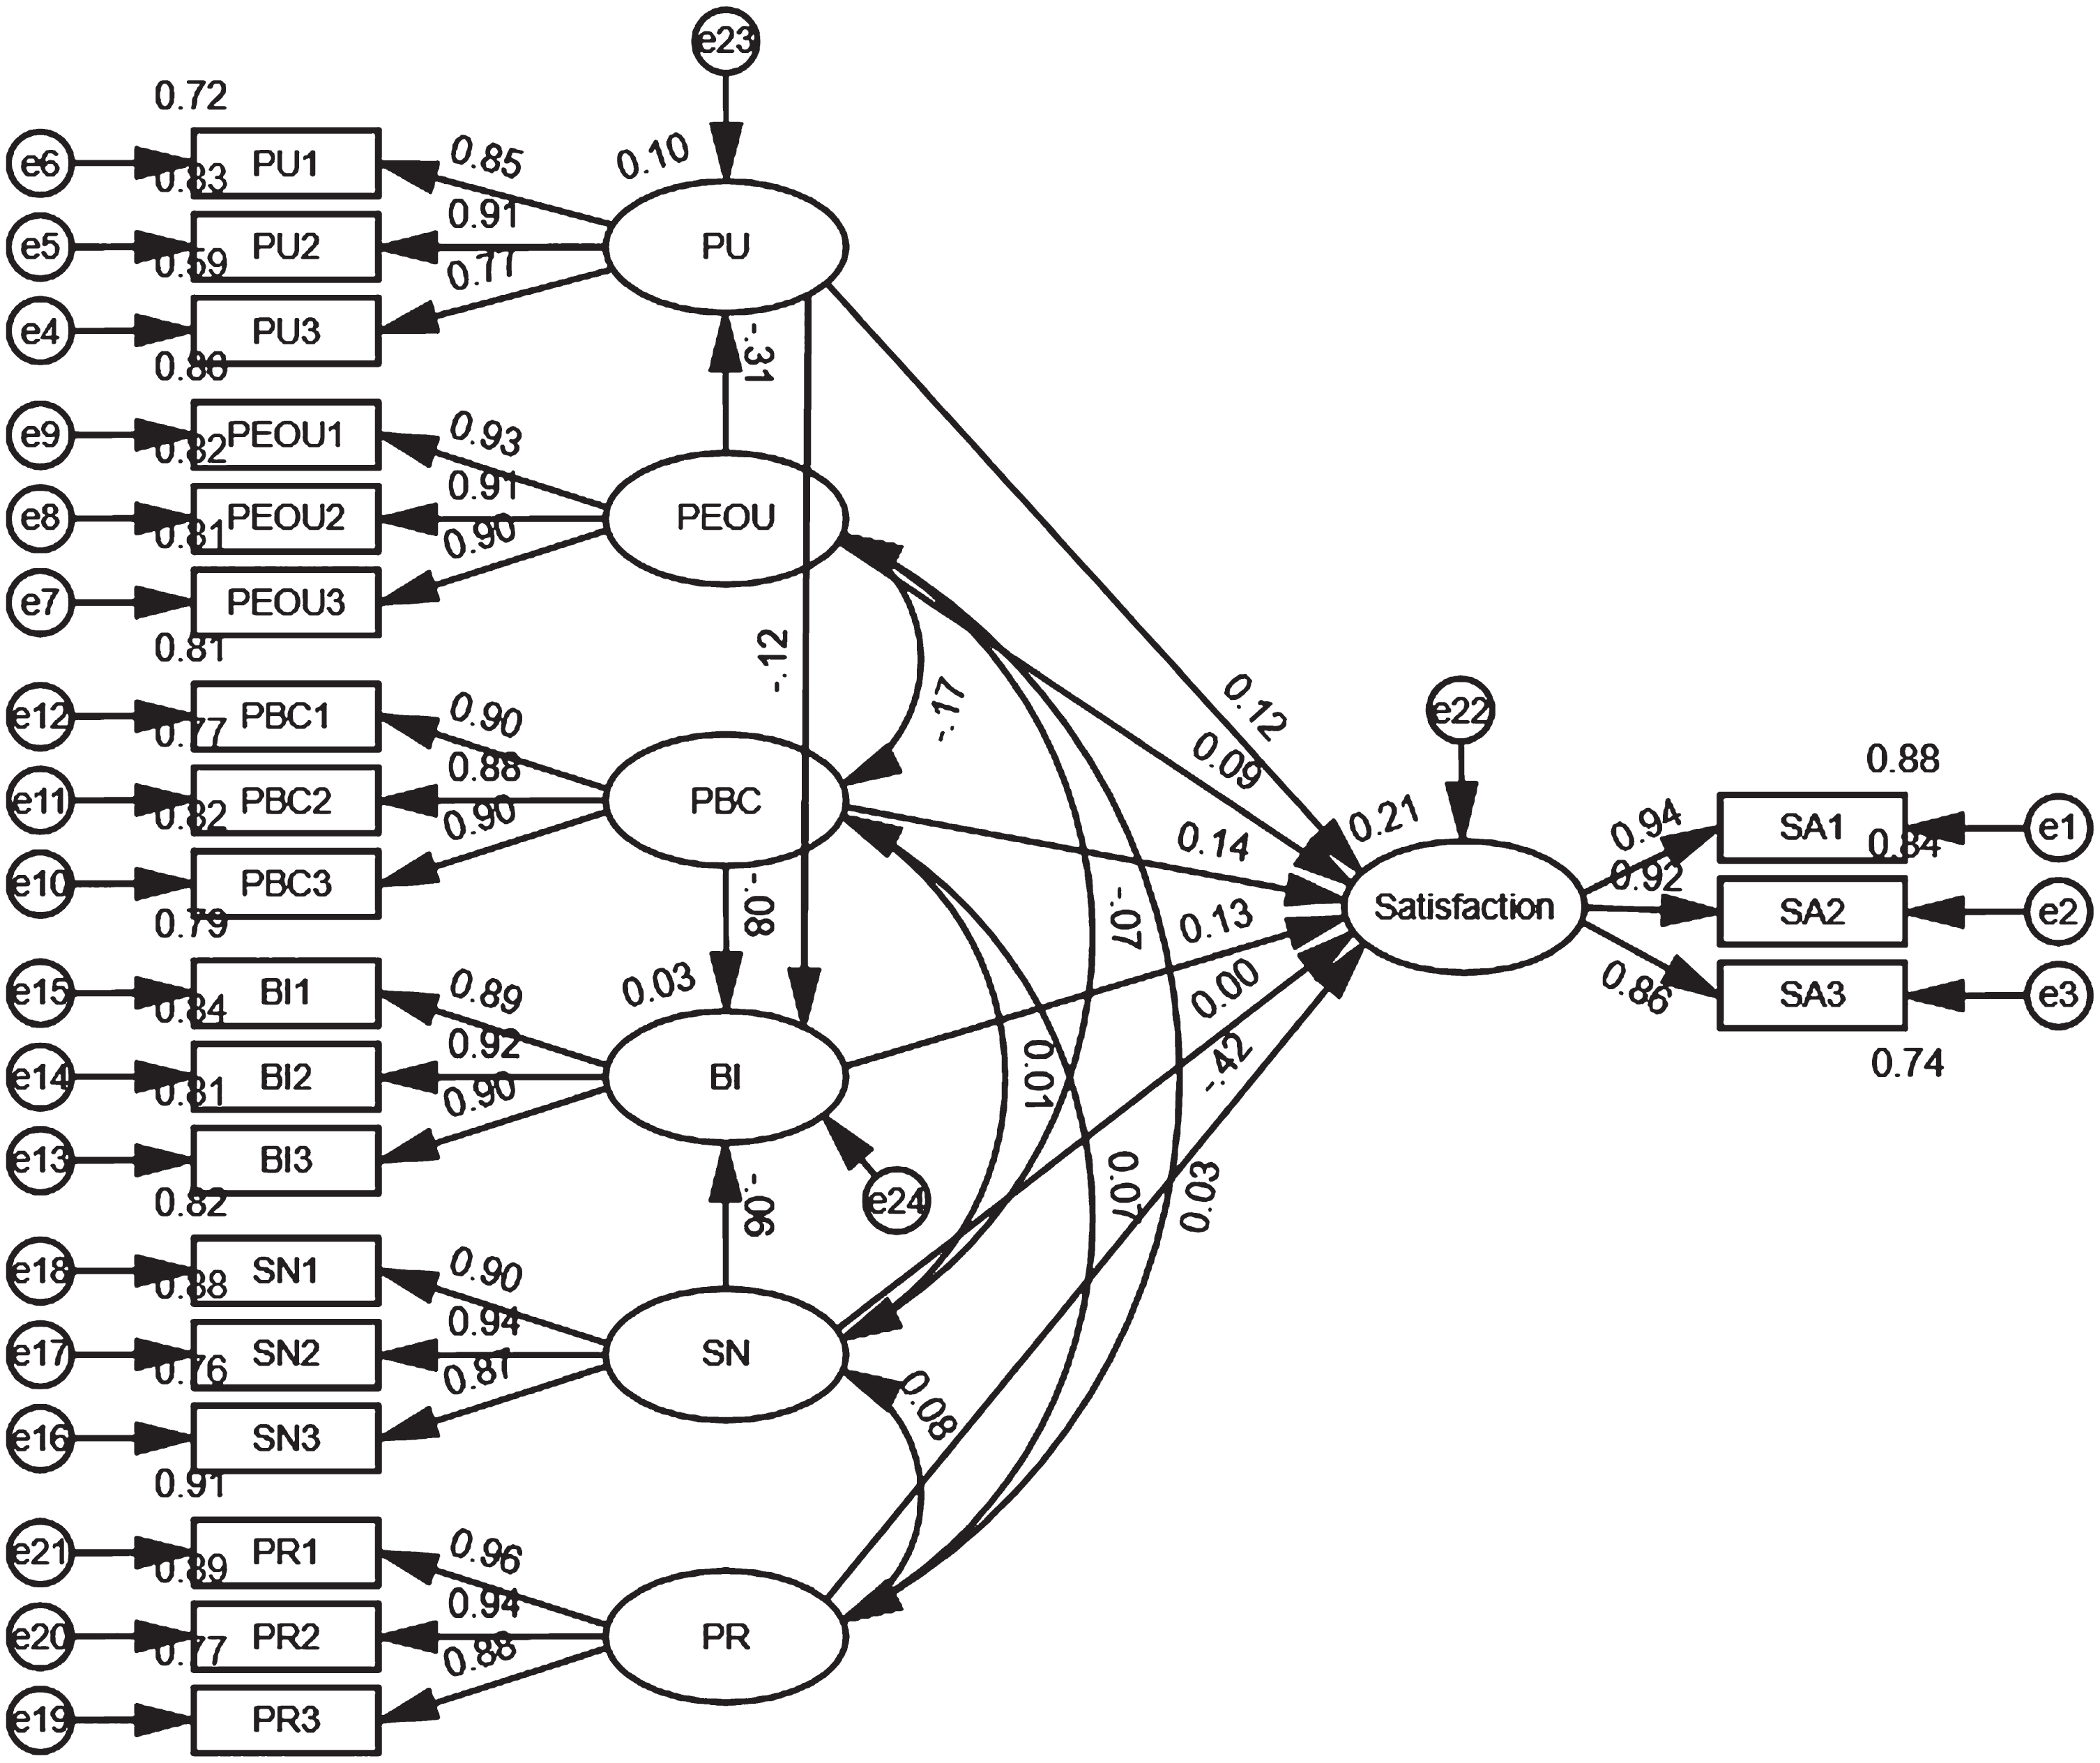
Structural equation model.
This study focuses on the data from the formal questionnaire survey, and the empirical analysis of user satisfaction with accessible products was conducted based on SPSS 27.0 and AMOS 28.0. It includes testing the reliability validity, factor analysis, correlation analysis, and regression analysis to test the relationship between variables, and finally, validate the research hypothesis proposed in this study based on the results. According to the results of data analysis, as shown in Table 10, among the hypotheses proposed in this study, six were valid, and four were not. H1, H4, H5, and H8 were rejected, while H2, H3, H6, H7, H9, and H10 accepted the hypotheses. Among them, perceived usefulness (PU), perceived ease of use (PEOU), perceived behavioral control (PBC), behavioral intention (BI), and subjective norm (SN) were positively correlated with user satisfaction (SA) (H2, H3, H6, H7, and H9) were verified and significant. Furthermore, the results show that perceived usefulness (PU), subjective norm (SN), and perceived behavioral control (PBC) are negatively correlated with behavioral intention (BI), and perceived ease of use (PEOU) is negatively correlated with perceived usefulness (PU), so H1, H4, H5, and H8 are not valid.
Hypothetical results of this study
Hypothetical results of this study
According to Table 9, the five path coefficients shown are positive. Behavioral intention, perceived behavioral control, perceived usefulness, perceived ease of use, and subjective norms all have significant positive effects on user satisfaction with accessible products, which indicates that reasonable improvements in these five areas can increase user satisfaction. The magnitude of the regression coefficients (estimated values) indicates that the degree of influence on user satisfaction is behavioral intention > perceived behavioral control > perceived usefulness > perceived ease of use > subjective norm. As a user-level factor, behavioral intention positively impacts user satisfaction with accessible products. It has the most considerable impact, which indicates that behavioral intention plays a more significant motivational role in the use of accessible products by users. Specifically, behavioral intention, as the user’s willingness to use a product or service, explains the effort and cost the user is willing to put into the accessible product (BI1). For the disabled population, if the functionality of an accessible product involves all aspects of the user’s usage needs (BI2), the impact of the disabled user’s demand for the accessible product will become greater (BI3). The perceptual behavior control is mainly reflected in the conditions that users need to use accessible products, such as purchasing power (PBC1) and mastery of accessible products (PBC2, PBC3). If an accessible product has a better price and lower usage requirements (e.g., age and gender restrictions), then user satisfaction with the accessible product will increase. When targeting groups with similar impairments, designers need to consider combining the everyday needs of multiple groups and designing universal features. Subjective norms have the lowest impact on user satisfaction, which suggests that user satisfaction with accessible products is mainly unaffected by the attitudes of those around them and is more determined by users’ subjective thoughts. Therefore, when designing accessible products, designers should focus more on primary users.
At the product level, perceived usefulness, as a manifestation of product functionality, has a positive impact on user satisfaction, which means that a good design for product functionality (PU1, PU2) and use effectiveness (PU3) can have a motivating effect on user satisfaction when conducting accessible product design. In the face of different production needs of users in different scenarios, designers can find different linked scenario needs and extend product functions while satisfying core scenarios. Designers can also research the original functional modules in-depth to explore diversified and multi-dimensional user experiences. Perceived ease of use explains the degree of difficulty that users can feel when using accessible products. When users feel that using accessible products is easy, their satisfaction with them will also increase. Specifically, it is expressed in the product’s use process (PEOU1), use interface (PEOU2), and use difficulty (PEOU3). Users will have a more substantial enhanced user experience when they face clear content presentation and easy operation. Gudigantala et al. [77] also confirmed that user perceptions of the effectiveness of intuitive interface information contribute to increased efficiency of use and user satisfaction. When developing the service flow of product functions, designers can consider simplifying the functions, optimizing the information layout of the product interface, and guiding the user through the process of use to help users master use of the functions more quickly.
In this study, perceived risk was confirmed to have a significant adverse effect on user satisfaction, which is in line with J. PAUL PETER [35]. In the era of rapid development of information technology, more and more accessible products began to appear in people’s lives. On the one hand, accessible products bring convenience to people. However, on the other hand, users may also encounter potential risks of privacy leakage or personal safety when using accessible products, such as electronic products using wearable technology. These wearable devices assist walking, which may bring unnecessary trouble or even danger to users. Therefore, the safety and reliability of accessible products are essential to users. Designers should consider choosing a function implementation with higher safety when designing accessible products or providing emergency services in response to extraordinary situations.
Accessible product design strategy
Accessible products bring various aspects of convenience to people with disabilities and address users’ usage needs in different scenarios. Therefore, this study translates the results of user satisfaction analysis of accessible products into an accessible product design strategy based on a human-machine framework. As shown in Fig. 7, we propose an accessible product design strategy consisting of users and products divided explicitly into user requirements, cost and risk, usability, and ease of use.
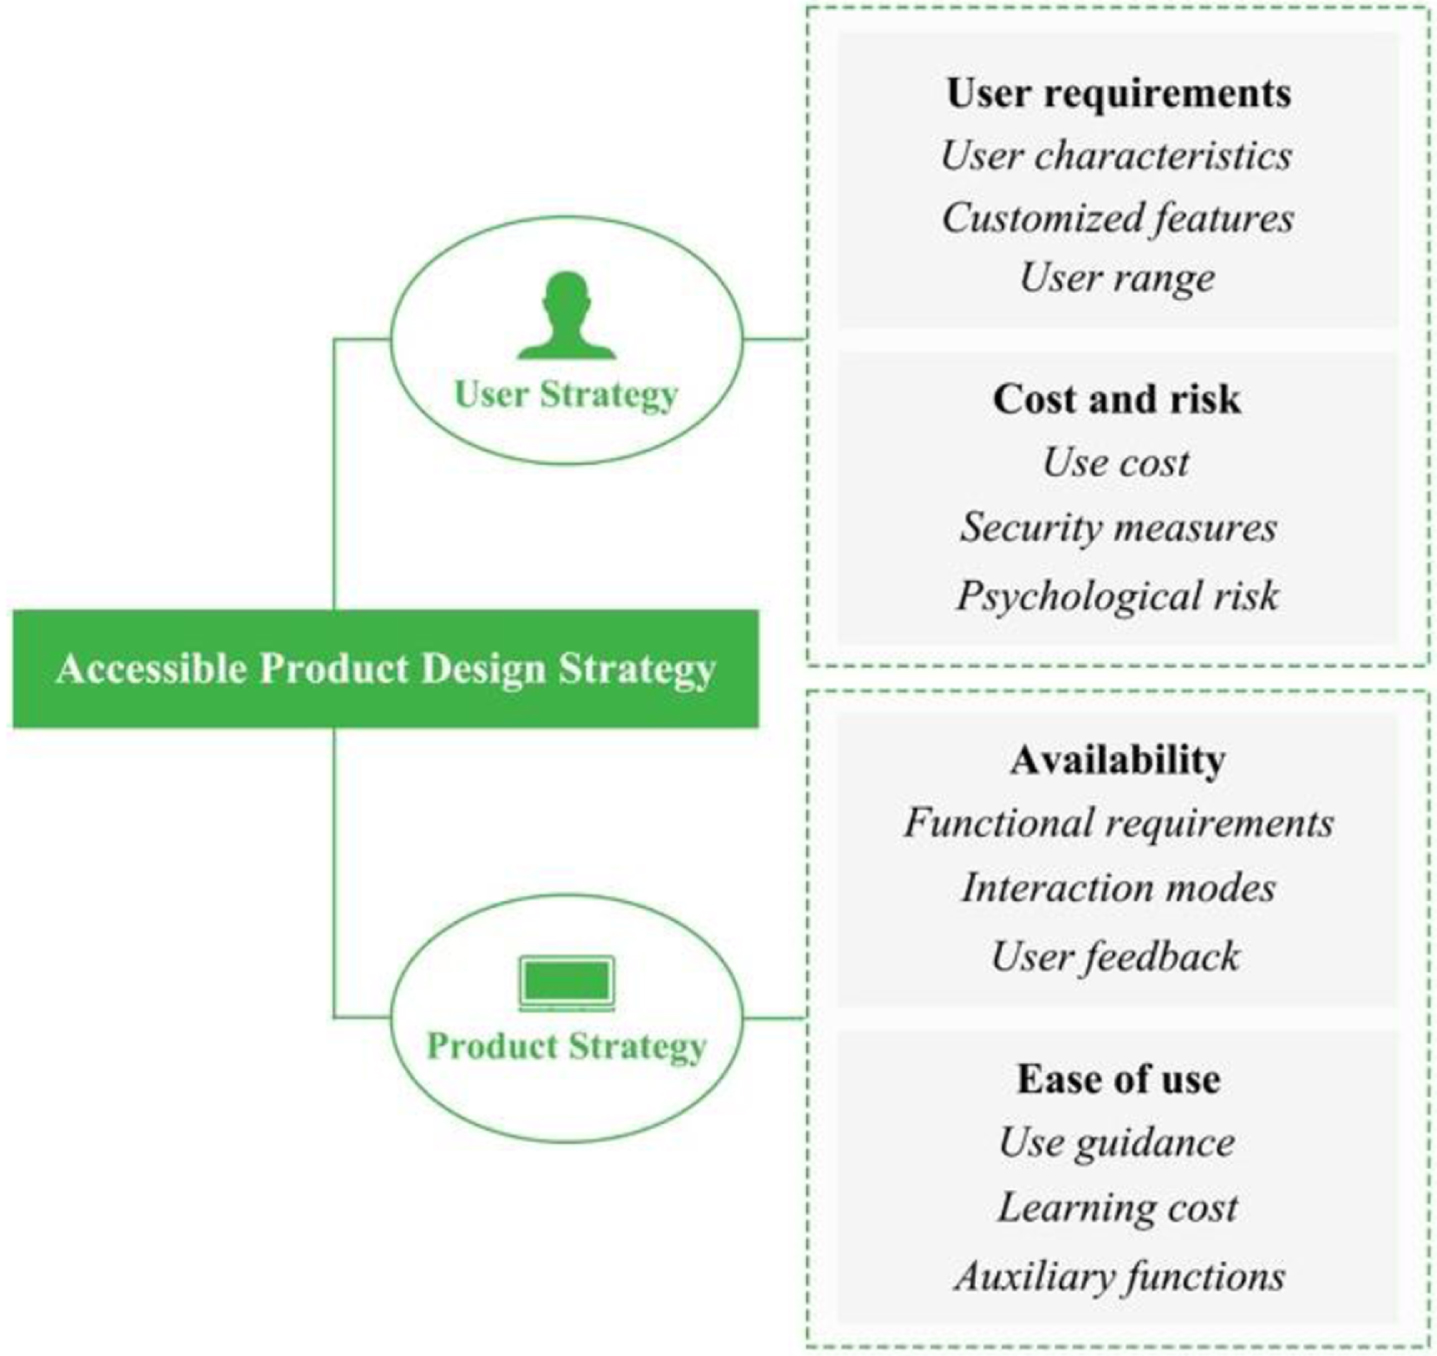
Accessible product design strategy.
From this study, it can be concluded that, as an internal factor of users, whether users’ needs are designed in a targeted manner has a significant impact on user satisfaction. In accessible product design, users’ needs may be diverse and will be influenced by their characteristics. When choosing accessible products, users with disabilities also focus on whether accessible products can guarantee their health, privacy, and other safety issues. Therefore, the relevant design strategies for the user level are asfollows: User requirements
User characteristics: When designers design for different segments of users, for example, the hearing-impaired population, they must develop differentiated functions for severe and medium-severe hearing loss and need to provide more targeted services for users. Specifically, these can be: set before users use the accessible products, set to different degrees of impairment, and when in use, the system will automatically match the corresponding operation difficulty of the accessibility service content. For other disabilities, when in use for more severe impairments, a more substantial functional effect will be set, such as brightness, sound, touch. Customized features: provide users with available customization services, and users can develop and modify product features according to their actual needs, which can increase the familiarity and trust of disabled users for the product, thus increasing their sense of security, specifically as: users can set, for example, the tone of the voice and the speed of speech according to their habits and preferences. Users can also set the language attributes according to the type of language or dialect. User range: The range of users covered by accessible products is expanded as much as possible to solve the needs of users of different age groups, different genders, or different professions as much as possible. Specifically, the accessible system can research the characteristics and needs of users according to age, gender, and region and then form a speech recognition library corresponding to them, including slang words and professionalterms. Cost and risk
Use cost: By reducing the cost as much as possible in the product design, reasonably choosing the product material and function realization method, extends the use cycle of the product, reduces the price of accessible products, precisely controls the cost of product design and processing cost, and uses artificial intelligence technology instead of manual functions to save product operating costs. Security measures: The accessibility product design process, considers design for the needs of emergency scenarios, as well as to avoid access to the user’s privacy during use, specifically: when the accessibility product recognizes an argument, noisy or aggressive environment, or physical actions with aggressive behavior, it will ask the user’s security status, and then take measures such as warning and alarm. Psychological risk: The target user’s barrier behavior is likely to trigger their psychological burden, especially in social and other scenarios, so accessible products should focus on the psychological construction and emotional needs of users, specifically these can increase the reward mechanism in the process of guidance and service, use language incentives, point out growth and other positives to reduce the negative emotions of disabled users, increase self-identity, and optimize the subjective norms.
Product strategy
Whether accessible products can effectively and qualitatively achieve their functions is an essential factor affecting user satisfaction. When designing accessible products, designers need to prioritize product functionality as a design point, fully consider the specific needs of users in different scenarios during the design process, and develop targeted product functions. Relevant design strategies for the product level follow. Availability
Functional requirements: The product functions need to be adapted to the specific needs of users in different scenarios and realize many different users’ needs through one accessible product. For example, the combination of sign language recognition and voice translation can meet the needs of continuity and two-way communication for people with language impairment so that people with language impairment can be facilitated in the scenarios of confession, explanation, and inquiry. Interaction modes provide users with a variety of alternative forms of interaction. The combination of multiple technology forms can improve the compatibility and fault tolerance of the accessible products to provide further functionality to the usability of the products. For example, accessible products can add gesture interaction, voice interaction, and other interaction modes of adaptation so that users with language barriers can use gestures for personal expression. User feedback: Positive and accurate user feedback can improve the efficiency of disabled users, make up for their lack of comprehension and behavior, form user experience faster, and improve the product’s usability. For example, accessible products can set up a misoperation reminder function to regularly guide the correction of users’ wrong usage behaviors; collect feedback from users with disabilities to optimize the design of the service system. Ease of use
Use guidance: to guide the user’s use process, develop the corresponding use of tutorials, and help users to master the use of accessible products faster. Guidance can be based on the user’s impairment to combine sound, visual, tactile, and other multimodal forms. Learning cost: Simplify the function and use process, reduce the learning cost to users, help different types of groups have a good experience of using accessible products, simplify the operation steps of users as much as possible in the service process, and complete the tasks based on natural interaction, for example, biometric technology such as face or fingerprint can be used to open the service and use voice for function selection. Auxiliary functions: Develop more auxiliary functions for users with difficulties using accessible products, such as online human services and real-time generation of suggestions for using accessible products.
Design case
Based on the results of this study, we summarize the product design strategies for accessibility based on the human-machine framework and demonstrate them using the “LINKED” project as a practical example, as shown in Figs. 8, 9, and 10. “LINKED” is a two-way sign language interpretation product for language-impaired groups. It uses a neural network model as the technical basis to enable offline two-way communication between deaf peopleand others.

Accessible product design for sign language interpretation.
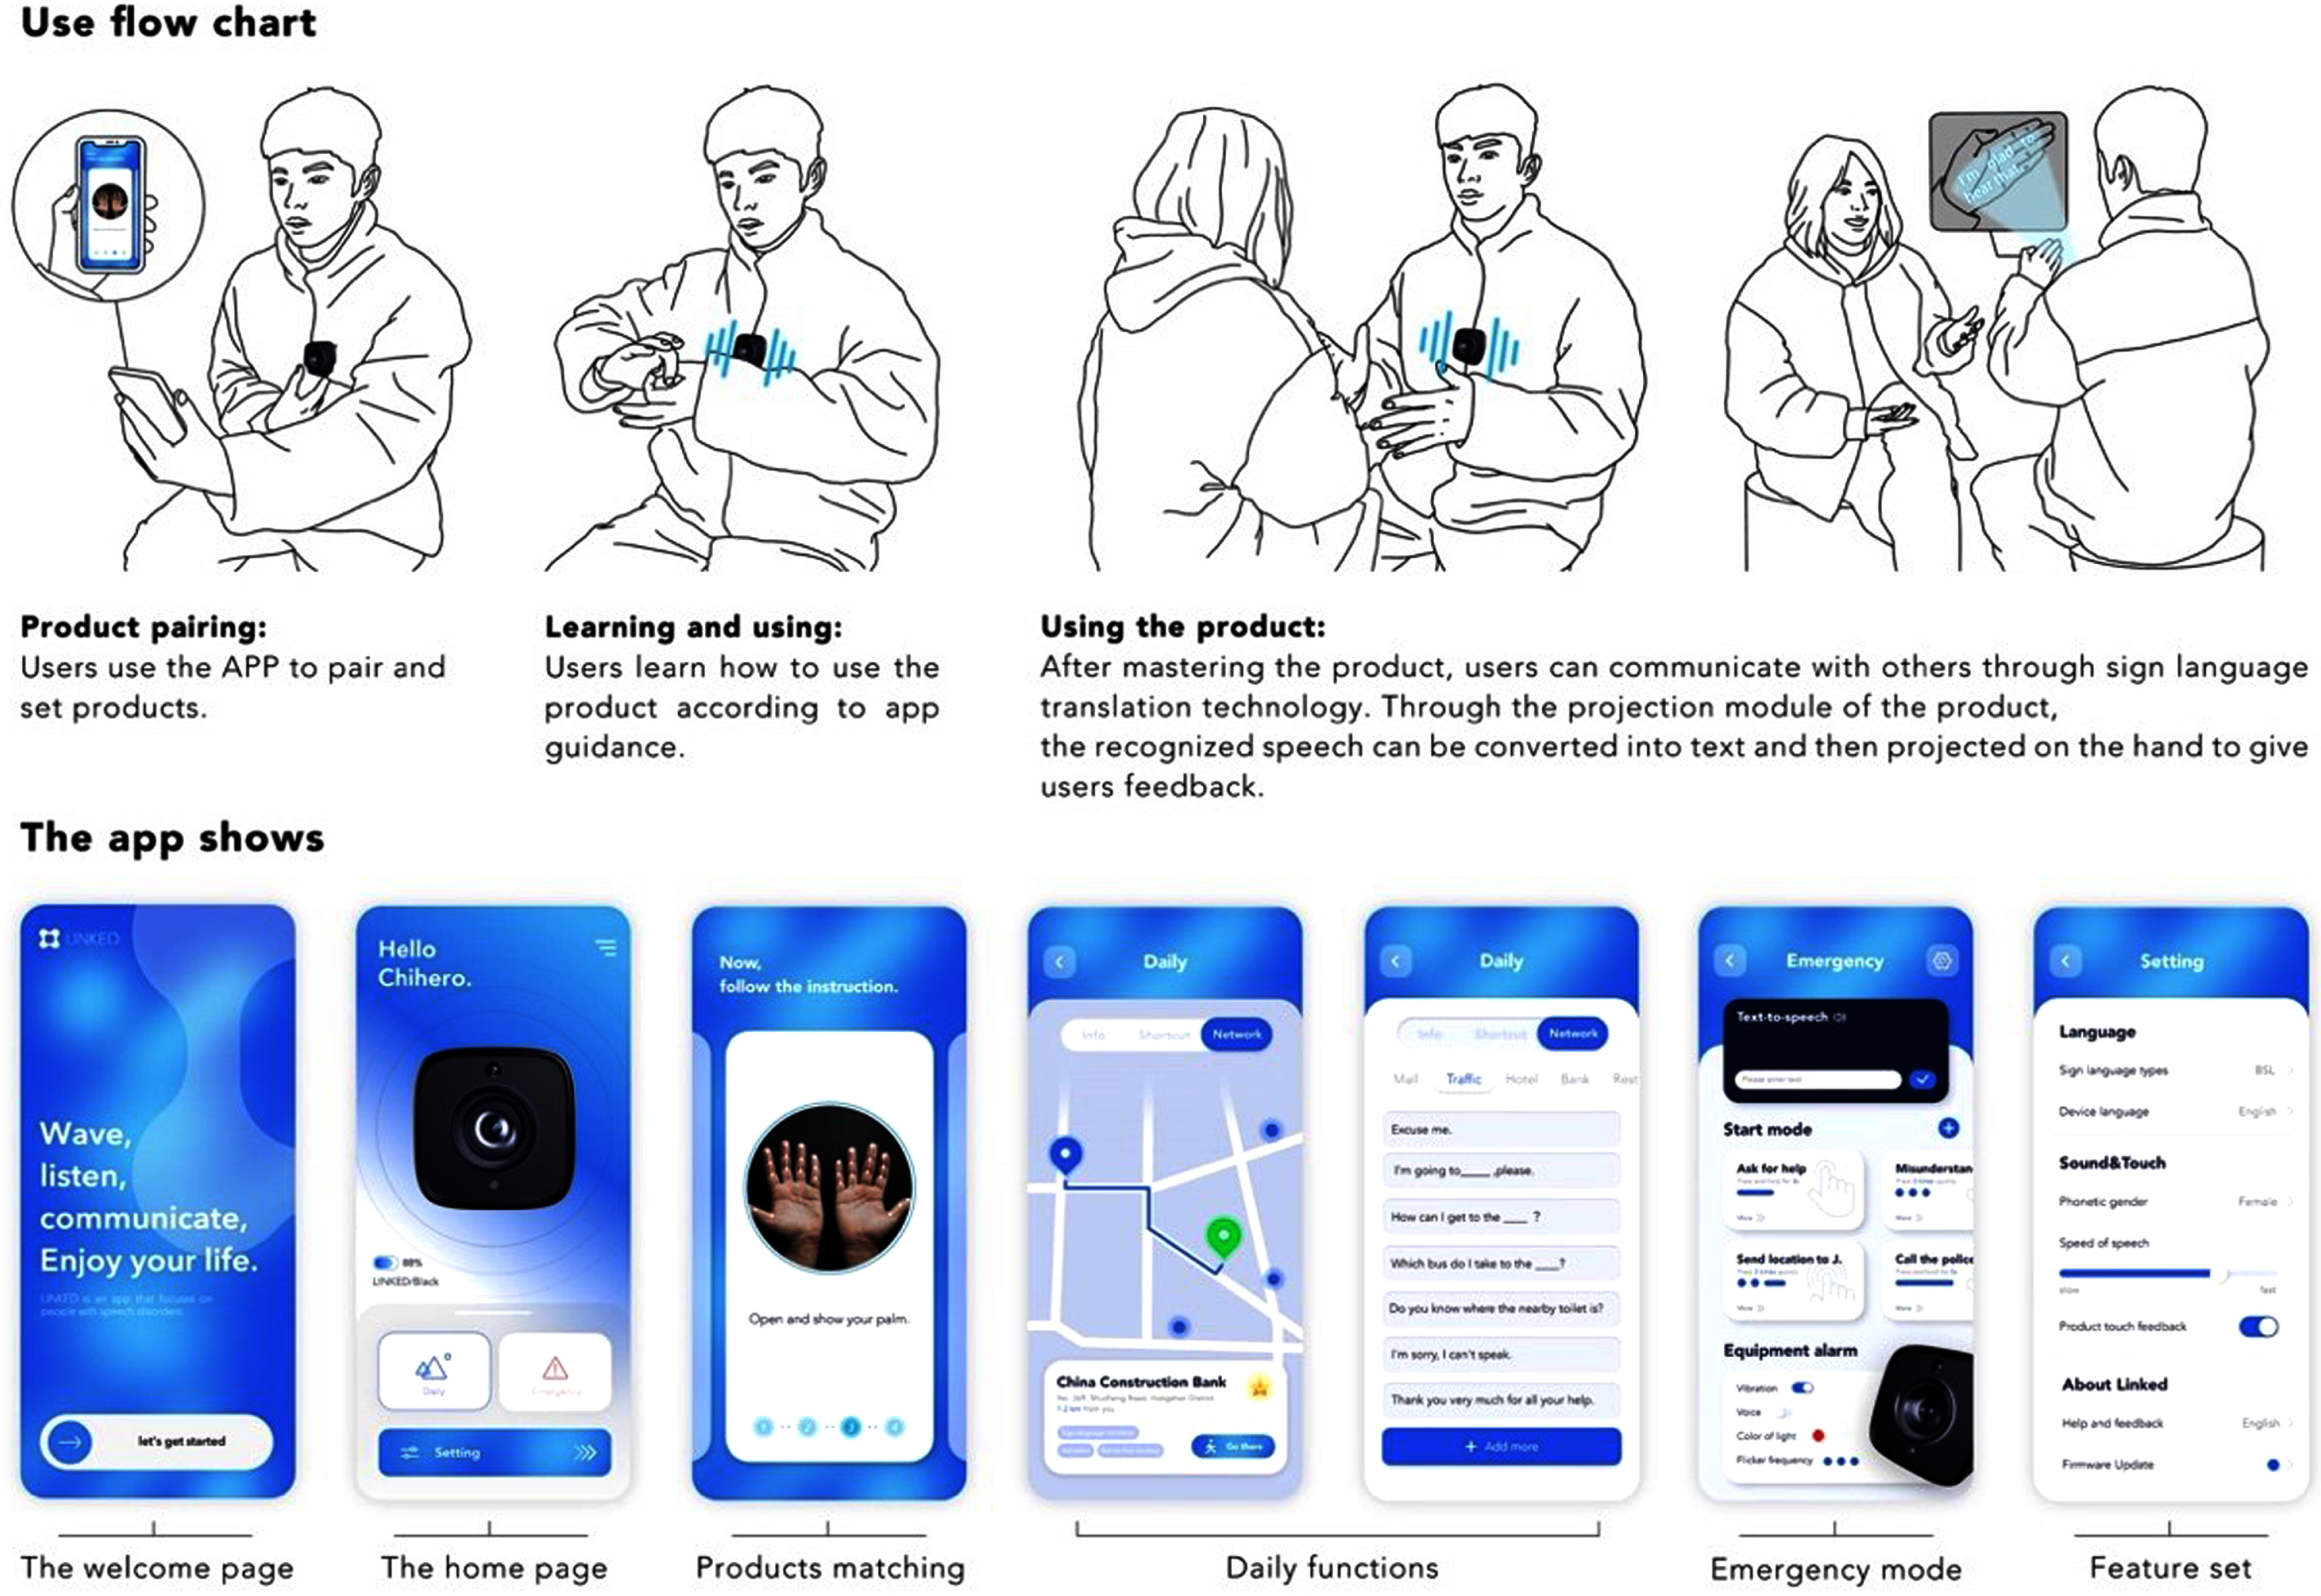
Accessible product use process.
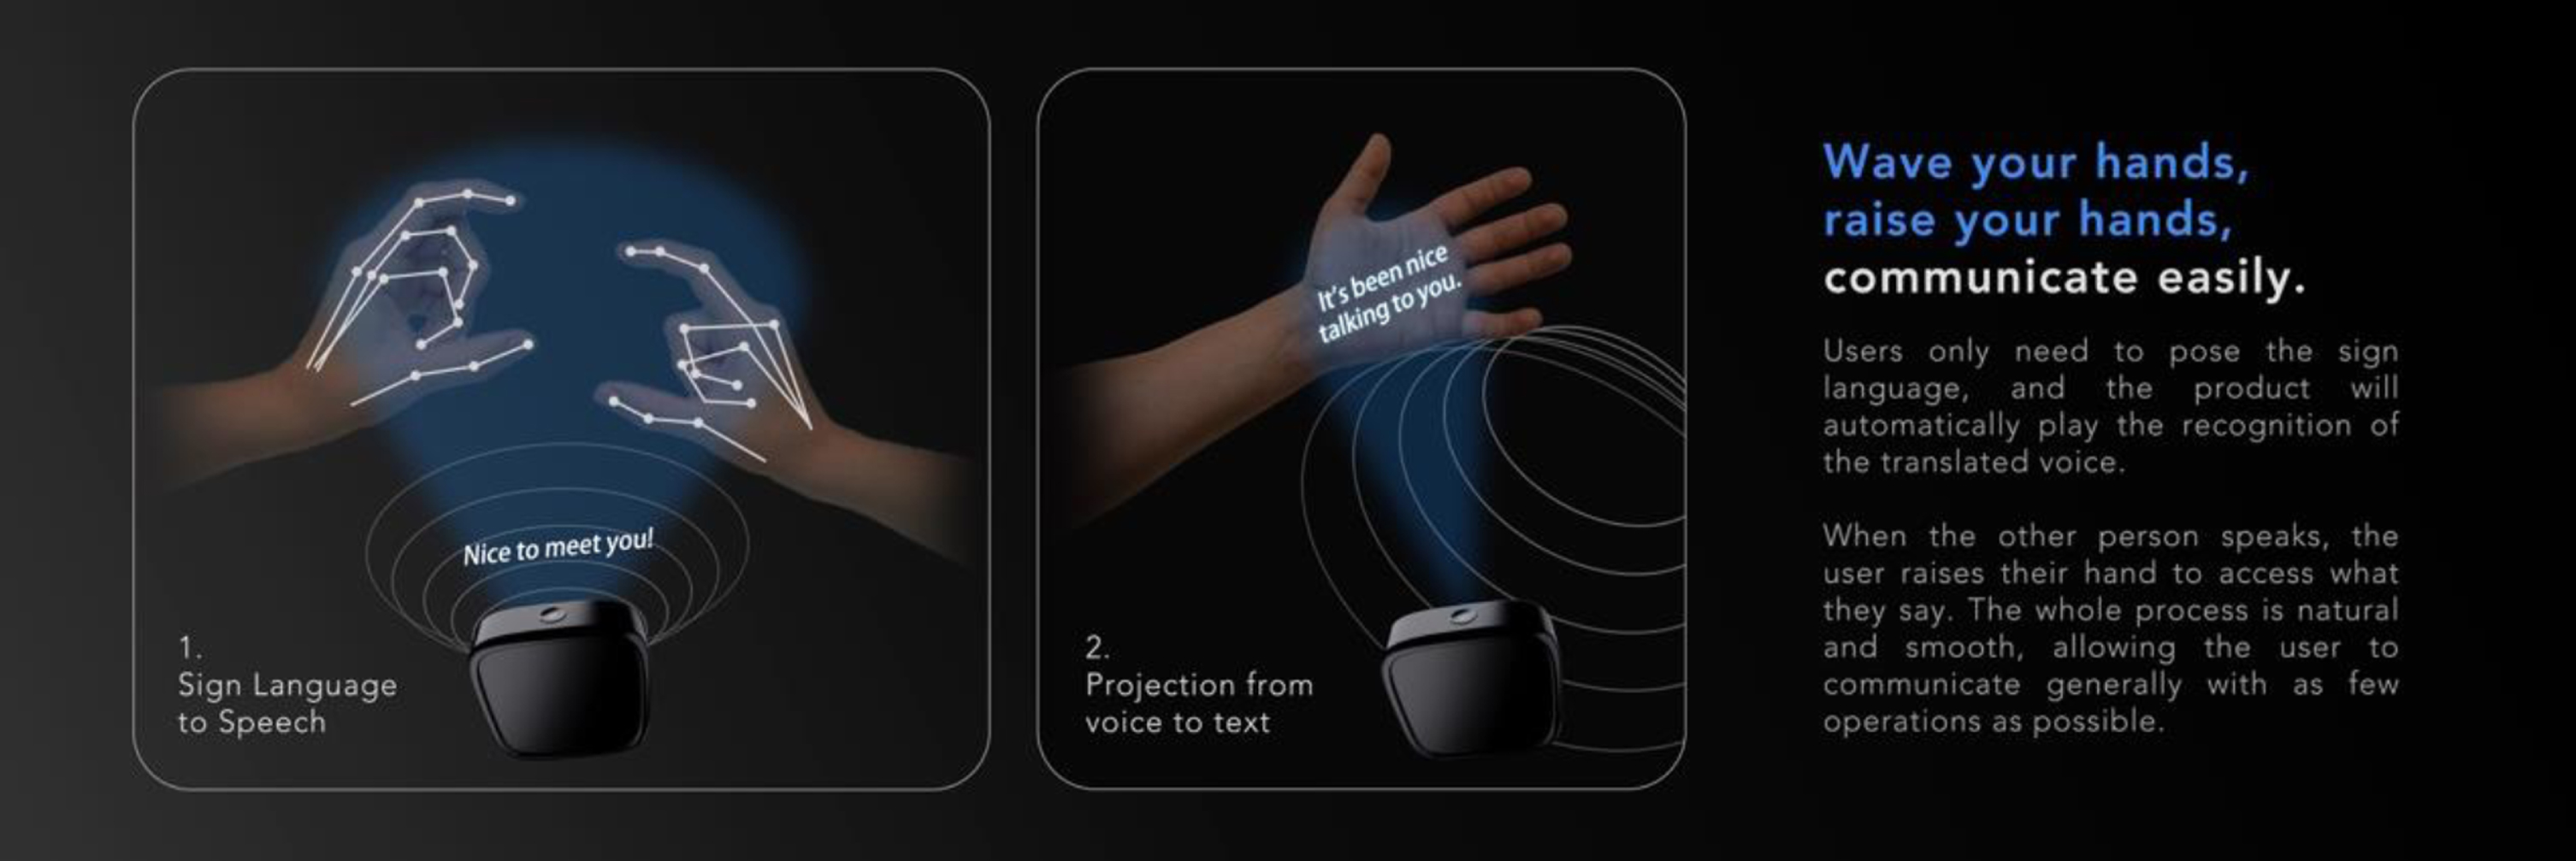
Accessible product function demonstration.
Regarding user needs, “LINKED” is aimed at hearing-impaired people. Its primary function is to help them communicate through sign language recognition, mainly for those who master sign language, but also for deaf people. In addition to daily communication, “LINKED” can be connected to an application that allows users to set the type of sign language, speed, or gender and to choose the personalized settings they need. For safety measures, the app allows users to set up a shortcut voice in emergencies and to make the product send a specified message through different operating gestures, as shown in Fig. 9.
For the design case, we used the post-study system usability questionnaire (PSSUQ), which is used to assess user-perceived satisfaction with different software systems or applications [71]. Fourteen individuals with hearing loss were selected to evaluate the program, and the overall assessment of the usability questionnaire was scored on a 7-point Likert scale. Table 11 shows the mean scores for each question and its corresponding SD. The results show that the existing product received an overall PSSUQ rating of 4.08 on all questions, and “LINKED” received an overall PSSUQ rating of 5.76. The PSSUQ rating means that solutions designed according to an accessible product design strategy received high subjective satisfaction.
Design case score data
Design case score data
“LINKED” uses a high-definition camera to capture the user’s gestures. Through a multi-layer trained neural network, “LINKED” accurately converts sign language information into the appropriate voice message. The synergy between the projection module and the microphone also helps the product recognize what others say, enabling fast two-way communication. The user signs the sign language, and the product automatically plays the recognized translated voice. When the other person speaks, the user raises his or her hand to assess what the other person is saying. The process is natural and smooth, allowing the user to communicate daily with as few operations as possible, as shown in Fig. 10. “LINKED” is magnetically attached to ensure that the product is not easily shaken by body movements during use, further providing stability in gesture recognition. The back plate of the magnetic necklace, worn under clothing, is made of rubber, and its non-slip nature allows it to fit nicely against the skin. For the product’s ease of use, the “LINKED” online app will guide the user during the first use, helping the user to master the use of the product more easily. The app also provides users with various sign language information and courses and supports users in customizing gesture settings.
Design case verification
For the design case, we used the post-study system usability questionnaire (PSSUQ), which is used to assess user-perceived satisfaction with different software systems or applications [78]. Fourteen individuals with hearing loss were selected to evaluate the program, and the overall assessment of the usability questionnaire was scored on a 7-point Likert scale. Table 11 shows the mean scores for each question and its corresponding SD. The results show that the existing product received an overall PSSUQ rating of 4.08 on all questions, and “LINKED” received an overall PSSUQ rating of 5.76. Specifically, when users evaluate the existing products, they rate the products low in compensating for the loss caused by the user’s operational errors. Secondly, the current products must guide the users well in using them, which may represent a higher risk of use and a higher learning cost when using the existing products. According to the design strategy proposed in this study, the product’s functionality, price, and risk need to be targeted in accessible products. In the same dimension, the user’s rating of “LINKED” is significantly improved, which indicates that the accessibility product based on the design strategy of this study can effectively reduce the user’s risk of use and guide the user’s use in a specific way, and reduce the user’s learning cost. The PSSUQ rating means that solutions designed according to an accessible product design strategy received high subjective satisfaction.
Conclusion
This study proposes a new model for accessible products. We examine the relationship between seven potential user satisfaction influencing factors (perceived usability, perceived ease of use, perceived behavioral control, behavioral intention, subjective norm, perceived risk, and satisfaction) based on the TAM, TPB, and PR. We adopted SEM as the research method to classify and study the model factors by establishing a human-machine framework. This theoretical model can quantify the degree of influence of each design element on user satisfaction and further clarify key factors affecting the user experience of accessible products. The results showed that behavioral intention was the high influencing factor, followed by perceived behavioral control, perceived usefulness, and perceived ease of use.
This study proposes a new user satisfaction model of accessible products, which integrates the technology acceptance model, theory of planned behavior and theory of perceived risk, and can reveal the influencing factors of user experience of accessible products more comprehensively and deeply, which provides new ideas and methods for academic research and theoretical discussion in related fields. Secondly, this study adopts SEM as the research method, which can not only classify and study the model factors, but also quantitatively analyze the degree of influence of each design element on user satisfaction, thus further clarifying the key factors affecting user experience of accessible products, including certain scientific and operability factors. In the accessibility product satisfaction, we generated an accessibility product design strategy based on the human-machine framework based on the results of the model, which designers can refer to and use when conducting accessible product design. We conducted the design solution output through the design strategy, and the design solution effectively improved user satisfaction through user features, safety measures, usability and ease of use. The accessible product design strategies proposed in this study have practical implications. Accessible product design is becoming more and more important in today’s society because the demand for accessible products is increasing with the aging population and the increase of people with disabilities. The design strategy proposed in this study is based on the theoretical model and human-machine framework, and provides effective design solutions and strategies for different user characteristics and needs, which can help designers to better meet the needs of different users and improve the user satisfaction of accessible products.
The main limitation of this study is that this study is aimed at people who have used accessible products, so the conclusions need to be used with caution when promoting their use. This study looked at accessible products and did not include individually designed accessibility features in individual products, and lacked research methods such as physiological experiments to complement the study. Future research can be conducted on the accessibility features of individual products to form a design strategy for individual features. Secondly, the objectivity is still insufficient when evaluating the quantification of indicators, and in the future, we will find more reasonable methods to enhance the objectivity, such as adding research methods of eye movement, EEG and ECG, and expanding the questionnaire data to test the exact relationship between variables in this model.