
Abstract
Coronavirus disease 2019 (Covid-19) is a contagious pandemic illness characterized by severe acute respiratory syndrome. The daily rise of Covid-19 instances and fatalities has resulted in worldwide lockdowns, quarantines and social distancing. Researchers have been working incredibly to develop precisely focused strategies to warfare the Covid-19 pandemic. This study aims to develop a cyclical learning rate optimized stacked generalization computational models (CLR-SGCM) for predicting Covid-19 pandemic outbreaks. Stacked generalization framework performs hierarchical two-phase prediction. In the first phase, deep learning models namely Long Short-Term Memory (LSTM) and Gated Recurrent Unit (GRU) and statistical model Auto Regressive Integrated Moving Average (ARIMA) are used as sub models to create pooled datasets (PDS). Cyclical learning rate (CLR) optimizer is used to enhance learning rate of ensemble deep learning models namely LSTM and GRU. In the second phase, meta learner is trained on dataset PDS using four different regression algorithms such as linear regression, polynomial regression, lasso regression and ridge regression to perform the final predictions. Time series data from India, Brazil, and the United States were utilized to forecast the Covid-19 pandemic outbreak. According to experimental finding, the presented stacking ensemble model outpaces the individual learners in terms of accuracy and error rate.
Keywords
Introduction
The coronavirus pandemic, also recognized as the Covid-19 pandemic, is an outbreak of disease spread by coronavirus 2, which induces severe acute respiratory syndrome (SARS-CoV-2). The newly discovered Corona virus disease 2019 (Covid-19) is quickly sweeping the globe. More than 37, 00,000 people has been affected by this disease as of October 12, 2020 [5, 17, 25, 29, 32]. The World Health Organization (WHO) designated the illness brought on by the new corona virus as Corona virus disease 2019 (COVID-19) on February 12, 2019 [17]. On January 30 2020, India reported its first case of COVID-19 which has emerged from China by a traveler who had travelled from China to India. India had the most confirmed cases in Asia as of September 2020, as well as the second-highest amount of confirmed cases worldwide after the United States, with the total number of confirmed cases breaking the 100,000 mark on 19 May, and 1 million confirmed cases on 17 July 2020. On September 17, 2020, India had the world’s highest single-day increase in COVID-19 positive cases, with 97,894 cases, breaking the previous record of 78,761 cases on August 29, 2020.
Due to alarming increase in COVID cases, it is crucial to develop systems that support the healthcare practitioners to control and early detect covid-19 outbreak. Researchers utilize epidemic models to analyse and forecast disease progression. The results of such an analysis can then be used to direct the establishment of preventive and control measures [17, 29, 32].
The eventual consequences of the Covid-19 epidemic in numerous regions and countries have been the focus of numerous ongoing initiatives. The results of the analysis provide support for efficient resource planning for healthcare and socioeconomic decisions as well as the identification of the primary factors anticipated to affect growth [28, 30]. Epidemiological predictive models, such as the Susceptible Infection Recovered (SIR) model, are particularly important. Kermack and McKendrick [32] were the first to present these models, which typically divide the population into “Susceptible,” “Infectious,” and “Recovered” fractions. Each person affected by a pandemic belongs to one of the three potential states in the SIR model.
One of the most challenging categories of predictive modelling is time series analysis. In time series forecasting, future values are predicted from observed past values using a model. The statistical models that are designed for assessing and predicting time series data include ARIMA models. It offers a simple yet effective model for producing accurate time series forecasts [31].
Traditional epidemic models have several significant drawbacks, that includes selecting the best model from among all feasible models and high computing costs [29]. Throughout this subjective selection process, the researcher’s skill and experience may have an impact on the model’s reliability. Second, conventional epidemic models oversimplify the process by relying on numerous unproven assumptions. The classic SIR model, for example, does not account for the time lag between a person’s initial pandemic exposure and the onset of infection or contagiousness.
In the perspective of the Covid-19 pandemic, it corresponds to the virus’s incubation period. It also assumes that each person in a population will be equally exposed to the pandemic, which is realistically untrue and depends on a number of circumstance. While all other forecasting techniques are fundamentally “retrogressive,” the statistical model ARIMA [10] is the contrary. As a result, the long-term forecast gradually has become a symmetrical, and the model becomes less accurate at predicting series with turning points. In comparison to conventional epidemic models such as the ARIMA model, a Deep Neural Network model known as the Long Short-Term Memory Neural Network has higher performance at the expense of increased complexity.
LSTM is a recurrent neural network (RNN) adaption introduced by Hochreiter and Schmid-huber [6]. LSTM can effectively reduce gradient explosion and gradient diminishing problems by incorporating the constant error carousel unit. LSTM outperforms them in acquiring the long-term dependencies of the patterns and is thus suitable for time series data classification, processing, and prediction. Gated Recurrent unit is another improvised recurrent neural network which skillfully alleviates vanishing gradient and exploding gradient problems of vanilla RNN and can understand long term dependencies. GRU employs fewer parameters when compared to LSTM and therefore are computationally more efficient and require less data to generalize.
In this study, a cyclical learning rate (CLR) optimized stacking ensemble model for time series forecasting is presented, which seeks to combine the effects of statistical models like ARIMA and deep neural networks like LSTM and GRU, that may be able to outperform the individual performance of each model [21]. There are several strategies for ensembling: Simple averaging, is the most common and traditional approach of ensembling, which applies equal weights to all three forecasting component models. The basic averaging model, on the other hand, is sensitive to outliers and unreliable for skewed distributions. As a result, the more advanced ensembling approach namely stacking generalization is employed in this work. Stacked generalization or stacking is an ensemble technique which uses a meta model to learn the best way to combine the predictions from three forecasting component models trained on dataset [15]. The learning rates of stacking ensemble base models are optimized during training process of the model utilizing cyclical learning rate optimizer (CLR). Cyclical learning rate (CLR) is an optimizer technique that provokes learning rate to oscillate between upper and lower bounds resulting in better performance of the model [20].
The outline of the manuscript motivation and significance of the proposed work over the related work is described as follows
The objective of this work is to propose a mining framework for building effective models to classify multivariate temporal data. The constructed models are used to develop CADSS for assisting decision making activities. The significance of temporal data mining was investigated in several research studies (Batal et al., 2011, Jane et al., 2017, Karim F., 2019). However, identifying knowledge from temporal data remains challenging due to the presence of temporal complexities such as large multivariate attribute sets, complex temporal structures and temporal dependencies. The proposed mining framework handles these complexities and builds effective classification models. The classification models constructed in this work are used to develop computer assisted decision support systems for assisting environmentalist and health practitioner in taking decisions for public health and well-being. The Proposed work is experiment with multivariate temporal Covid-19 pandemic outbreak prediction datasets.
The contribution of the proposed work is outlined as follows:
Proposed a stacking ensemble model with CLR optimization (CLR-SGCM) for prediction of Covid-19 pandemic outbreak. Stacked generalisation framework is used to accomplish hierarchical two-phase prediction. In the first phase, the stacking ensemble of deep learning models namely LSTM and GRU, as well as statistical models such as ARIMA, are utilized as base models to create pooled datasets (PDS). Cyclical learning rate (CLR) optimizer is employed to optimize learning rate during training of stacking ensemble base models namely LSTM and GRU. In second phase, the output of the base models PDS is utilised as input to the meta models, which include linear regression, lasso regression, ridge regression, and polynomial regression for final prediction of Covid-19 outbreak. The proposed model’s effectiveness is assessed using data from three countries: India, Brazil, and the United States.
The remaining section of the paper is structured as follows, Recent studies that are associated to this publication are reviewed in Section 2. The proposed framework and methodology employed for the prediction of COVID 19 outbreak are described in Section 3. The experimental findings based on the epidemic data from January to November 2020 are presented in Section 4. The conclusion and future works are discussed in Section 5.
Related works
Jean et al. [22] presented models to determine whether depression-related signals are expected to dramatically increase over time. Many aspects of civilization have been drastically altered by the COVID-19 epidemic. People frequently use social media sites like Twitter and Facebook for socializing as a result of border closures, lockdowns, social-distancing policies, and other government limitations. The author demonstrates the efficacy of data gathering and data pre-processing technique to collect social media postings including depression-related signals. In order to identify pertinent depressive signals from the content of social media postings, authors gathered geo-located tweets before and during Canada’s first lockdown for this study. The experimental datasets showed strong depression patterns, which were supported by our predictive model. The F-1 score of the best classifier is as high as 0.8, representing a 0.173 relative improvement over the baseline features. The improvement is statistically significant (p 0.001) and the recommended characteristics produce a greater Pearson correlation (r = 0.506) than other potential feature combinations. This study has exceeded this value by 0.106, contrary to previous research, which revealed that Pearson correlations between language use and psychologically based traits rarely went beyond a value of r = 0.4,46.
EunKyo et al. [8] investigated news articles that may help to explain differences in how telemedicine was portrayed in the media priort to and subsequent to COVID 19. Before COVID-19, the majority of telemedicine-related articles dealt with “the government’s regulation and policy of telemedicine.” In this study, author tried to determine whether the COVID-19 epidemic would have positive effect on telemedicine-related newspaper articles and comments. The Korean news network contained 1073 articles about telemedicine between January 1 and March 1 (before COVID-19). Even though the post-COVID19 article collection period (from March 2, 2020, to September 30, 2020), was roughly half as long as the pre-COVID-19 article collection period, roughly twice as many (1934) articles pertaining to telemedicine were gathered. Additionally, press stories on telemedicine adopted a more upbeat tone following COVID-19 than they did before (52.9 percent after vs 40.4 percent before). In this investigation, the kappa coefficient for inter-rater reliability was very good, at 0.95 or above 69. Because sentiment was manually evaluated in this study, and due to the limited time and resources available, significant results were required.
Mohammed Loey et al. [12] presented hybrid model for face mask identification that integrates deep learning and conventional machine learning. The developed model is made up of two parts. Utilizing Resnet50, the first section aims to extract features. While the second component uses ensemble algorithms, decision trees, and support vector machines to categorize face masks (SVM). Three face-masked datasets have been utilized in this experiment. The three datasets are Labeled Faces in the Wild, Simulated Masked Face Dataset, and Real-World Masked Face Dataset (RMFD) (LFW). The SVM classifier’s testing precision in RMFD was 99.64 percent. It scored 99.49 percent testing accuracy in SMFD and 100 percent testing accuracy in LFW.
Cuyian et al. [23] described the purpose of this study was to conduct a broad population survey in China to learn more about how the COVID-19 outbreak affected people’s psychological well-being and their levels of stress, anxiety, and depression. The 2019 coronavirus disease (COVID-19) epidemic, a global public health emergency, threatens psychological resilience. Data from research are required to develop evidence-based strategies to reduce the epidemic’s harmful psychological consequences and mental symptoms. The data will be used as a resource in the future. In order to conduct an online survey between January 31 and February 2, 2020, the author utilized snowball sampling techniques. The online survey gathered details about demographics, current physical symptoms, previous interactions with COVID-19, knowledge and concerns about COVID-19, COVID-19 prevention programs, as well as any additional data that was considered necessary. The Depression, Anxiety, and Stress Scale was used to analyze one’s mental health, while the effect of Event Scale-Revised (IES-R) measured psychological impacts (DASS-21). The majority of responders (84.7%) invested 20 to 24 hours per day at home, 75.2 percent expressed concern about COVID-19 infecting their family members and 75.1 percent valued the amount of health information provided. During the outbreak, being female, a student, experiencing certain medical symptoms (like myalgia, dizziness, and coryza) were all strongly linked to higher levels of stress, worry, and melancholy (p 0.05).
Saranya et al. [7] presented a classification framework for detecting ozone level from multivariate temporal data. The presented system involves two functionalities namely temporal missing value imputation and temporal classification. The temporal correlated k-nearest neighbours (TCO-KNN) technique imputes missing values. The closest significant set is identified for each missing value using attribute dependency-based KNN. The mean values from the established closest significant set are used to impute the missing values. The classification model is constructed using stacked gated recurrent units (S-GRU). When related to traditional approaches, the presented framework performs better when tested utilizing multivariate temporal data sets related to ozone.
Pyrank et al. [35] established an unbiased method for forecasting a COVID-19 pandemic outbreak. Using data science and machine learning (ML) approaches namely support vector machine, Bayesian ridge regression and polynomial regression the presented method depicts unbiased predictions on COVID-19 confirmed cases, recovered cases, deaths, and ongoing cases. The authors applied time series datasets from Johns Hopkins University for experimentation.
Tahir et al. [37] employ machine learning algorithms such as KNN, random forest, and decision tree to predict the covid-19 pandemic outbreak. The presented method was tested using Covid-19 symptoms and presence datasets from kaggle.
Haishuai et al. [36] presented a susceptible-infectious-recovered generative adversarial generative network (T-SIRGAN) to forecast the covid-19 pandemic. The presented method uses the SIR model for epidemiological theories, which is subsequently fed into the GAN network for data augmentation. The author tested the presented method on the COVID-19 Data Repository at Johns Hopkins University.
Biggui et al. [39] presented a temporal attention-based forecasting model for covid-19. Long short-term memory (LSTM) is used for temporal feature extraction, and multi-head attention is used for long-term dependency captioning in the presented Interpretable Temporal Attention Network (ITANet). In addition, author has presented the degraded teacher forcing (DTF) method for efficiently training the model. The author examined the presented method on datasets of Confirmed Cases, Confirmed Deaths, and Government Interventions.
Xiaoyong Jin et al.[38] presented attention based neural network forecasting model for covid-19 pandemic outbreak prediction from time series. The author presented attention crossing time series (ACTS), which learns inter-time series similarity between attributes for covid-19 forecasting. The author tested the presented work using COVID-19 incidence data.
The key difference between the proposed and the related works is outlined as follows
This work designs CLR optimized two-level stacking ensemble framework for constructing classification model with covid-19. The stacking process combines the capabilities of several high-performing models such as LSTM, GRU and ARIMA. The base learner’s results are aggregated in the pooled datasets. Cyclical learning rate (CLR) optimizer is employed to optimize learning rate during training of stacking ensemble base models namely LSTM and GRU. The level 1 meta leaners, which include linear regression, lasso regression, ridge regression, and polynomial regression utilizes PDS as the input. The proposed model’s effectiveness is assessed using multivariate temporal data from three countries: India, Brazil, and the United States.
Materials and methods
The proposed cyclical learning rate optimized stacked generalization computational model (CLR-SGCM) is described in detail in this section. The dataset that have been applied to identify COVID 19 outbreak are also described. The stacking ensemble base models for predicting pandemic propagation have been discussed. Finally, the ensembling technique for combining the base models’ predictions has also been addressed.
Dataset description
The time series data utilized in this work were obtained from the covid.who.int website [33]. The dataset includes the following attributes: date, name of the state or province the patient resides in, amount of confirmed cases, amount of recovered cases, amount of deaths and amount of active cases. The time series data starting from 01/01/2020 until 17/10/2020 were employed in this study.
The following data pre-processing activities is carried out:
The dataset is imported, and the dependent and independent variables are extracted. The data is then transformed by using the Standard Scalar object in Python to attain a Gaussian distribution for predicting the spread of the pandemic. To remove the outliers, data are normalized using logarithmic scale. The data is then divided into training data and testing data to train and test the model.
System architecture
This study develops an ensemble model that combines the deep neural networks models namely LSTM and GRU and statistical model namely ARIMA through stacked generalization. The stacked generalization combines the results of base learners in level 0 with the meta learner in level 1, improving forecasting accuracy by combining the best features of the regressors, as illustrated in Fig. 1. Stacked generalization involves two phases prediction. The first phase entails employing deep learning techniques like LSTM and GRU, as well as statistical models like ARIMA, to train the base models. Cyclical learning rate (CLR) optimizer is applied to optimize the learning rates during training of ensemble base models. The triangular and triangular2 policies of the cyclical learning rate are being implemented to tune the learning rates by reducing the saddle points and local minima. This tends to increase the final prediction accuracy of the COVID 19 pandemic outbreak. The results of the base models are merged to form a pooled dataset (PDS). In second phase, the meta models are then trained using this PDS. Linear regression, ridge regression, lasso regression, and polynomial regression are the four regression techniques used to train the meta models to produce the final prediction as depicted in Algorithm 1.
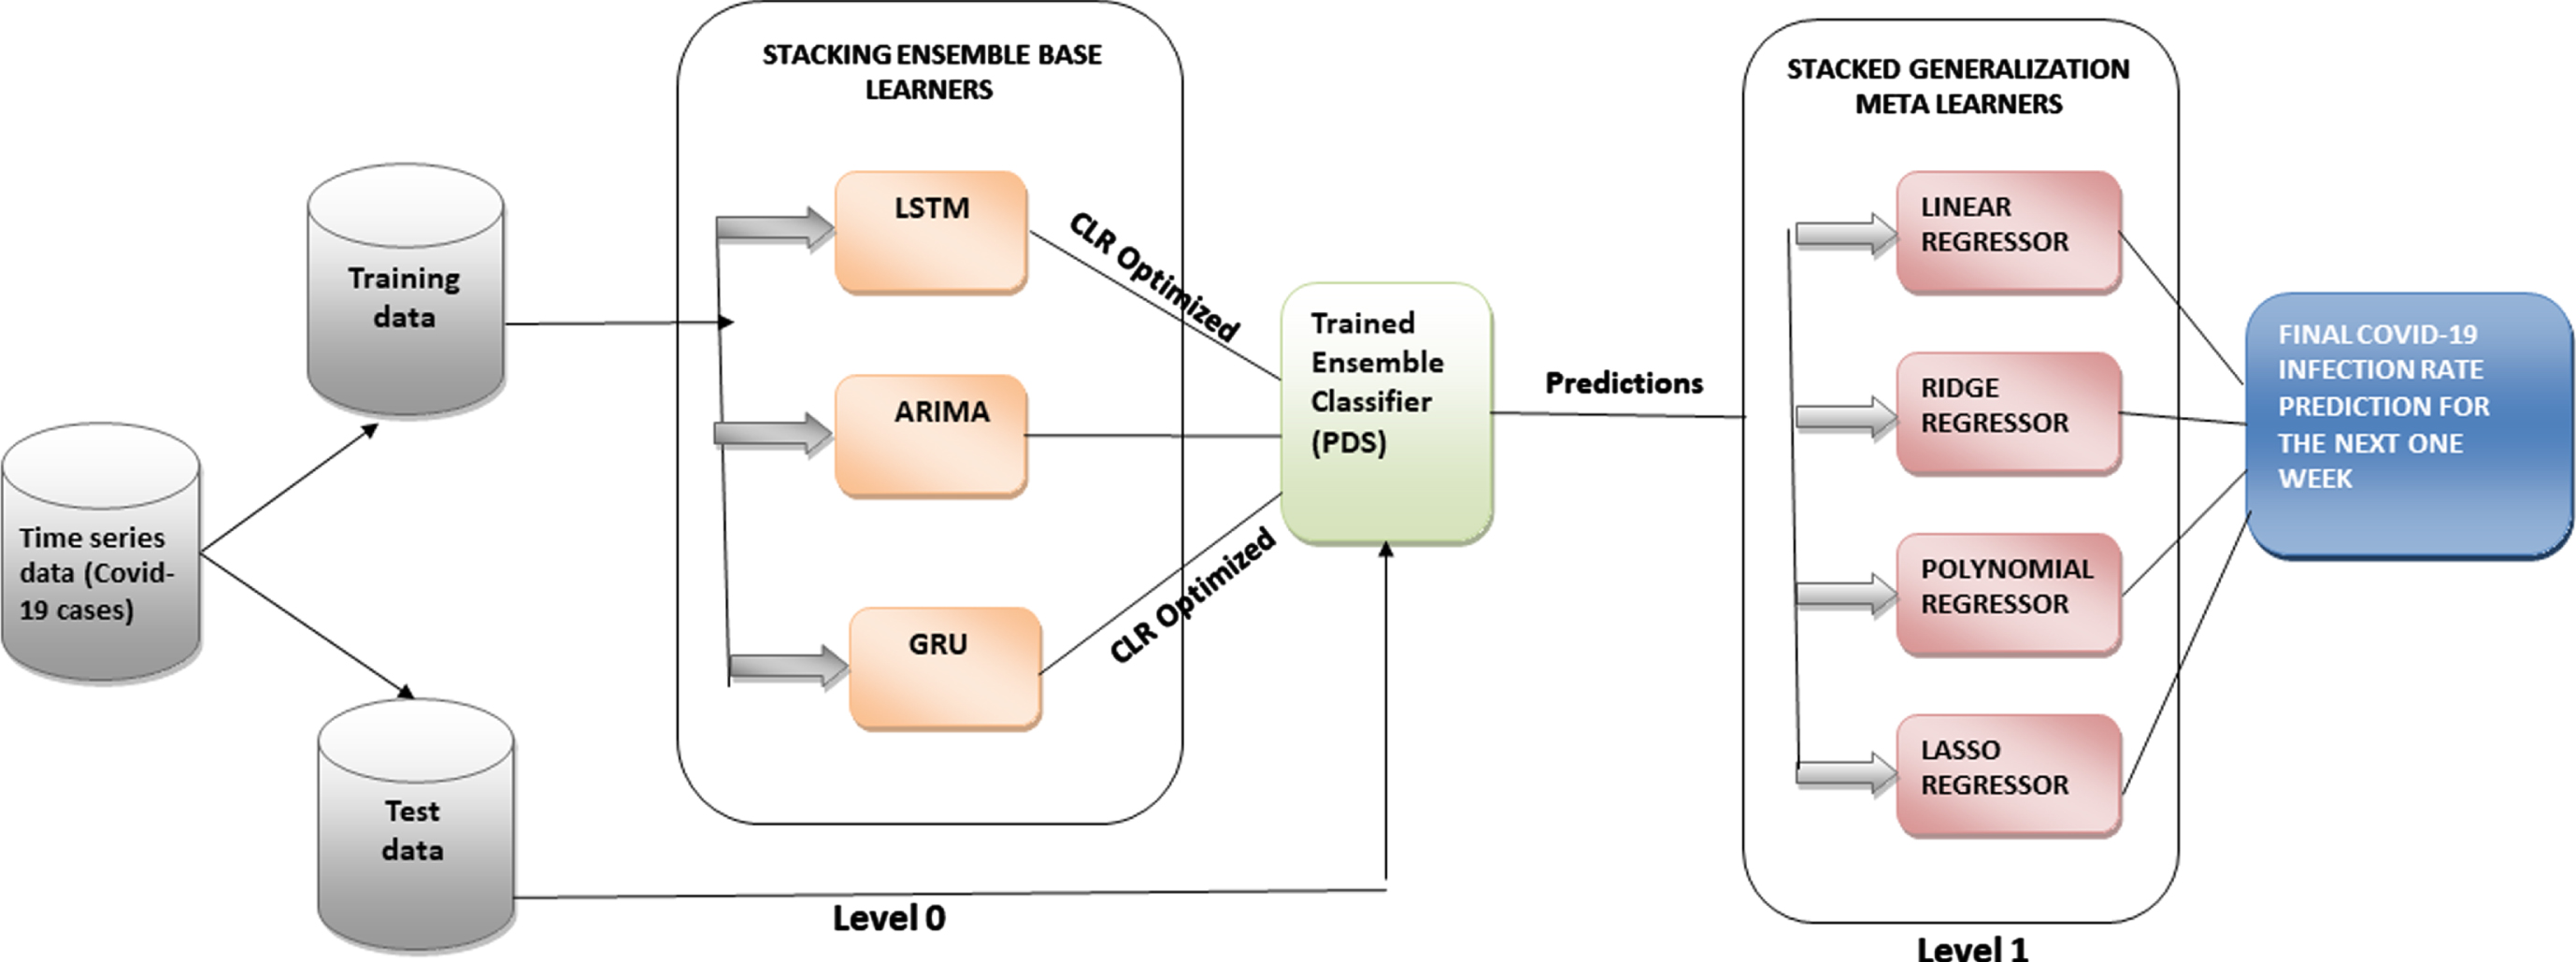
Proposed ensemble model for forecasting covid-19 cases.
An ensembling approach is proposed to enhance the LSTM, ARIMA, and GRU of individual learners. The outputs of these base models are combined to form a new pooled dataset (PDS) that contains the actual value for each row. The final prediction is produced by training a meta learner using the PDS and four alternative four alternative regression techniques, including linear regression, polynomial regression, ridge regression, and lasso regression. A comparative study is made to analyze which algorithm offers the best accuracy.
Base models of stacked generalization
In this study, three models namely LSTM, ARIMA and GRU are employed as the base models to forecast the amount of confirmed cases in India, USA and Brazil. The CLR optimizer are utilized to tune the learning rates of stacking ensemble base models.
Long Short Term Memory (LSTM)
LSTM is appropriate for temporal modelling as it remembers information for long period of time [6]. LSTM contain memory unit as a hidden layer in it. LSTM adds or remove information to the cell state using three gates that is forget gate (fgt), input gate (igt) and an output gate (ogt) as illustrated in Fig. 2. The forget gate (fgt) identifies the information that are not required and it will be thrown away from the cell state CSt. The input gate (igt) updates the state with the information from the current input Xt. Finally output gate (ogt) decides about the information to deliver at the current time stamp. The following steps are involved in predicting COVID 19 cases using LSTM,

Structure of Long Short Term Memory (LSTM) [6].
Xt denotes the present input at time (t). Wfg,Wcg and Wog are the weights of LSTM gates and bfg, big, bcs and bog are the bias. σ signifies sigmoid function that scales data to a value in the range of 0 to 1. h (t - 1) is the hidden state value of the preceding output at time stamp (t-1).
Where, tanh represents element wise multiplication and * implies the hyperbolic tangent function. The tanh function scales data in the -1 to 1 range.
Table 1 depicts the network parameters that are used in designing the LSTM models. The training and test sets are transformed into samples, time steps, and features. The LSTM network, with a visible layer of one input and five hidden layers, is employed to predict a single output value. LSTM model is trained with a batch size of 10 for 1500 epochs. Once the model has been trained, the model’s performance can be evaluated using the train and test set. The constructed model is used to predict future values after being tested on the test set. Finally, to visualize the model’s competency, a graph is plotted against the date and the predicted number of cases. R2 score and rmse are calculated to assess the model’s goodness of fit.
Layers of LSTM
Gated Recurrent Unit is similar to LSTM, it uses only two gates to regulate the information in the network: update gate and reset gate [1]. The structure of GRU is shown in Fig. 3. GRU model is trained with a batch size of 10 for 1500 epochs. Once the model has been trained, the model’s performance can be evaluated using the train and test set. The constructed model is used to predict future values after being tested on the test set. Finally, to visualize the model’s competency, a graph is plotted against the date and the predicted number of cases. R2_score and rmse are calculated to assess the model’s goodness of fit.
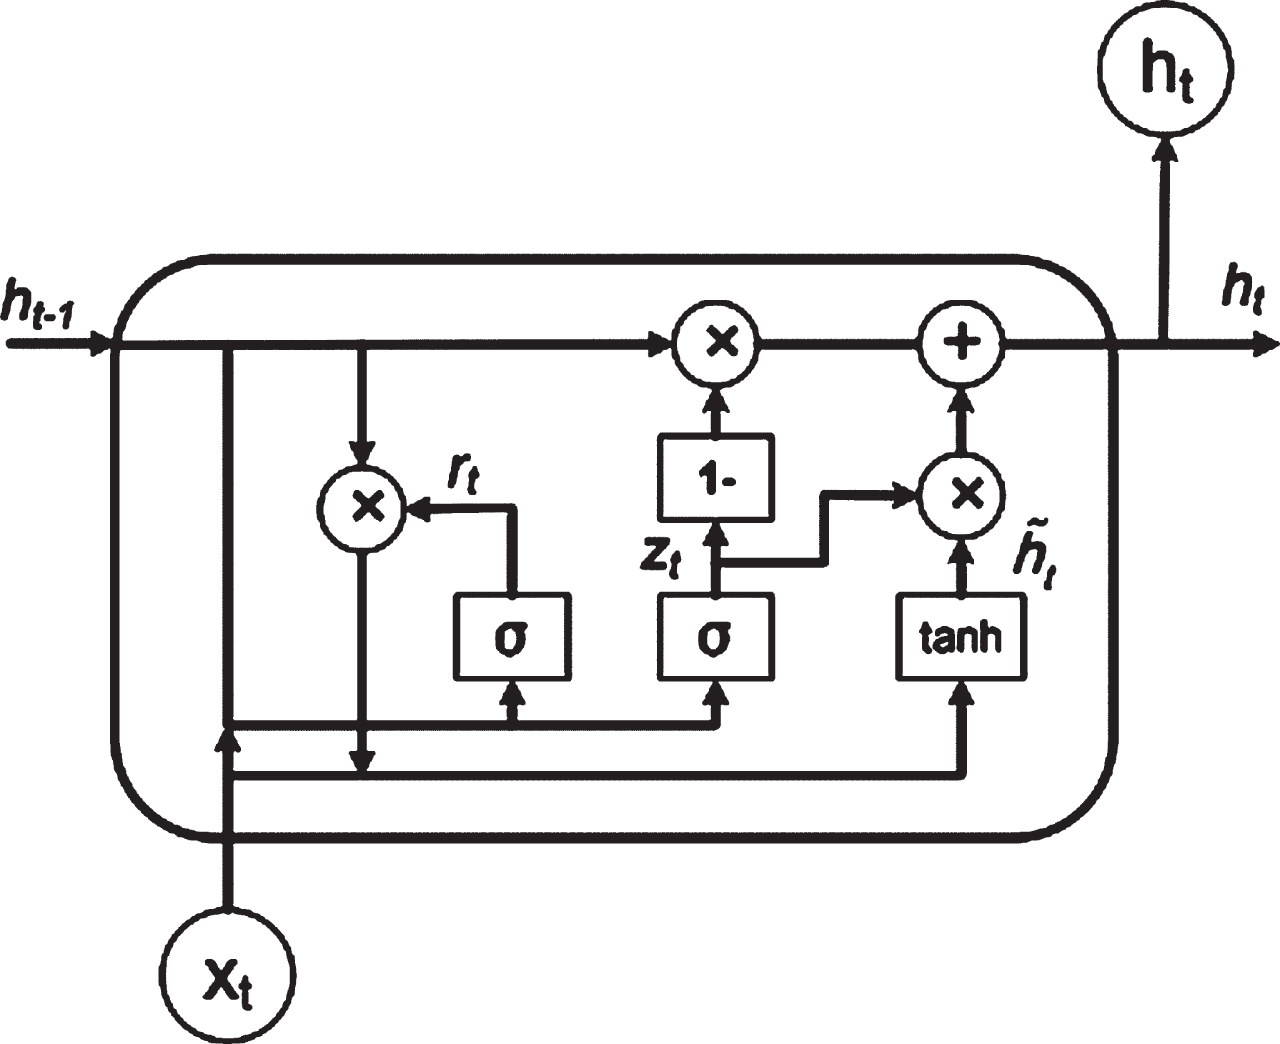
Structure of Gated Recurrent Unit (GRU) [1].
The following steps are involved in predicting COVID 19 pandemics using GRU
Xt denotes the input at time stamp t. h (t - 1) implies hidden of previous output of the GRU at time stamp (t-1). Vug, Vrg and Vhs signifies feed forward recurrent connections. σ implies sigmoid function that converts the data to value in the range of 0 to 1.
The hyperbolic tangent function is denoted by tanh, and element wise multiplication is signified by *. The tanh function scales data in the -1 to 1 range.
Table 2 depicts the network parameters that are used in designing the GRU models.
Layers of GRU
A statistical time series model called the auto regression integrated moving average can be learned and then used to forecast future time points [28]. ARIMA stands for Autoregressive (AR), Integrated (I) and Moving Average (MA). An ARIMA (6, 1, 0) model was employed. The model utilizes an order of difference of 1 to make the time series stationary and a value of 0 for moving average. This sets an auto regression value of 6 to indicate the amount of lags. The model can then be used to forecast future values once it has been fitted. The prediction of time series is calculated using Equation (11).
yt and ɛt represent the actual value and error term at time step t. αa (a = 1,2, 3,,p) and αb (b = 1,2,3, … ,q) are the parameters of the model. Prediction for amount of cases is made for the next one week. The performance of the model is measured by mean squared error lose function and r2_score. The ARIMA (6, 1, 0) was able to capture 89% variations in the time series dataset with a r2_score of 0.89.
A pooled dataset PDS is created by combining the results of the base learners. Similarly, the infection rat predictions for the next one week by the base learners are stored in a dataset named future dataset. The meta model takes in PDS as input and is trained using four different regression algorithm such as linear regression, polynomial regression, ridge regression and lasso regression. The trained meta model performs one week ahead forecast with the future dataset as input. Finally, a comparison is made to witness which meta regressor performs better time series prediction.
Linear regression
Linear regression helps in finding relationship between two continuous variables [11]. The slope for linear regression is calculated using Equation (12).
Zi denotes dependent variable, α0 represents intercept, α1 represents slope, Xi represents independent variable and ɛI represents error term. The training data are then used to fit the linear regression model. Once the model has been trained, it can be evaluated using a test set. Finally, the model is then applied to the future dataset to forecast the confirmed cases for the following week. RMSE and r2 score are used to evaluate how well the model performs. With a r2_score of 0.90, the linear regressor model was able to account for 90% of the variation.
Polynomial regression is a distinct type of linear regression [26]. Using Equation (13) polynomial regression is calculated,
The slope values are b1, b2, b3 and bn, and the intercept term is b0. The output variable is Py. The input attribute is x1. Since there are 3 features in this instance, the value of degree is set by default to 3. Once the model is trained, future values can be predicted using it. The model’s performance is evaluated using test datasets. Then, using the future dataset as input, the future forecast of confirmed cases for the following week is performed. The RMSE and r2_score are utilized to assess the model. The polynomial regression model could capture 91% of variation in the dataset with a r2_score of 0.91.
Lasso Regression is a popular type of normalized linear regression that incorporates an L1 penalty [27]. The lasso model uses the future dataset as input to forecast the future for the upcoming week. The lasso model’s performance is evaluated using the performance metrics RMSE and r2_Score. With a r2_score of 0.90, the lasso model demonstrated its capacity to capture 90% of the variability in the time series dataset.
Ridge regression
Ridge regression is similar to lasso that assigns penalty factor [27]. A hyper parameter ‘lambda’ is used to control the assignment of weights to the penalty in the loss function as shown in Equation (14)
The ridge model is trained on the time series dataset. After training, the model is now capable of predicting future values. The following week’s forecast is generated by feeding the future dataset as input. The performance of the model is tested using the RMSE and r2_score. The ridge model could capture 90% of the variation with a r2_score of 0.90.
Learning rate controls the training process by deciding on how much gradient loss is required to update the current network weights. Learning rate are typically set with a value between 0.0 to 1.0. Learning rate close to 1 allows the network to converge fast resulting with sub-optimal weights in unstable network training process.
Learning rate close to 0 slows down the network convergence resulting in long training process. Choosing an optimal value for learning rate parameter is challenging while tuning a deep learning network model. The proposed work uses cyclical learning rate approach to choose an optimal value of learning rates. The CLR sets an optimal learning rate value for the network by oscillating the learning rate in a cyclic manner [20]. CLR learning rate oscillation can be done using three approaches namely triangular window, parabolic and sinusoidal. This work uses a triangular window based CLR (TW-CLR). In TW-CLR the oscillation of learning rate is linear. It increases & decreases the learning rate with a constant minimum LR to maximum LR and a constant maximum LR to minimum LR respectively.
The “triangular’ cyclical learning rate Policy
Learning progresses slowly and then gradually increases. In the middle of the cycle, the maximum learning rate is reached [20].
The Fig. 4 illustrates that returning to the base learning rate requires half a cycle. The “triangular’ cyclical learning rate Policy is defined using Equations (15)–(17),
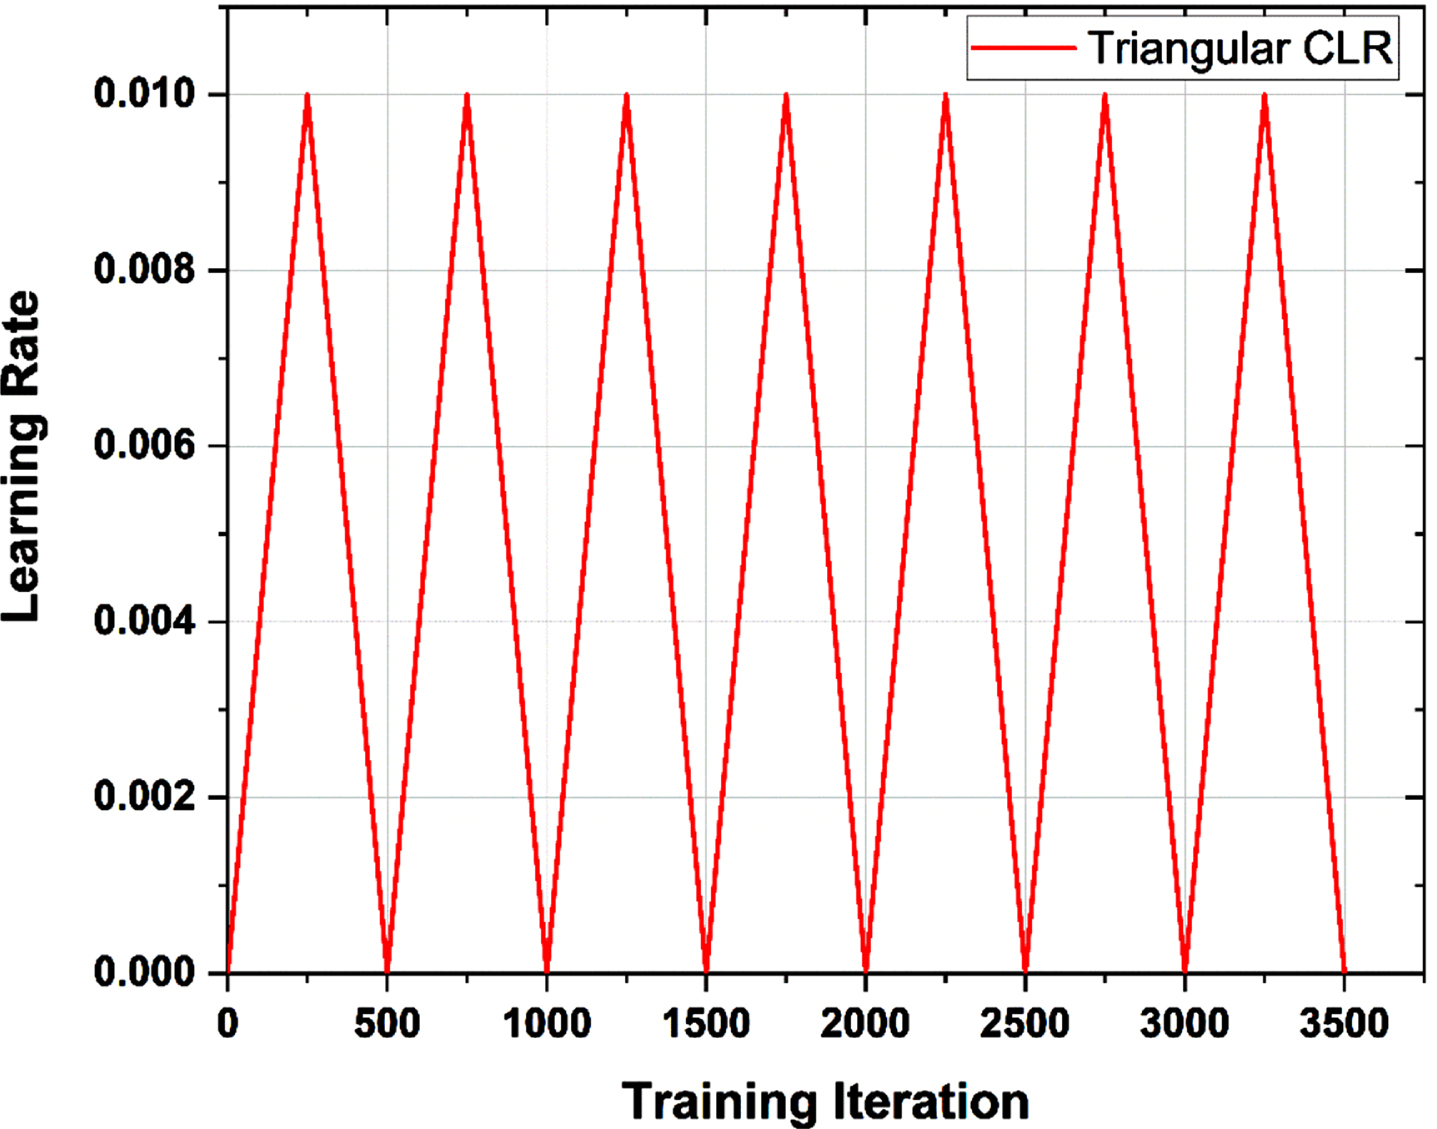
Learning rate attained over the course of training time series data employing the “triangular” policy.
The “triangular 2” policy is same as “triangular policy [20]. In this paper, the “triangular 2” CLR policy is implemented for the stacking ensemble base models namely LSTM and GRU to optimize the learning rates during training process. Similar to the triangle policy, with the exception that, as shown in Fig. 5, the learning rate differential is segmented in half at the completion of each cycle.

Learning rate attained over the course of training time series data employing the “triangular 2” policy.
This study aims at developing a future forecasting system that predicts the amount of Covid-19 confirmed cases using deep learning and statistical models. The dataset consists of time series data of newly infected cases in India from January 1, 2020 to Feburary 5, 2022. An ensembling approach is proposed to forecast the future possible cases. LSTM, ARIMA and GRU algorithms are used to train the base models. The meta model is trained using four different regression algorithm such as Linear Regression, Ridge Regression, Polynomial Regression.
State wise analysis
First, we perform an analysis of how the Covid-19 has affected different states of India. The dataset used for the analysis consists of name of the State, Date, amount of confirmed cases, amount of deaths, amount of recovered cases and amount of active cases. The Fig. 6(a) depicts the amount of active cases in different states of India. The graph clearly shows that the amount of cases is high in the states of Maharashtra, Andhra Pradesh and Tamil Nadu when compared to other states. It can be inferred from the graph in the Fig. 6(b) that the states like Maharashtra, Andhra Pradesh and Tamil Nadu contributes majorly to the total amount of confirmed covid cases in India. Since the amount of confirmed cases is high in the state of Maharashtra, the state holds the first position in the amount of deaths too which can be clearly seen in Fig. 6(c) graph. Even though Tamil Nadu, Andhra Pradesh, and Maharashtra ontinue to be the states most severely impacted by Covid-19, the graph in Fig. 6(d) demonstrates that the amount of recovered cases has also been very high in these Indian states.
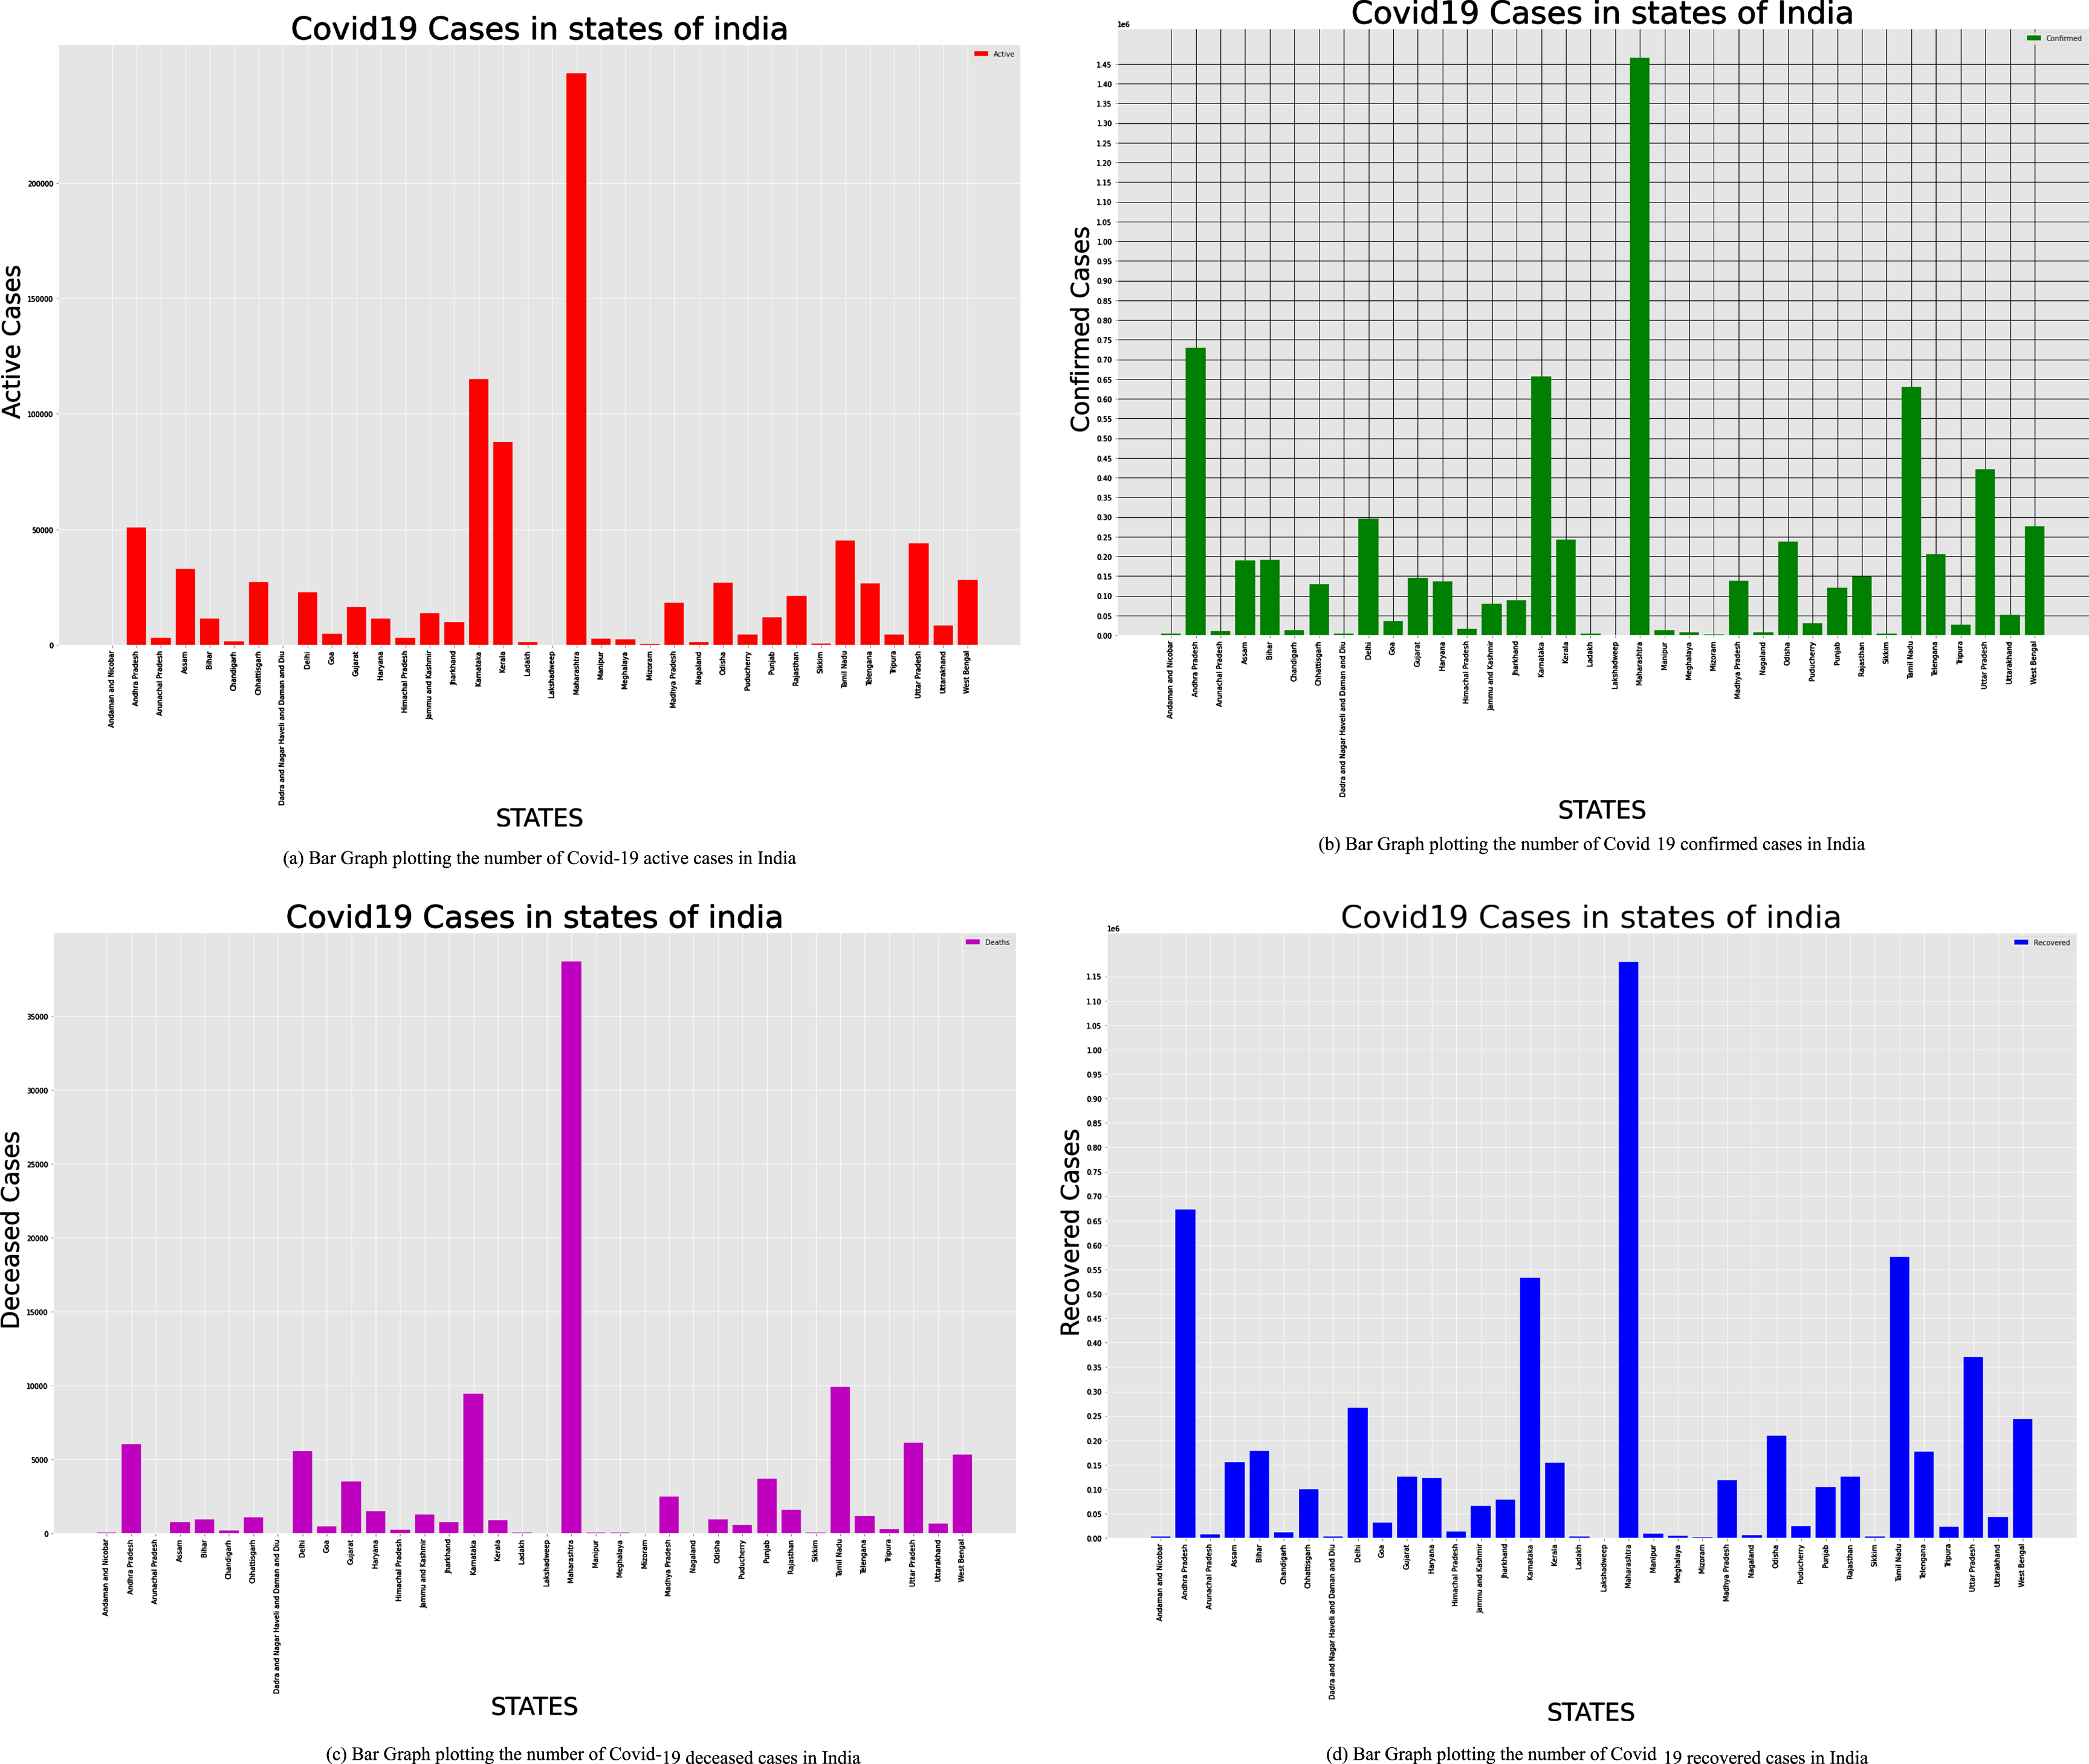
Bar graph plotting the number of Covid-19 active, confirmed, deceased, recovered cases in India.
In order to test the presented model, a time series data from January 1, 2020 to November 5, 2020 depicting the amount of confirmed cases in India has been used. To assess the effectiveness of the model, an ensembling approach is employed to forecast the amount of confirmed cases in the forthcoming week. The Fig. 7(a)–(c) depicts the infection rate prediction in India using base models such as LSTM, GRU and ARIMA. The blue curve indicates the actual number of cases recorded and the red curve depicts the predicted amount of cases. The graphs in Fig. 7(d)–(g) represent the infection rate prediction in India by the meta models trained using linear regression, polynomial regression, ridge regression and lasso regression.
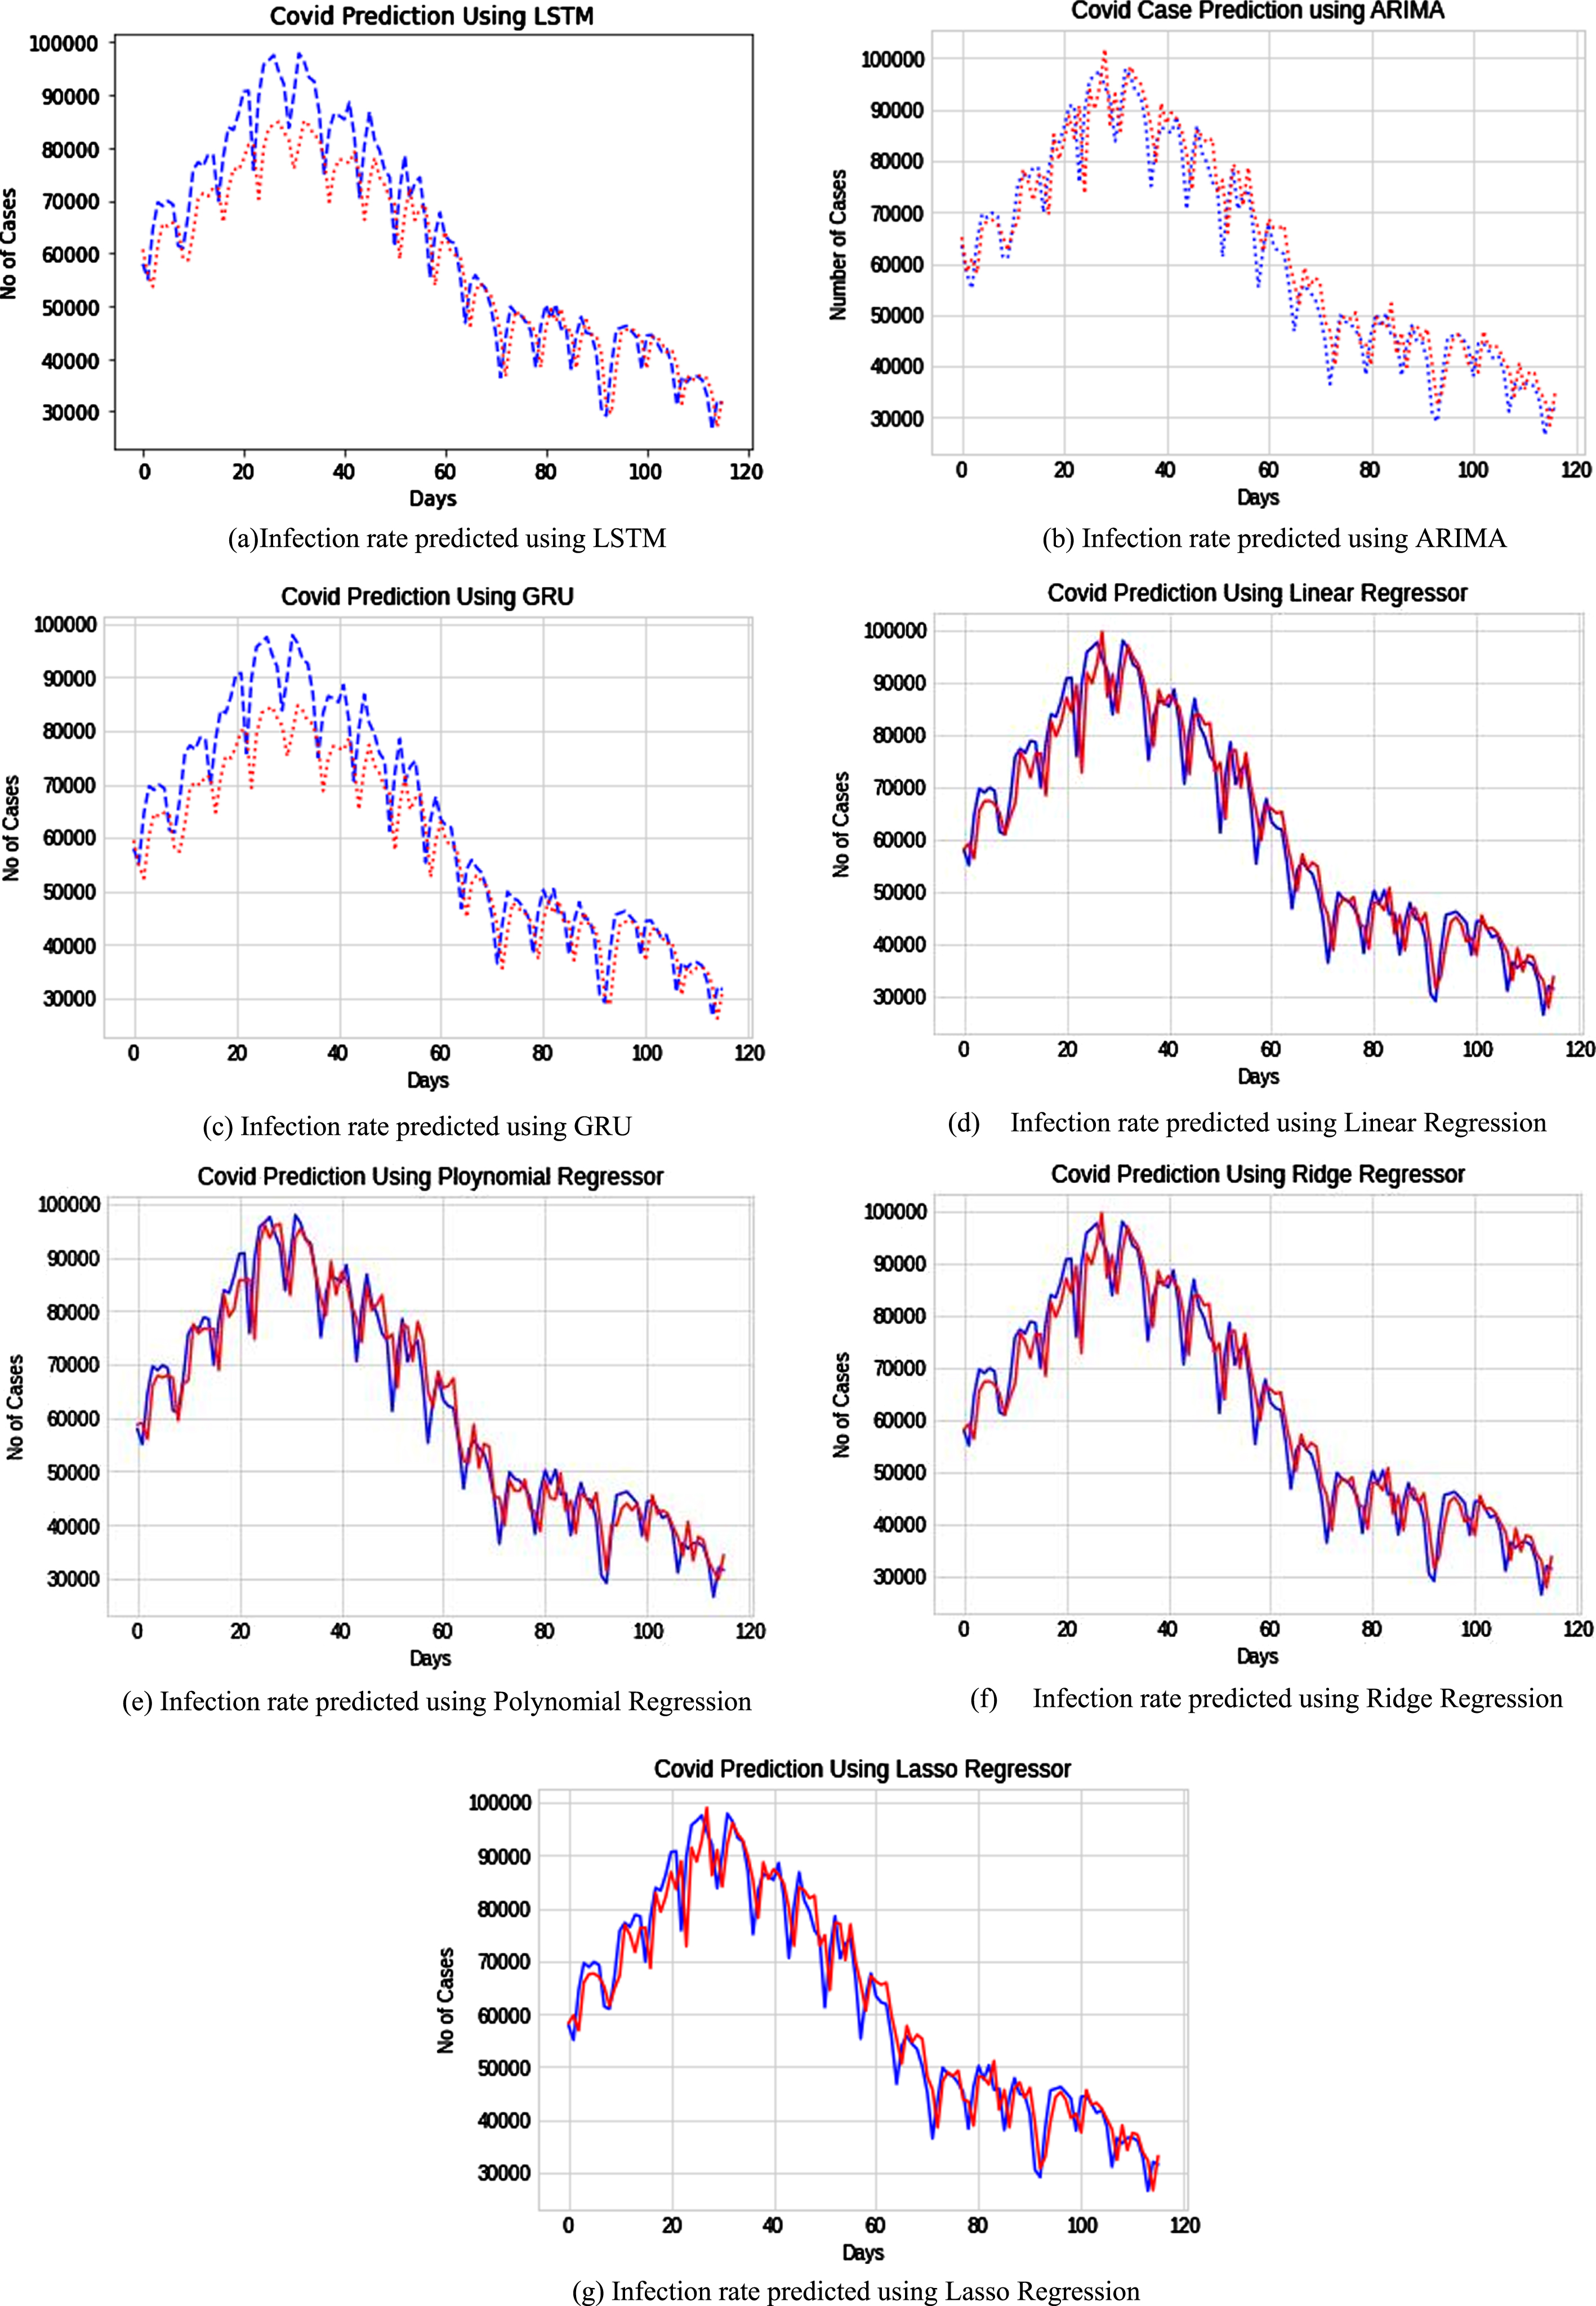
Infection rate in India predicted using stacked generalization.
Table 3 illustrates the infection rate prediction for the next one week by the stacked generalization method. The proposed models are trained to combine the features of the base models LSTM, ARIMA, and GRU to achieve better prediction accuracy in such a way that the prediction result is more consistent with the actual trend of the epidemic.
One week ahead forecast of amount of confirmed cases in India, USA and Brazil using Stacked Generalization method
The “triangular” and “triangular 2” CLR policies are implemented with keras. The network is trained with training sets and validated with testing sets.
The min_lr value as 0.001 and max_ lr value as 0.010, step size as 250, and maximum iteration as 3500 are all specified for LSTM and GRU models. Table 6 compares the accuracy of ensemble deep learning models to that of fixed learning rates, grid search learning rate optimizer and cyclical learning rate optimization using “triangular” and “triangular 2” policies. The training accuracy curves for stacking ensemble base models: LSTM and GRU are compared with CLR-optimized ensemble base models as illustrated in Fig. 8. Figure 8 depicts GRU+CLR, which enhances predictability of Covid- 19 outbreaks significantly.

CLR optimized ensemble base models accuracy compared with conventional models.
The r2 score is calculated for each model, and a comparison is made to determine which model better captures the variations in the dataset and represents the model’s goodness of fit. The fit line of the regression model is better the closer the r2_score value is to 1. Using Equation (18), the model’s r2 score is determined.
Where, N determines the total number of samples, (predictedi) signifies the time series samples predicted by the model and (actuali) denotes the observed samples from the datasets.
Table 4 shows that the ensembling method enhances prediction accuracy and outperforms individual learners in terms of RMSE, Prediction score, and r2_score. Polynomial regression predicts better than other regressor models, with prediction scores of 93.26 for India, 96.79 for the US, and 99.2 for Brazil. The experimental findings indicate that the stacked ensemble approach dramatically improved prediction accuracy.
Comparison of Evaluation Metrics of all the models used in stacking ensemble technique using India, USA and Brazil dataset
Table 5 illustrates the comparison of proposed classifier performance with various learning techniques for covid-19 pandemic outbreak forecasting. In addition to the traditional performance measures for evaluating classification results, a statistical hypothesis test was performed using the paired t-test [40].
Proposed framework performance with existing learning techniques
Performance comparison of CLR-optimized stacking ensemble base models
The test was conducted with different significance levels, 0.05, 0.01 and 0.1, in order to determine if there was a significant difference in the error rate of the proposed CLR-SGCM classifier when compared to Temporal Attention Network (ITANet), Attention Crossing Time Series (ACTS), Support Vector Machine (SVM), and K-Nearest Neighbor (KNN) learning techniques. When the proposed CLR-SGCM classifier is compared to ITANet, ACTS, SVM, and KNN learning techniques, a p value of less than 0.05 is obtained, indicating that there is a significant change in the error rate. Thus, the assessment results indicate that the classification accuracy have improved significantly. Figure 9 shows a graphical representation of the statistical assessment obtained for various significant levels.
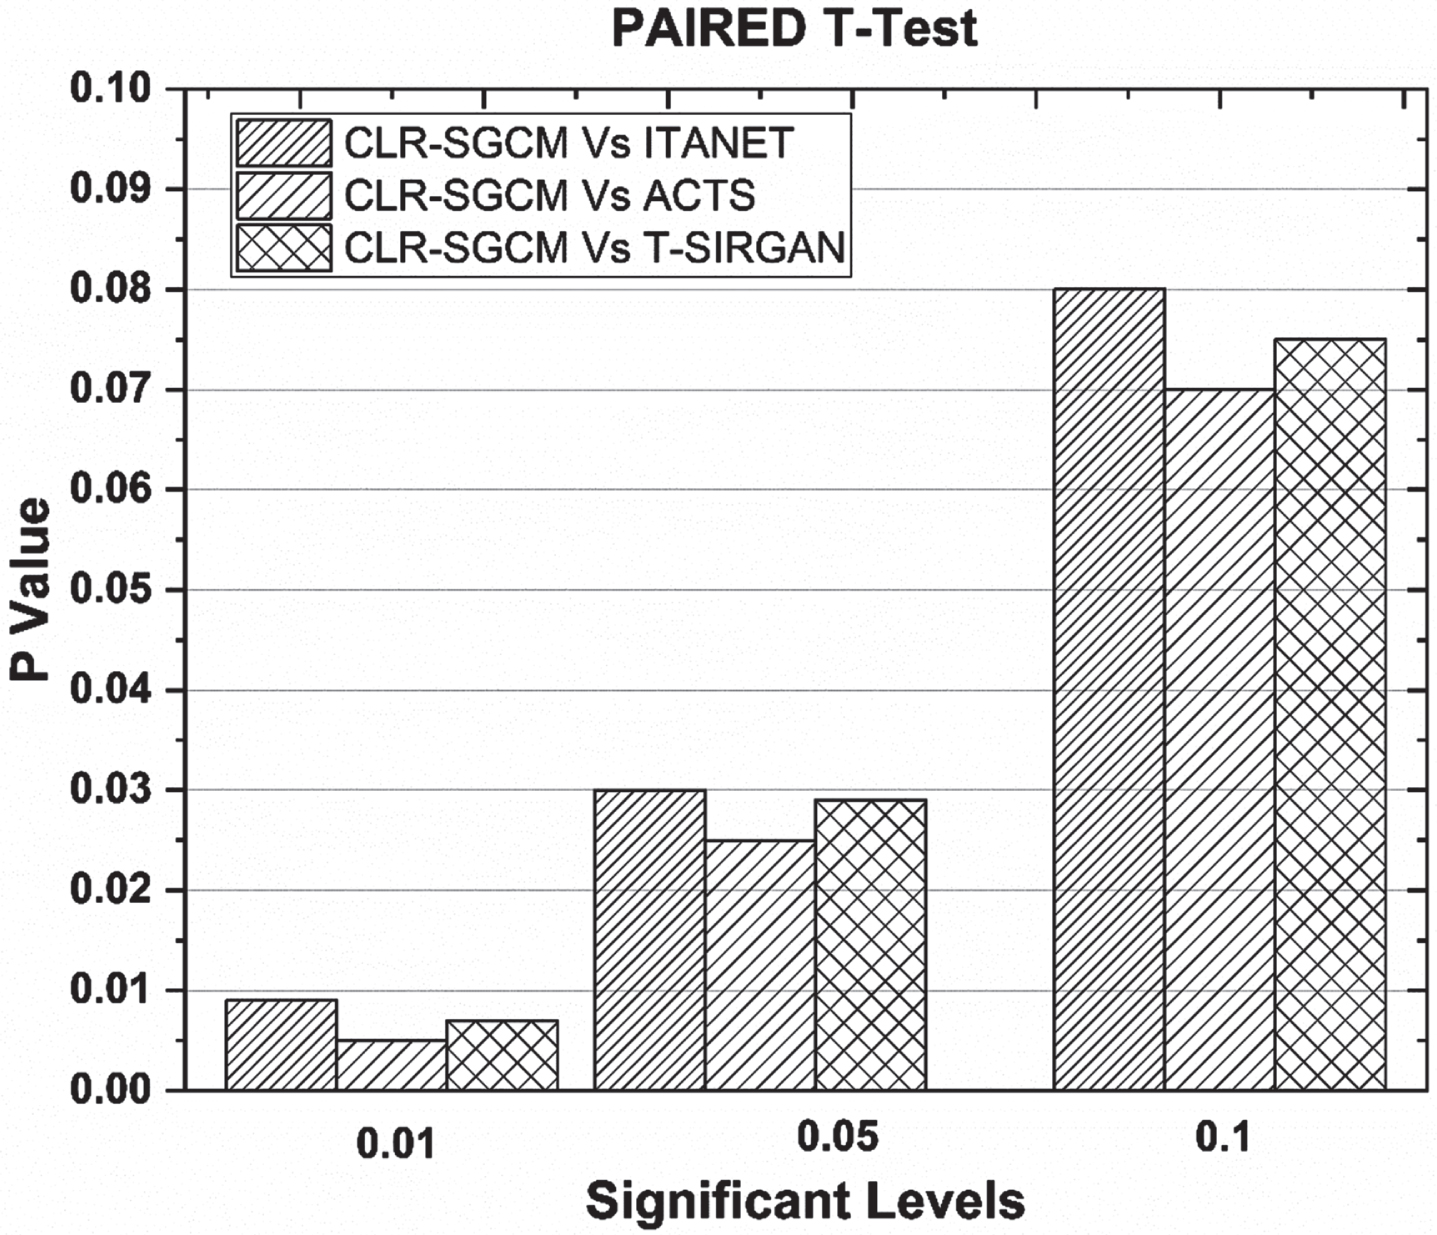
Statistical paired t-test results on classification accuracy.
FLOPS (Floating Point Operations Per Second) were used to calculate the computational complexity of the presented methods, namely LSTM, GRU, and ARIMA. The FLOP of presented method was determined based on the input vector, weight and bias of the network. The computational time in seconds for training covid-19 temporal datasets using LSTM is 498, GRU is 300 and ARIMA 356. The computational time of LSTM is found to be bit higher compared to GRU and ARIMA as shown in Fig. 10.
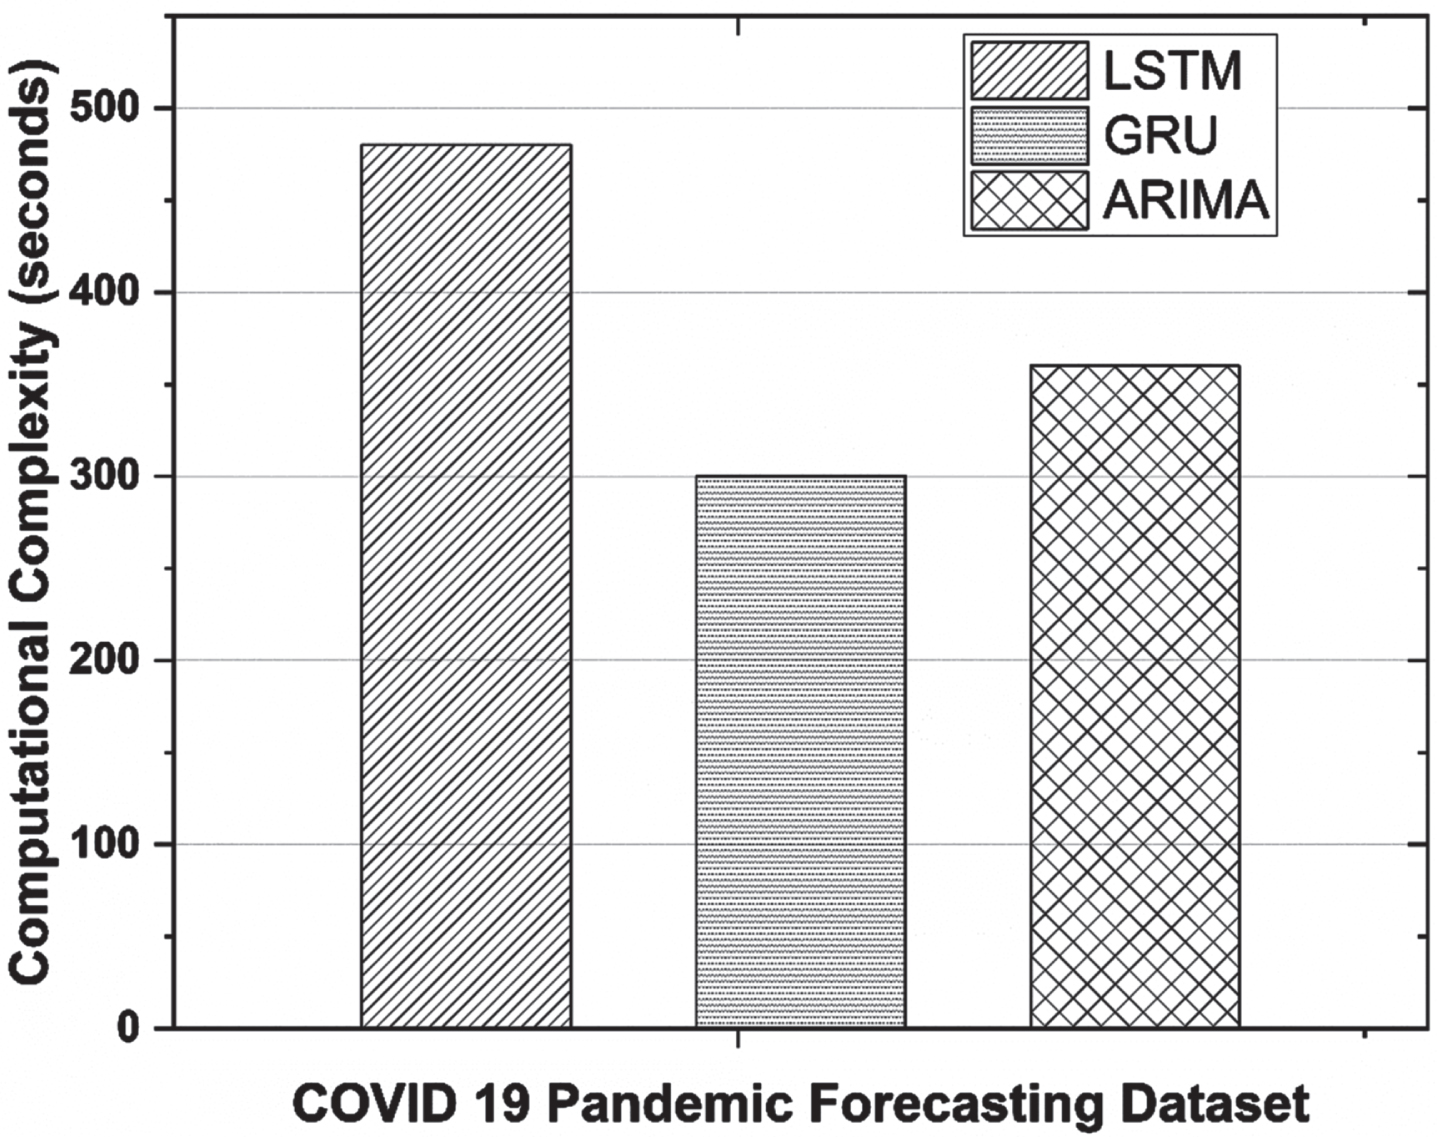
Computational time comparison of stacking ensemble models.
This work designs cyclical learning rate optimized stacked generalization computational model (CLR-SGCM) for predicting covid-19 pandemic outbreak. The presented framework performs hierarchical two-level prediction. The level 0 base learners comprise of LSTM, ARIMA and GRU models. A pooled dataset (PDS) has been created from the predictions of the base models. The learning rates are optimized during training the stacking ensemble base models namely LSTM and GRU using CLR by oscillating the learning rates between lower and upper bounds to minimize saddle points and local optima. This enhances the overall accuracy of the Covid-19 pandemic outbreak prediction. Once trained on the PDS, the level 1 meta regressors namely linear regression, polynomial regression, lasso regression and ridge regression makes the final prediction.
This study is experimented with temporal covid-19 pandemic datasets collected from three regions namely India, the United States, and Brazil. The trained ensemble regressor is used to forecast one-week-ahead cases in India, the United States, and Brazil, these three nations are most impacted by the Covid-19 pandemic. The proposed CLR-SGCM classifier is used to develop a computer-aided decision support system (CADSS) that aids in Covid-19 management such as infection control, case surveillance, and epidemic forecasting, allowing the government and front-line warriors to be better prepared to combat the virus. The model developed using the stacked generalization technique is computationally efficient.
The stacked ensemble model deals with many hyper-parameters that needs to be fine-tuned with optimal values for getting effective classification results. Hence, to improve classification accuracy by employing optimization techniques to find best fit values for hyper parameter tuning to design effective learning models.