
Abstract
This paper extracts the causes of collusion behavior based on literature analysis and expert interviews and obtains collusion causation data. The Apriori algorithm is used to mine the relationship between the causes of collusion behavior, and the network model of the causes of collusion behavior is constructed. The successive failures theory mines the most easily evolved causation chain of collusion behavior. The study results showed that: (1) The critical causes of the formation of collusion are self-discipline consciousness and difficulty of investigation. The strong control ability of causation network of collusion behavior is self-discipline consciousness, difficulty of investigation, and transparency of rights operation. (2) Based on the analysis of the group case data, eight causation chains are most likely to form collusion in actual cases, among which the causation chain of collusion behavior that occurs frequently is “difficulty of investigation⟶self-discipline consciousness⟶interest chain”. (3) In view of the causation nodes in the causation chain of collusion behavior, we propose more effective preventive and preventive control measures for collusion between bidders and tenderers in construction projects from three aspects, namely, behavior awareness binding, collusion implementation dilemma and collusion supervision deterrence.
Introduction
Construction projects, with characteristics such as large investment scale and many participants, are essential to social and economic development. At the same time, its ample profit space may drive some bidders to take illegal and irregular bidding behavior. Bidding collusion is a significant problem in engineering construction, in which the collusion between bidders and tenderers is particularly prominent. Collusion behavior violates the principle of fair competition in the bidding process [1]. It not only harms the interests of other units or individuals involved in the bidding but also affects the achievement of the main construction goals of the project, which may eventually cause terrible social impacts [2]. Therefore, this paper intends to focus on the causes of collusion behavior between bidders and tenderers of construction projects to provide a reference for the prevention and precautionary of collusion behavior between bidders and tenderers of construction projects.
In the study of the causes of collusion, scholars usually analyzed it from two perspectives: endogenous and exogenous causes. Based on the perspective of endogenous causes, Jeanine modeled and analyzed the collusion strategies in the three cases of maximum punishment, collusion without additional cost, and collusion with additional cost, and proved that cost asymmetry is a factor conducive to collusion [3]. By constructing the motivation-behaviour model of bidding collusion, Ni deeply analyzed the internal driving force of bidding collusion from four aspects: project, cost, psychology, and opportunity [4]. Chen et al. used Bayesian networks to deduce the behavioral motives of collusion between the tender agent and the bidder. They found that the bidder sought an information advantage, while the tender agent was due to vested power [5]. Tu et al. explored the endogeneity of collusion between bidding authorities and construction units and its degree of influence through a three-way game. Finally, they obtained the key endogeneity of collusion: the predicted probability of investigation and punishment, reputation loss, collusion cost, and risk preference [6]. Based on the perspective of exogenous causes, Kadalbajoo & Gupta argued that the information asymmetry problem inherent in the bidding market created an opportunity space for bidders to exploit their information advantage for additional gains [7]. Li analyzed the external interference factors of bid collusion, including the weak sense of integrity that created a lousy bidding market culture and the lack of regulation that weakened supervision and deterrence [8]. Wang et al. proposed an exogenous factor based on the combination of utility theory and collusion concept. The results showed that exogenous factors include economic development, geographical location, competition intensity, enterprise ability, and collusion ability. [9]. Most existing studies focused on identifying and quantifying the causes of collusion behavior between bidders and tenderers, but fewer studies analyzed the interrelationship between causes of collusion behavior.
For the research of causal analysis methods, scholars mainly used game and system dynamics models for factor analysis. Wen et al. considered the supervisory unit and the contractor as a community of interest, constructed the interest matrix of the owner and the community, and analyzed the interaction mechanism and steady-state between them using evolutionary game theory [10]. Chen et al. established a three-party dynamic game model with an evolutionary simulation system dynamics model for the monitoring party, bidding agents, and bidders to comprehensively analyze the influencing factors of multi-interest subjects’ collusion behavior and explore their intrinsic connection with collusion behavior [11]. Using the “prisoner ‘s dilemma” game model, Wang et al. showed that as long as the tenderer can set the appropriate reward and punishment mechanism, the problem of collusion between the bidder and the tender agent can be solved to a certain extent [12]. Tang et al. based on the organizational level of the railroad safety supervision system and the causal accident mechanism, considered the influence of collusion between enterprises and employees in rewards and punishments, constructed a three-party evolutionary game model to reveal the behavioral evolution laws of the three parties of the game, and explored controllable factors and methods for the direction of system evolution [13]. Based on prospect theory, Ma et al. developed a four-way evolutionary game model with bidders, subjects with high collusion propensity, subjects with low collusion propensity, and supervisors. The results showed that higher project base returns increase the probability of collusion. In contrast, lower market competition, higher risk aversion, and stronger collusion regulation reduce the probability of collusion. When regulators adopt a robust regulatory strategy, the remaining project participants choose a non-collusion strategy [14]. To better understand the process of corruption transmission in construction projects, Li et al. proposed an improved model of corruption contagion behavior in construction projects to explore the evolutionary relationship of corruption transmission. The study showed that some regulatory measures regulators take could inhibit the spread of early corruption and effectively reduce corruption in construction projects [15]. Current research methods can identify the causes of collusion behavior, but it is challenging to identify the critical causation chains of collusion behavior.
Most relevant research results analyze the causes of collusion between construction bidders and tenderers in a static framework, ignoring the dynamic changes of the causal chain of collusion because the causes of collusion behavior may evolve with the development of collusion behavior. Therefore, based on complex network and successive failure theory, this paper establishes a causation network model of collusion behavior between tenderers and bidders in construction projects, identifies the critical causes of collusion between tenderers and bidders, searches for the most easily formed collusion causation chain, and proposes targeted prevention and precautionary measures to reduce the probability of collusion behavior between tenderers and bidders in construction projects.
The remainder of this paper are as follows. Section 2 discusses the data and methodology used in this paper. Section 3 uses the Apriori algorithm to obtain the causation association rules, construct the collusion causation network and finally obtain the collusion causation chain. Section 4 analyzes the composition nodes of the causation chain of collusion and proposes preventive and precautionary measures for collusion between bidders and tenderers of construction projects. Section 5 includes conclusions and recommendations for future research.
Methodology and data sources
Research methods
Firstly, the causes of collusion behavior identified by experts are used as network nodes. The causal relationships between the causes of collusion behavior obtained using the Apriori algorithm are used as edges to construct the causation network model. Secondly, the load-capacity model in the successive failure theory is chosen to analyze the propagation of collusion behavior cause nodes and deduce the propagation and evolution path of collusion behavior cause nodes in the failure state. Finally, the prevention and precautionary measures for the collusion between bidders and tenderers of construction projects are proposed according to the most likely evolving causation chain, see Fig. 1.
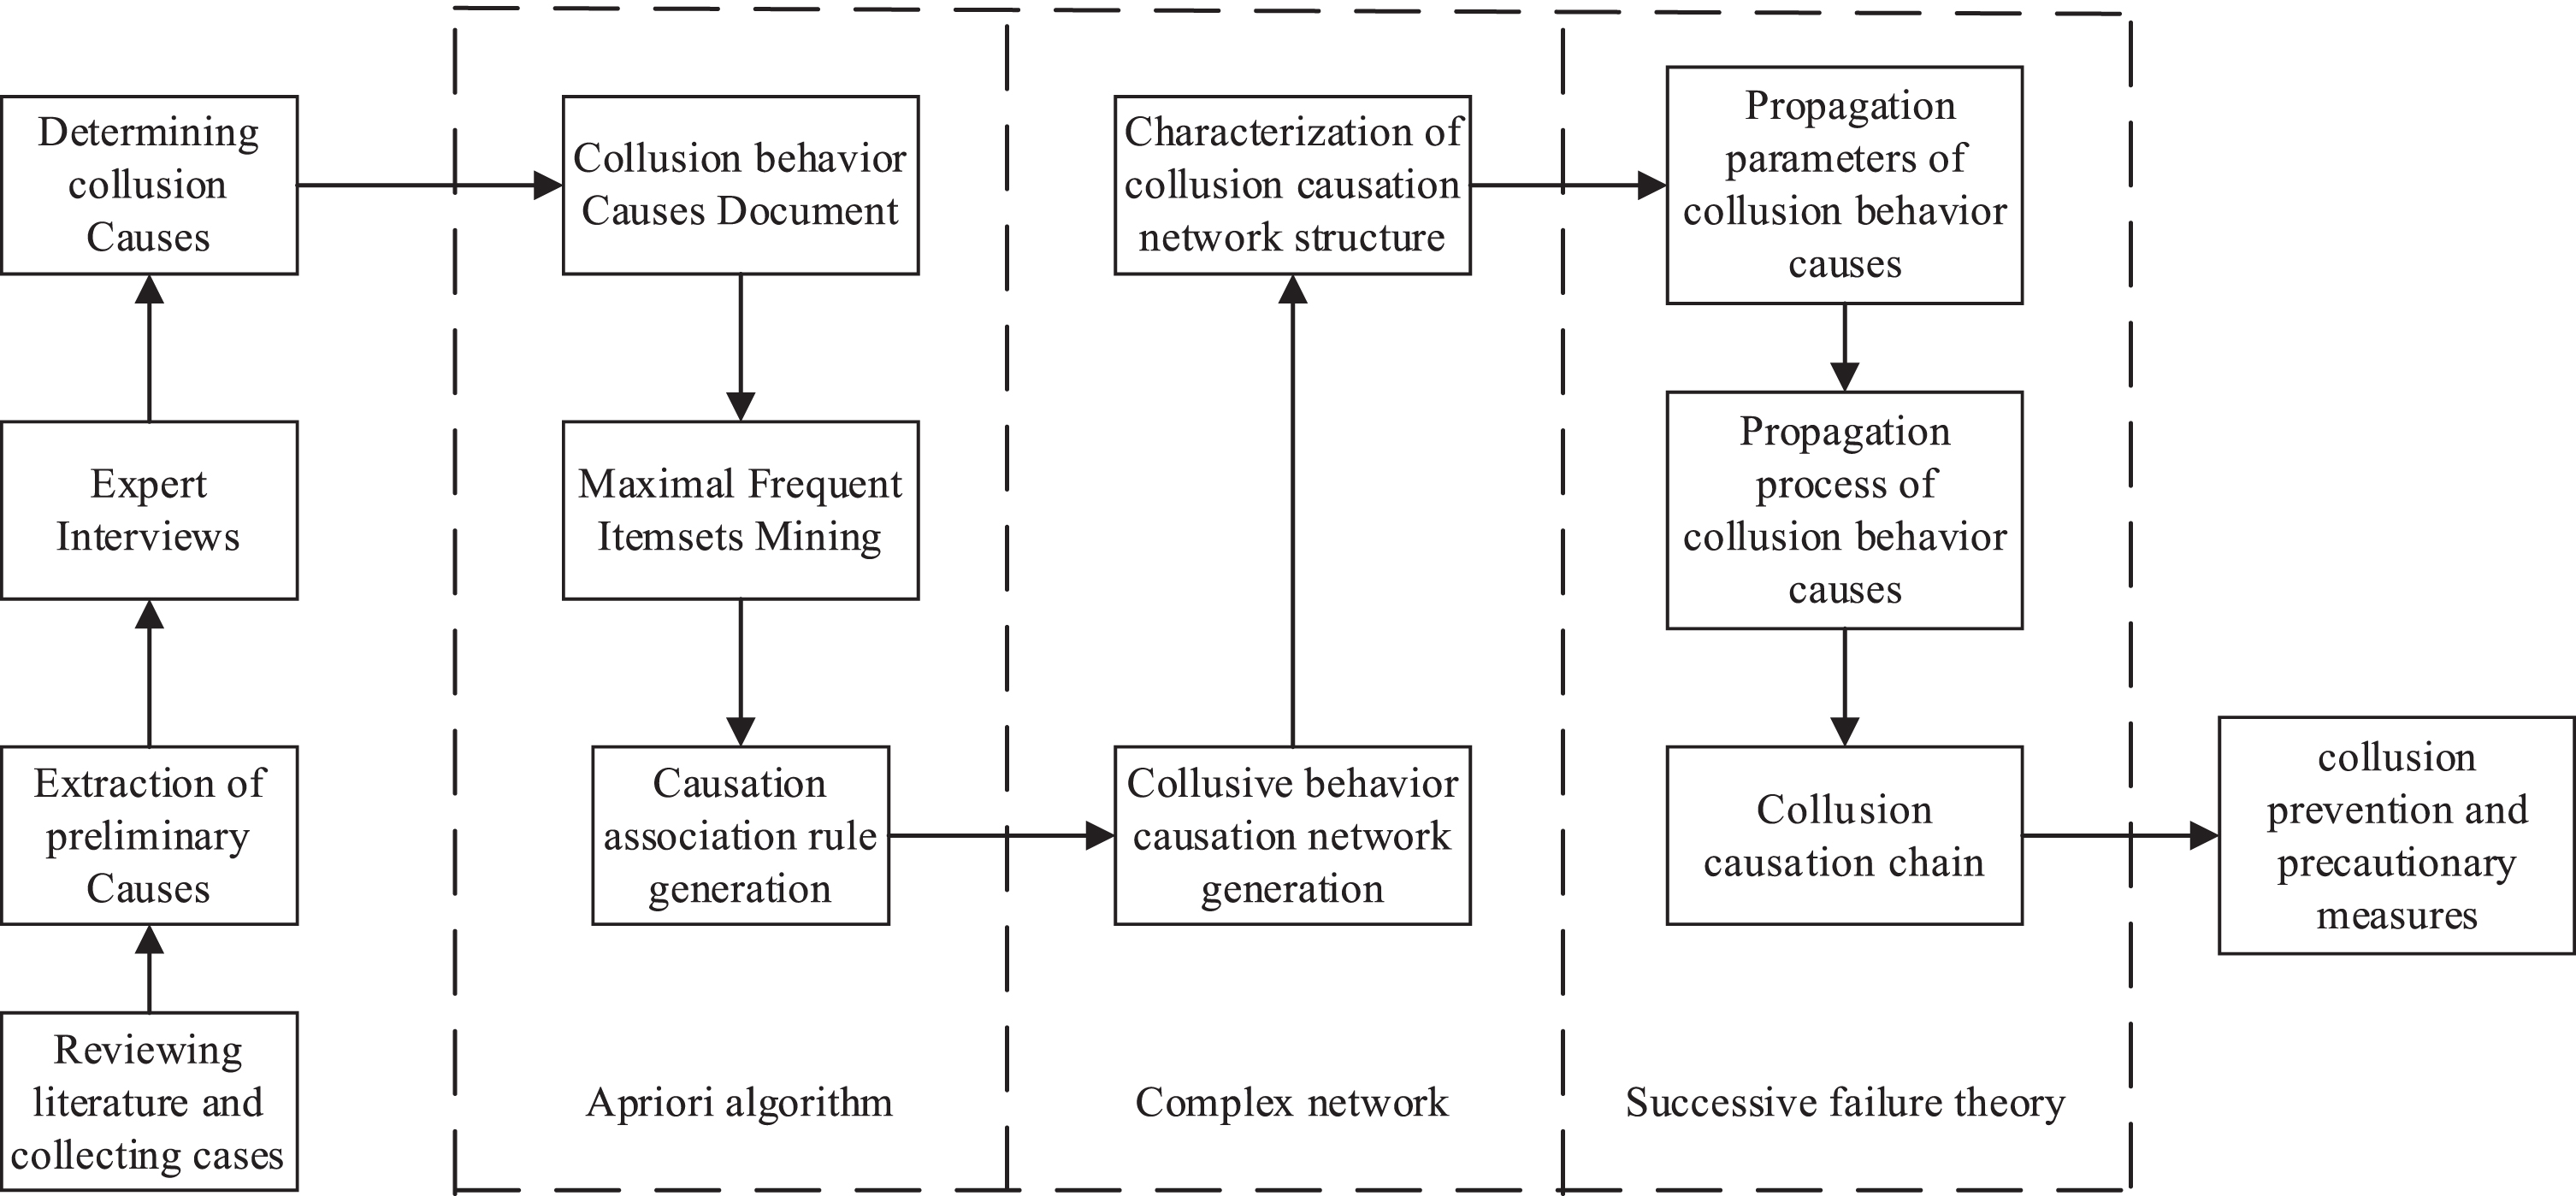
Technology Roadmap.
(1) Apriori algorithm
The Apriori algorithm is often used to mine frequently occurring item sets in databases and the correlations between the items in them, which often do not exist intuitively in the database. After the operation of the Apriori algorithm, the association relationships between the items can be identified by the attribute indicators. These association relationships reveal the potential unknown relationships in the database. When the confidence level of the association relationship exceeds a specific threshold value, the association relationship can be judged to be genuine [16]. The following four indicators capture the causal relationship between the causes of collusion behavior in this paper:
① Support
Support is the number of co-occurrences of events X and Y in the total number of events as a percentage of the total number of events. The threshold value of support is usually set by expert experience or practical situations.
② Confidence
The confidence is the probability that event Y will occur if event X occurs, as in Equation (1). The confidence threshold is usually set through expert experience or practical situations.
③ Expected confidence
The expected confidence refers to the probability of occurrence of event Y when it is an independent event. Assuming that the number of occurrences of event Y as a percentage of the total number of events is n%, the X ⇒ Y expected confidence level is equal to n%, as in Equation (2).
④ Lift
The lift is the ratio of the confidence level to the expected confidence level, as in Equation (3). Where P(XY) denotes the co-occurrence probability of events X and Y, and P(X) and P(Y) denote the probability of occurrence of event X or event Y.
(2) Complex network
The complex network is a theoretical tool to evaluate the running state of complex systems in recent years. It generally abstracts the various elements and their relationships within the complex system into a network structure diagram. It deeply studies the evolution mechanism, diffusion mechanism, and governance strategy of complex systems through graph theory [17, 18]. Based on the causal relationship mined in the Apriori algorithm, this paper constructs the network model structure of the cause of the collusion between the tenderer and the bidder in the construction project.
(3) Successive failure theory
Successive failure refers to the phenomenon that when the network is deliberately or randomly attacked, some weak nodes will be the first to fail, which triggers the failure of other nodes with interrelationships, resulting in a chain reaction that eventually brings down part of the network or even the whole network [19]. In this paper, successive failure means that in the causal network of collusion behavior, when one or a few causation nodes fail by internal or external disturbance, it will trigger the failure or occurrence of other causation nodes through the causal relationship between nodes, thus forming a chain reaction and prompting bidders and tenderers to choose collusion behavior.
The cases used in this article are from the China Judicial Documents website, and the information is authentic and reliable. Firstly, the legal dossier text related to the collusion between tenderers and bidders is searched in the China Judgment Document Network through advanced search methods. The search field is set to “bidding” and the case type is “criminal case.” All the judgment documents related to the collusion between bidders and tenderers are obtained. Then, by selecting the “tender” keywords, the bidding collusion cases are further accurately located and searched. Considering the impact on engineering bidding collusion caused by the publication of the Bidding and Tendering Law (amended version) in December 2017 and the promotion of electronic bidding, this paper sets the search years as 2018–2020 and excludes instruments with only bid-rigging circumstances or not related to bidding collusion. The final number of bidding collusion cases involved is 317.
Results
Identification of the causes of collusion behavior between tenderers and bidders in construction projects
The causes of collusion behavior between tenderers and bidders in construction projects are multifaceted and complex, and 25 causes of collusion behavior between tenderers and bidders in construction projects were identified by analyzing and organizing the literature and cases involving collusion between tenderers and bidders in construction projects [20–26]. The expert consultation method was used to eliminate the causes with weak influence, the specific information of the experts is shown in Fig. 2. Finally, 18 causes were identified. According to the stages of collusion, they were categorized into three levels: collusion initiation, collusion implementation, and collusion investigation and punishment, as shown in Table 1.
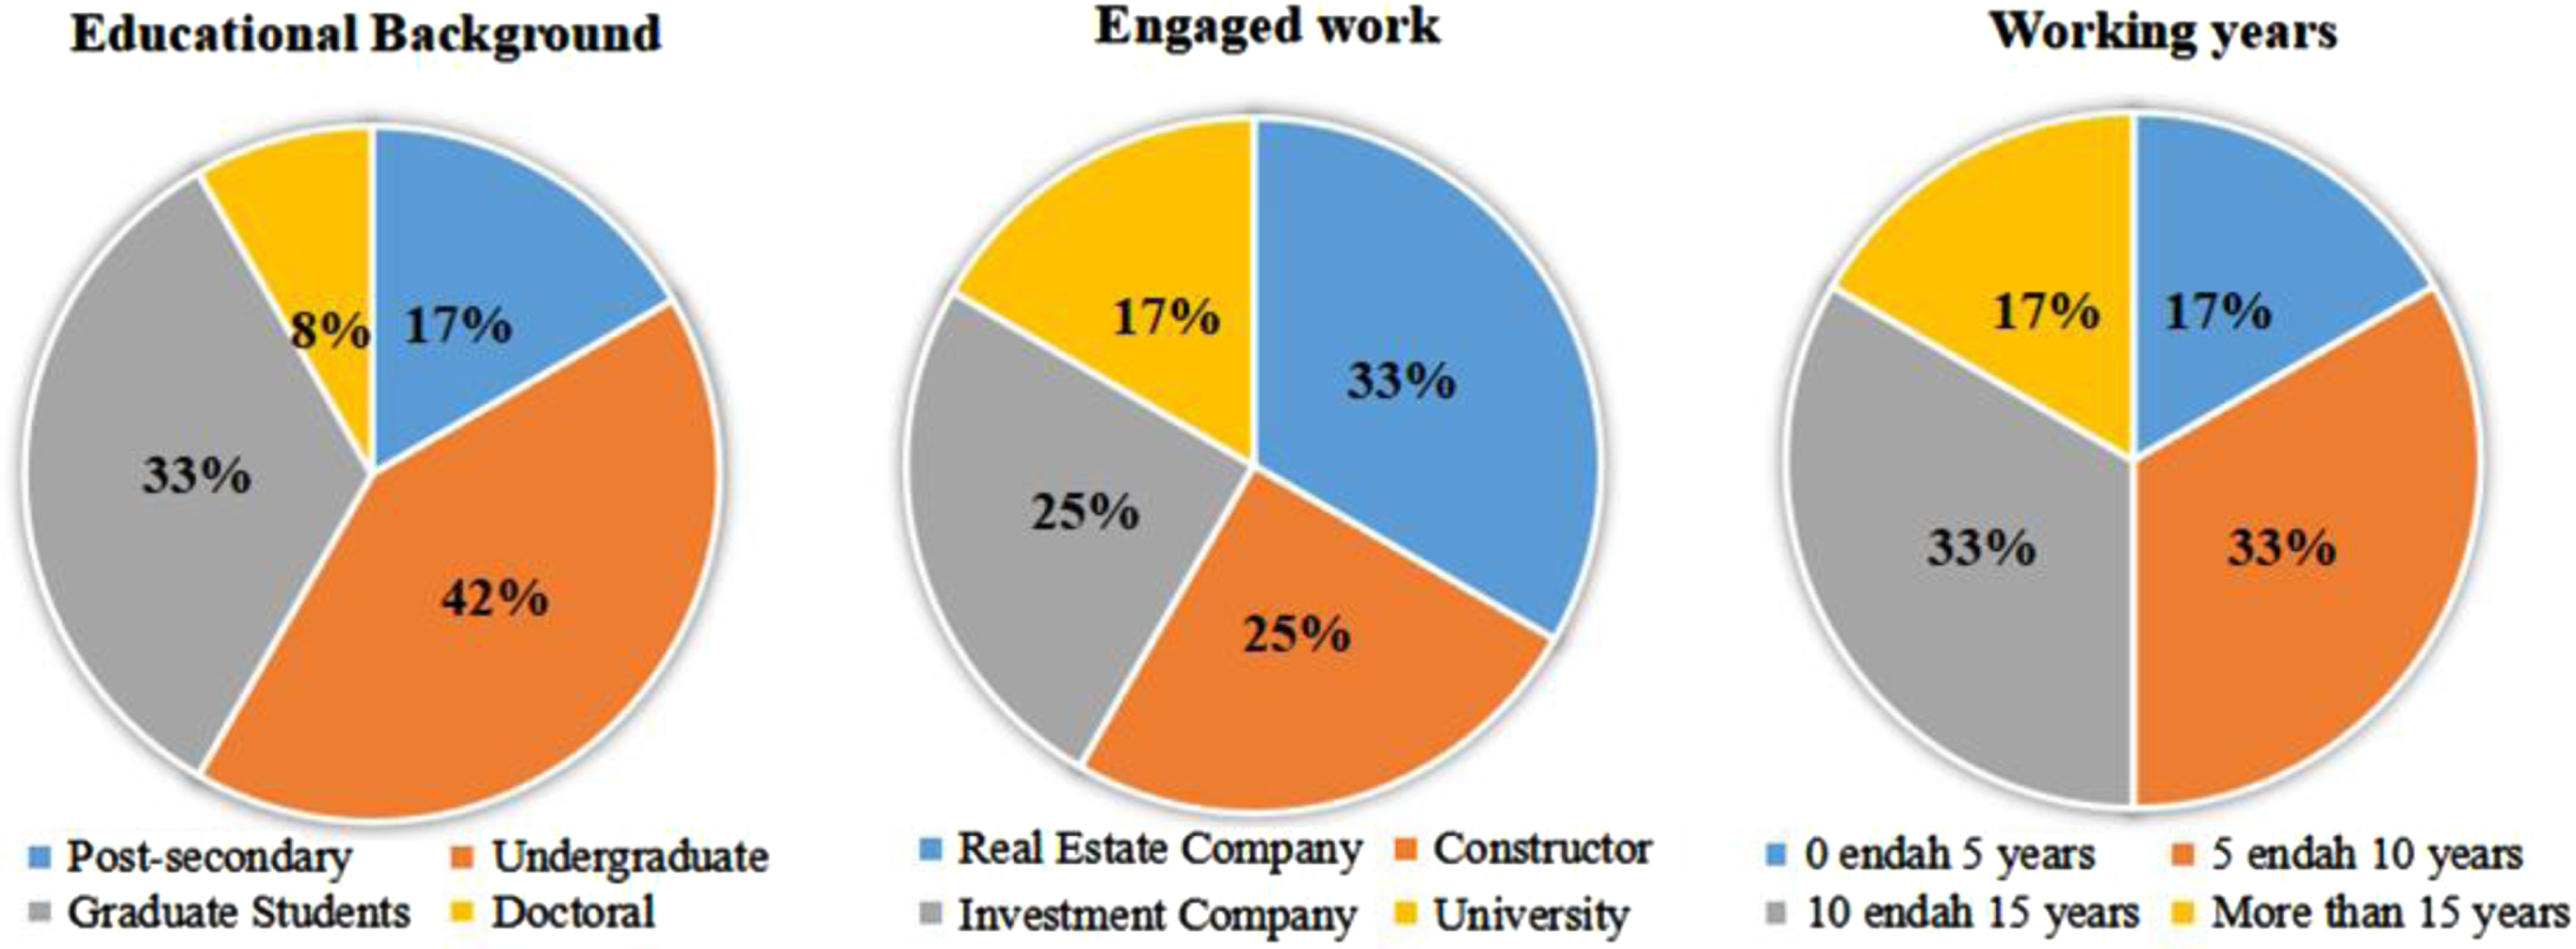
The specific information of experts.
Causes of collusion behavior of bidders and tenderers
Collusion behavior causes document
The causation data in the conspiracy cases were structured using the “0-1” marker method. When a cause of collusion appears in the text of a collusion case, the cause is marked with the number 1, and the opposite is marked with 0. This creates a collusion behavior causation data file, as shown in Table 2. Each row in the table represents a collusion case Di, and each column represents a collusion behavior cause.
Tenderer and bidder collusion causation data file
Tenderer and bidder collusion causation data file
We use the apriori module in Python and the panda tool to write the code for the implementation of the Apriori algorithm and input the collusion behavior causation data file into the Apriori algorithm to mine the frequent patterns in the collusion causation data file, i.e., the set of collusion causation of tenderers and bidders that frequently occur together in actual cases. Referring to the relevant literature [27, 28] and after several experiments, the support threshold is set to 10% in this paper. The results of the obtained frequent itemsets for the causes of collusion behavior between bidders and tenderers are shown in Table 3.
Frequent Itemsets for collusion behavior of bidders and tenderers
Frequent Itemsets for collusion behavior of bidders and tenderers
In all frequent itemsets, the frequent itemsets containing the most items are maximal frequent itemsets. As seen from Table 3, the frequent itemset of order 16 contains the most causes and has a support of 0.12, which is higher than or equal to the support of other frequent itemsets. Therefore, the set of maximal frequent itemsets that causes collusion behavior between the bidders and the tenderers is {A1, A2, A3, A4, A6, A7, A8, B2, B3, B5, B6, B7, C1, C2, C3}.
The association rule for the causation of tenderer-bidder collusion behavior is generated based on the extremely frequent itemsets because, in the principle of the association rule algorithm, factors that do not belong to the extremely frequent itemsets will be regarded as factors that are not universal and lack the need for further analysis of the association rule. Referring to the related literature [29, 30], the minimum confidence was set to 60%, and the lift threshold was set to 1. After the further operation of the Apriori algorithm, the strong association rules satisfying the minimum confidence and more significant than the threshold of elevation are mined out, i.e., the causal relationship between the causes of the collusion behavior of bidders and tenderers, as shown in Table 4.
Tenderer and bidder collusion causation causal relationship table
Tenderer and bidder collusion causation causal relationship table
Collusion behavior causation network generation
Based on the extracted causation causal relationship and combined with complex network theory, the causation network model of construction project tenderer and bidder collusion is constructed, as shown in Fig. 3. In the network diagram, the causation of collusion behavior between the bidder and the tenderer is represented by nodes, and the causal relationship between the causation of collusion behavior is the connecting edge between the nodes, i.e., the network formed by the connection of multiple causation chains.
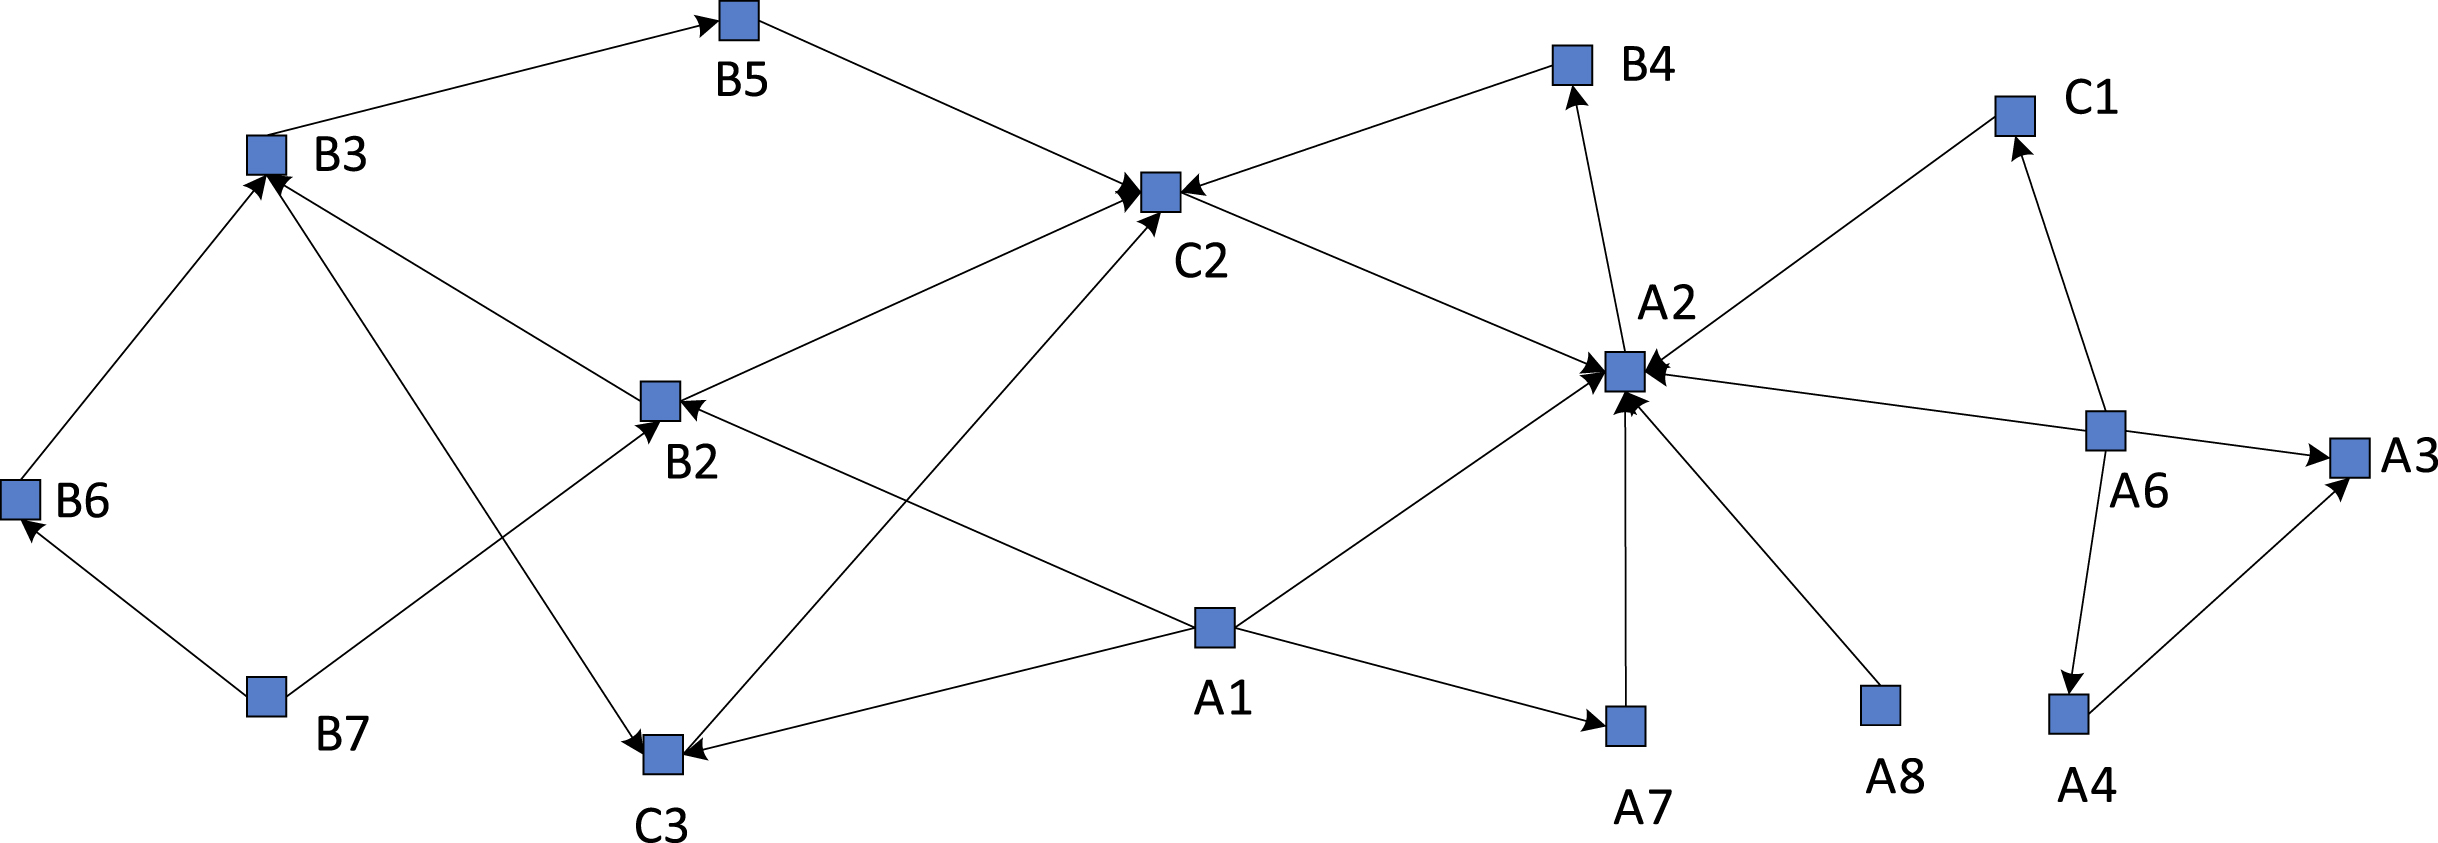
Structure of the causation network model of collusion behavior between bidders and tenderers.
(1) Node degree
The node degree indicates the number of neighboring nodes connected to a causation node. The importance of the causation node to the network can be derived from the degree value of the causation node [31]. Outdegree refers to the number of nodes connected when a causation node is the starting point. Indegree refers to the number of nodes connected when a causation node is an endpoint. The total degree value equals the sum of the outdegree and indegree.
For node i, k
i
degree is equal to the number of nodes directly connected to that node, as shown in Equation (4).
The average node degree is equal to the ratio of the total degree value of the network nodes to the total number of nodes. Its magnitude can be used to portray the connectivity of the network, as shown in Equation (5).
As can be seen from Fig. 4, “Self-discipline consciousness, Difficulty of investigation, Degree of centralization, Profit margin, Discretionary space, Transparency of rights operation” have higher node degrees and are also high-frequency causes of collusion behavior in the collusion causation data file. If the degree of a node is high, it indicates that the cause of collusion is more likely to co-occur with other causes in collusion cases. Compared with strengthening the control of the causes of high-frequency collusion, intense supervision of the causes of such collusion is more effective in preventing collusion between bidders and tenderers.
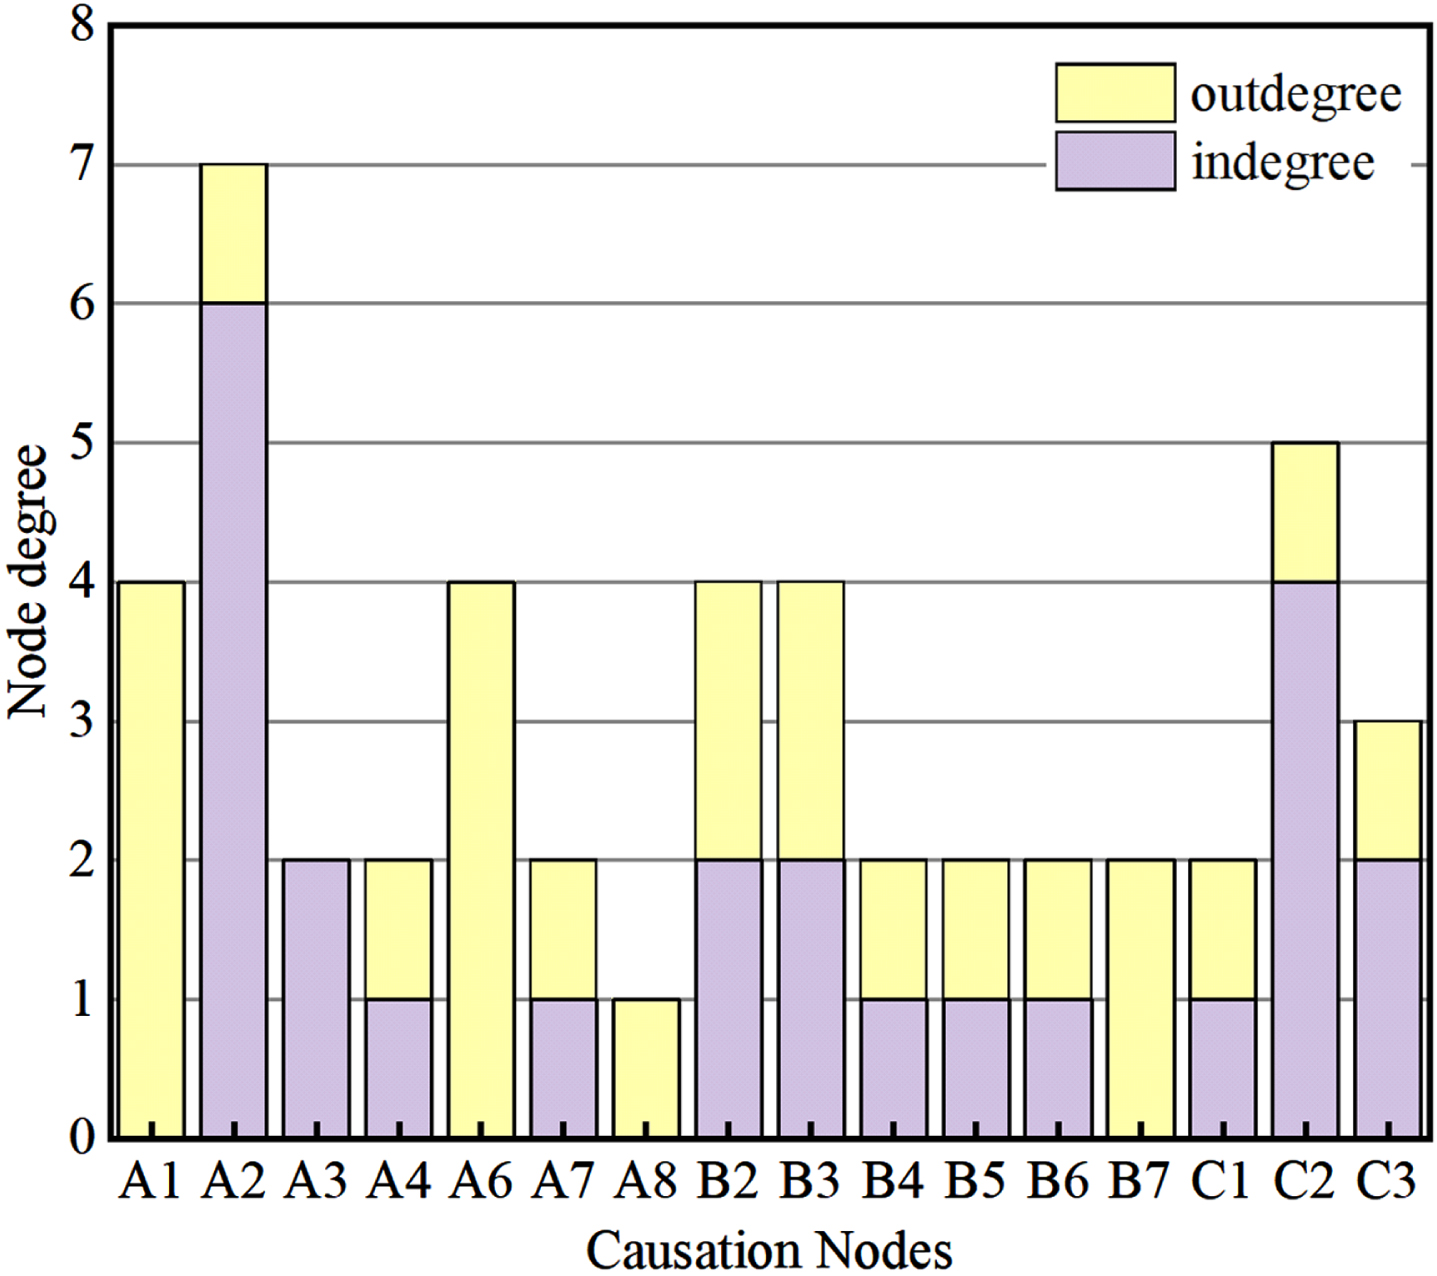
Distribution of causation nodes of collusion behavior between bidders and tenderers.
The average degree value is calculated to be equal to 1.5, i.e., in the collusion behavior causation network, each causation of collusion behavior is connected to one or two causes on average. This shows that the node degree values of the causation network of collusion between tenderers and bidders have a seriously uneven distribution, which indicates that the causation network of collusion is scale-free.
(2) Network diameter and average distance
In the causation network model of collusion behavior, the network diameter is the longest path between any two causation nodes. The average distance is the average value of the distance between two nodes with different causes [32]. The average distance formula is as follows:
From Fig. 3 and Equation (3), the diameter of the causation network of collusion is 5, which results in the longest causation chain of collusion in the network, such as” asymmetric information⟶
transparency of rights operation⟶governance dimension⟶difficulty of investigation⟶self-discipline consciousness⟶interest chain.” The average distance of the collusion causation network model is 1.967, reflecting that the nodes in the collusion causation network are closely connected. Most causes only need to go through one to two intermediate links to influence other causes. This indicates that the harmful effects of the causal agents of collusion have a short propagation path, which can quickly generate a chain reaction and accelerate the occurrence of collusion between bidders and tenderers.
(3) Network Density
The density of the causation network of collusion behavior is equal to the ratio of the actual number of connected edges to the number of possible connected edges of the network, which can be used to measure the density of the causation relationship of collusion behavior and judge the evolutionary trend of the causation network [33]. Suppose the network’s total number of nodes is N and the number of edges is M. Its network density is shown in Equation (7).
Figure 3 and Equation (7) show that the network’s density is 0.1. It reflects that the overall relationship density of the network is low, and the relationship between the causes of collusion behavior between tenderers and bidders is not close enough, showing a certain sparsity. This is because most causes of collusion behavior do not have a direct relationship but need to be formed through other causes. It also reflects that it is difficult for the new nodes to significantly impact the connectivity of the causation network of collusion behavior.
(4) Clustering Coefficient
The clustering coefficient is usually used to describe the extent to which the nodes coalesce into clusters, specifically the connectivity between neighboring nodes of a given node, reflecting the distribution of associations in the causation network of collusion behavior [32]. Equation (8) for the clustering coefficient Si of node i is shown below.
As shown in Fig. 5, “relationship between higher and lower officers, interest chain, competition intensity, competitive edge, the severity of punishment” is the highest point, and the clustering coefficients reach the maximum value of 0.5. This indicates that the neighboring nodes of these five causation nodes have greater connection strength and are highly susceptible to influence each other. Therefore, in the supervision of construction project tenderers and bidders collusion, we should pay close attention to the above causes and do a good job of prevention so that the above causes do not quickly lead to other causes after the occurrence of the above causes. Since “relationship between higher and lower officers, competition intensity, competitive edge” are objective factors, it is difficult to prevent or control their occurrence, so the focus of prevention and control can fall on the causes of “interest chain, the severity of punishment.”

Distribution of clustering coefficients of the causation model of collusion between bidders and tenderers.
(5) Node betweenness
The node betweenness is the number of shortest paths through a node. If a cause has a high mediator value in the network, it means that the cause has strong control over the whole causal network, because most of the connections between causes need to pass through the cause to be generated [34]. The formula for the mediator of node i is shown below:
Where n xy denotes the shortest distance from node x to node y; n xy (i) denotes the shortest distance from node x to node y through node i.
As can be seen from Fig. 6, the betweenness values of “self-discipline consciousness, difficulty of investigation, transparency of rights operation” are higher than the average betweenness of nodes of 7.375, with the highest betweenness value of self-discipline consciousness, followed by difficulty of investigation, and the lowest betweenness value of transparency of rights operation. Nodes with large values of betweenness significantly impact the construction network and, once removed, can devastate the entire network. When managing the network of causes of collusion between bidders and tenderers, we should prevent the causes with high betweenness values, such as “self-discipline consciousness, difficulty of investigation, transparency of rights operation,” or take corresponding control measures in time after their occurrence. Effectively block the implementation of collusion between construction tenderers and bidders and reduce the economic losses brought about by successful collusion.
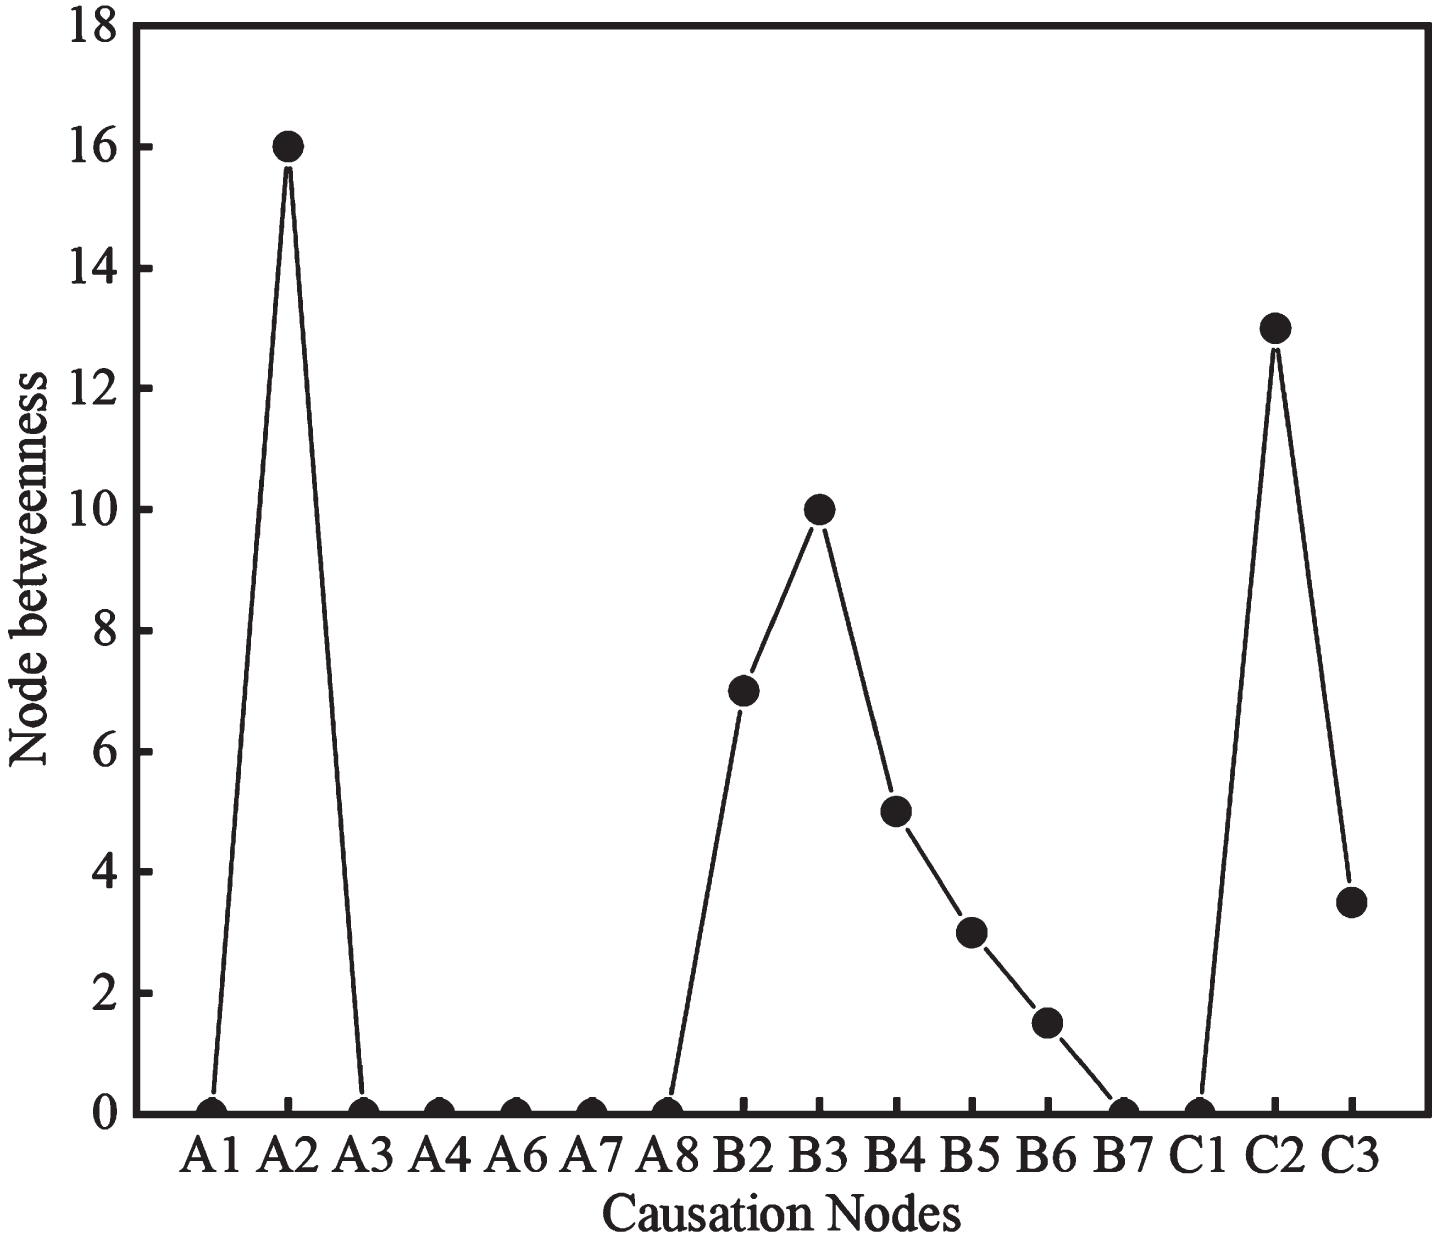
Distribution of node betweenness in the tenderer-bidder collusion causation model.
According to the above conclusions, it is easy to find that the average distance of the causal network of collusion between tenderers and bidders is short, and the clustering coefficient is significant, which coincides with the characteristics of the small-world network. The nature of the small-world network shows a high probability of negative propagation between the causes of the collusion behavior of tenderers and bidders, thus forming a chain of causes of collusion behavior.
Propagation parameters of collusion behavior causes between tenderers and bidders
(1) Initial load
In the collusion causation network model, the initial load is the negative effect of the ordinary collusion causation itself. In this paper, we assume that the propagation path of adverse effects is the shortest path between nodes. The node betweenness reflects the number of shortest paths that nodes are in, so the initial load of nodes is set to the node betweenness, from which the specific value of the initial load of node i can be obtained, as shown in Equation (10).
Where nxy denotes the shortest distance from node x to node y; nxy (i) denotes the shortest distance from node x to node y through node i.
(2) Node Load Threshold
The state transformation condition of the causation node is that the node’s load reaches or exceeds the load threshold of the node, i.e., it transforms from the normal state to the failure state. It becomes an alternative node in the causation chain of collusion behavior. The node load threshold C
i
is usually a proportional function of the initial load of the node, as shown in Equation (11).
(3) Node load redistribution process
The node load redistribution process redistributes the load of the causative node to the downstream node after it enters the failure state, i.e., the propagation process of adverse effects. In this paper, we introduce the propagation strength parameter, which considers the propagation probability and node degree, to judge the magnitude of the load distribution value, as shown in Equation (12).
Where n ij denotes the number of collusion events in which causation i led to the occurrence of causation j. ni denotes the total number of collusion events occurring for cause i. w p denotes the propagation probability corresponding weights. w d denotes the weight corresponding to the node degree. v k denotes the set of kth step downstream nodes. d j (k) denotes the degree of node j in the kth step downstream node.
In the allocation process of a load of uplink node i, the load to be assumed by node j depends on the propagation strength. At the end of the allocation, the load of node j will be updated to the sum of the initial load and the required load to be borne, as shown in Equation (13).
(4) Network efficiency evaluation
When all the nodes on the causation chain and their incoming edges fail, it will destroy the network’s connectivity and affect the transmission efficiency of the network, as shown in Equation (14).
Where N k denotes the k normal nodes of the causation network of collusion behavior. N denotes all nodes in the causation network of collusion behavior.
The process of causation propagation is when the causes of collusion behavior with a specific load are affected by external or other causes and fail. Its load will be propagated to other causes through the causal relationship between causes, leading to the inability of other causes to bear the load, stimulating their adverse effects, and also into the failure process. The following are the three basic rules for the causation propagation of collusion behavior.
(1) Start rule
In the collusion behavior causation network model, the first causation node that enters the failure state will be considered the starting node of the collusion behavior causation chain. Its betweenness value is equal to the initial load.
(2) Termination rules
The causes of collusion behavior evolve by propagating according to time step k. For each step, the causation node can trigger a downstream node. When the causation node cannot continue to propagate downward, i.e., the causation node can maintain its normal state, or there is no downward node, the propagation evolution process of the causation of collusion behavior terminates, and a collusion behavior causation chain are formed.
(3) Cause propagation steps
Step 1: k = 0, all causation nodes belong to the normal state, θ denotes the state, θ=0 at the normal state, and the input node load matrix D(0) with the node load threshold matrix C.
Step 2: When the causation node of the failure state appears, update k to k + 1. Treat the failure node as the starting point of the causation chain of collusion, update the node state θ=1, and enter the propagation probability matrix P.
Step 3: Iterate through all the downlink nodes. If the downlink node does not exist or is already a node in the causation chain, the collusion behavior causation propagation evolution process is terminated. If the downlink node exists, the load assignment value is calculated, and the load matrix D(0) of the downlink node is updated according to the node load redistribution process provisions.
Step 4: Compare the updated node load matrix D(1) with the corresponding values in the node load threshold matrix C. If the matrix D(1)≥C, the downstream node enters the failure state, noted as θ=1. Conversely, the collusion behavior causation propagation evolutionary process terminates.
Step 5: If the state of a downstream node is θ=1, the propagation probability of its incoming edge is zero, and the propagation matrix P is updated.
Step 6: If multiple downstream nodes fail at the same time, the propagation continues downward along the edge with enormous propagation strength, and the failed node connected to that edge is taken as the next node in the causation chain, while the remaining failed nodes are not included in the causation chain.
Step 7: Return to step 2 and individually calculate the downlink nodes in the failure state.
Causation chain of collusion behavior
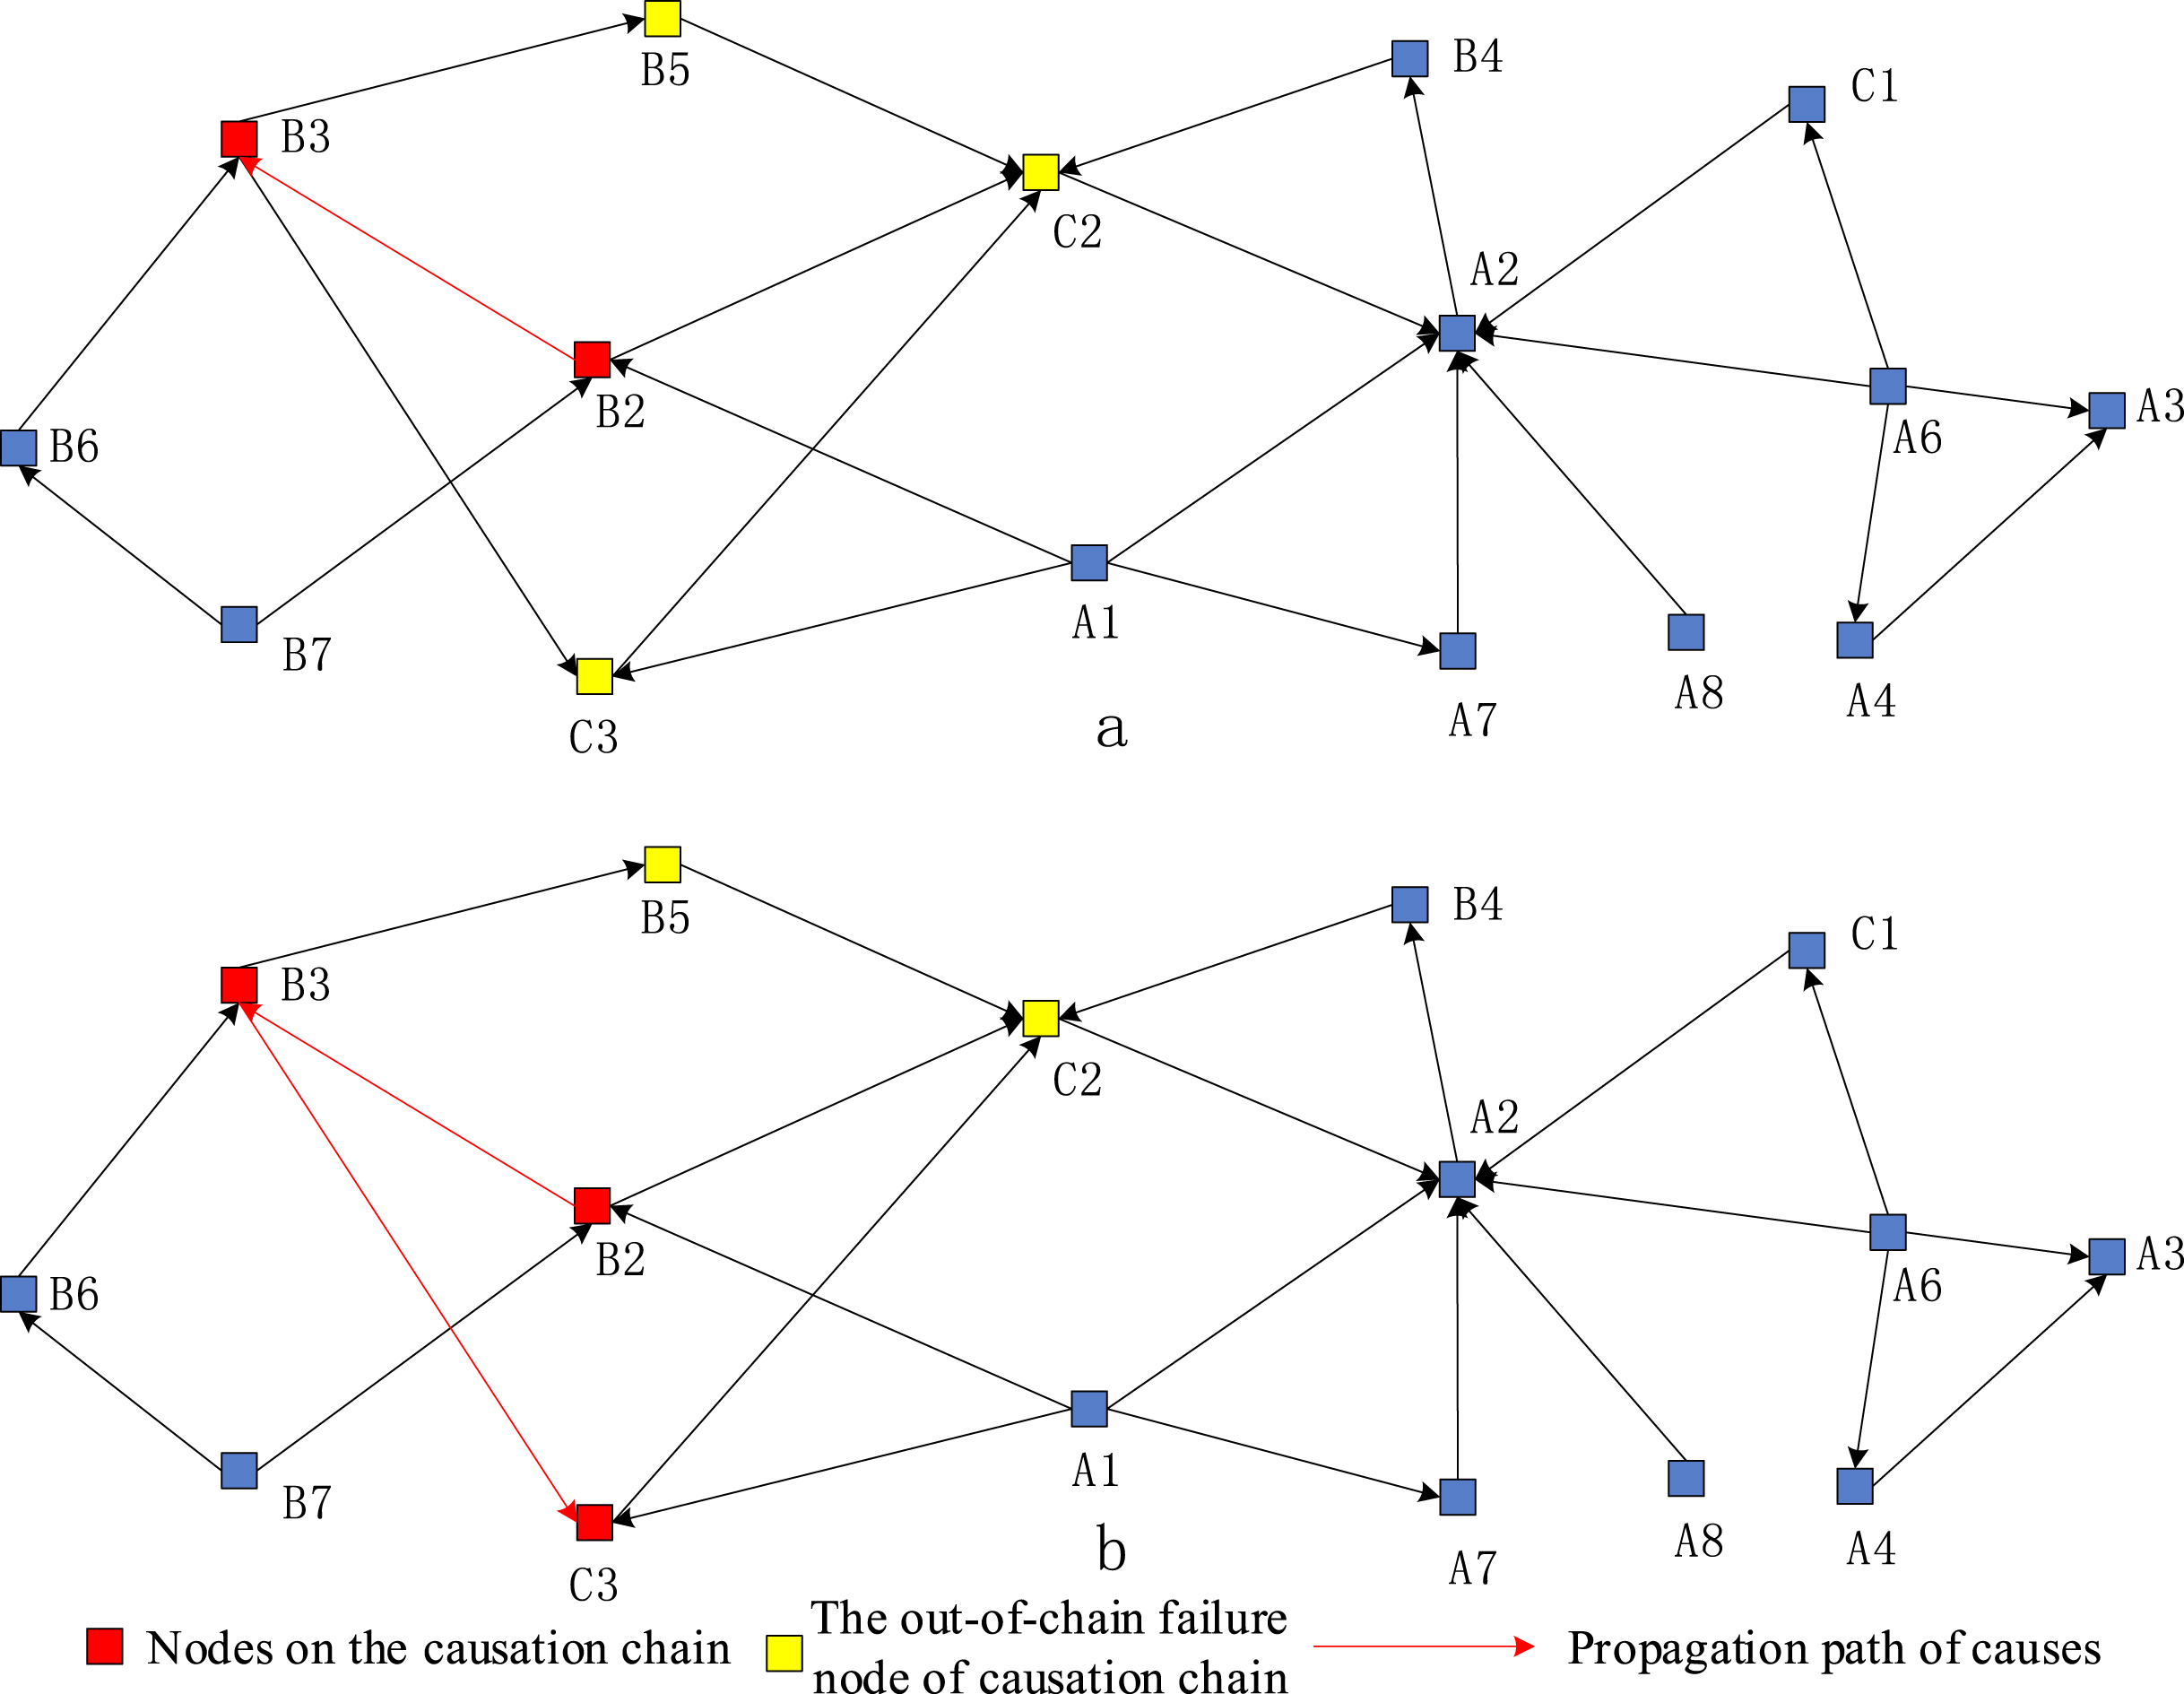
Take the collusion cause “discretionary space” with outdegree of 2 as an example. Assuming that this causation node is disturbed, it generates and propagates its negative effect downward, and the evolution of the causation propagation of collusion behavior is shown in Figs. 7–12. When k = 6, it is found that the downstream node C2 of the causation node B4 is already a node on the causation chain, so the causation propagation process is terminated. Therefore, B2⟶ B3⟶ C3⟶ C2⟶ A2⟶ B4 is the maximum possible direction of propagation evolution.
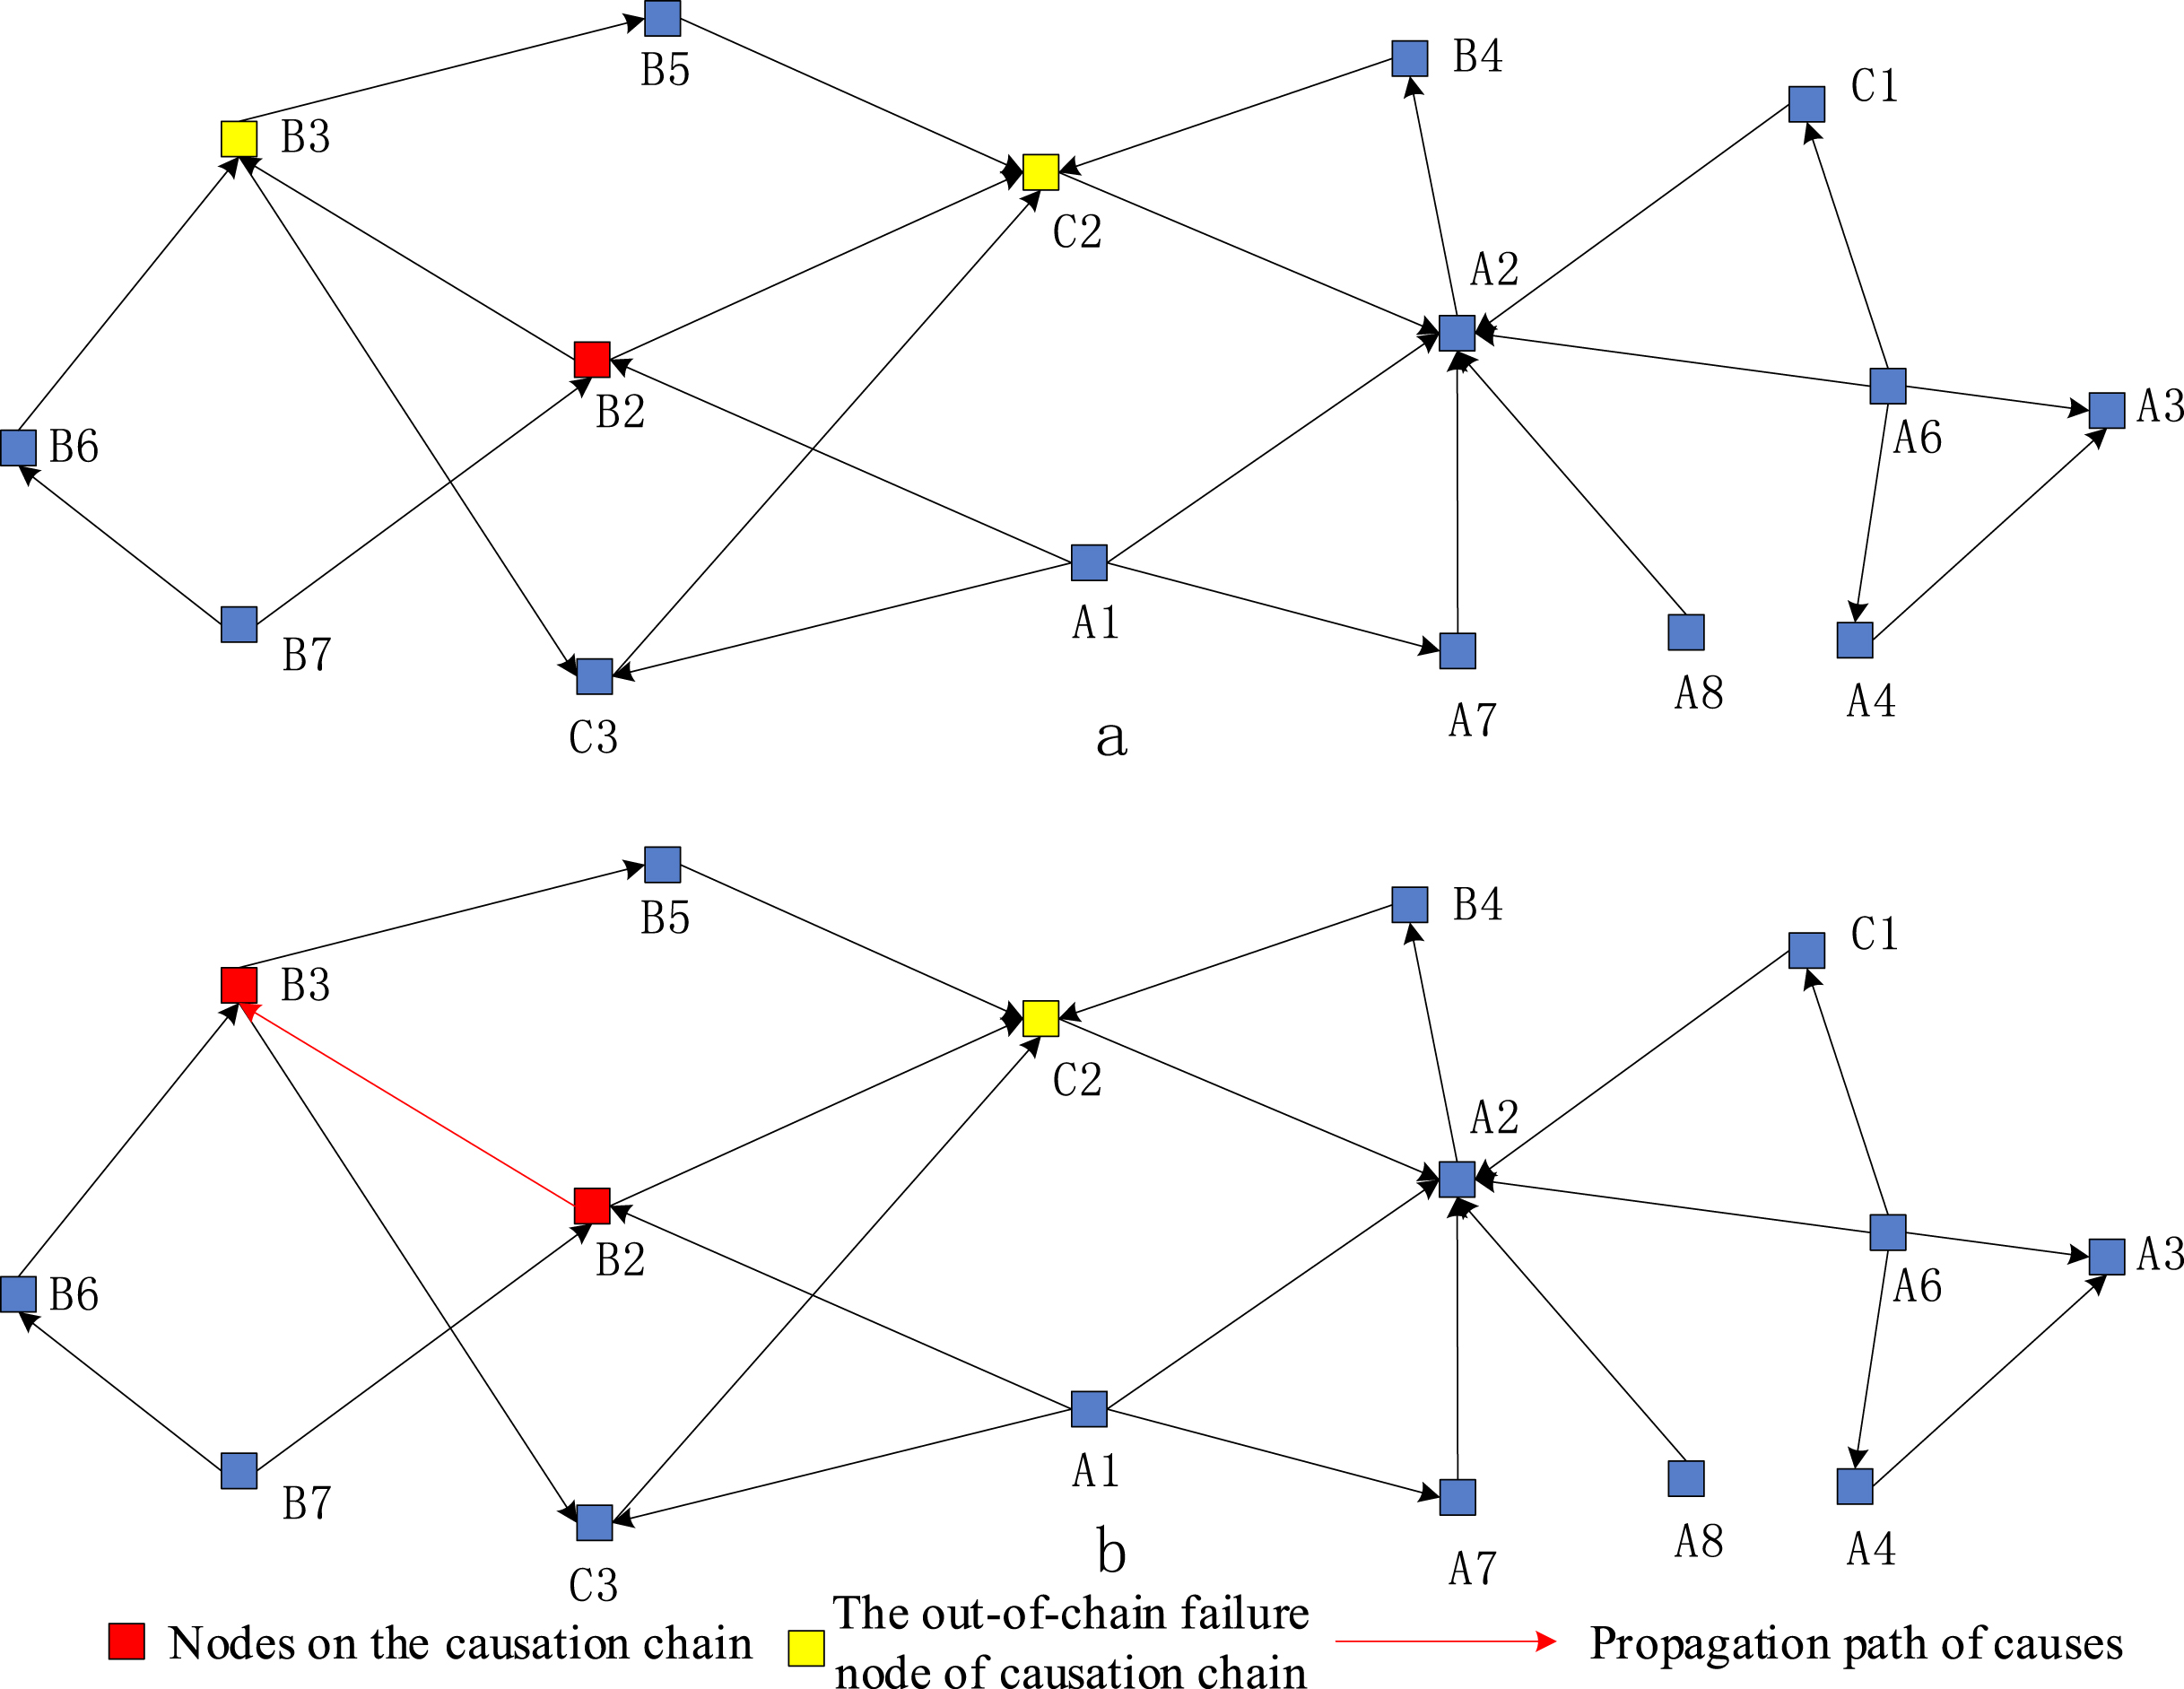
Evolution of k = 1 collusion causation propagation process.
Evolution of k = 2 collusion causation propagation process.

Evolution of k = 3 collusion causation propagation process.

Evolution of k = 4 collusion causation propagation process.

Evolution of k = 5 collusion causation propagation process.
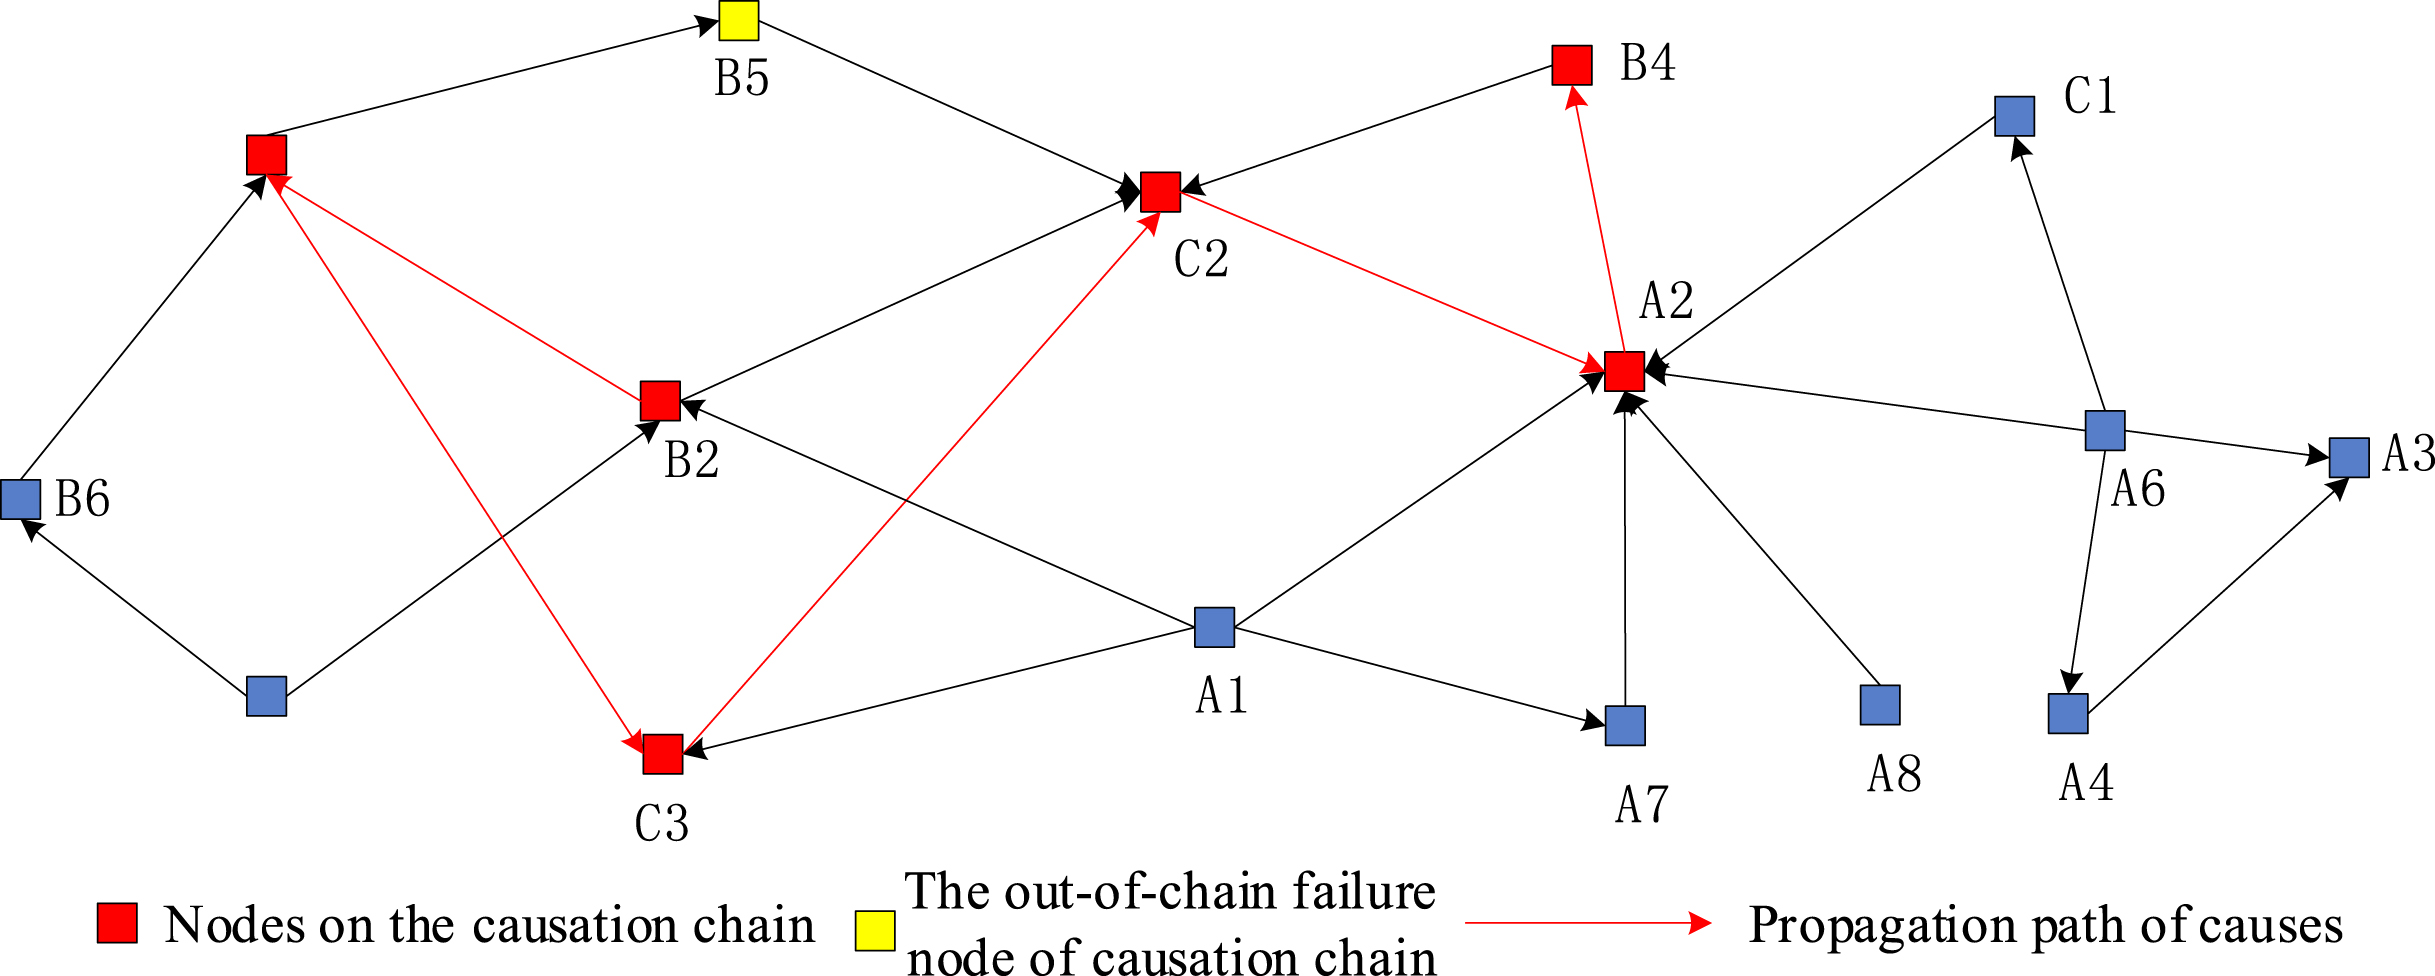
Evolution of k = 6 collusion causation propagation process.
The causation nodes with non-zero initial load were analyzed separately according to the above causation propagation process of collusion behavior. The results of the causation propagation of collusion behavior are listed in Table 5.
Evolution of the causation chain of collusion behavior
By analyzing the propagation evolution of the eight causation nodes with non-zero initial load, the causation chains that are most likely to form collusion in actual cases can be derived. Among them, the “C2⟶A2⟶B4” is the causation chain of collusion that appears in high frequency and is easily evolved in multiple causation chains of collusion. The nodes in the causation chain usually have a strong causation relationship, which can accelerate the occurrence of collusion between bidders and tenderers under certain conditions. In the actual bidding supervision, we should focus on preventing or blocking such collusion causation chains in real time. The identification of the causation chain of collusion helps to discover the root cause of collusion between bidders and bidders, i.e. the starting node of each causation chain of collusion. Thus, the main points of collusion prevention and control can be clarified to further prevent and reduce the occurrence of collusion between bidders and bidders in construction projects. According to the network efficiency results, the more the number of nodes in the collusion causation chain, the more serious the damage to the collusion causation network connectivity.
By analyzing the nodes of the causation chain of collusion behavior, we can see that the starting node of each causation chain of collusion behavior may become the intermediate or terminal node of other causation chains. Take the causation chain of “difficulty of investigation⟶self-discipline consciousness⟶interest chain” as an example. The starting node of “difficulty of investigation” is the intermediate node of the other six causation chains of collusion behavior and the terminal node of one causation chain of collusion behavior. Therefore, this paper proposes preventive and preventive control measures for construction tenderers and bidders’ collusion [35–37], as shown in Table 6, for the causes of “self-discipline consciousness and discretionary space” that belong to the beginning nodes.
Tenderer and bidder collusion prevention and precautionary measures
Tenderer and bidder collusion prevention and precautionary measures
As can be seen from Table 6, according to the beginning nodes of each causal chain of collusion, six preventive and preventive control measures can be proposed. Among them, strengthening the construction of clean thoughts helps the bidding subjects to establish a sense of correct behavior and consciously resist collusion. Improving the legal bidding system and establishing a bidding information disclosure system will increase the operational difficulties in the process of collusion implementation. Increasing disciplinary review, improving the bidding reporting system, and expanding the bidding supervision dimension will significantly increase the probability of collusion investigation and punishment. The path of this six collusion prevention and precautionary measures for tenderers and bidders’ collusion is shown in Fig. 13.

Pathway diagram of the role of collusion prevention and precautionary measures.
(1) Behavioral awareness bondage
① Strengthen the construction of clean thoughts
For bidding practitioners, educational films or articles on bidding collusion can be placed on official media and official websites of the bidding industry. A legal section on bid-rigging can also be set up in the professional qualification examination.
(2) Collusion implementation dilemma
① Improve the legal system of bidding
Clarify the scope of application of evaluation methods in China’s bidding, and even specify the rules of bid evaluation according to the scale of construction projects, to compress the space of bidders’ discretion and guarantee the objectivity and fairness of bid evaluation.
② Establishment of bidding information disclosure mechanism
Electronic bidding should be vigorously implemented to strengthen the publication of information on the whole process of bidding for construction projects. Improve the bidding market integrity file system and increase the penalties for bidders who fail to trust.
(3) Collusive Regulatory Deterrence
① Intensify disciplinary review
Increased disciplinary review is not to carry out a comprehensive review, but to take differentiated disciplinary review measures for construction project bidding subjects with different authorities.
② Improve the bidding reporting system
Establish diversified reporting channels, such as network reporting, e-mail, mailbox and other reporting channels, to enhance the convenience of mass reporting and strengthen the confidentiality of whistleblower information. Special departments are established to verify and investigate the reported information collected from various channels to make up for the shortcomings of other regulatory methods and reduce the difficulty of collusion investigation and handling.
③ Expand the dimension of bidding supervision
Strengthen the pre-supervision and post-supervision of bidding. In the pre-supervision, around the hidden danger that may lead to job crime, non-standard job behavior, as well as job crime derivation of macro and micro factors to carry out preventive investigation, and actively look for collusion clues. In the post-supervision, we can increase the punishment of construction project bidders and bidders’ collusion from three aspects: criminal, administrative, and economic.
This paper focused on the causes of collusion between tenderers and bidders in construction projects. It analyzed the causes of collusion between tenderers and bidders, the causal relationship between the causes, and the evolution of the propagation of the causes. This had a specific reference value for optimizing the bidding system of construction projects in China. At the same time, it can provide new ideas to solve the problems such as the difficulty of prevention and precautionary of construction project tenderers and bidders collusion. The main research conclusions obtained from this paper were as follows: The Apriori association rules algorithm was used to mine the causal relationship between causes of collusion, which generated the collusion cause network between tenderers and bidders of construction projects. It analyzed the structural characteristics of the network. It was found that the tenderers and bidders collusion causation model has a small-world network effect, i.e., the collusion causation was prone to a negative propagation effect. Using the load-capacity model of successive failure theory to analyze the propagation evolution of collusion causes, the maximum possible propagation direction of the negative effect of the cause node in the failure state was obtained, and the collusion cause chain was thus obtained. According to the nodes of the causative chain, six prevention of collusion and precautionary measures were proposed, such as strengthening the construction of clean thinking and improving the legal bidding system. By improving the legal system of bidding, establishing the bidding information disclosure mechanism and other preventive and precautionary measures, building up the ideological awareness that cannot collude, the disciplinary mechanism that dares not collude, and the preventive system that was not easy to collude, the phenomenon of collusion between bidders and tenderers of construction projects is strongly curbed.
There are still some limitations in this study, and it is also a direction for further research in the future. China is moving towards the informatization and intelligence era, and “Internet+engineering bidding” will become the new normal. Since the cases of collusion between bidders and tenderers in construction projects used in this paper are all historical data, the measures obtained may only partially meet the requirements of collusion prevention and precautionary in the new normal. In the future, we can consider combining new technological means such as artificial intelligence, big data, cloud computing, and blockchain with bidding supervision to propose prevention and precautionary measures for collusion between bidders and tenderers that can better meet the requirements of the new era.
Footnotes
Acknowledgment
This work was supported by the Postgraduate Scientific Research Innovation Project of Hunan Province [NO.CX20230860], and Natural Science Foundation of Hunan Province [NO.2023JJ30056], and the Changsha Natural Science Foundation Project [NO.kq2208237].