
Abstract
A novel enhancement method to improve resolution and contrast has been proposed to address the issues of blurring and distortion commonly encountered in traditional patterns. Initially, a discrete wavelet transform, a stationary wavelet transform, and an interpolation algorithm are used to obtain high-resolution images of traditional patterns. Subsequently, improved singular value matrix coefficients and reconstructed gamma function are used to enhance the image contrast to obtain high-resolution and contrast-enhanced patterns. Experimental results demonstrate the efficacy of this method, as evidenced by improved evaluation indexes, such as mean square error, peak signal-to-noise ratio, and structural similarity, in comparison to other existing methods. The proposed method effectively improves the quality of traditional patterns and offers significant contributions to research on the restoration and protection of traditional patterns.
Keywords
Introduction
The research progress in digital image processing technology based on computer vision has witnessed rapid advancements due to the rapid development of artificial intelligence. An increasing number of people use computers to replace manual work, such as target identification, tracking, and measurement and to further perform graphics and image information processing. In the current information age, image processing is not only widely used in aerospace [1–3], remote sensing images [4], medical testing [5, 6], and industrial testing [7]. Image processing is an essential step in for building digital recognition models of certain features.
Globally, nations are characterized by their diversity and rich cultural heritage. Each nation has developed its unique traditional patterns that symbolize their national characteristics. Traditional patterns are widely used and are very popular in architectural design, home decoration, and clothing manufacturing. However, with time, environment, and other factors, traditional patterns have suffered varying degrees of damage, and there is a lack of a digital classification and preservation of traditional ethnic patterns. China is a multiethnic country. Every generation is responsible for protecting and inheriting the national culture. Taking the Mongolian ethnic minority as an example, their unique way of life has given rise to a plethora of distinct ethnic pattern elements, such as animal patterns, plant patterns, and geometric patterns. Yang studied the classification, symbolic meaning and application of Mongolian patterns in modern furniture [8]. Han et al. classified and recombined Mongolian pattern elements [9]. However, none of them have digitally processed traditional patterns to be further classified and preserved. Owing to factors such as environment, collection equipment, and line transmission, the collected patterns have issues such as reduced contrast and distortion. This poses significant challenges in the digital storage of patterns and the establishment of recognition models. Therefore, pattern enhancement is becoming increasingly important. Wang used an adaptive gamma correction (AGC) algorithm in the Lαβ color space to enhance a distorted Mongolian furniture pattern [10]. This method achieved the desired enhancement effect, however, it exhibited limitations in processing detailed areas with intricate pattern resolution and texture features. Du et al. Applied quantiles to subdivide the low-frequency components of the patterns, moreover, they equalized and inversely transformed the sub-histogram [11]. The enhanced pattern details are more prominent, but the sharpening of the pattern edges was more pronounced.
Digital image processing is simple and efficient, with accurate target feature extraction and high calculation accuracy [12]. It has been widely used in the field of digital research on material characteristics, but there is still limitations in its application to digitize national traditional patterns. Therefore, exploring methods for enhancing the national traditional patterns is significant for improving the speed of pattern detection and data accuracy, establishing a comprehensive digital pattern database, and protecting and inheriting national culture. In recent years, some pattern enhancement methods have produced certain effects, but the application is single, and the enhancement effects such as resolution and contrast are not ideal. This paper proposes a novel enhancement method based on a frequency domain singular value and an improved gamma function pattern, to adress the above mentioned issues. A qualitative and quantitative comparative analysis with the traditional method shows that the proposed method effectively addresses common issues encountered in traditional patterns, such as low resolution and low contrast.
The rest of the paper is organized as follows: Section 2 discusses the theoretical background of the study, Section 3 elaborates the proposed method, Section 4 presents the experimental results, Section 5 compares and analyzes the proposed method with the three other methods, and Section 6 presents the conclusion of the paper and future work direction.
Theoretical background
Image resolution enhancement, improving image has long been an important research focus in the field of image enhancement. Discrete wavelet transform (DWT), Stationary wavelet transform (SWT), and integer wavelet transform are three versatile tools for modern image processing. These techniques can effectively improve the image resolution [13]. DWT is image compression with a smaller area and low power consumption. In DWT and SWT, an image is decomposed by passing through an analysis filter bank what consists of a high-pass and low-pass filter at each level. DWT and SWT are applied to decompose the pattern along the rows and columns of the input image, respectively, to obtain the low-frequency and high-frequency sub-bands of the image, namely, low-low (LL), low-high (LH), high-low (HL) and high-high (HH). Figure 1 shows the image decomposition using DWT.
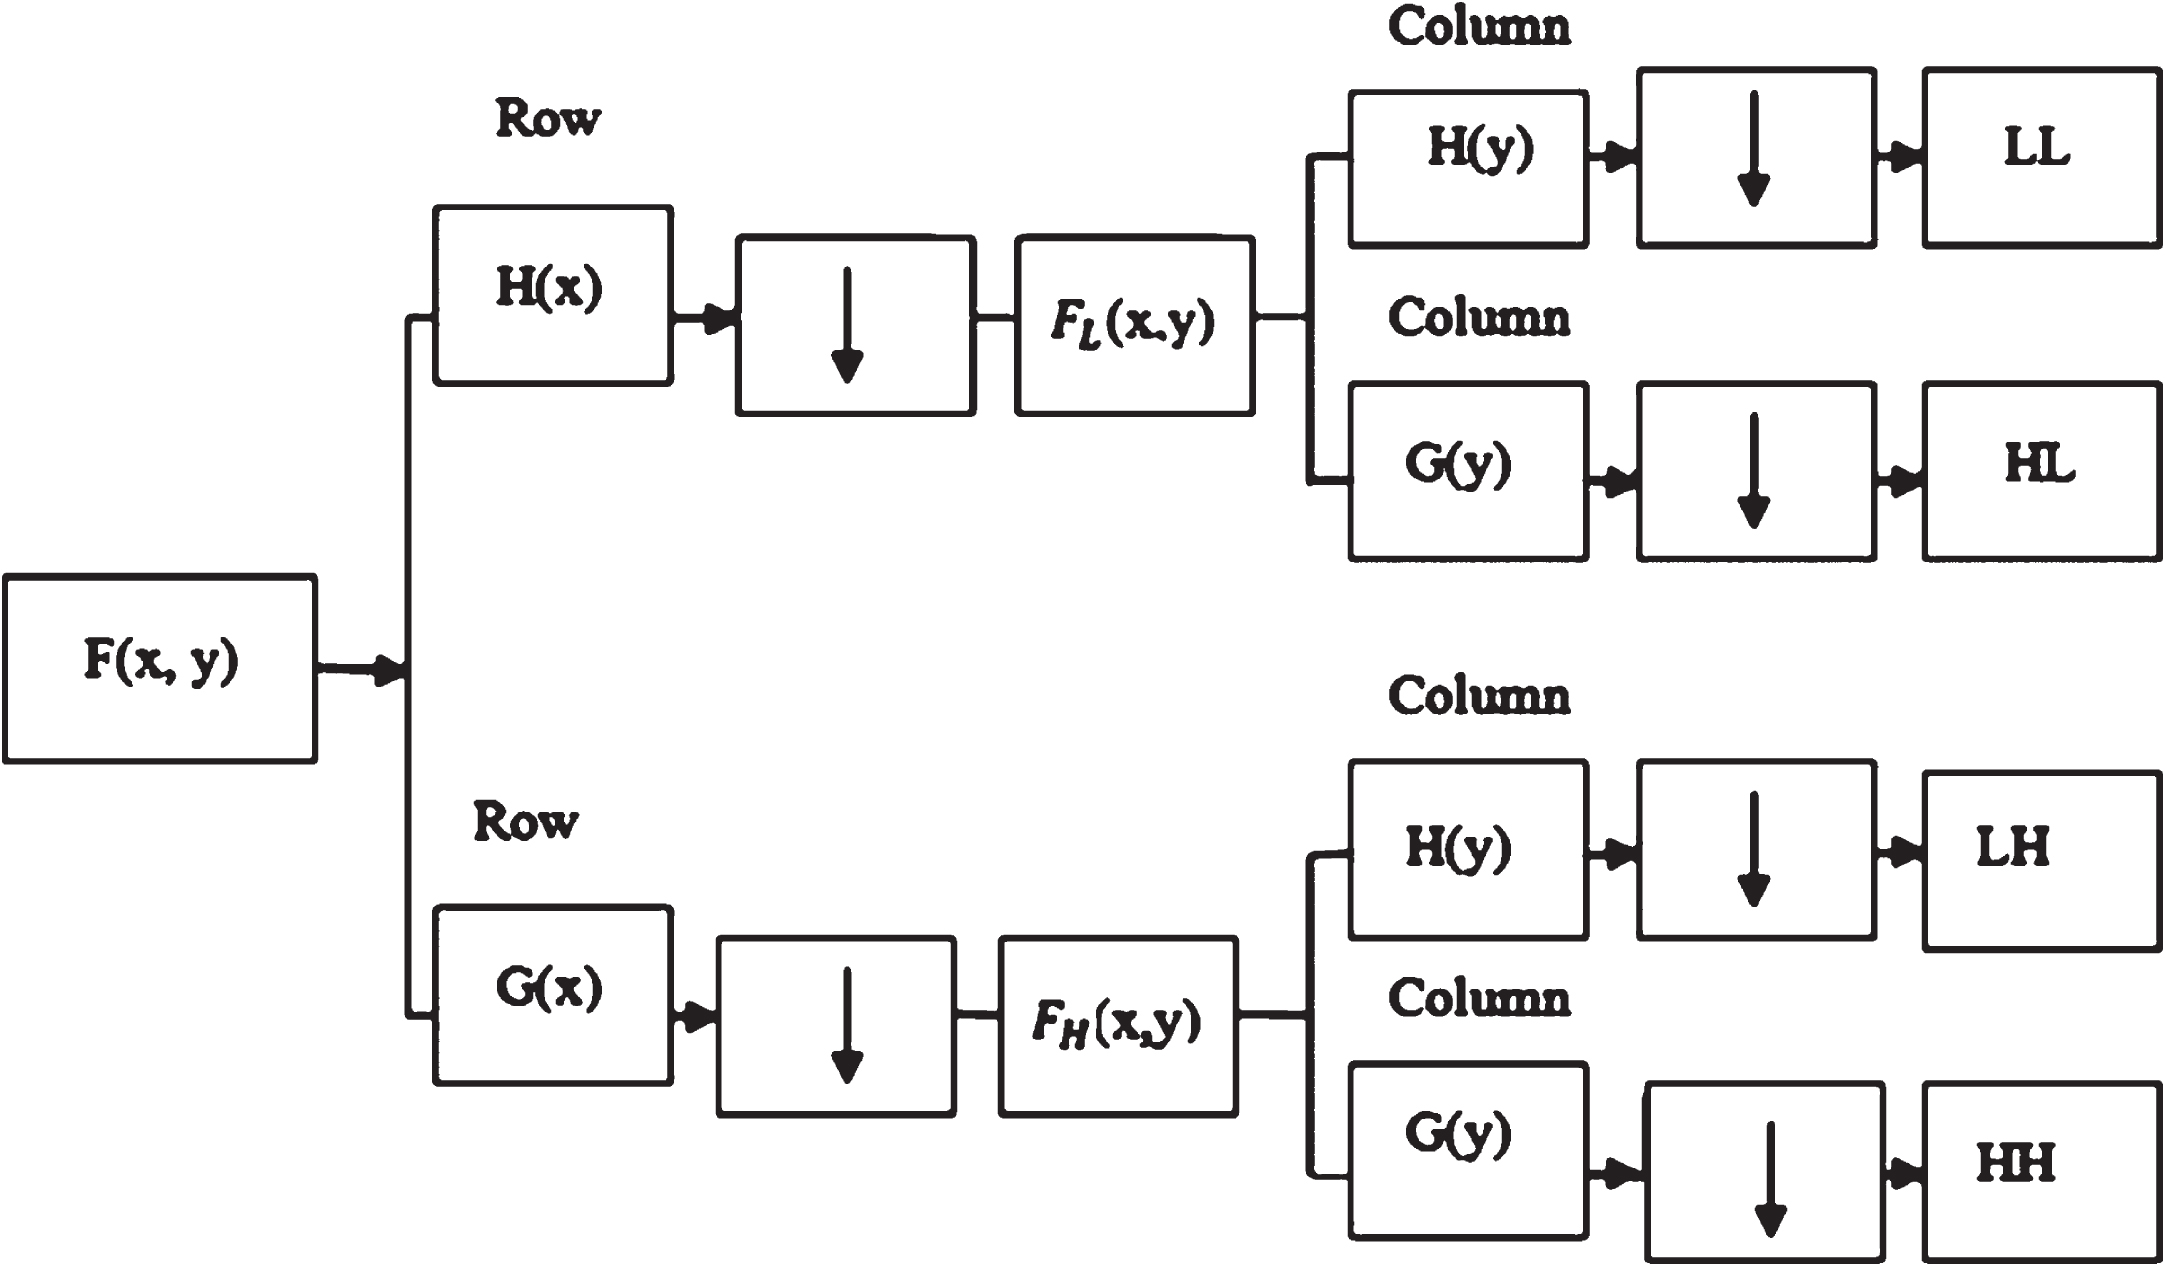
Image decomposition using DWT.
In recent years, researchers have proposed various interpolation techniques, such as bilinear interpolation, bicubic interpolation with high calculation accuracy, and wavelet-based interpolation techniques. The nearest neighbor interpolation technique is simple, but it can easily cause serious deformation of the straight edge;therefore, it is rarely used. Suresha D proposed the n-nearest neighbor adaptive bilinear interpolation method to improve the resolution of a single low-resolution image [14]. Pejman Rasti et al. performed bicubic interpolation on low-resolution images, and then registered the interpolated images to generate high-resolution images [15]. Quantitative results and visual results show that the technology is superior to traditional methods. Gunnam Suryanarayana et al. proposed a bicubic interpolation technique based on wavelet transform to improve image resolution [16], and Aamir et al. proposed a bicubic interpolation technique based on singular value decomposition (SVD), Stationary Wavelet Transform (SWT) and DWT [1]. Both approaches have demonstrated improved accuracy and image resolution. Sahar Aboshosha et al. Proposed a method based on inverse interpolation and adaptive histogram equalization [17]. Experimental results show that the histogram equalization after interpolation can achieve higher resolution.
Increasing the contrast of the image helps obtain more information from the image. Currently, the rapid development of image enhancement methods based on wavelet, histogram, singular value decomposition, and gamma correction has produced considerable improvements in contrast and image quality. The method proposed by Rasti et al. uses SWT to decompose the image, in order to enhance the brightness of the low-frequency sub-band. Moreover, a high-frequency sub-band is added to the edge of the image to enhance the contrast of medical images with poor illumination [18]. R. Priyadharsini et al. performed Laplacian filtering on low-frequency sub-bands based on SWT and superimposed non-stationary wavelet reconstruction to obtain high-contrast images [19]. Gupta et al. proposed a contrast enhancement technique based on dynamic histogram equalization that preserving brightness, and the enhanced image had a good appearance and a higher PSNR value [20]. In complex underwater environments, images exhibit issues such as distortion and blur. Raju et al. improved the contrast and visual quality of the image by using the average brightness value M of the image and the contrast enhancement parameter k [21]. Feng et al. used a histogram equalization algorithm to enhance underwater images [22]. Qiao et al. proposed an enhancement method based on an adaptive histogram and wavelet transform for image with limited contrast [23]. Qualitative and quantitative analysis shows that this method can effectively retain image details.
Singular value decomposition can be used for feature decomposition in dimensionality reduction algorithms. However, it is often used in combination with wavelet transform and other methods to enhance images. Demirel et al. performed SVD decomposition on the low-frequency sub-bands of remote sensing satellites obtained using DWT,to further enhance the illumination and prevent edge degradation [24]. Imran et al. used SVD for the extraction of watermarks, which enhance the robustness of the algorithm [25].
Gamma transformation is an image enhancement method with strong applicability. It is widely used in low-quality image enhancement by using changing parameters to control the overall brightness of the image. Yang et al. used the local characteristics of each region of the image to construct adaptive gamma parameters, which effectively improved the problems of low image contrast and brightness, moreover, their method had low computational complexity [26]. Kallel et al. used DWT-SVD to initially enhance the contrast of CT images and AGC to further improved it [27]. The image obtained using proposed method had good contrast and edge detail information. Mayathevar et al. proposed a method combining gamma correction to enhance the contrast of the dark areas of an image [28]. Experimental results in different scenarios show that the algorithm can effectively improve the contrast, quality and details of the image.
Based on the above research, the authors believe that their experimental methods provide more meaningful insights for improving the resolution and contrast of traditional ethnic patterns. The present study stands out by providing novel findings that distinguished it from recent studies in the filed.
To address the issues of low resolution and contrast in Mongolian furniture traditional pattern images, this paper proposes a novel enhancement method based on frequency domain singular value and gamma function. First, DWT and SWT are used to decompose the pattern, and then high-frequency sub-band interpolation is used to improve the resolution. Second, SVD us applied to calculate the correction coefficient, for processing the low-frequency sub-band image containing illuminance information. The illuminance of the image was modified directly to enhance the global contrast. Finally, a multi-scale Gaussian function is used to reconstruct the adaptive gamma function to further correct the illumination and enhance the detail area, to obtain the final enhanced pattern. The focus of this paper is on the enhancement of the Mongolian furniture pattern images. Based on the experimental findings, the SVD coefficient was optimized to further improve the contrast of the image. An adaptive gamma function was simultaneously used to enhance the detail area. A technical line diagram is shown in Fig. 2.

Technical line diagram.
In Mongolian furniture pattern images, the resolution is one of the essential features. Enhancement the image resolution directly contributes to the overall improvement image performance. Therefore, DWT and SWT were used to improve the resolution of Mongolian furniture pattern images.
First, DWT and SWT are applied to decompose the pattern along the rows and columns of the input image, respectively, to obtain the low-frequency and high-frequency sub-bands of the image, namely, low-low (LL), low-high (LH), and high-low (HL), and high-high (HH).Because the edges are concentrated on the high-frequency sub-bands (LH, HL, and HH), in order to obtain high-resolution images, the high-frequency sub-bands (LH, HL, and HH) need to be corrected to abtain high-resolution images.
Second, the input image is converted the SVD domain to acquire the singular value matrix which is the product of three matrices: an orthogonal matrix, the transpose of an orthogonal matrix, and a diagonal matrix. Next, the coefficients of the orthogonal matrix along with its transpose matrix are multiplied with the high-frequency components (LH and HL) of the input image obtained using SWT. This multiplication result is then added to the high-frequency components (LH, HL) obtained using DWT. Then, the bicubic interpolation with a factor of 2 is applied to the input image and estimated coefficients (LH and HL)in conjunction with HH of the DWT.
Finally, the unprocessed SWT low-frequency sub-band(LL1) and the interpolated high-frequency sub-band (new LH, New HL and New HH) are subjected to discrete wavelet inverse transformation, and the final high-resolution image is obtained after fusion and reconstruction. The sub-band diagrams after interpolation of the three patterns are shown in Figs. 3, 4 and 5.

Sub-band diagram after interpolation of the animal pattern.

Sub-band diagram after interpolation of the plant pattern.

Sub-band diagram after interpolation of the geometric pattern.
The proposed enhancement of the Mongolian furniture pattern contrast is carried out in two parts. The first part is SVD, which is used for global contrast enhancement. The second part is an improved adaptive gamma correction to further correct the illumination.
Singular value decomposition
DWT decomposition of the obtained high-resolution, low-contrast pattern A along the horizontal direction (row) need to be performed, before adjusting the contrast of Mongolian furniture patterns, to obtain four sub-band images which are LL A , LH A , HL A and HH A . Simultaneously, the histogram equalization (HE) is used to process the pattern A, to obtain the histogram equalized pattern A∧. The histogram equalized pattern A∧ is subjected to DWT decomposition along the vertical direction (column) to obtain four sub-band images of the pattern A∧, which are LL A ∧ , LH A ∧ , HL A ∧ and HH A ∧ .
The image I has been converted to the SVD domain to obtain a singular value matrix (SVM), and the matrix A is transformed into the product of three matrices U, Σ, and V
T
. Therefore, it can be defined as (Equation (1)):
All eigenvectors of the matrix A T A form an N×N m and VT is calculated from V. All eigenvectors of the matrix AA T form an M×M matrix U. The matrix Σ is an M×N diagonal matrix that contains the intensity information of the image. The mrix Σ is used to obtain a new low-frequency sub-band correction coefficient ξ to further enhance the image.
In the proposed method, SVD is only applied to the low-frequency sub-band (LL) after DWT, because only the low-frequency sub-band (LL) contains illumination information that affects the contrast. Thus, SVD directly changes the illuminance of the image without affecting other information in the image.
SVD is then performed on LL
A
and LL
A
∧
to obtain the matrix Σ of the low-frequency sub-band. Next, the correction coefficient ξ, which is the ratio of the largest elements of the two Σ matrices. The calculation formula is given by Equation (2):
Where, ∑ LL A ∧ represents the SVM of the low frequency sub-band LL A ∧ after HE, and ∑ LL A represents the SVM of the low frequency sub-band LL A after the DWT.
The SVM ∑
LL
A
and ∑
LL
A
∧
are enhanced using the correction coefficient ξ obtained from Equation (2), and an enhanced low-frequency sub-band
Here,
Finally, the inverse DWT is performed on the enhanced low-frequency sub-band (
In the proposed method, a multi-scale Gaussian function was used to extract images with uneven brightness components, and the adaptive gamma function [29, 30] was adjusted based on a correction function. Its purpose is to effectively correct the uneven illumination in image, while retaining the effective information of the original image. This enhances the visual effect of the image.
According to the Retinex theory [31–33], the following assumptions c be made: the brightness component of the image in the real scene is mainly in the low-frequency part of the image, and contains the overall illumination information. Therefore, in order to better correct the illumination, only the brightness needs to be extracted. The pattern is converted to the HSV color space, and the brightness component (V-channel image) is extracted. The following processing operations are all performed on the luminance component.
A multi-scale Gaussian function method was used to extract the uneven illumination component image. A Gaussian function G(x,y) given by Equation (6), was used:
where, c is the scale factor, which changes the visibility of the generated image. λ is the normalization constant. The estimated value of the illumination was then calculated. The Gaussian function was convolved with the original image, and the calculation formula is given by Equation (7):
where, F(x,y) is a pixel in the original image, and I(x,y) is the predicted light component illumination component.
According to the Retinex theory, the value of the scale factor c of the Gaussian function determines the scope of the convolution kernel. As the value of c increases, the scope of the convolution kernel of the Gaussian function increases, tone preservation ability becomes stronger, and global characteristics of the extracted light value is enhanced. On the contrary, as the smaller the value of c increases, the range of the convolution kernel of Gaussian function become smaller, effect of dynamic range compression becomes better, and local characteristics of the extracted light value becomes move obvious. To consider the global and local characteristics of the extracted light value, a multi-scale Gaussian function method is adopted, and Gaussian functions of different scales are used to extract the light component of the scene. The light component of the scene is then weighted to finally obtain the illumination estimation value of the brightness component. The formula used for the calculation is given by Equation (8):
where, I(x,y) is the light estimation value of the brightness component extracted and weighted by the Gaussian function of different scales at the point (x,y); ω i is the weight coefficient of the illumination component extracted by the i-th scale Gaussian function; and i is the i-th scale Gaussian function (i = 1, 2, 3,...). In the proposed method, N is the number of ruler readings used, To strike a balance between the accuracy of light component extraction and number of algorithm operations, we choose N = 3, indicating that is three scales of Gaussian functions are used to extract the value of the light component (the value of the selected scale factor c is 15, 80, and 250) and assign equal weights of 1/3 to the light component extracted by the three-scale. The experimental results indicate that the light component extracted by the three-scale Gaussian function effectively captures the information the variations in light intensity, without focusing on the intricate details. The outcome is consistent with the feature requirements for light component extraction. The result of the illumination component extracted using the three-scales of the Gaussian functions is shown in Fig. 6.
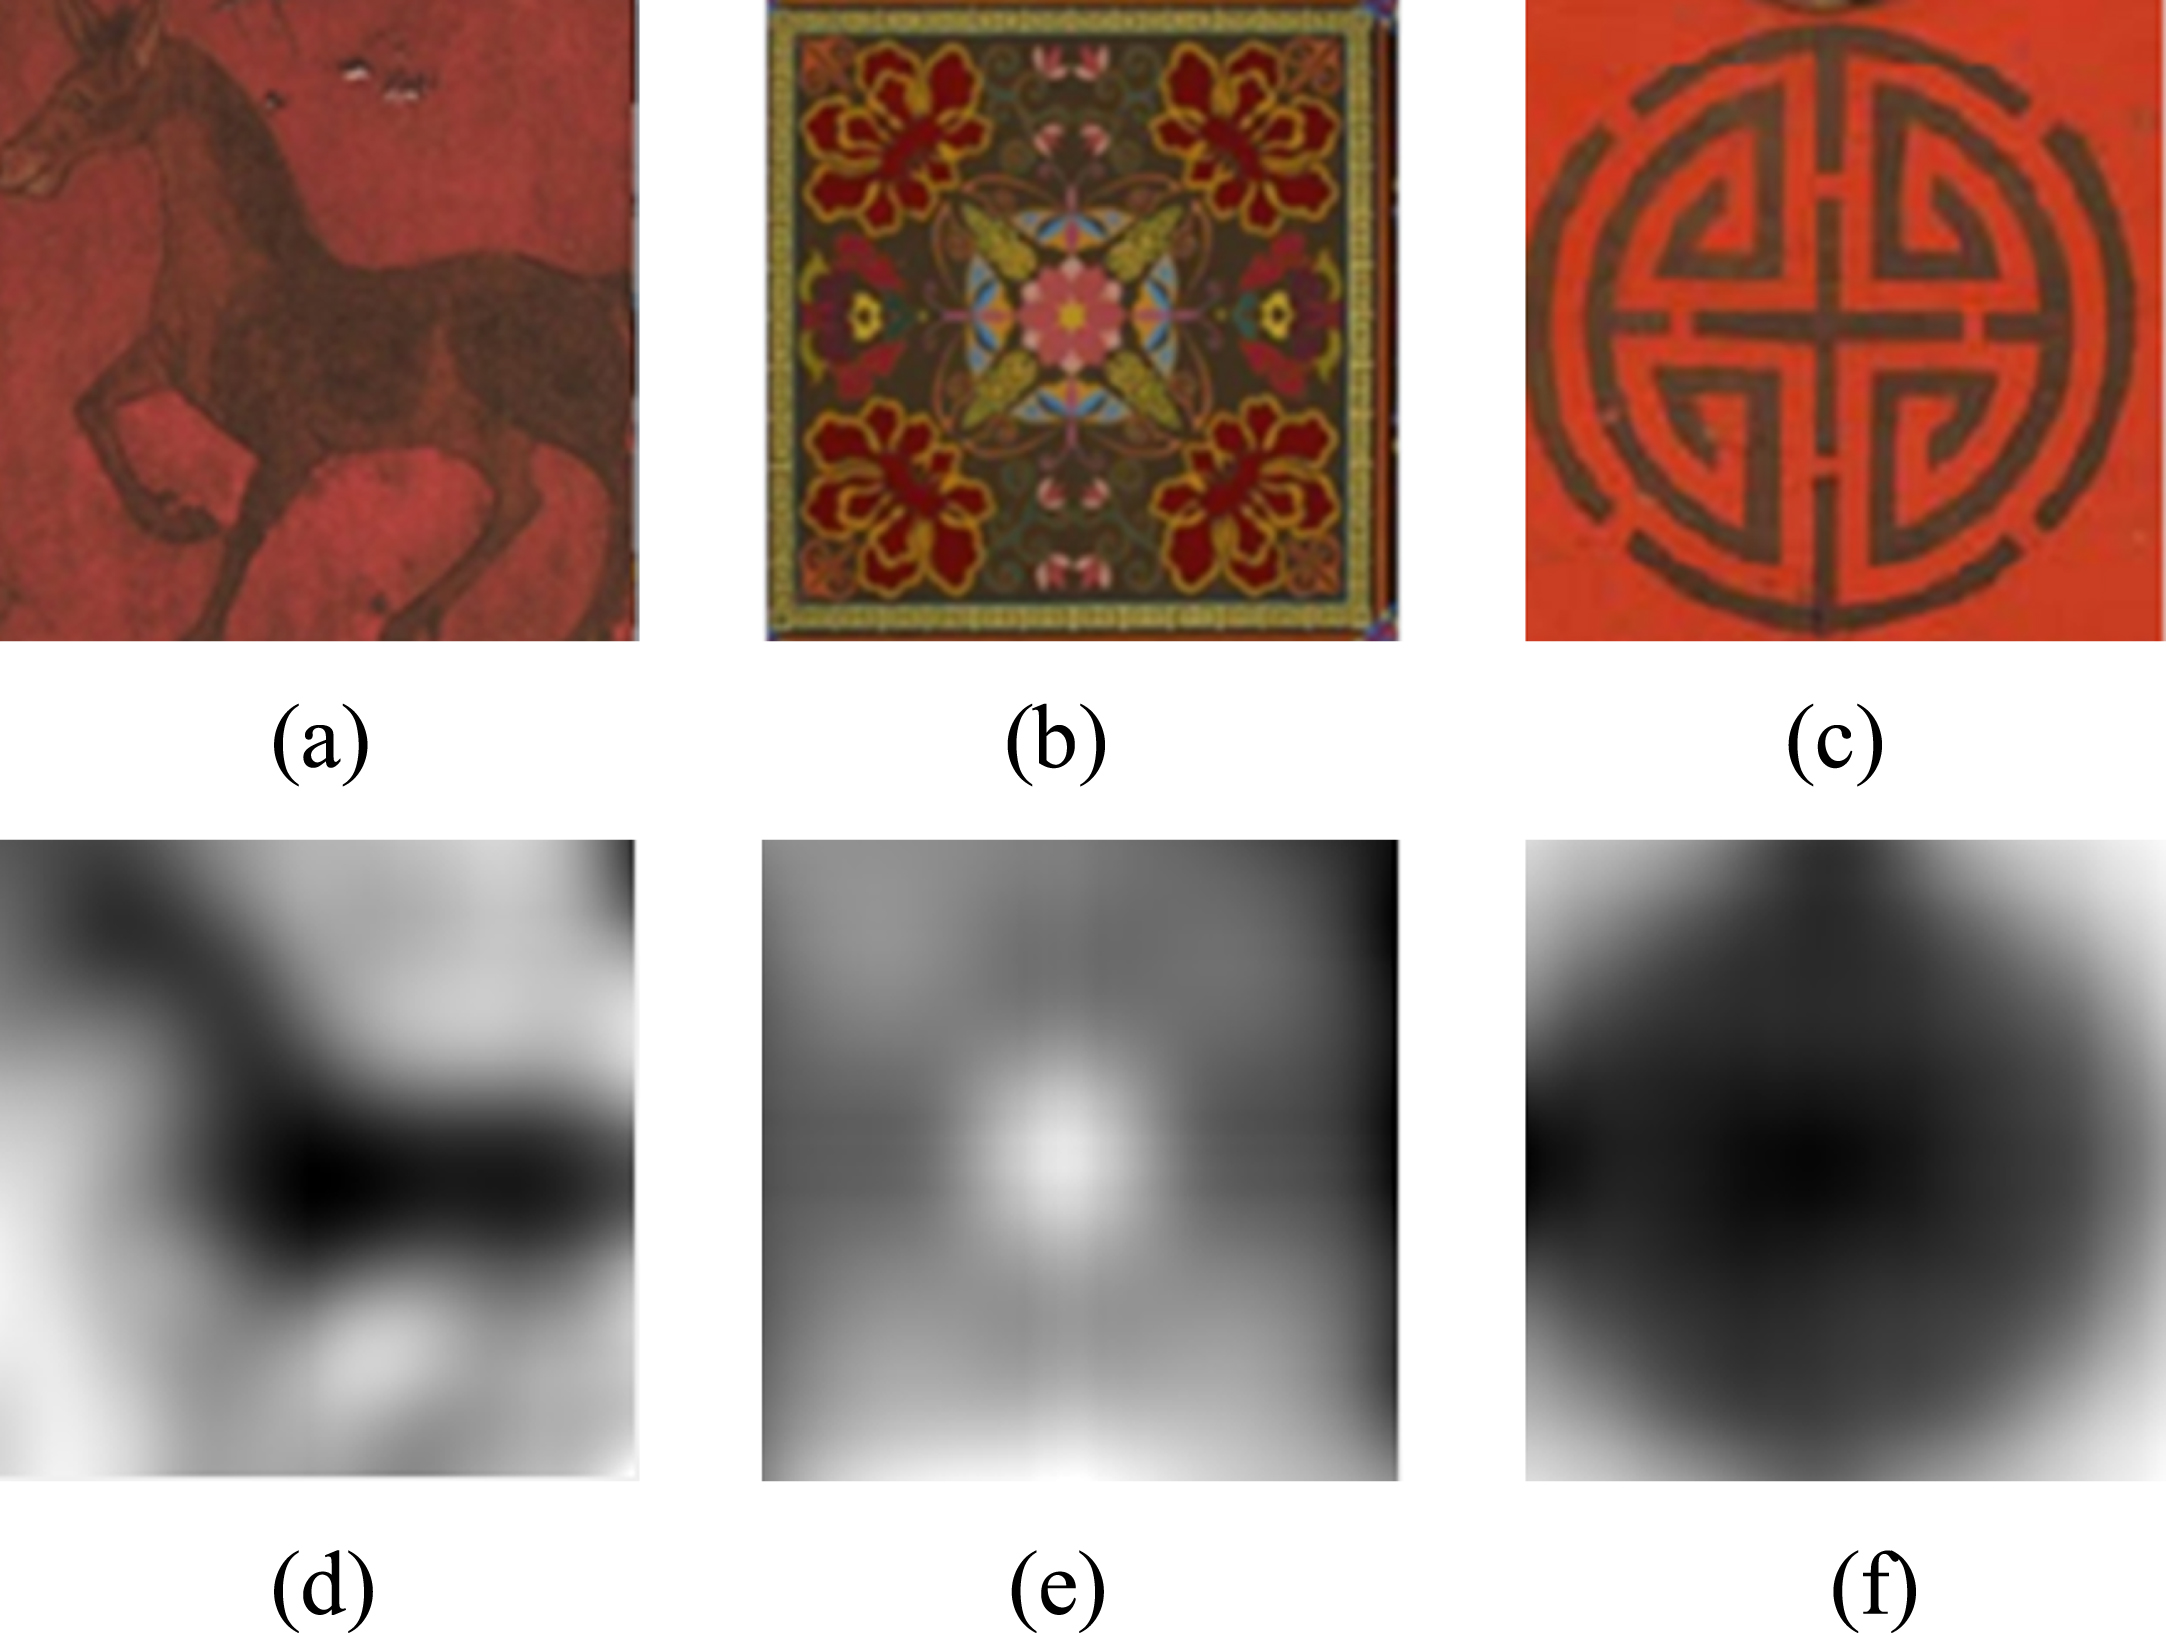
Light components extracted from the image. (a)– (c) Original picture of three patterns of Mongolian furniture; (d)– (f) Illumination component extraction image of the three patterns.
Based on the distribution characteristics of the illumination, a new adaptive gamma function is constructed using the above-mentioned illumination estimation values of the brightness components extracted and weighted by the Gaussian functions of different scales, to correct the uneven illumination of the image. This, reduces the brightness value of the over-lit area and increases that of the under-lit area. The calculation formula is given by Equation (9):
Here, O(x,y) is the output image after γ-corrected illumination; γ is the index value of brightness enhancement, which contains the characteristics of the brightness component of the image; and m is trhe mean value of the luminance of the light component. The light correction function of the new adaptive gamma function is used to enhance the animal, plant and geometric patterns of the Mongolian furniture. The results are shown in Fig. 7.
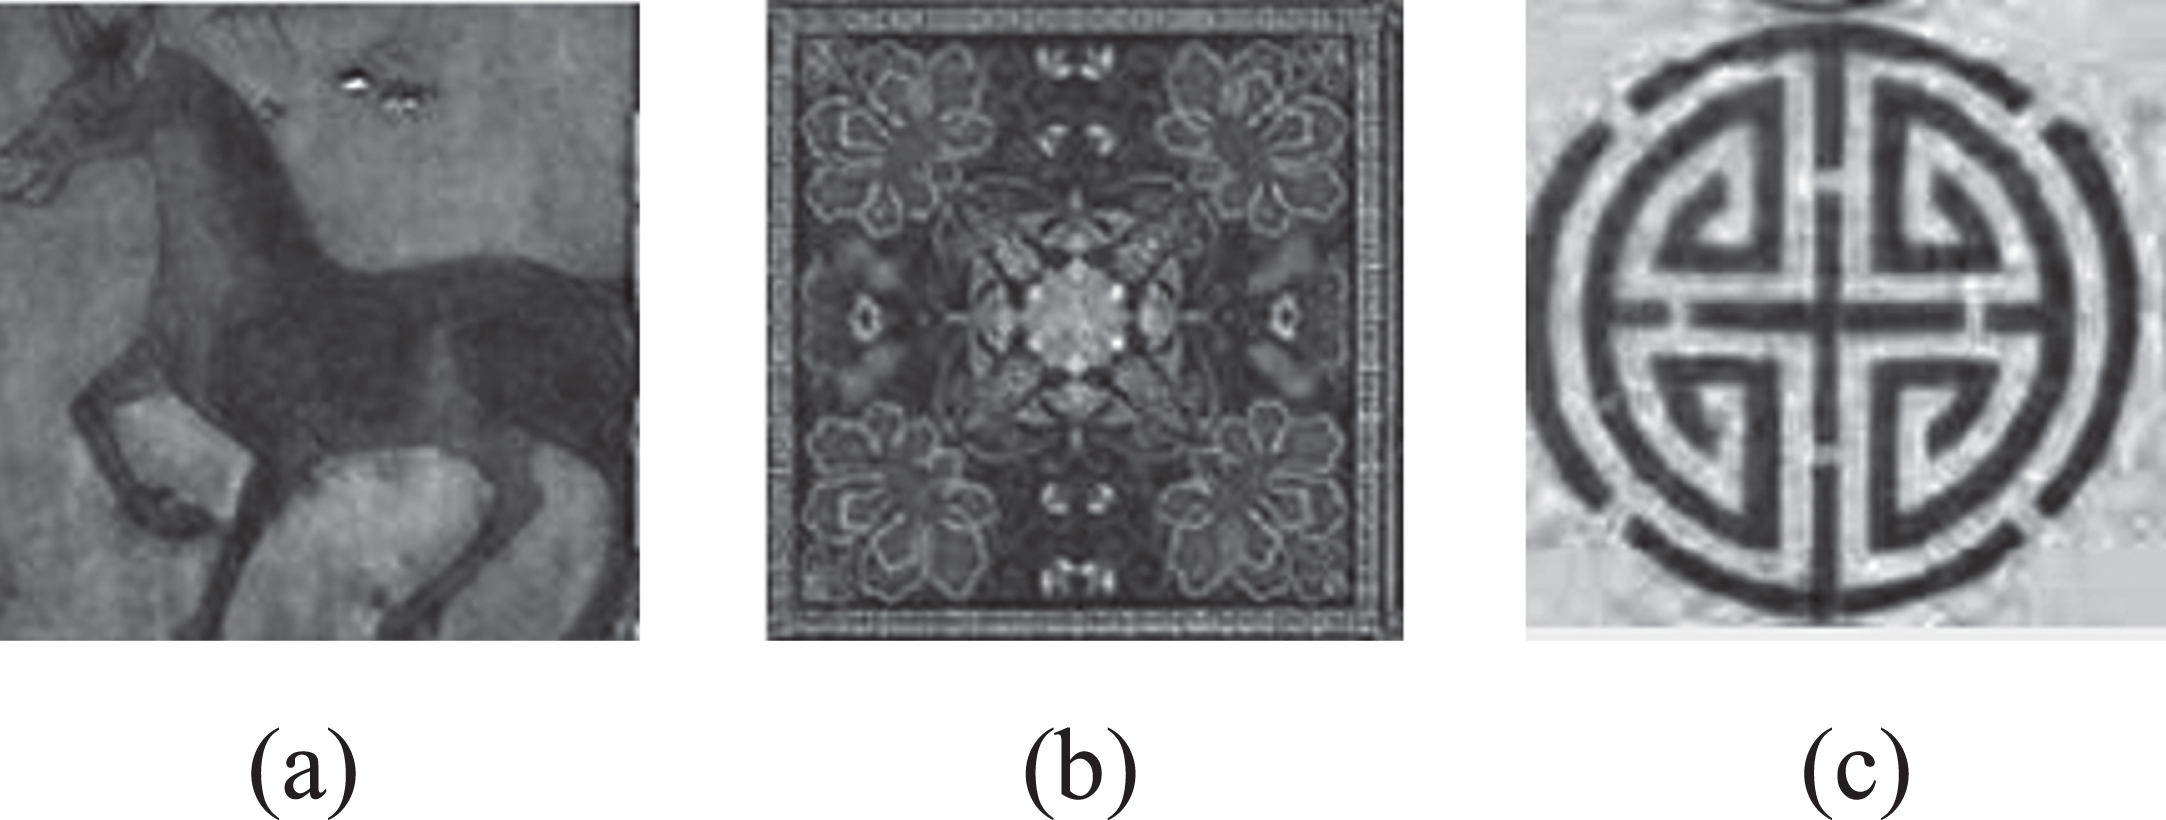
Constructed adaptive gamma functi enhanced resultant image. (a) animal pattern; (b) plant pattern; (c) geometric pattern.
Finally, the image obtained by the above processing is converted from the HSV color space back to the RGB color space to obtain the final enhanced traditional patterns. The original traditional patterns and the final enhanced animal pattern, plant pattern and geometric pattern and the corresponding histogram distribution are shown in Fig. 8.
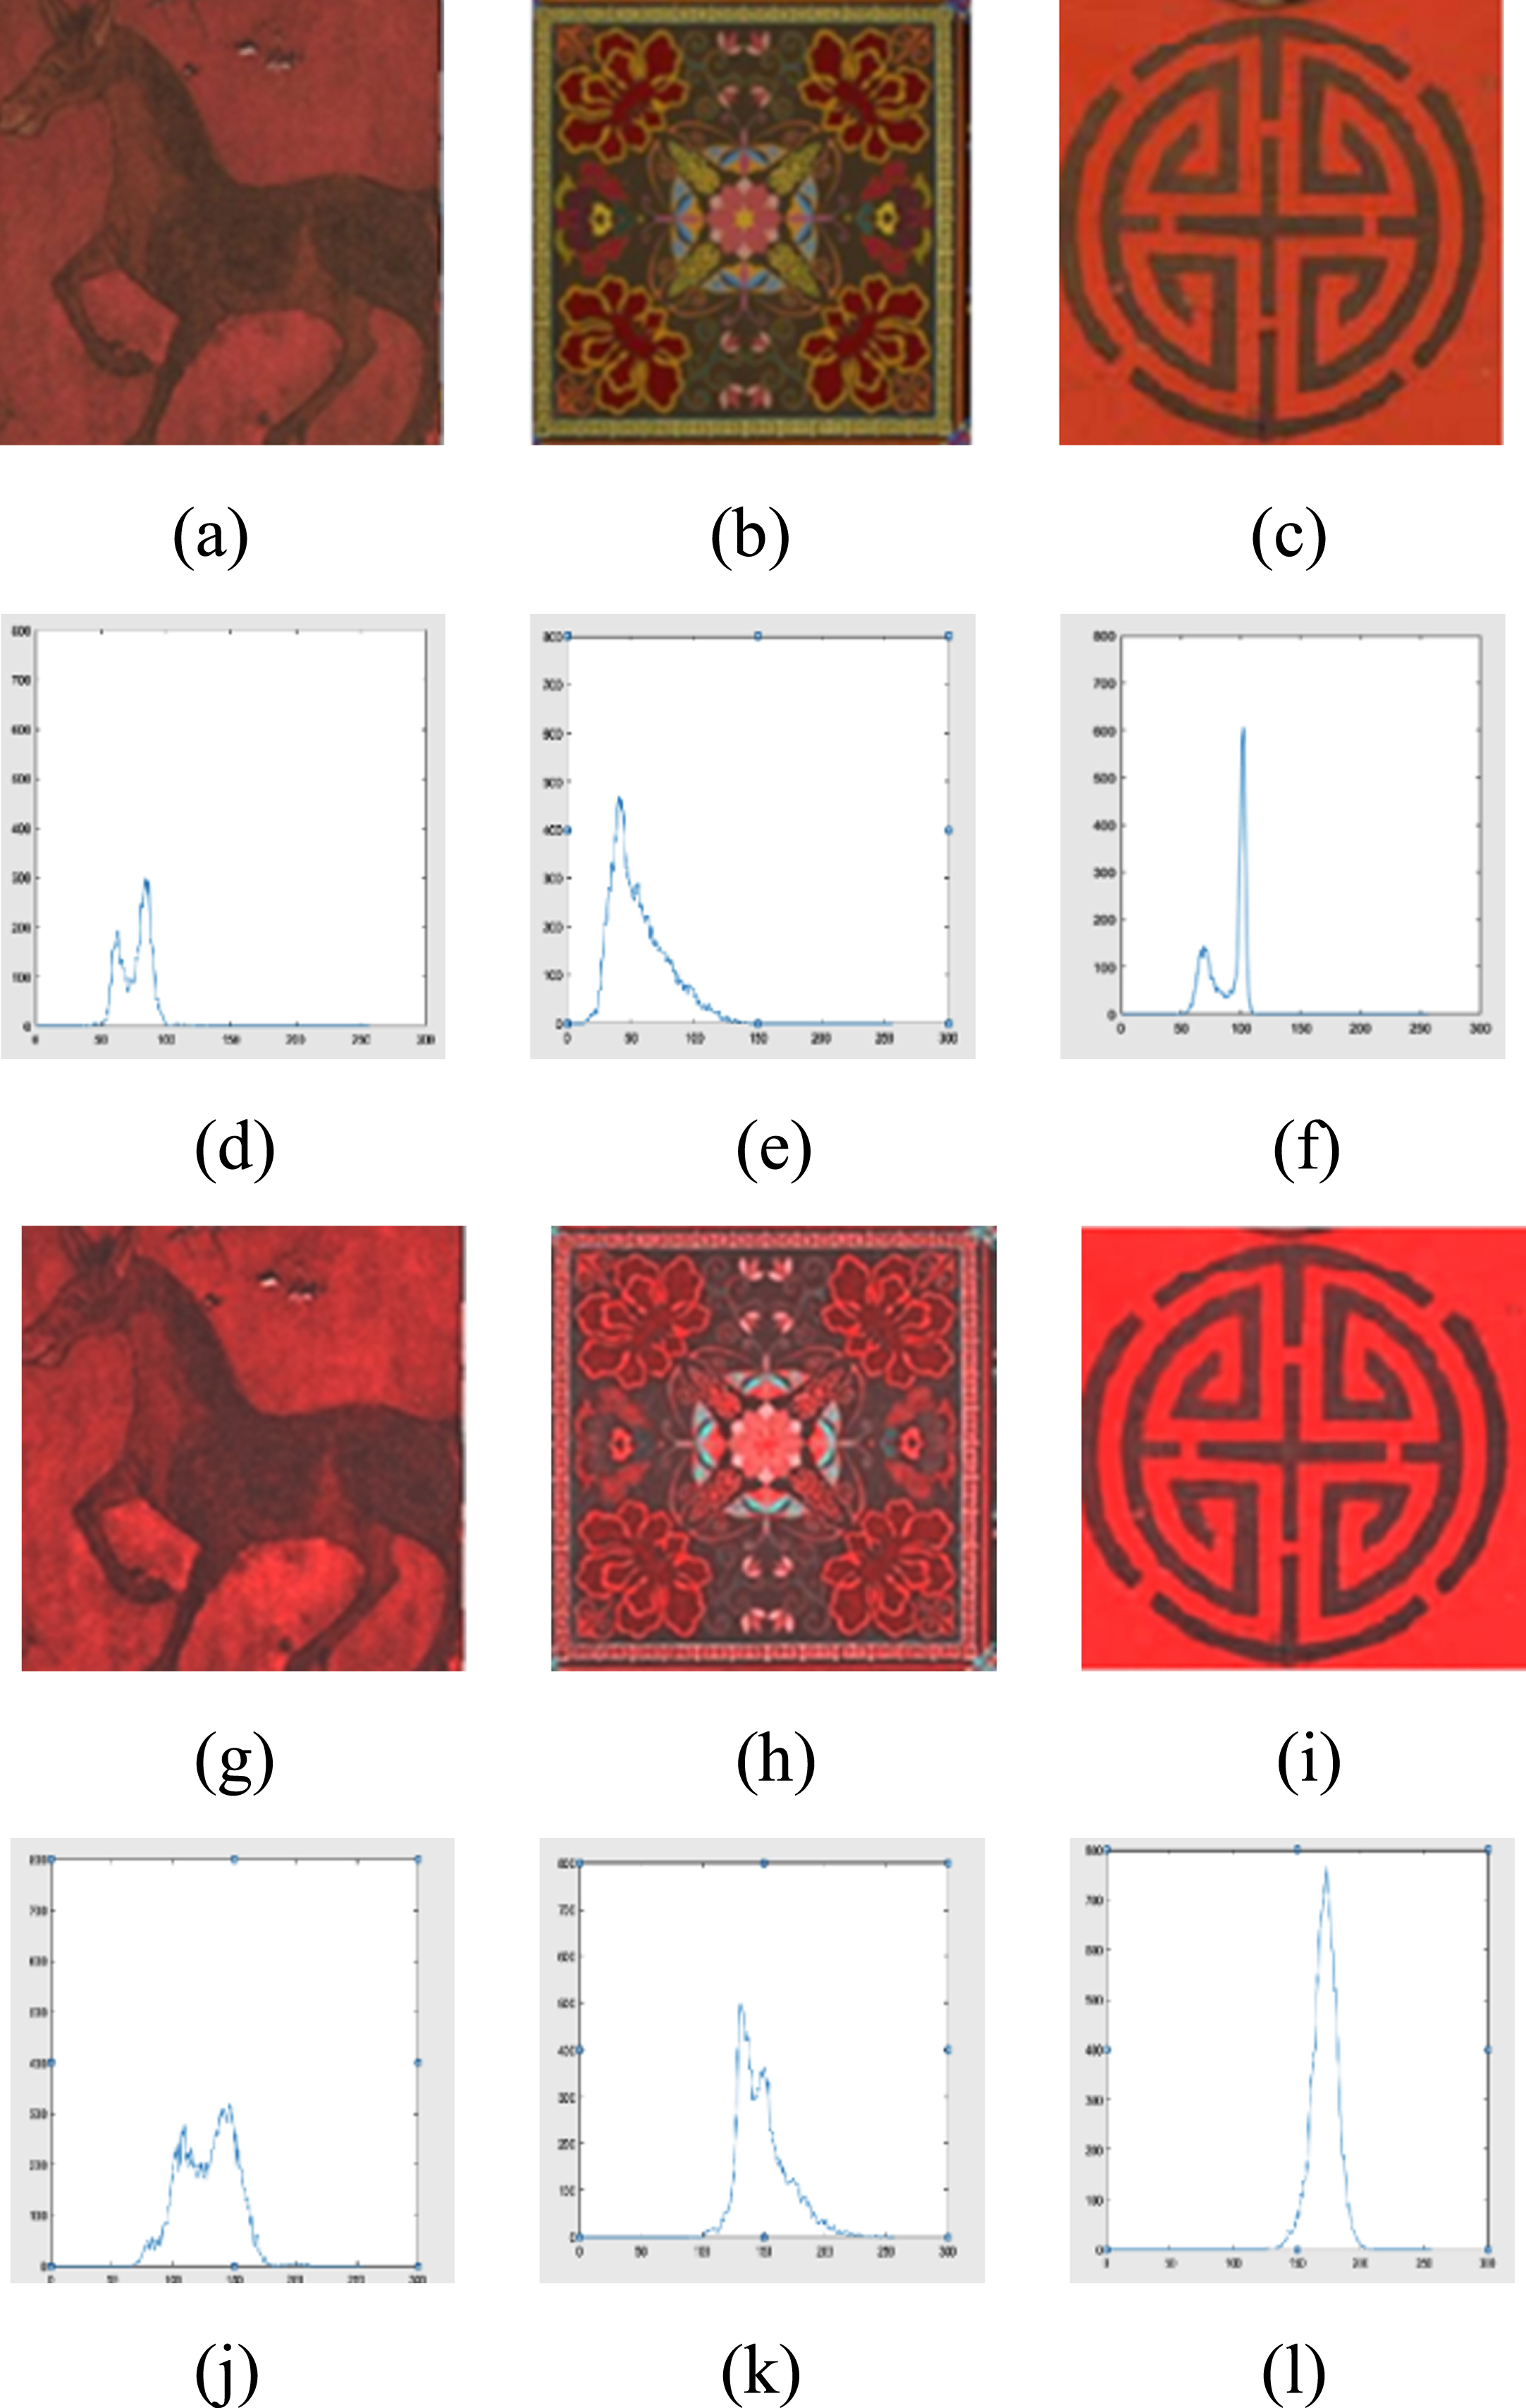
(a)– (c) Original patterns of three Mongolian furniture. (d)– (f) histograms of original patterns of three Mongolian furniture; (g)– (i) Three patterns enhanced by the proposed method; (j)– (l) Histograms of three enhanced pattern.
In this section, we discuss the experimental settings, performance evaluation indicators, and experimental results of a traditional patterns, enhancement method with singular values and gamma functions in the frequency domain.
Experiment set up
The original traditional animals, plants and geometric patterns were of 128 × 128 pixels. Moreover, all experiments were conducted adequately in MATLAB 2016b with the following PC specifications: 2.3-GHz CPU, 8 GB of RAM, and Windows 10.
Performance evaluation metrics
This sub-section presents the image quality assessment metrics. In this study, three objective evaluation indicators are mainly used to evaluate the enhanced patterns: mean square error (MSE) [34, 35], peak signal-to-noise ratio (PSNR) [36, 38] and structural similarity (SSIM) [39, 40].
MSE is the mean square error between the original pattern and the enhanced pattern. The definition of MSE is given by Equation (10):
where Z (i, j) and Y (i, j) represent the pixel values of the original and enhanced patterns, i and j denote the rows and columns, respectively.
The PSNR evaluates the pixel distribution and its suitability in the processing images. The higher the PSNR value, the smaller the distortion between the enhanced image, and the original image, and the better the quality of the reconstructed image. The definition of PSNR is given by Equation (11):
where L is the 8-bit representation and MSE is the mean square error.
SSIM uses the structural information in the image to reflect the similarity between the original image and the enhanced images. A large the SSIM value is larger, it indicates that the enhanced image has better quality. The definition of the SSIM is given by Equation (12):
where x and y are the original image, and the enhanced images, respectively. δ x is the mean of x, δ y is the mean of y, γ x is the variance of x, γ y is the variance of y, 5 γ xy is the coefficient of similarity between x and y, and C1 and C2 are parameters.
The proposed method for enhancing the singular value and gamma function in the frequency domain was tested on 150 low-resolution, low-contrast traditional pattern sample data sets in the simulation environment of MATLAB 2016b. The tested images, included animal, plant, and geometric patterns, each with 50 patterns.
The average value of MSE produced by the proposed method was 26.43. Compared with the results in the existing literature, the average MSE in the proposed method has a higher error rate, indicating that the enhancement effect of the proposed method is significantly improved compared to the original image. The average PSNR produced by the proposed method is 22.08. The average PSNR is higher than that of the other three comparison methods. Therefore, this shows that the proposed method is effective in maintaining the maximum brightness, and the quality of the enhanced pattern is also improved. The average value of SSIM produced by the proposed method is 0.9. The SSIM average value is higher than that of the existing method and closer to 1.0. Therefore, the patterns enhanced by the proposed method have a better quality, and issues such as structural deformation have been reduced significantly.
Comparative analysis
This section introduces a qualitative and quantitative comparison and analysis of the proposed technique in enhancing the singular value and gamma function (SVD-GAMMA) in the frequency domain and the other three resolution and contrast enhancement techniques. The other three comparison methods are: the HE method of Feng et al., image enhancement method based on DWT-SVD and inflection point gamma of Ma Kun, and the image enhancement method based on weighted average and singular value (WD-SVD) of Aamir et al.
Qualitative analysis
Qualitative analysis was used to evaluate the visual quality of the images. This is very useful for checking the existence of an over-enhancement issue in the enhanced image, and improvement in the resolution. Furthermore, it checks if the pattern appearance and edges are clear, and if the color and saturation are natural.
Figure 9 shows a visual quality comparison of the processed images. Rows (a), (b) and (c) are animal, plant and geometric patterns respectively. The column (d) is the original image. Column (e) shows the pattern obtained after enhancement using the HE method. From the figure, it can be found that the brightness of the enhanced pattern is more obvious. However, these patterns have several issues such as intensity saturation and excessive enhancement. The overall appearance and edges of the patterns are unnatural, and they also generate more noise. Column (f) shows the pattern after enhancement using DWT-SVD and the inflection point gamma method. The three patterns obtained after enhancement have insufficient contrast and saturation, which causes the pattern to lose the richness of content. Column (g) shows the pattern after enhancement using the WD-SVD method. From the figure, it can be found that the patterns with simpler line features such as animals and geometry have a better enhancement effect, and the contrast and saturation have produced better visual effects. However, for patterns with complex line characteristics such as plants, there is a problem of insufficient contrast enhancement. Column (h) is the pattern obtained after the enhancement using the proposed method. The enhancement of singular values and gamma function in the frequency domain effectively addressed the above issues. The proposed method is superior to other technologies in retaining maximum information, brightness, and natural appearance with good pattern content visibility.
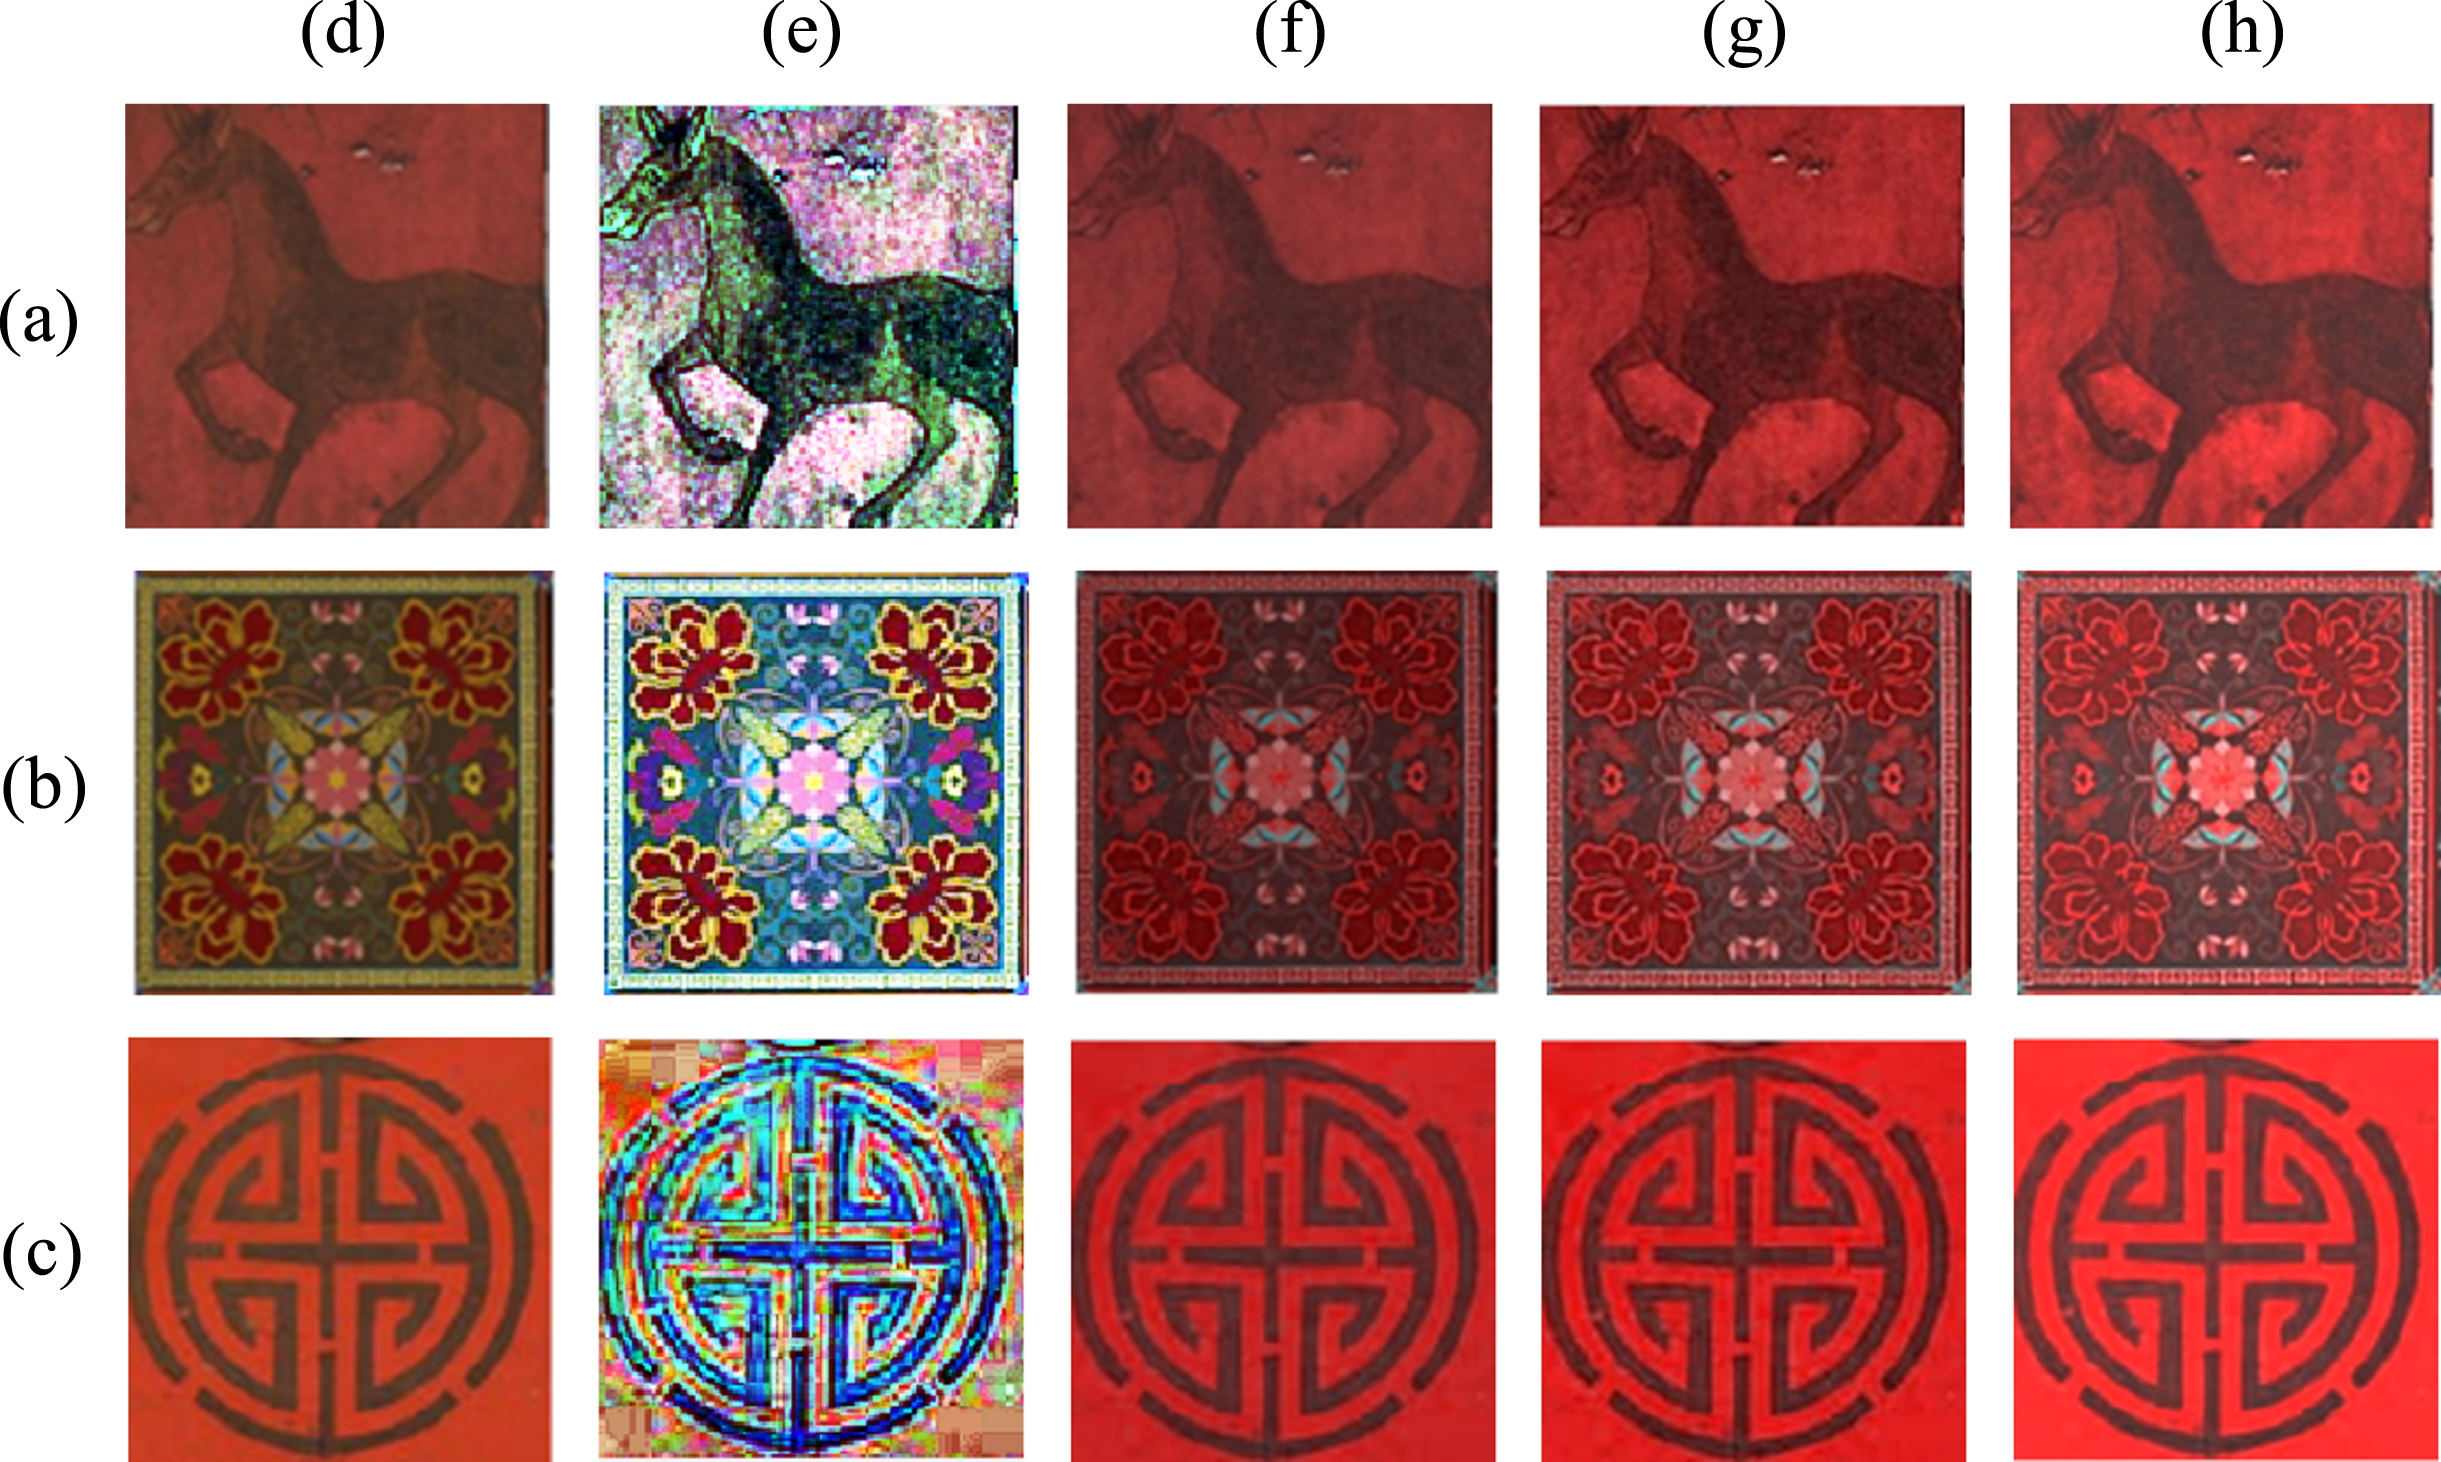
Rows (a), (b) and (c) are animal, plant and geometric motifs, respectively. Columns (d) original image; (e) enhanced image based on histogram equalization method; (f) image enhancement based on DWT-SVD and inflection point gamma methods; (g) enhanced image based on WD-SVD method; (h) image enhancement using the proposed method.
In the quantitative analysis, the pattern images obtained by the proposed method and the prior art are quantitatively evaluated through the objective evaluation indicators such as MSE, PSNR and SSIM. Figures 10– 13 show a comparison of SVD-GAMMA with other existing enhancement techniques in the frequency domain of the proposed method.
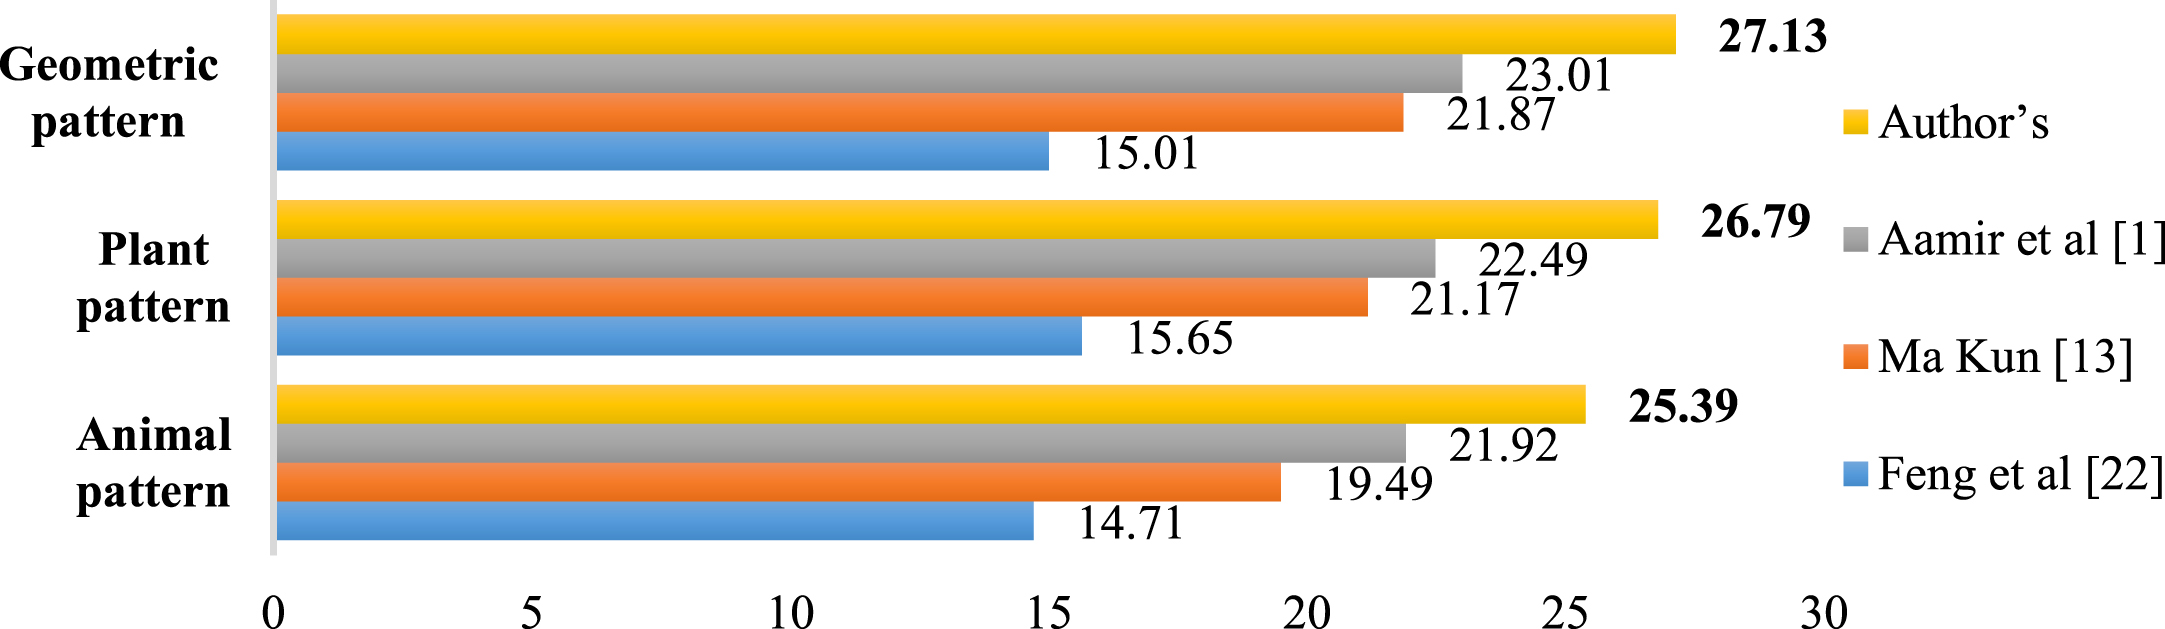
MSE value of traditional pattern reconstructed by four methods.
Figure 10 shows a comparison of the MSE quality metric of the proposed method with those of the other three methods. The MSE value associated with the proposed method surpassed those of the existing methods. The MSE values of animals, plants, and geometric patterns are 25.39dB, 26.79dB, and 27.13dB, respectively, indicating that the proposed method has obvious enhancement. The enhancement effect of the proposed method has obvious enhancement. The enhancement effect of the proposed method is better than those of the other methods.
Figure 11 shows a comparison between the PSNR values of the proposed method and those of the other three methods. The average PSNR value of the proposed method is 22.08 dB, which produces a higher PSNR than the other three comparison methods. Therefore, the proposed method does not amplify the noise level during the contrast enhancement process to maintain the natural appearance of the image. The proposed method significantly improves the quality of the degraded image and achieves an acceptable pattern ratio, making this technique a better method.
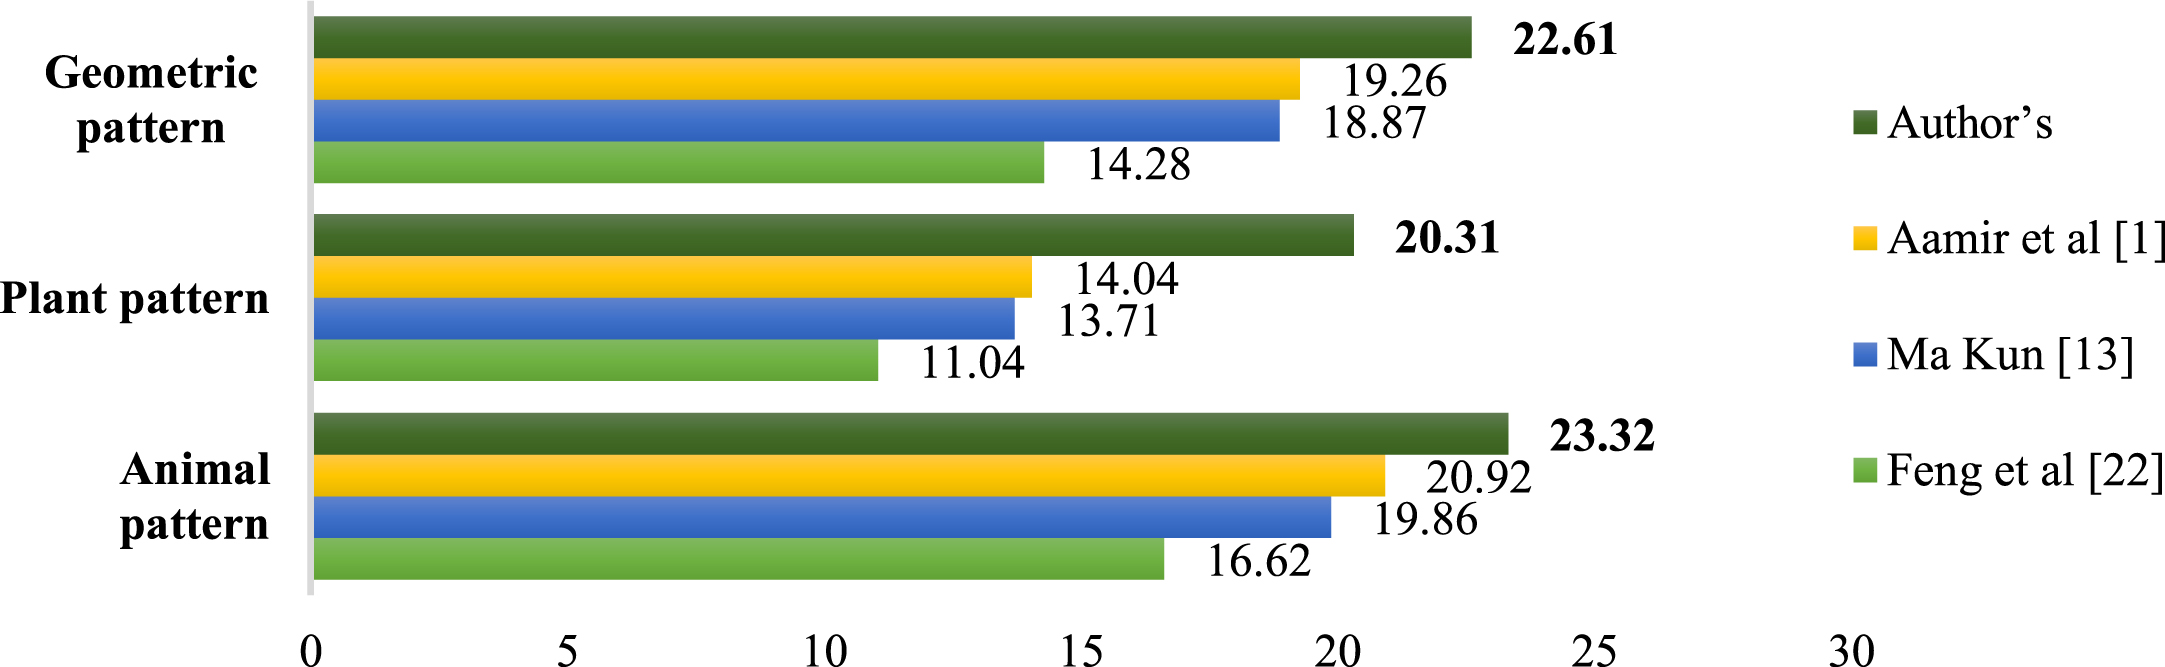
PSNR value of traditional pattern reconstructed by four methods.
Figure 12 shows the performance index that quantifies the structure similarity of the enhanced with their original counterparts, while comparing the proposed method with the other three methods. A higher SSIM value, closer to 1, indicates a minimal alteration in the structural information of the pattern and signifies a better enhancement effect. The SSIM value generated by the proposed method for the three patterns is closer to 1 and higher than those of the other three comparison methods. Therefore, the proposed method obtains a better enhanced pattern than the other three comparison methods.
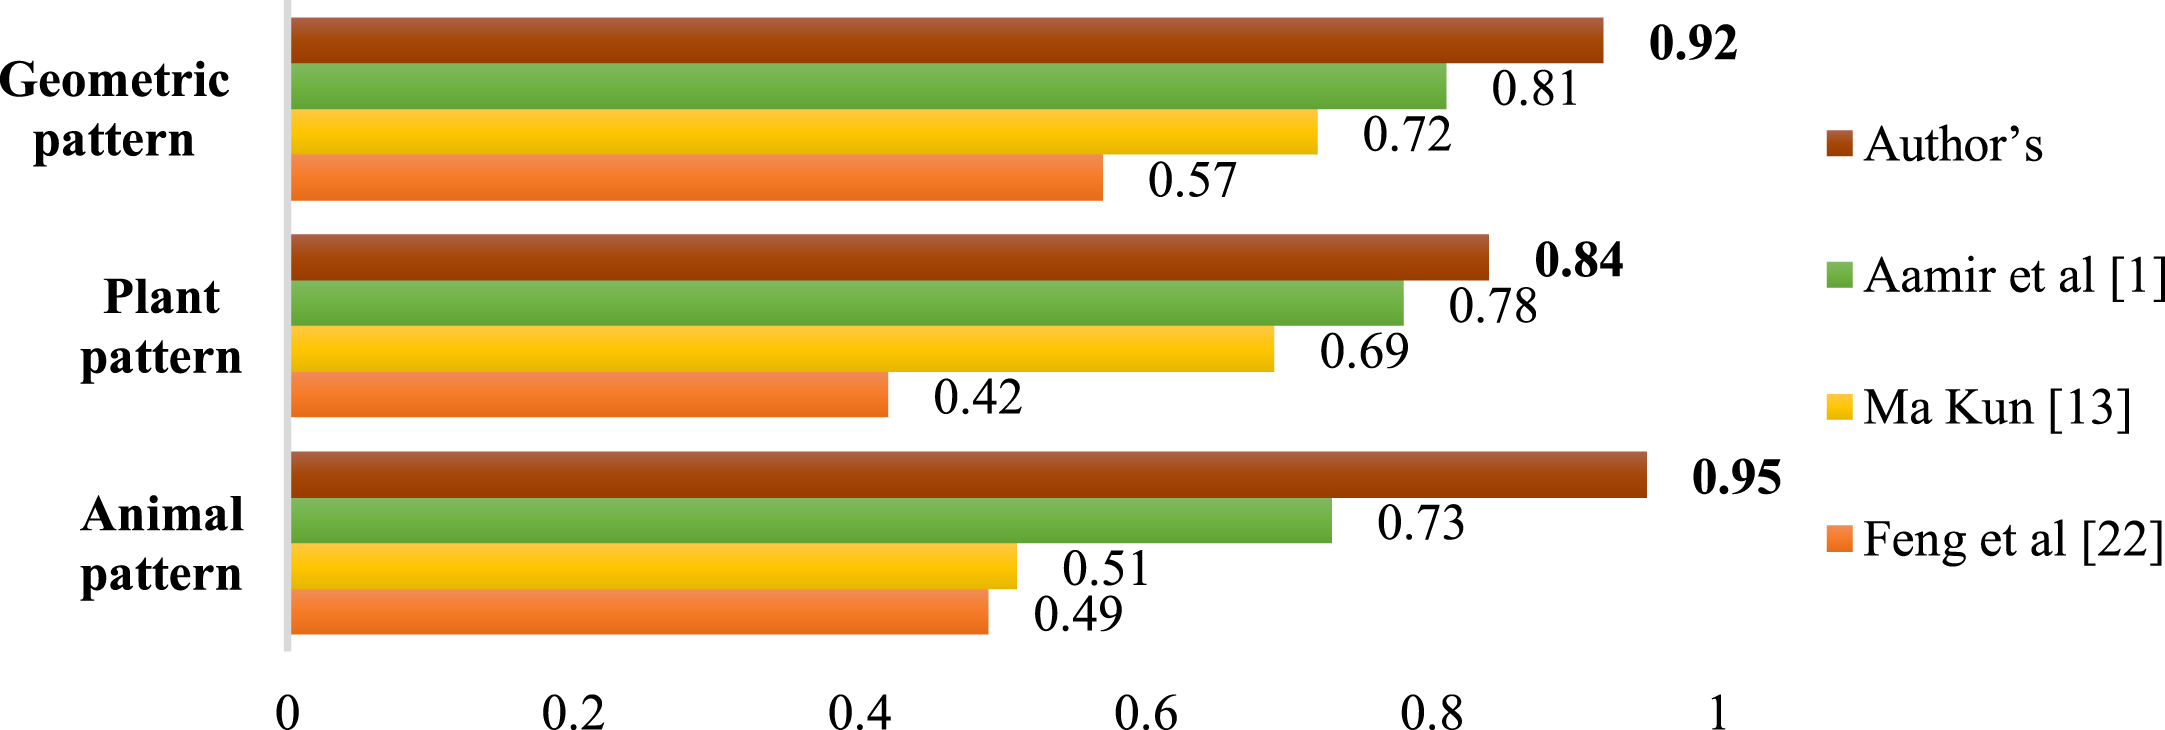
SSIM value of traditional pattern reconstructed by four methods.
Figure 13 shows the average results of the MSE, PSNR and SSIM values of animals, plants, and geometric patterns obtained in a simulated environment. According to Fig. 13, the proposed method shows outstanding SVD-GAMMA in the frequency domain compared with the other image enhancement methods. The proposed method preserves the whole and edge content information of the pattern to the highest extent and ensures the richness of the content. In addition, the proposed method successfully preserves the natural appearance, while mitigating issues such as color distortion in the background caused by using the HE method. These performances prove that the proposed method adeptly balances resolution enhancement, contrast enhancement, and brightness adjustment, resulting in an improved visual effect.
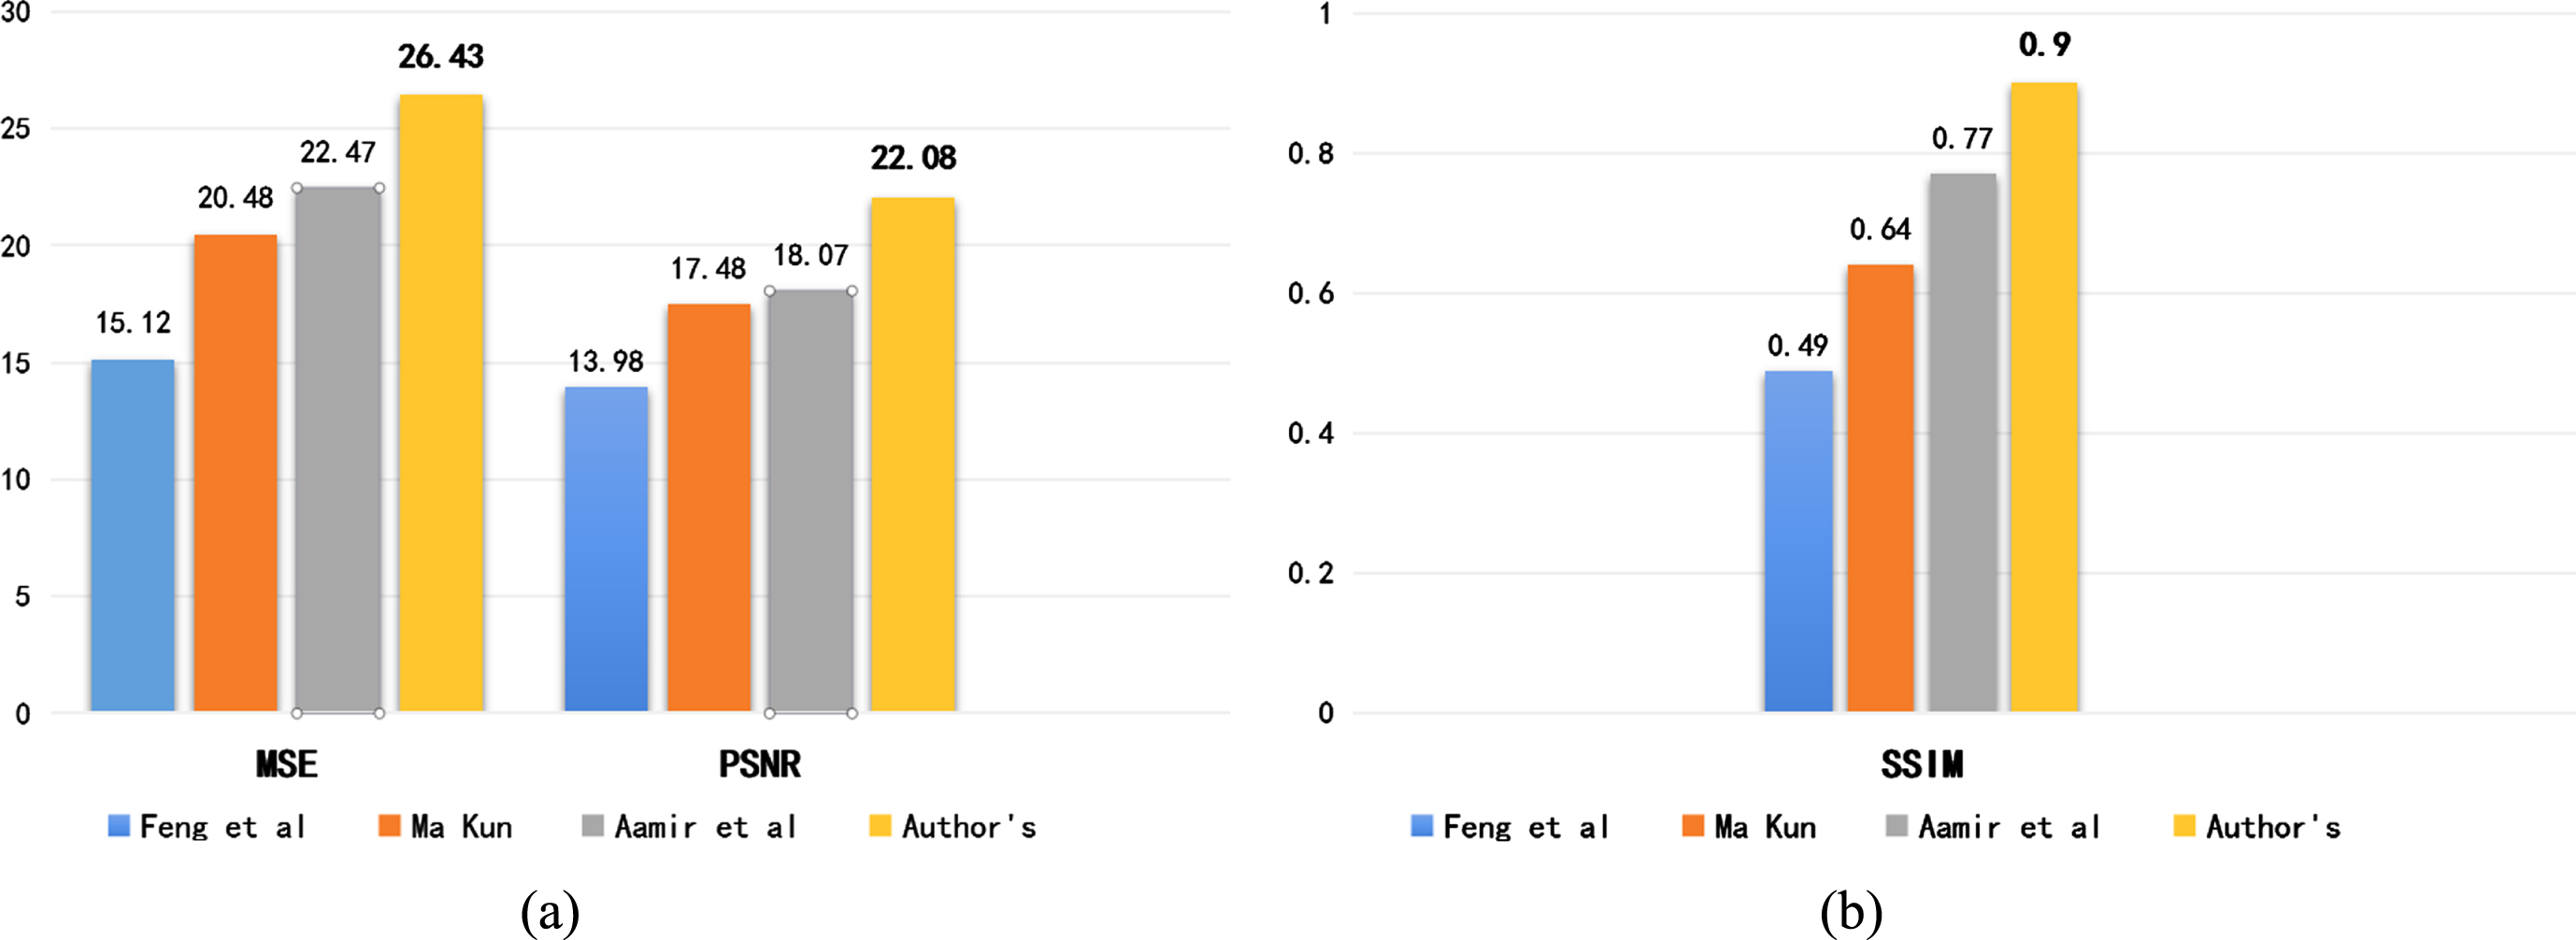
Average results of MSE, PSNR and SSIM for traditional test pattern.
This study proposes an enhancement technique to improve the resolution and contrast of traditional patterns. To increase the resolution, use DWT and SWT were applied along the rows and columns of the input pattern, respectively. Then interpolate the high frequency subbands decomposed by SWT were interpolated into the high-frequency sub-bands decomposed by DWT. Finally, the unprocessed SWT low-frequency sub-band (LL1) and the interpolated high-frequency sub-band (new LH, new HL, new HH) were combined to obtain the final high-resolution pattern image. In contrast enhancement, the SVM generated by SVD was used to obtain correction coefficients to enhance the low-frequency sub-band (LLA), and the image was then reconstructed. Additionally, an adaptive gamma function was utilized to correct uneven illumination areas based on the estimated light values. This correction method effectively reduced the brightness value in over-illuminated area, while increasing the brightness in underexposed regions. The experimental results show that the proposed method achieved a good improvement in MSE, PSNR, and SSIM. Compared with other methods, the proposed method effectively enhances the traditional pattern image, and its application is effective and meaningful. This method contributes to the research and practical application of traditional national patterns and provides a reference for the digital storage, classification, and preservation of the traditional patterns.
In the future, more in-depth research is needed on the segmentation and recognition of pattern images, restoration and extraction of complete information, and expansion and establishment of traditional pattern databases, in the enhancement of traditional national patterns and other images.
Footnotes
Acknowledgments
The author thanks the editor and anonymous reviewers for their helpful comments and valuable suggestions.
Ethics approval and consent to participate
Not applicable.
Consent for publication
Not applicable.
Availability of data and materials
Please contact author for data requests.
Competing interests
The authors declare that they have no competing interests.
Funding
The Application of Modern Mathematical Techniques in the Conservation and Heritage Utilization of Non-Heritage Mongolian Furniture Patterns (2022YFDZ0031).
Author contributions
DYD, HCG conceived the idea of the study; DYD, GF analyzed the data and interpreted the results; DYD, YYM, QYP wrote the paper; All authors discussed the results and revised the manuscript. All authors read and approved the fnal manuscript.