
Abstract
To solve the problem of inaccurate user phase identification, the paper proposes a new algorithm based on improved cloud model and adaptive segmented voltage algorithm. Firstly, the new algorithm uses improved cloud model to calculate the digital features of station area and users’ voltage sequences quickly. Secondly, the paper uses the adaptive segmentation voltage algorithm to divide the full voltage sequences into three parts automatically to add local features into phase identification. Finally, the paper calculates cosine similarity between each segmented voltage cloud model to identify users’ voltage phase. The analysis based on station data and field verification shows that the new algorithm has not only improved the calculation efficiency by 41% compared with traditional user phase identification algorithm, but also increased the difference in identification results between different phases by 1000 times. In the final result, the accuracy of the new algorithm is 95%. The new algorithm has more obvious differentiation and higher accuracy. The analysis results based on the actual engineering data also prove the feasibility and effectiveness of the new user phase identification algorithm.
Introduction
In power grid enterprise management, each low-voltage station area which is powered by distribution is the smallest management unit. The efficiency of transformers affects the benefits of the power grid enterprise directly. As we all know, the unbalance of three-phase load will cause high line loss and reduce the efficiency of distribution transformers. Because there are lots of single-phase load in our daily life, the unbalance rate of three-phase load is low. In the daily work of the power grid enterprise, the basic information of voltage, current and electricity consumption of different stations and users can be collected by the power collection system, but the information that which phase users belong to is missing. And the missing information affects the calculation of three-phase unbalance rate. To save energy, a fast and effective method to identify the phase of users is urgently needed.
At present, the commonly used methods of users’ phase identification can be divided into two types [1]: on-site identification, which often requires a large number of staff to identify users’ phase one by one. The method is highly accurate but consumes a lot of labor and easily affects the daily life of users, so it is infeasible. The other type is algorithm, which is based on users’ real power and voltage data.
The algorithms which are commonly used in phase identification mainly include machine learning, Pearson correlation coefficient and cluster analysis. In [2, 3], a machine learning method based on data mining, which leverages power consumption data collected through the advanced metering infrastructure (AMI) has been proposed for an accurate and efficient phase identification. In [4], an integrated method, which uses spectral clustering for solving the problem of users’ phase identification has been formulated. In [5], the paper uses k-means clustering algorithm to identify the users’ phase. In [6], a new method combines fourier series compression and clustering algorithm together to identify the phase of users. In [7], the paper proposes a consumer phase identification algorithm based on the correlation characteristics to improve the accuracy of consumer phase identification with incomplete data. In [8], the paper improves the phase identification accuracy by averaging across loads connected to the same transformer. In [9], the paper proposes a method to extract the data features through the wavelet analysis.
In research of users’ phase identification, we have found that the fluctuation of the load carried by the station area three-phase power supply is random and there is a certain potential relationship between the three-phase voltage and users’ voltage. Though the potential relationship is fuzzy, but it is real. In the prior studies, the fuzziness between users’ voltage and stations’ three-phase voltage is less concerned, but the fuzziness also plays important role in user phase identification. To solve the problem, a new algorithm based on improved cloud model [10, 11] and adaptive segmentation voltage has been proposed to identify users’ phase. Firstly, the digital characteristics of the cloud model quantitatively can not only represent the randomness of users’ electricity consumption but also express the fuzzy relationship between the three-phase voltage in substation area and the users’ voltage, and the improved cloud model has been proposed based on the traditional cloud model to save the calculation time. Secondly, inspired by the former research, the collected voltage sequence is adaptively divided into three segments by the adaptive segmentation voltage algorithm to increase the segmented waves’ fluctuation characteristics, and the digital cloud characteristics of each segmented voltage sequence are quickly calculated by the improved cloud model. Thirdly, the cloud features of full voltage sequences are calculated by the improved cloud model. Finally, according to the segmented voltage improved cloud model, the cosine similarity between users’ full domain voltage sequences and station’s three-phase voltage sequences are calculated, then the users’ phase is identified according to the size of cosine similarity.
Cloud model and its improvement
Definition of cloud model
Cloud model is a mathematical model which enables the interconversion of quantitative concepts and qualitative concepts. The cloud model consists of a large number of cloud drops which represent data point. The overall shape of the cloud model reflects the qualitative concepts under quantitative values. The definition of the cloud model is shown below:
The qualitative concept C is a concept on the quantitative domain U, if x ∈ U is a random realization of the concept, the certainty degree of C for X is a random number with stable distribution: μ (x) : U → [0, 1] , ∀ x ∈ U. The distribution on the domain is called the cloud model. The quantitative value reflects the randomness of the quantitative concept, and μ (x) reflects the possibility of quantitative value belonging to the qualitative concept.
The fluctuation characteristics of different voltage sequences can be expressed by the cloud model. Different voltage sequences have different cloud model shapes. The more similar between the shapes of two cloud models are, the more similar fluctuation characteristics of the voltage sequences cloud model are. That means the two voltage sequences is more likely belonging to the same phase of power supply.
Cloud generator
The cloud model often uses three numerical features such as expectation Ex, entropy E n and super entropy H e to describe the qualitative concept of data. Let the voltage sampling sequence be U = [u1, u2, u3, . . . , u n ], and the cloud model of the voltage sequence be C U = [E x , E n , H e ]. When Ex = 235.38, E n = 1.09, H e = 0.1 the cloud model is shown in Fig. 1.

Voltage cloud model CU = [235.38,1.09,0.1].
The expectation Ex in Fig. 1 represents the mathematical expectation of the distribution in voltage domain space. It also means the average value of the voltage sequence. The entropy E n represents the span of voltage cloud model, reflecting the dispersion degree of voltage cloud droplet distribution. Similar to the “3σ norm”, there is a “3E n norm” in voltage cloud model, that is 99.74% of the voltage droplets will fall in the area [E x - 3E n , E x + 3E n ], and the droplets outside the area will be called small probability events. Super entropy H e is the entropy of the entropy E n , not only represents the thickness of voltage cloud model, but also reflects the deviation degree of the voltage cloud droplet distribution. The greater thickness of voltage cloud model is, the more unstable voltage cloud droplet distribution is.
Cloud models are closely related to cloud generators. The process of generating cloud models C U = [E x , E n , H e ] by voltage sampling sequences is called Backward Cloud Transformation (BCT). While the process of generating more cloud drops by using the original voltage sampling sequences is called Forward Cloud Transformation (FCT), and the process of traditional cloud generator algorithms are shown in Tables 1 2.
The algorithm of forward cloud transformation
The algorithm of backward cloud transformation
It can be seen from 2.2 that the cloud model has two types of cloud generators. One is the forward cloud which is used to generate more cloud drops, and the other is the backward cloud which can represent the quantitative voltage cloud drops with the cloud model C
U
= [E
x
, E
n
, H
e
]. The traditional backward cloud generator algorithm is shown in Table 2, the calculation method is very simple. However, in engineering applications, the daily fluctuation of the voltage sampling sequence is relatively small under normal operation. So the sample variance of the voltage data is small, it is easy to appear the phenomenon that
To solve the problem that
In this paper, an Improved Backward Cloud Transformation (IBCT) algorithm is proposed, the algorithm procedure is shown in Table 3.
The process of IBCT
The process of IBCT
Traditional user phase identification algorithms often use Pearson correlation coefficients, clustering and other methods. No matter which one of traditional user phase identification algorithms is taken, the results of three phase judgement based on the practical application of engineering are too small to identify the phase of users. It is very easy to misjudge users’ phase. In order to solve such a problem, the paper proposes a new algorithm based on adaptive segmentation voltage algorithm and improved cloud model. By calculating the cosine similarity between the adaptive segmentation voltage sequence cloud models, the users’ phase can be identified correctly.
Adaptive segmentation algorithm
In the daily maintenance of the power grid enterprises, the electricity collection system is often used to collect the electrical energy information of users and station areas. The current collection frequency of the collection system is once every 15 minutes. So the number of data points is 96 points per day. In the study of this paper, the voltage sampling sequence is taken as 96 points of voltage sampling per day, when the cloud model is calculated for the whole voltage sampling sequence. The calculation result only reflects the overall digital characteristics of the voltage sampling sequence. While the station area voltage fluctuates less during normal operation, the digital characteristics of the whole voltage cloud models are less different, the differentiation degree of the calculation result is lower, it is very easy to misjudge the phase of users.
From the previous sections, it is clear that the entropy E n in the cloud model represents the chaos degree of data. The larger entropy value is, the larger range of values are acceptable to the qualitative concept, so there are more unstable and chaotic data. It is also same in user phase identification, the smaller entropy value is, the more obvious the fluctuation characteristics of the voltage sampling sequences are. Therefore, the adaptive segmentation algorithm will aim at reducing the entropy of the voltage sampling sequence and adaptively dividing the voltage sampling sequence into an arbitrary number of segments according to the principle of maximum entropy reduction of the segments, and the specific algorithm flow is shown in Table 4.
The algorithm of adaptive segmentation in voltage
The algorithm of adaptive segmentation in voltage
According to the adaptive segmentation algorithm in 3.1, the original voltage sequence can be divided into several segments. Because there are three peaks in the daily electricity consumption, this paper divided the voltage into three parts. The similarity between cloud models of the original voltage sequence can be obtained by calculating the similarity between segmented voltage cloud models. The common algorithms used in the sequence similarity calculation are Pearson correlation coefficient algorithm, cosine similarity algorithm of cloud model (LICM), shape similarity of cloud model (PCM) algorithm and expectation curve based cloud model similarity (ECM) algorithm. The algorithm used in this paper is the cosine similarity algorithm.
Suppose there are two voltage sequences U1 and U2, and the cloud models of the voltage sequences are C1 = [Ex1, En1, He1] and C2 = [Ex2, En2, He2]. The vectors consisting of the digital features of two cloud models are
The two voltage sequences are divided by the adaptive segmentation algorithm into {U1-1, U1-2, U1-3} and {U2-1, U2-2, U2-3} and the cloud models of the segmented voltage sequences are CU1-1, CU1-2, CU1-3, CU2-1, CU2-2 and CU2-3. Record the cosine similarity between CU1-1 and CU2-1 as
Where α
i
represents the overlap of sampling periods between different segmented cloud models:
Where tUi-j represents the set of sampling points of the voltage sequence Ui-j.
Phase identification algorithm
In summary, this paper predicts the users’ phase by the adaptive segmentation voltage algorithm and cosine similarity. The specific steps of the identification algorithm are shown in Table 5.
The algorithm of users’ phase identification
The algorithm of users’ phase identification
In this paper, we use the electricity collection system to collect the sampled values of voltage in Z0*** station area in a day, and verify the validity of each algorithm proposed in this paper on the basis of this database.
Verification of the effect of improved voltage cloud model solution
The calculation steps of Improved Backward Cloud Transform (IBCT) are similar to the uncertainty-free inverse cloud algorithm, but the IBCT algorithm can better restore the depth information of the original data. In this paper, based on the collected voltage sampling sequences, the numerical characteristics and the calculation time of cloud model under different algorithms are calculated by MATLAB, and the comparison results are shown in Tables 6 7.
The comparison of He2 between different methods
The comparison of He2 between different methods
The comparison of time consuming between different methods
From Table 6, we can see that the square of super entropy in cloud model under the traditional BCT algorithm is negative, so the entropy value calculation result is meaningless. While the Uncertainty BCT algorithm, MBCT-SR algorithm and IBCT algorithm all of these algorithms can solve the problem of
By observing Table 7, it is easily to find that the IBCT algorithm itself takes much less time than MBCT-SR algorithm and the BCT algorithm. Compared with the BCT algorithm, the IBCT algorithm takes nearly 41% less time and nearly doubles the solving efficiency, which lays the foundation of fast calculation of cloud model.
To facilitate the display, the three-phase voltage of the station area and the voltage data of some users are selected as typical voltage sequences for display. The full domain voltage fluctuation of the typical sequences are shown in Fig. 2.
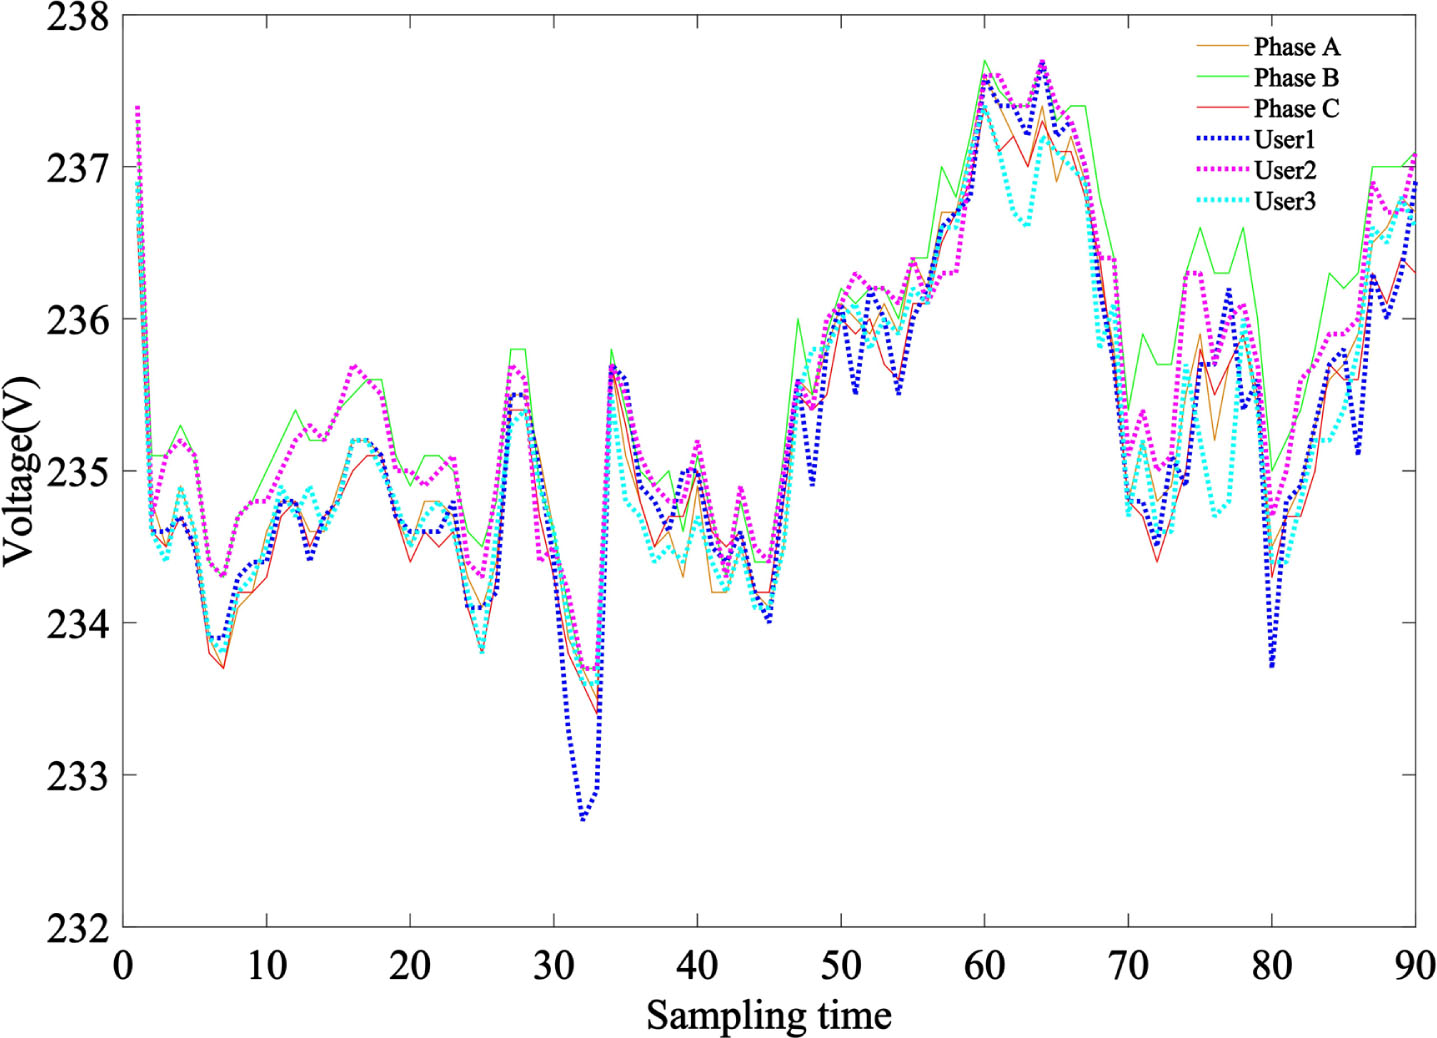
The whole voltage wave form of typical voltage sequences.
The fluctuation characteristics between users’ voltage and three-phase voltage in Fig. 2 are relatively similar and not distinguishable.
The full domain cloud model parameters for typical voltage sequences are calculated by the improved cloud model as shown in Table 8.
The results of typical voltage sequences which are dealt by IBCT
The full domain voltage cloud model is shown in Fig. 3.
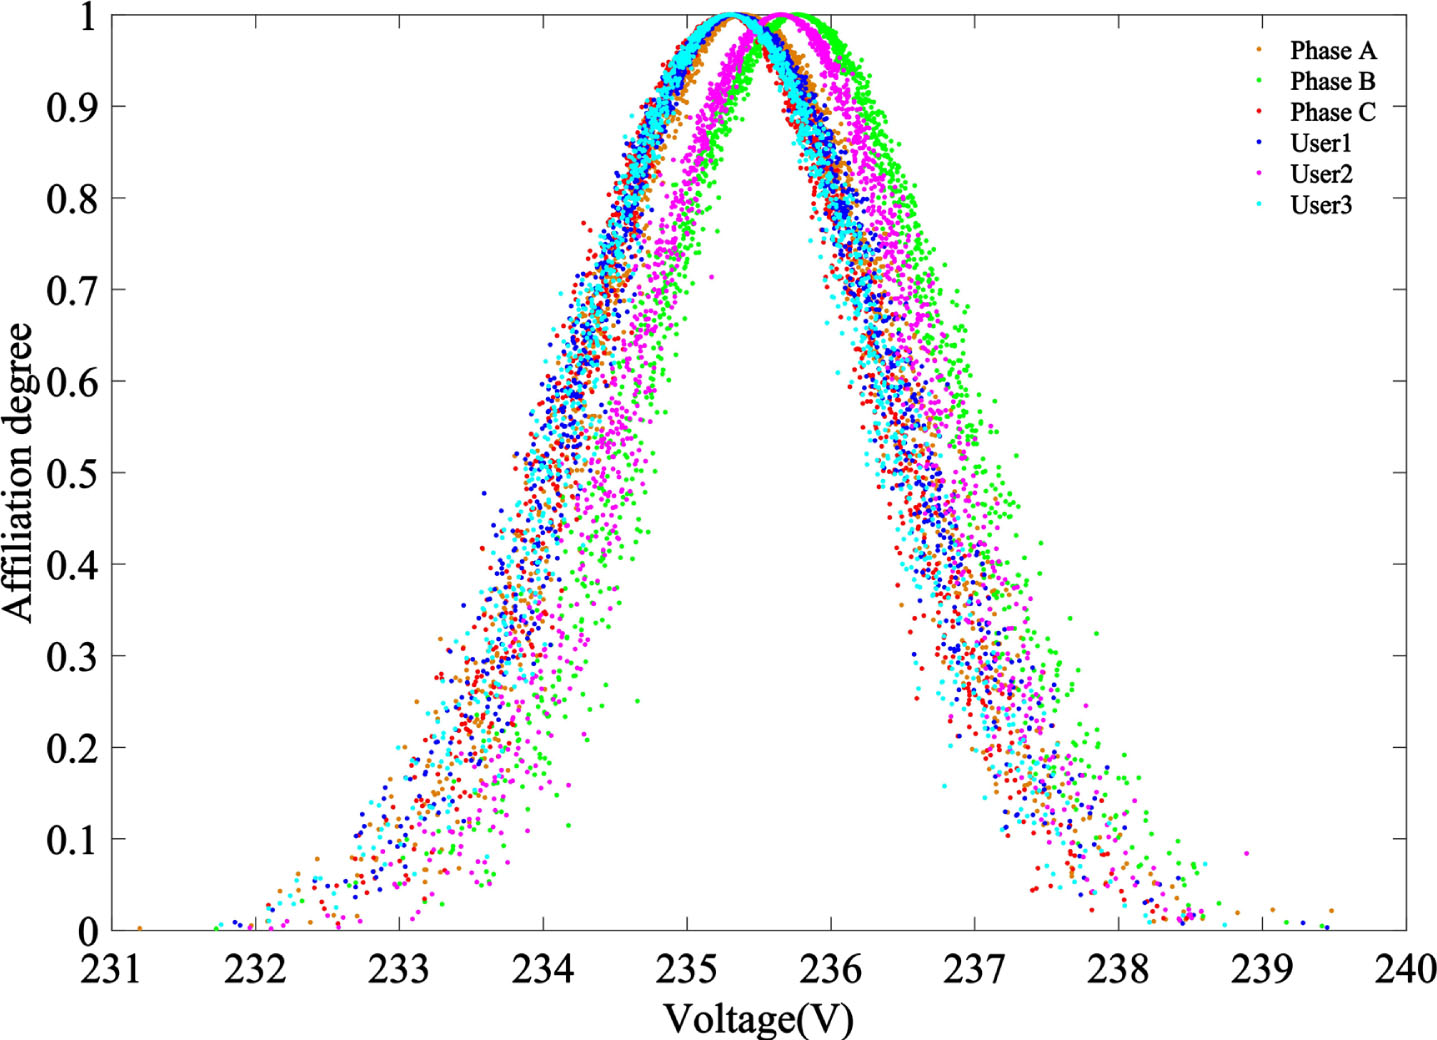
The full domain voltage cloud model diagram.
The difference between users’ voltage cloud model and three-phase voltage cloud model in Fig. 3 is too small. The results of cosine similarity and sequences’ phase judgment are shown in Table 9.
The results of phase identification and cosine similarity in whole sequence
From Table 9, it can be seen that the cosine similarity between each voltage sequences and the three-phase voltage are relatively close to each other based on the full-domain voltage sequence cloud model phase identification. It is very easy to be misjudged. In Table 9, the Phase B voltage sequence is misjudged as Phase C.
In order to reduce the rate of misjudgment, the adaptive segmentation voltage algorithm will be introduced, and the three-segment voltage local waveform after the adaptive segmentation algorithm is shown in Fig. 4.
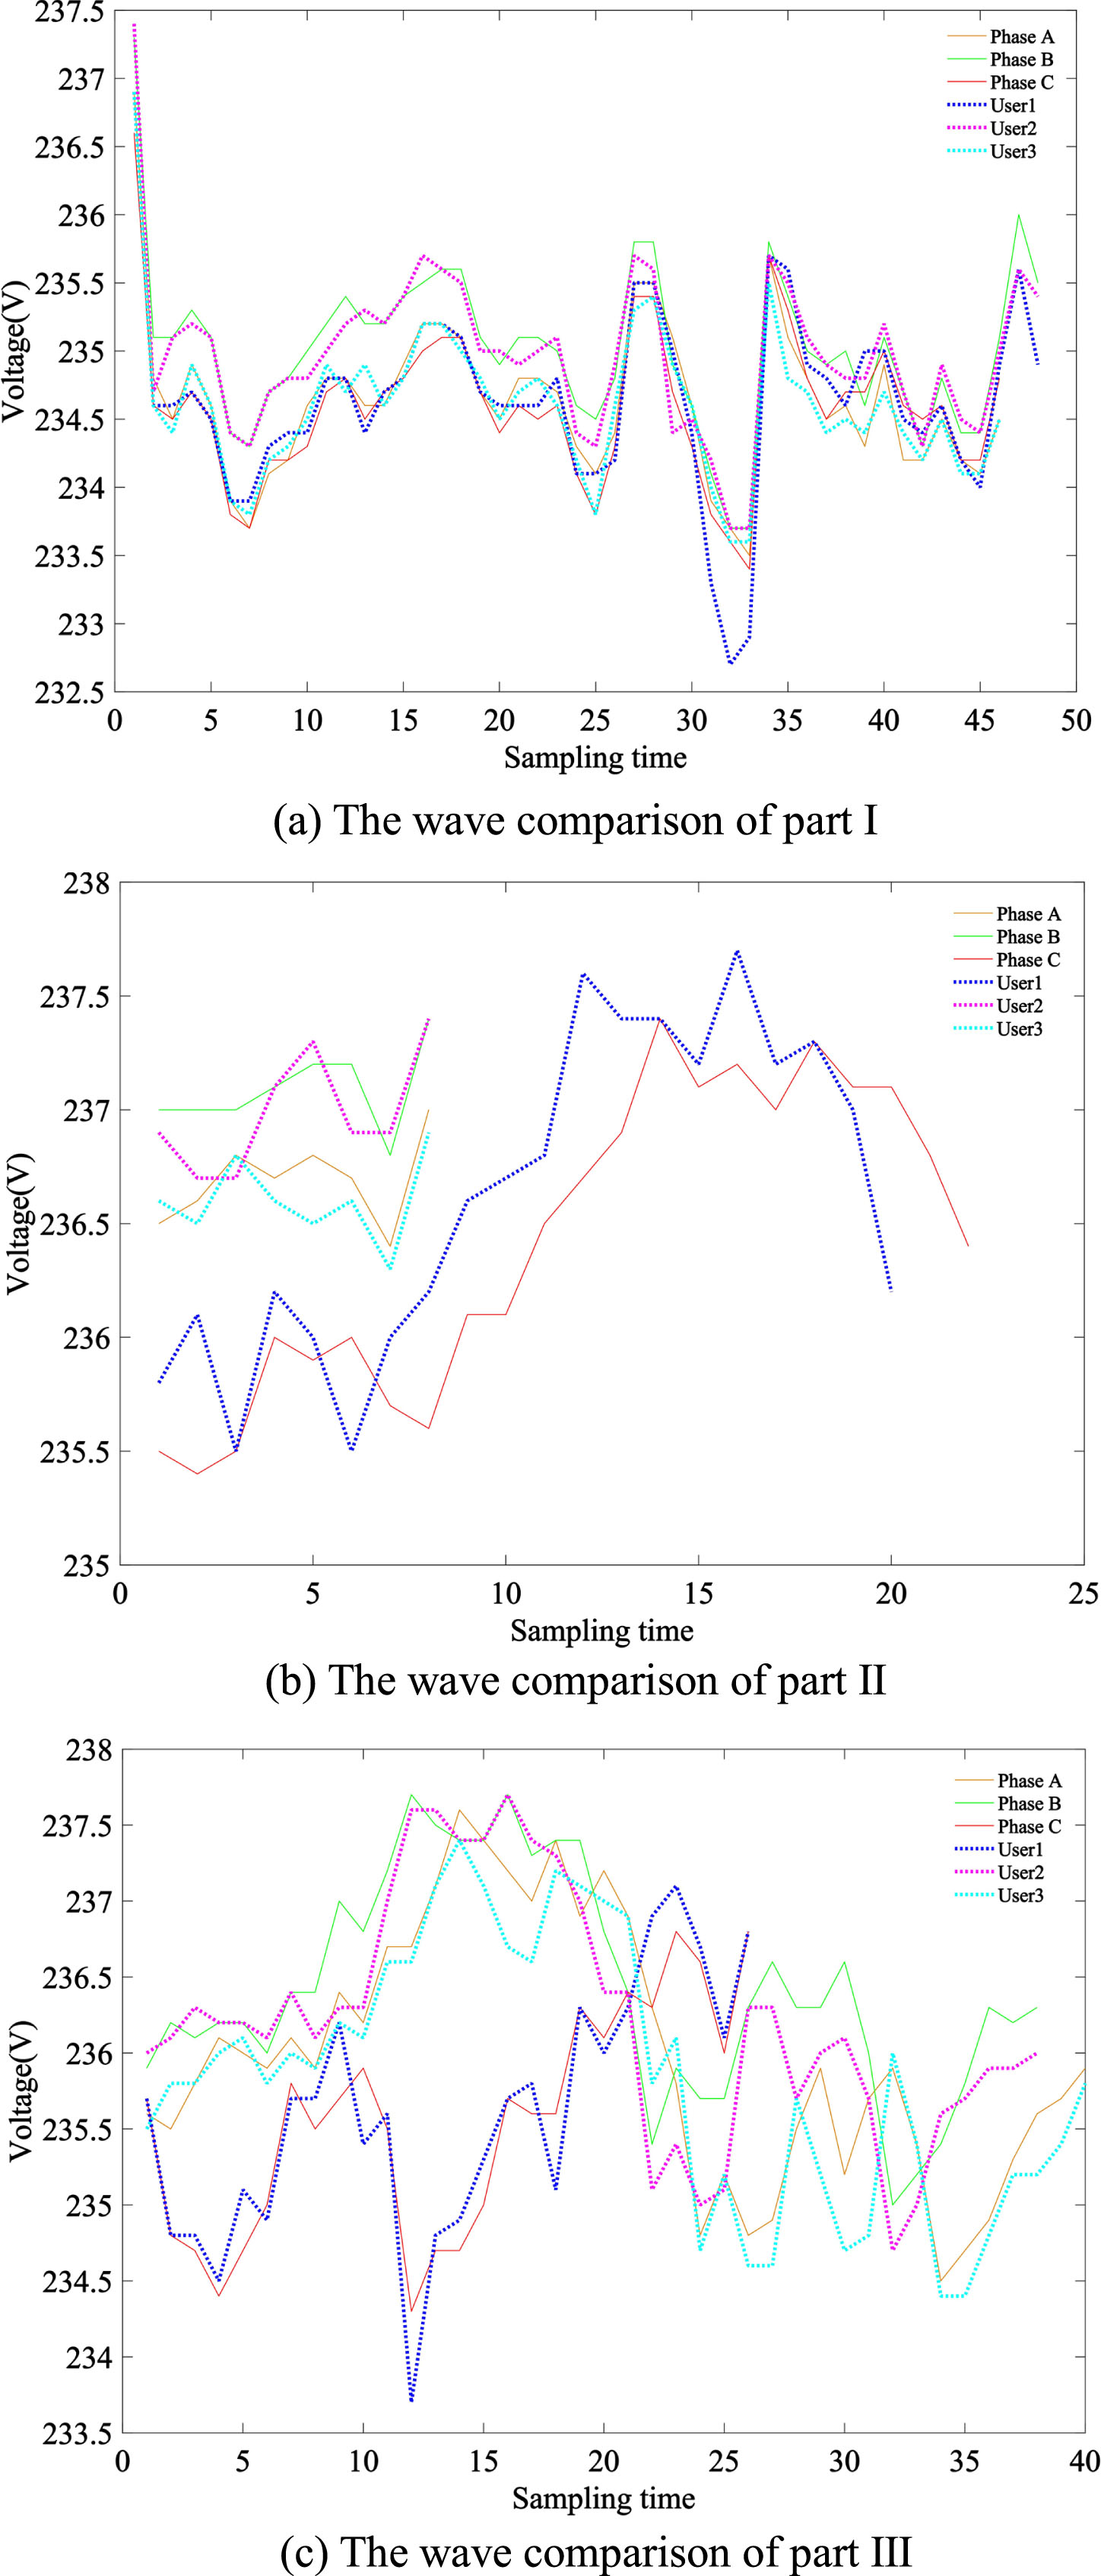
The wave comparison in three parts of segmented voltage.
Figure 4 is composed of three sub-plots. Figure (a) is the first part of local waveform comparison between three-phase power supply and users’ voltage. It can be easily seen that the fluctuation characteristics of users’ voltage sequences and three-phase voltage sequences are relatively close. It is difficult to distinguish which phase of each user belongs to. Figure (b) is the second part of local waveform comparison between three-phase power supply and user voltage. It is not difficult to find that the fluctuation characteristics between user1 and Phase C voltage sequence are closer, user2 and Phase B voltage sequence are closer, user3 and Phase A voltage sequence are closer. Figure (c) shows the comparison between three-phase power supply and user voltage in part three of local waveform, and the results of Figure (c) are similar to those of Figure (b) that means the fluctuation characteristics of user1, user2 and user3 in Figure (c) are closer to those of Phase C, Phase B and Phase A voltage sequence respectively. In summary, the fluctuation characteristics of user1, user2 and user3 are closer to the Phase C, Phase B, and Phase A voltage sequences respectively. Thus, it can be roughly analyzed that user1 belongs to Phase C power, user2 belongs to Phase B power, and user3 belongs to Phase A power.
In order to conduct a more detailed and in-depth study on user phase identification, the improved voltage cloud model is used to calculate the voltage segmentation cloud model of station area and users, and the calculation results are shown in Table 10.
The results of segmented voltage sequences which are dealt by IBCT
According to the cloud model comparison between users and station three-phase power segmentation voltage in Table 10, the comparison diagrams between cloud models are shown in Fig. 5.
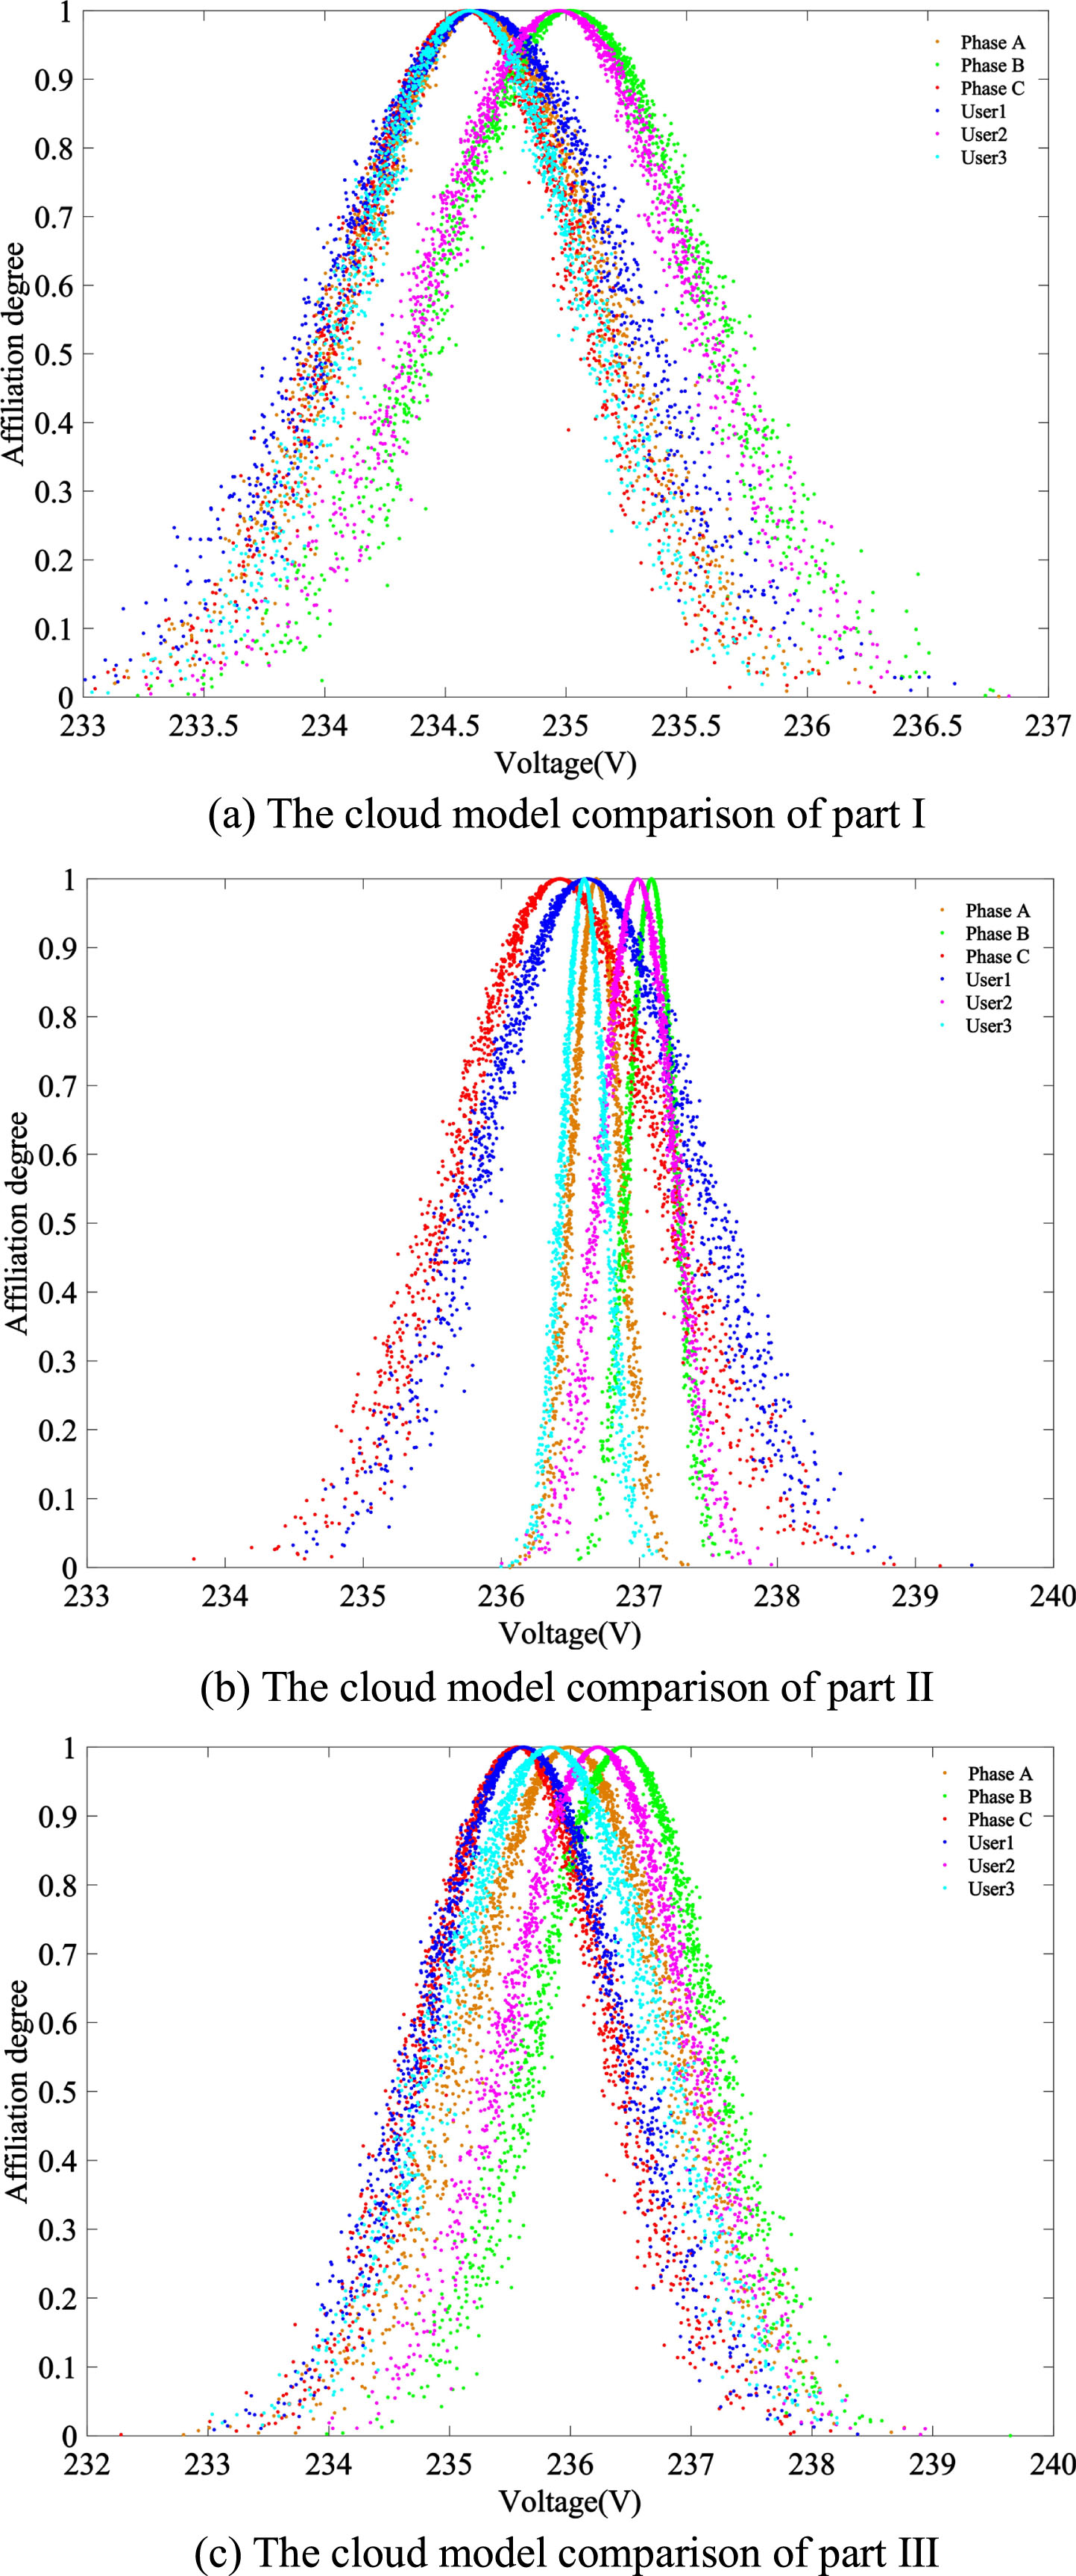
The cloud model comparison between three parts of segmented voltage.
It is not difficult to observe the segmented voltage cloud model in Fig. 5: User1’s I segmented cloud model is closer to both Phase A voltage cloud model and Phase C voltage cloud model. But in II and III segmented cloud model comparison diagrams, User1’s cloud model is only closer to the Phase C voltage cloud model and there are more obvious gap between User1’s cloud model and the other two voltage cloud model. User3 is similar to User1, User3’s I segmented cloud model is closer to both Phase A voltage cloud model and the Phase C voltage cloud model with little distinction. But in II and III segment cloud model comparison chart, the cloud model of user3 is only closer to the Phase A voltage cloud model. The gap of voltage cloud model between the remaining two phases is more obviously. The cloud model of user2 is closer to the Phase B voltage cloud model in each segment cloud model comparison chart. The results of the segment cloud model comparison diagrams show that: user1 belongs to Phase C, user2 belongs to Phase B, and user3 belongs to Phase A.
In order to display the user phase identification results digitally, the cosine similarity is used to calculate each segment voltage cloud model, and the calculation and phase identification results are shown in Table 11.
The results of phase identification and cosine similarity in segmented sequences
Analyzing the calculation results in Table 11, we can find that the cosine similarity of voltage cloud model under adaptive segmentation is more accurate. The difference of cosine similarity between different phases is more obviously, the possibility of misjudgment is smaller. Meanwhile the calculation result of cosine similarity between user1 and Phase C is 0.9687; the calculation result of cosine similarity between user2 and Phase B is 0.9987; the calculation result of cosine similarity between user3 and Phase A is 0.9997. The result of cosine similarity between user3 and Phase A is 0.9997, and the calculation result between the corresponding phase power supply and user’s voltage is obviously larger than the cosine similarity between the other two phases and users’ voltage. From Table 9, we can see that the cosine similarity difference between A-A and A-B is 0.0001 based on full domain analysis. But the same difference based on segmented sequence analysis is nearly 0.1. So we can say the difference of similarity between phases is enlarged by 1000 times. So the result of users’ phase identification is user1 belongs to Phase C, user2 belongs to Phase B and user 3 belongs to Phase A. The judgement result of cloud diagram and cosine similarity is same, which combines numbers and shapes.
In order to verify the accuracy and feasibility of the new user phase identification algorithm proposed in this paper, the researchers verified phase sequences of 60 low-voltage users in Z0*** station area on site by using the multi-functional low-voltage station phase sequence identifier. The multifunctional low-voltage station area identifier is a field verification instrument that can not only verify the relationship between users and transformers, but also identify the phase of users. The verification device is shown in Fig. 6.
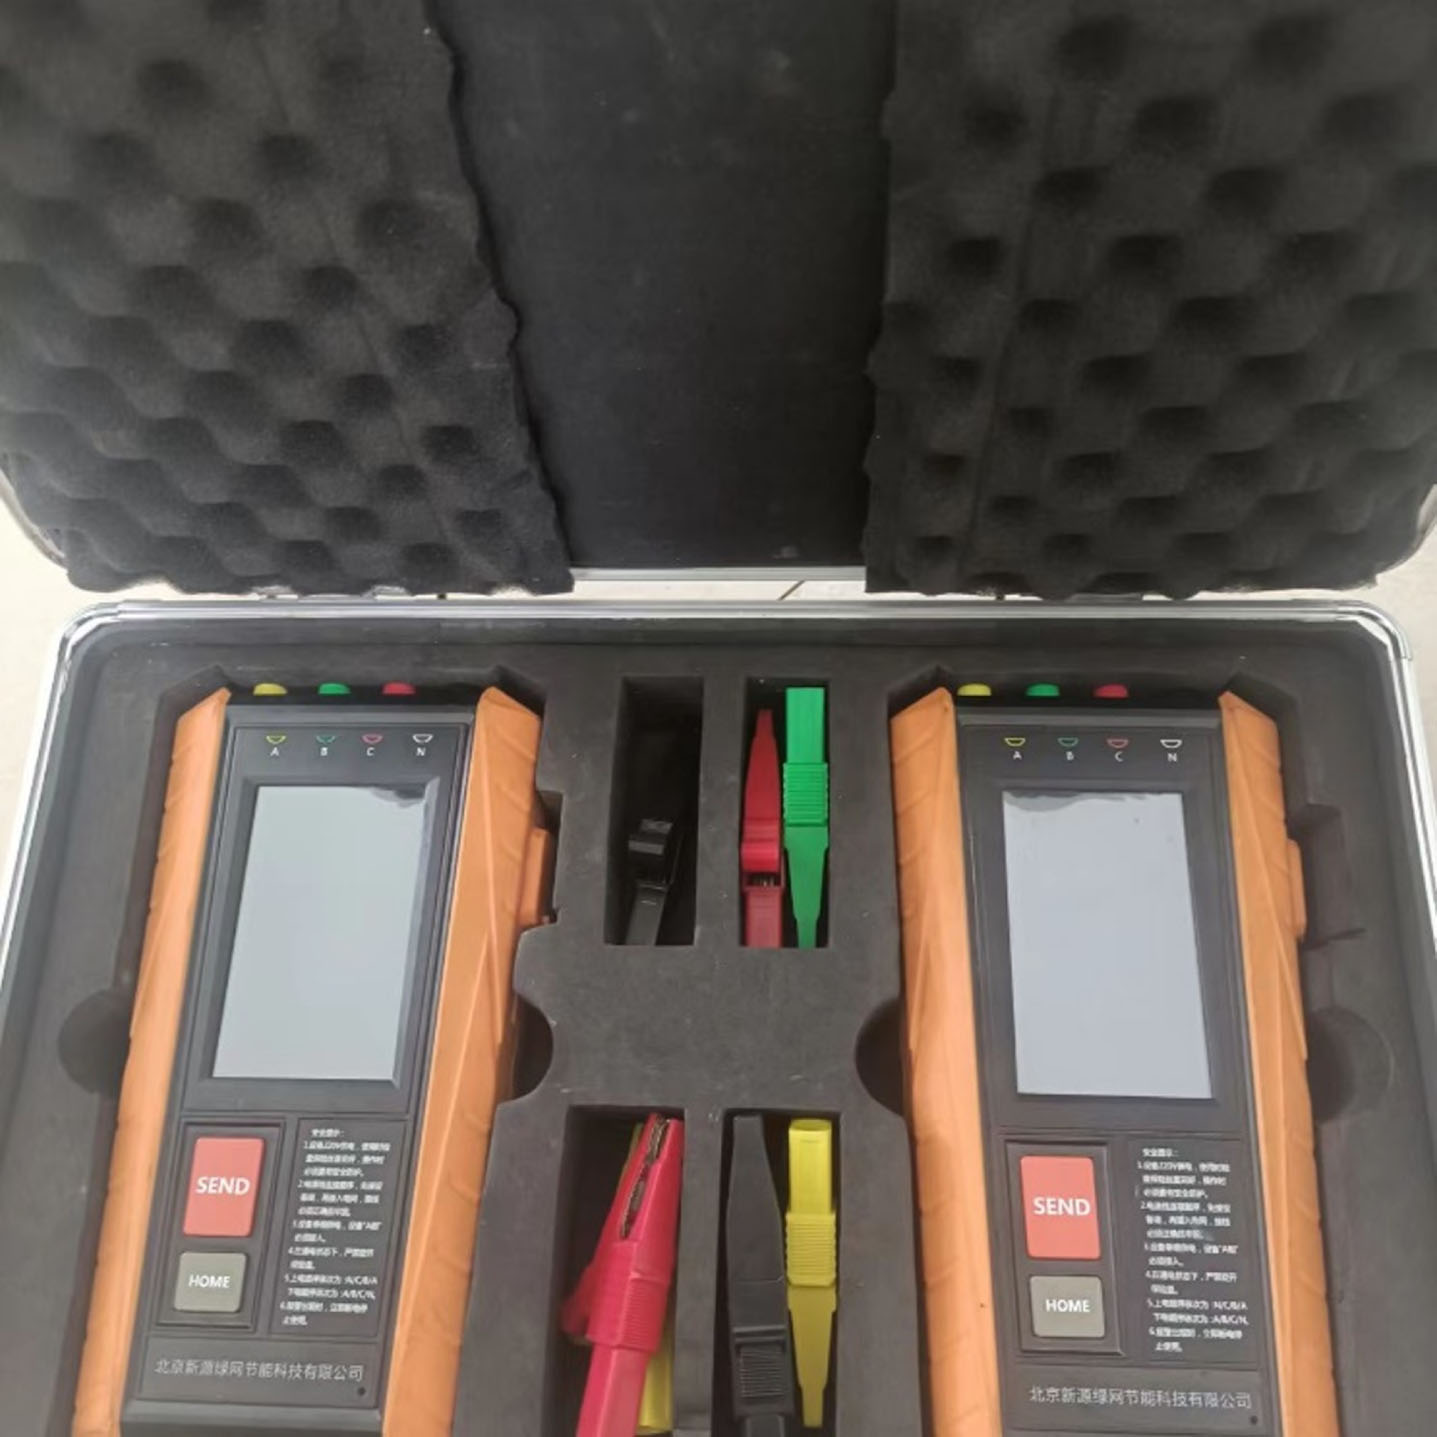
Multifunctional low-voltage station area identifier.
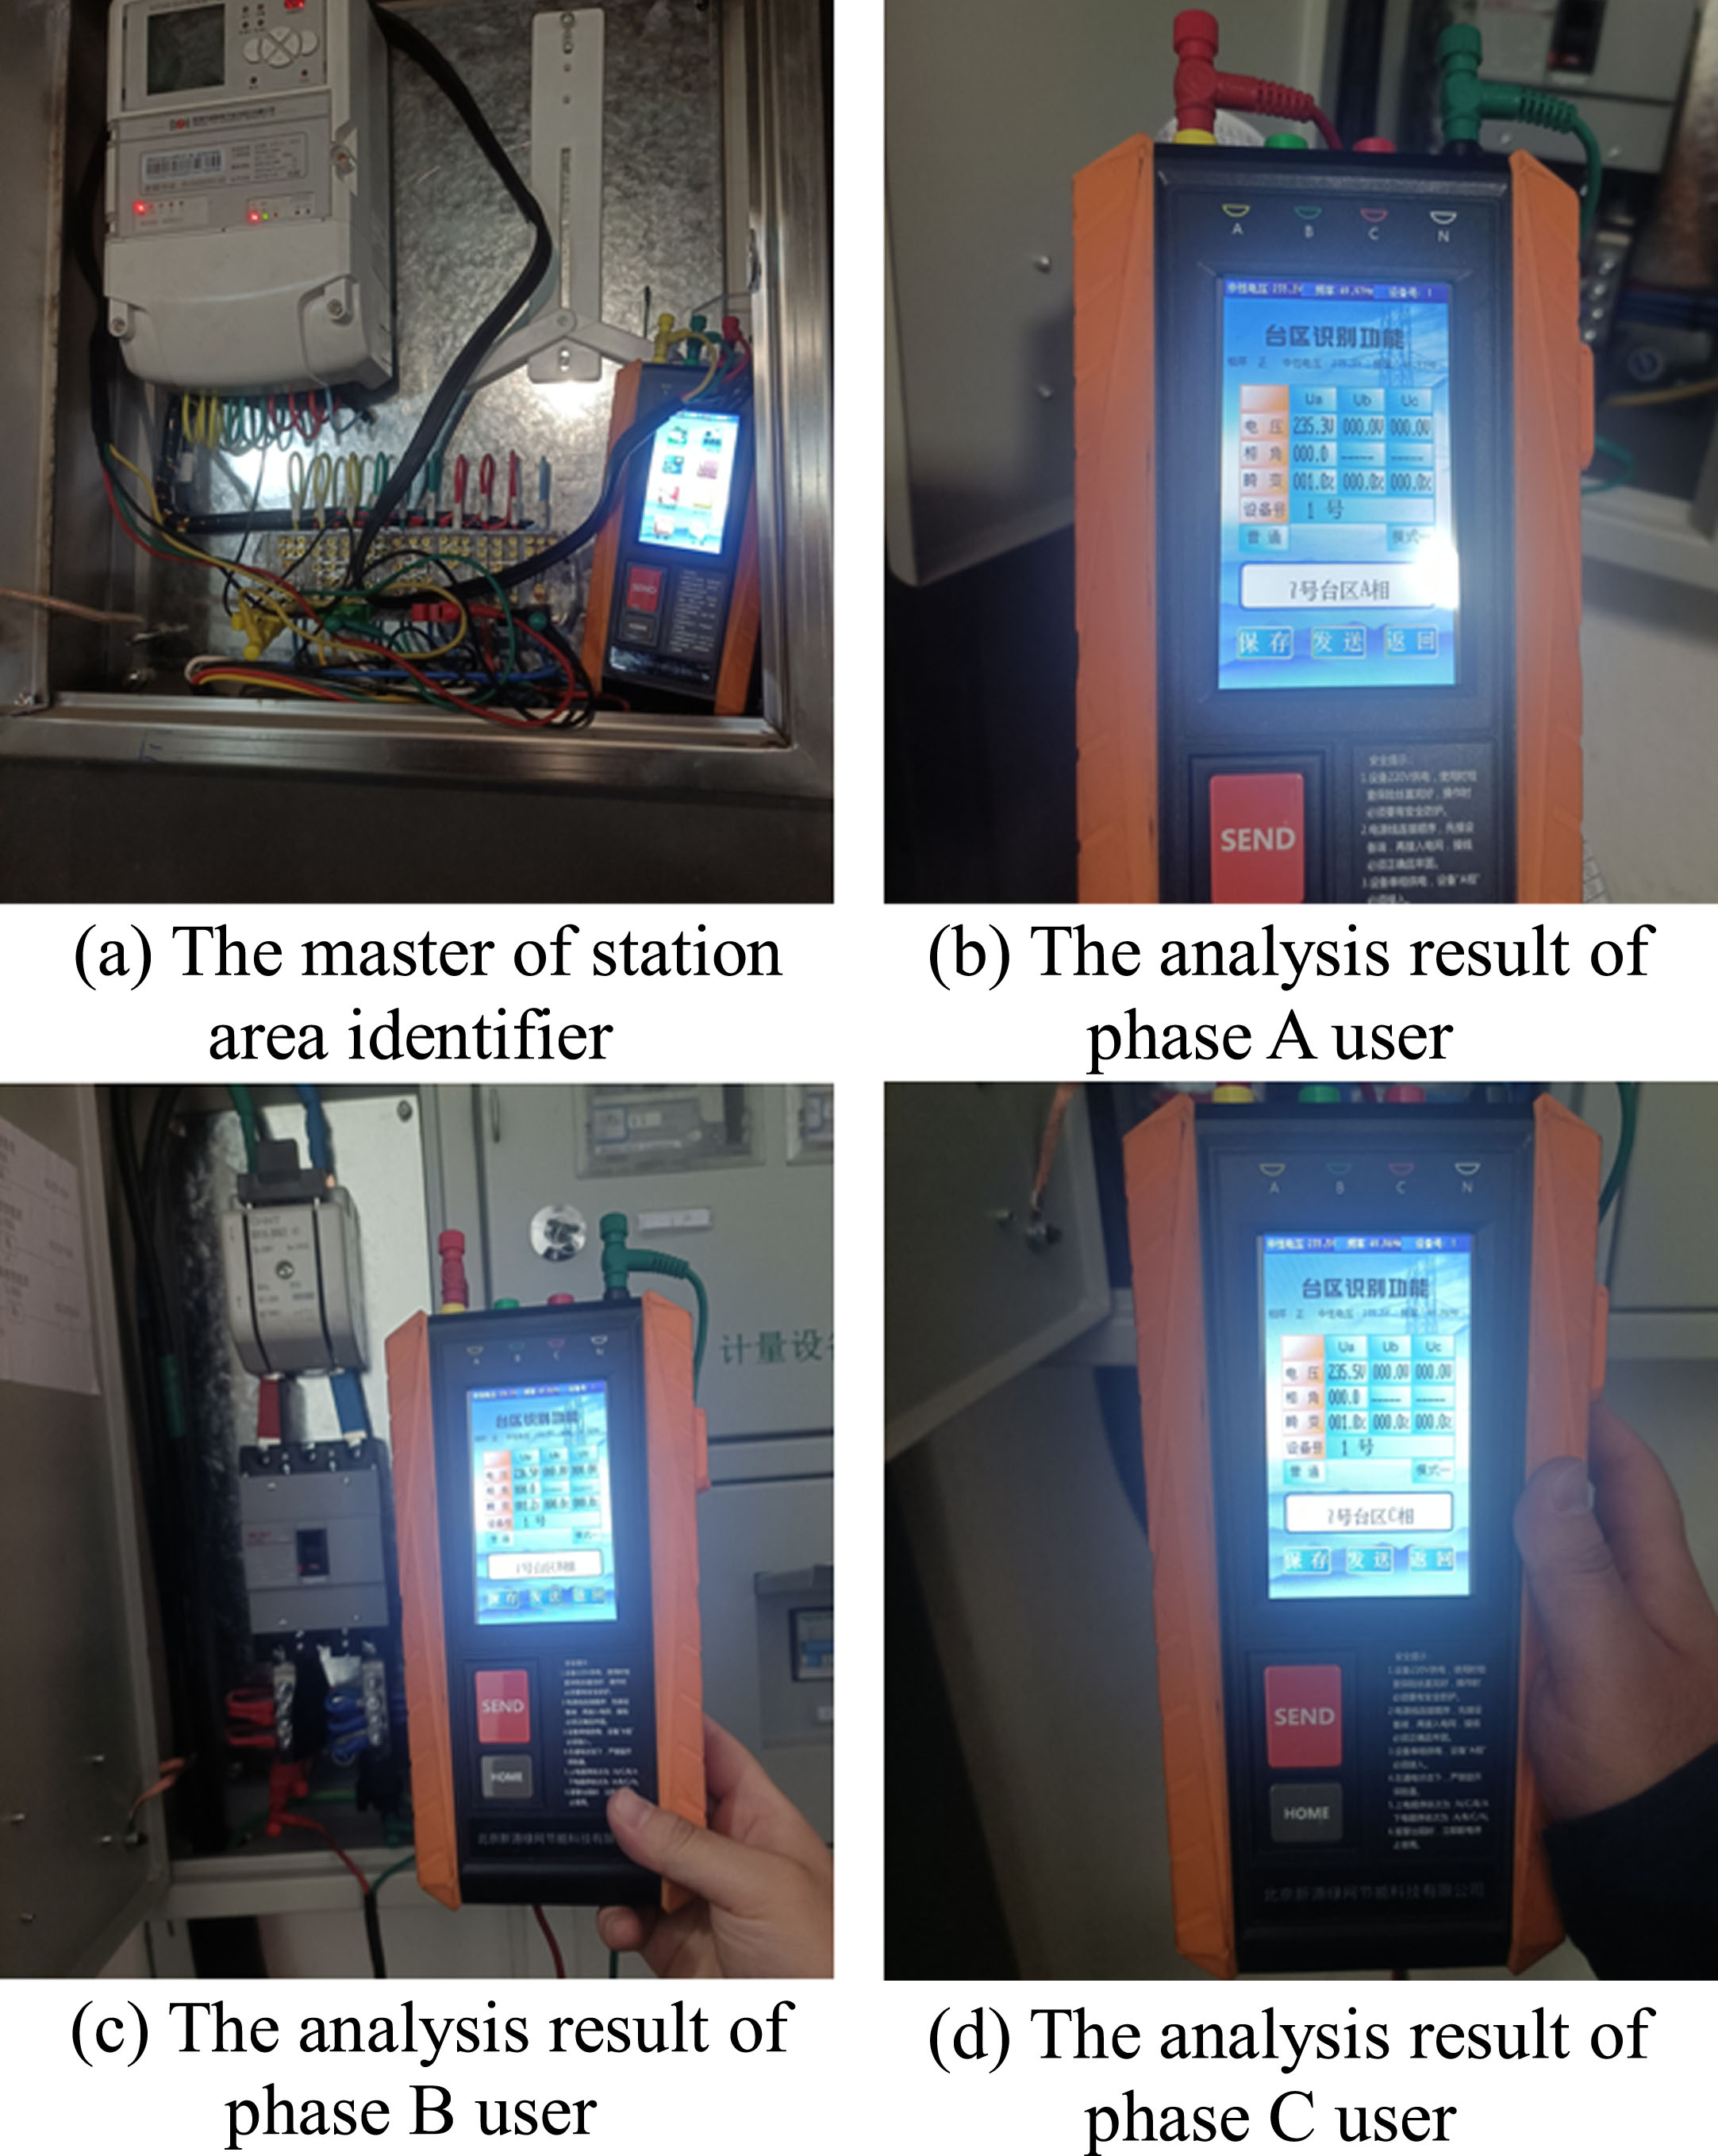
The results of station area identifier in scene.
The multi-functional low-voltage station identification instrument is composed of two parts: the mother machine and the daughter machine. During the field test, the mother machine is clamped on the three-phase voltage of the low-voltage station table, the daughter machine is clamped between the zero line and the fire line of different users. Based on data communication and phase separation calculation between daughter machine and mother machine, the daughter machine can realize which the users’ phase belongs to.
Randomly selected Z0*** station area of 60 users for on-site phase verification, the results of new algorithm identification and scene are compared as shown in Table 12.
The comparison between the new algorithm result and real situation
Observing Table 12, it is not difficult to find that the results of phase identification algorithm randomly selected users are consistent with the results obtained from on-site verification, which verifies the feasibility and effectiveness of the algorithm proposed in this paper. In the final result, the accuracy of the new algorithm is 95%.
To solve the problem of inaccurate judgment of users’ phase in daily management of electric power enterprises, this paper proposes a new user phase identification algorithm based on improved cloud model and adaptive segmentation voltage algorithm. Compared with traditional user phase identification algorithm, the advantages of the algorithm proposed in this paper are as follows:
(1) This paper improved the traditional cloud model. Through data comparison, it can be found that the new model not only solves the problem of meaningless calculation in super entropy on the basis of retaining the original data information, but also greatly reduces the model calculation time consuming, making the solution efficiency of the user identification model method improved by 41%.
(2) On the basis of the improved cloud model, this paper proposes an adaptive segmentation algorithm which divides the full domain sampling sequence of user and three-phase voltages into three segments. The algorithm introduces the local fluctuation characteristics into the user phase discrimination process, and lays the foundation for the new user phase identification algorithm.
(3) The user phase identification algorithm proposed in this paper integrates the two algorithms above: firstly, the adaptive segmentation algorithm is used to divide the global voltage sampling sequence with similar fluctuation characteristics into three parts of local sampling voltage sequences with more obvious fluctuation characteristics. Then the cloud digital characteristics of the three-part voltage sequence are calculated by the improved cloud model. Finally, the user phase is correctly identified by combining with the cosine similarity calculation. Through data verification, it is easy to find that the user phase identification algorithm proposed in this paper expands the cosine similarity gap between user voltage sequences and different power supply voltage sequences by 1000 times which effectively reduces the misjudgment rate of user phase discrimination and improves the differentiation and accuracy of user phase identification. In the final result, the accuracy of the new algorithm is 95%. After field verification we find that the results of users’ new identification algorithm are feasible.
The characteristic of saving calculation time in the improved model is suitable for the research in future. The thought of adaptive segmentation algorithm is universal, but the algorithm in this paper only divides the full domain voltage sequence into three parts by station area’s load characteristics. The algorithm didn’t concerned about the users’ habits and the influence of the seasons change. In the future research, the voltage sequence can be divided into more parts which are decided by different users’ habits and the influence of different seasons. The results in the future maybe more interesting.
Footnotes
Acknowledgments
This paper was supported by the National Social Science Fund of China (No. 20BTJ012), Social Science Foundation of Hebei Province of China (No. HB18GL008), Beijing Intelligent Logistics System Collaborative Innovation Center (No. BILSCIC-2019KF-15), and Philosophy and Social Science Key Cultivation Project of Hebei University (No. 2019HPY035).