
Abstract
Some anomaly detection methods are based on CNN to fuse spatial and channel-wise information together within local receptive fields. However, the correlation between feature channels has not been fully utilized. Channel attention has been shown to model the interdependence between convolution feature channels and improve network representation. It is possible to introduce channel attention into anomaly detection. We attempt to directly embed the SE(Squeeze and Excitation) module into the convolutional layer but reduced anomaly detection performance. Therefore, we propose a lightweight channel attention module C-SE(Current Squeeze and Excitation) suitable for anomaly detection. C-SE module not only improves the representation ability of depth convolutional neural network but also has a significant effect on texture anomaly detection. C-SE module body is constructed by average pooling and maximum pooling branches, which ensure that local salient features of the image are not lost. Then reduce the negative impact of feature calibration through a long connection. In addition, the improvement of classifier plays an important role. Experimental results have shown that the proposed method outperforms the Patch SVDD methods by 3% in image-level AUROC and 0.7% in pixel-level AUROC on the MVTec benchmark. The higher AUROC score and the faster rate of convergence prove the effectiveness of the method.
Introduction
Anomaly detection is a binary classification problem that determines whether the input is normal or abnormal. In industrial production, abnormal samples are difficult to obtain or almost non-existent. It is impossible to use abnormal datas for effective modeling. Therefore, anomaly detection is often described as one classification problem. A common method is to train the model by normal samples so that normal datas can satisfy a certain distribution. During the test, abnormal samples are detected because they do not satisfy the distribution. Anomaly detection has great significance in industrial image detection and medical image detection.
The prerequisite for good modeling is that normal sample features can be extracted well. Only using deep neural networks to extract normal sample features cannot satisfy downstream tasks. Therefore, some anomaly detection methods use learning strategies to assist in improving feature extraction capabilities. S. Akcay et al. proposed [1] Ganomaly model. They used the DCGAN [2] network to build an encoder-decoder and enhanced the feature extraction capability of the encoder by using a Generative Adversarial Net. J. Yi et al. proposed [3] Patch SVDD. They used deep networks to extract patch features. At the same time, to obtain the location information of the nearest neighbor patch, they use location coding to achieve this. P. Bergmann et al. proposed [4] the student-teacher framework. They trained a better student network through a well-learned teacher network. This student network inherits the excellent feature extraction ability of the teacher network and can only reconstruct normal features.
The above studies have adopted other strategies to enhance the ability of feature extraction. However, they ignored the most essential feature of convolutional neural network, that is, the relationship between feature channels. Channel attention [5] can model the interdependence between channels and adaptively calibrate channel features. It automatically obtains the importance level of each feature channel through learning. Then enhances useful features and suppresses features that are not useful for the current task based on this importance level. Using channel attention is more conducive to extracting useful features. Strangely, this simple and effective attention module is rarely used for anomaly detection tasks. This may be related to industrial anomaly detection images. As shown in Fig. 1, the edge features of cable image are very obvious, including prominent features such as contours and gray-level. The texture features of tile image are very obvious, which is the most prominent information on the entire image. If using channel attention results in the loss of some edge and texture features, the features on these channels will be considered useless. This will affect the representation ability of the network. Therefore, it is necessary to design a channel attention module suitable for anomaly detection.

The cable image and tile image on the MVTec anomaly detection dataset have been shown.
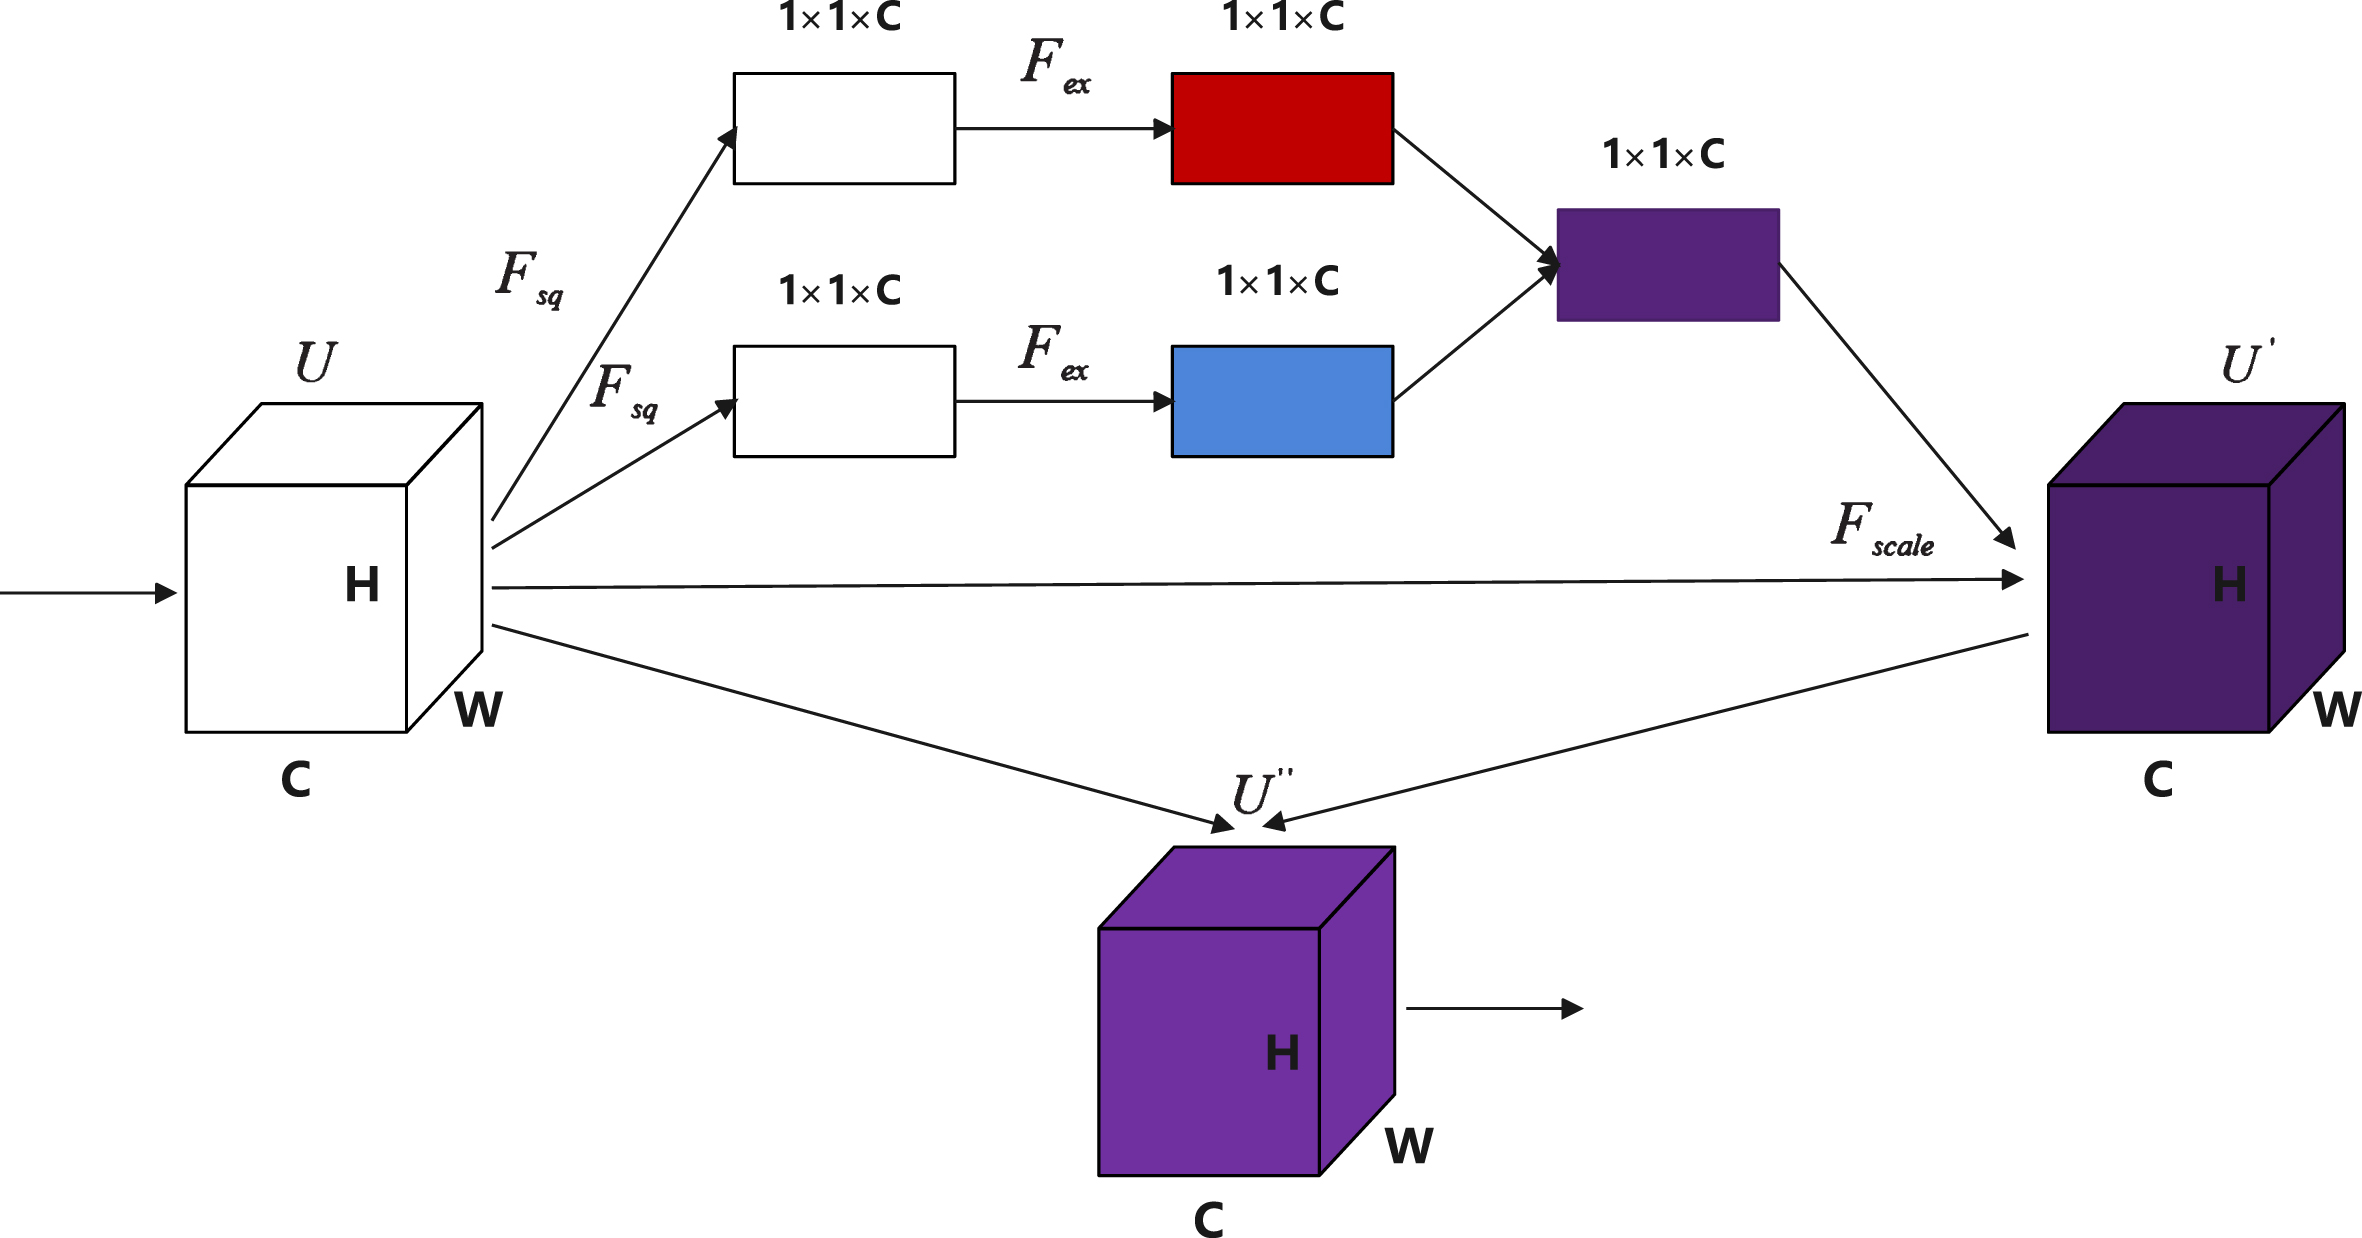
In this paper, we introduce a new channel attention module, which we call C-SE. Figure 2 shows a C - SE module. Define a feature map U, U ∈ RH×W×C. Firstly, U goes through two squeeze operations [5] respectively, which compresses features along the channel dimension and compresses each two-dimensional feature map into a real number. Two squeeze operations represent average pooling and maximum pooling, respectively. After obtaining two two-dimensional feature maps, it goes through two excitation operations. The excitation operation generates a weight for each two-dimensional feature map, which is used to declare the importance of the current channel, and then aggregates the two two-dimensional feature maps with weights into a new two-dimensional feature map. Next is a scale operation, which adds the new two-dimensional feature map weights channel-by-channel to the previous feature map U to obtain . Finally, and the original feature map U are aggregated to obtain the feature map , which can be used as input for subsequent network layers. For images, using average pooling can preserve the overall information of the image, while using maximum pooling can preserve image edges and texture information. For feature maps, using average pooling can obtain global average features, while using maximum pooling can obtain local salient features. Therefore, it is more reasonable to use both maximum pooling and average pooling branches to construct channel attention. In the field of anomaly detection, self-supervised learning [3, 6] is often used as an auxiliary task. For example, Patch SVDD. They use self-supervised learning to classify location codes. The classifier consists only of linear layers. The changes between linear layers will increase a large number of parameters. If some parameter values are large, it will cause gradient explosion. If some parameter values are very small, it will cause gradient disappearance. No matter what happens, it is not conducive to the convergence of the loss function. Therefore, we proposed the LBR module and improved the classifier by normalizing parameter values. Fine tuning [7] is a common method for deep learning. In this paper, the hyperparameter λ and parameter r are fine-tuned. λ is the coefficient of the loss function in this paper, which will affect the convergence rate of the loss function. In the C-SE module, r is used to reduce the dimension of the channel. Our main contributions are: • We proposed a C-SE module, which is added to the network to enhance the representation ability of CNN. Under the condition of stable training, the model can achieve good detection ability. • We improved the classifier for Patch SVDD and fine-tuned parameters to improve the performance of the model.
The structure of the C-SE module is shown.
In general, the goal of anomaly detection is to detect abnormal images or local abnormal areas that are different from normal images by unsupervised or semi-supervised learning. With the development of deep learning technology, more and more methods attempt to combine neural networks for image anomaly detection. Deep learning-based methods generally include two categories: the method based on reconstruction and the method based on similarity embedding. Attention mechanisms are now widely used in all areas of deep learning. Whether image segmentation, speech processing, or various types of tasks in computer vision and natural language processing, the attention mechanism shines brilliantly.
Anomaly detection and segmentation
Pre-trained CNN [8–11] and VIT [12] are currently popular for anomaly detection to extract features. Pre-trained CNN [13] requires adaptive anomaly detection tasks. Padim [8] use multiscale feature fusion for anomaly detection. PANDA [7] solves feature adaptation problems through fine-tuning. PatchCore [9] uses middle-level features to solve bias on ImageNet classes. The design of the VIT [14] is also complex. InTra [14] uses multiple VITs for image reconstruction. Each VIT is equivalent to a set of encoder-decoder. The stacking of VITs can effectively reconstruct feature maps. However, due to a large number of VIT modules, shallow features are prone to lose, and residual structures are used to add shallow features to subsequent network layers. Therefore, this method has a huge number of parameters. Some classical methods are commonly used in anomaly detection. SVDD [3, 15] divides the feature space into two regions, with normal features inside the hypersphere and abnormal features outside the hypersphere. Multivariate Gaussian distribution [16, 17] makes the normal samples satisfy the Normal distribution, to obtain a probability estimation model. The statistical model can estimate the possibility that the test sample is abnormal. GAN [18, 19] is a method of image reconstruction. Use the generator as a decoder and the discriminator as an encoder. This method enhances the capabilities of the encoder and decoder by generating confrontations. Another method is the memory bank [20]. Due to the strong capabilities of some encoders and decoders, anomalies can be reconstructed. For this situation, a memory library that tracks and stores normal feature vectors can be added in the middle of the encoder and decoder. The abnormal features passing through the encoder will be mapped to normal feature vectors in the memory library. Therefore, regardless of whether the image is normal or abnormal, the model can only reconstruct the normal image. Algorithms commonly used for anomaly detection, such as clustering [3] and K-NN [21]. Clustering is to make a cluster of similar feature points, and those outliers are considered abnormal. KNN calculates the average distance between each sample point and its nearest k samples in sequence and then compares the calculated distance with the threshold. If it is greater than the threshold, it is considered an outlier.
Attention mechanism
A. Vaswani et al. proposed [22] Self-attention for the NLP task in 2017. They introduced three parameters K, Q, and V to explain the principle of the attention mechanism. Jie et al. proposed SE(Squeeze-and-Excitation Networks) in 2018. They suppress useless features and improve the proportion of useful features in the classification network. S. Woo et al. proposed [23] CBAM (Convolutional Block Attention Module) in 2018. They combine channel attention and spatial attention.
Methods
Figure 3 shows this paper’s approach. After cutting a batch of normal images into patches, which are transported to an 8-layer deep convolution network. The first two layers of the depth encoder are pure convolution, and each of the last six layers has a C-SE module embedded. Image patches are mapped as feature vectors, and then the feature vectors are mapped to the hyperspherical plane in the feature space using the Patch SVDD method. Through training, normal data is aggregated into a hypersphere plane with the smallest radius. During the test, normal data will be distributed in the hypersphere plane and anomalous data will be far away from the center of the hypersphere plane. There are two main considerations when choosing to add C-SE modules in the back six layers of the network: 1. The output dimension of the first two convolutions is low, which is not good for feature calibration after dimension reduction. 2. At a greater depth, each channel’s value becomes more specific to the class.
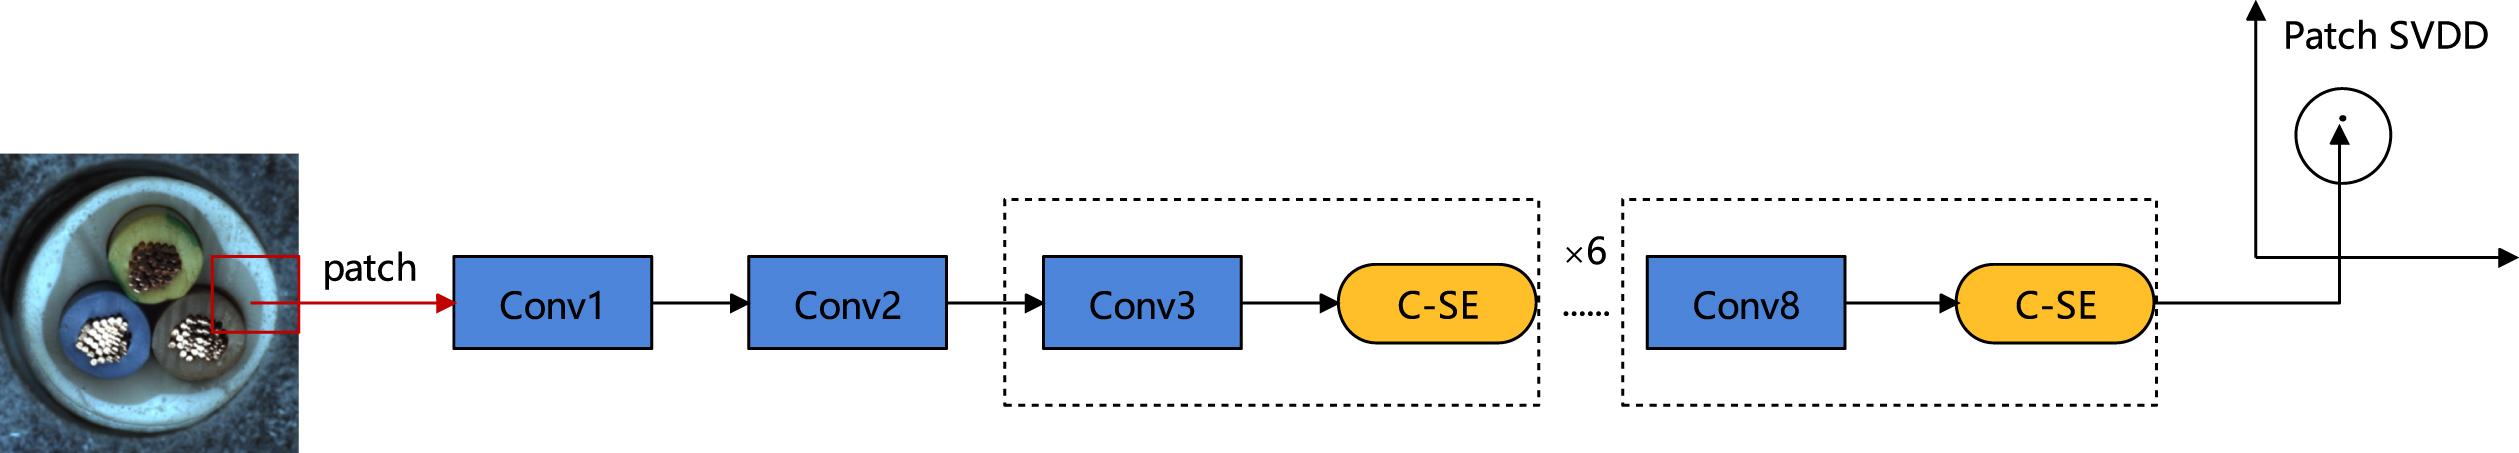
Patch SVDD maps the image patch onto the hypersphere of the feature space by an encoder with strong feature extraction ability. The deep convolutional network of Patch SVDD has 8 layers. C-SE modules are added behind each convolutional layer of the last 6 layers.
Figure 2 shows the three operations of the C-SE module: squeeze operation, excitation operation, and scale operation. Define a feature map U, U ∈ RH×W×C, F
sq
as follows:
Operation F scale adds the weights on z3 to the original feature map U by multiplication so that the feature map containing the channel feature weights can be obtained. Figure 4 shows SE and C-SE module structure. Figure 4.a) shows the C-SE module. x is defined as a convolution layer of three-dimensional output feature map H × W × C. when the x gets a global adaptive average pooling layer, it will be tiled to a 1 × 1 × C feature map, and then it passes through two full connection layers and two activation functions. The function of the two fully connected layers is respectively to reduce and increase the channel dimension. After each fully connected layer, an activation function will be connected. The ReLU function and sigmoid function will assign weight to each channel. Finally, will be obtained after a scale operation. Figure 4.b) shows the C-SE module. Compared with the SE module, the C-SE module adds a similar global adaptive maximum pooling branch based on the global adaptive average pooling branch, so is obtained by the aggregation of the features of the two branches. In addition, the initial feature map x is added to the feature map to get the output feature . For anomaly detection, salient features are often the most important. Just using average pooling does not highlight the most significant features, so the C-SE module has added a maximum pooling branch. Both maximum pooling and average pooling compress feature maps into a real number, with each channel corresponding to a real number. Maximizing pooling maps the feature map to the most significant feature values on the channel. Average pooling maps the feature map to the global average feature values on the channel. The dimensionality reduction of SE modules is random, and important features may not necessarily learn with good initial weights. If important features are not learned with good initial weights, this may have a negative impact on subsequent feature calibration. Feature calibration is to assign larger weights to useful features and smaller weights to useless features. It is implemented through the ReLU function and the Sigmoid function together. Due to some useful features being assigned smaller initial weights, these features will be ignored during feature calibration. After multiple training and weights updates, the weights of these useful features become smaller and smaller. Therefore, to mitigate the impact of this situation, C-SE adds an initial feature to the final output. All initial feature channels have the same weight, which is equivalent to a median. If the weight assigned to the effective feature is lower than the median, the useful feature weight will increase when added to the initial feature weight. Therefore, this method similar to residual connection reduces the negative impact of feature calibration.
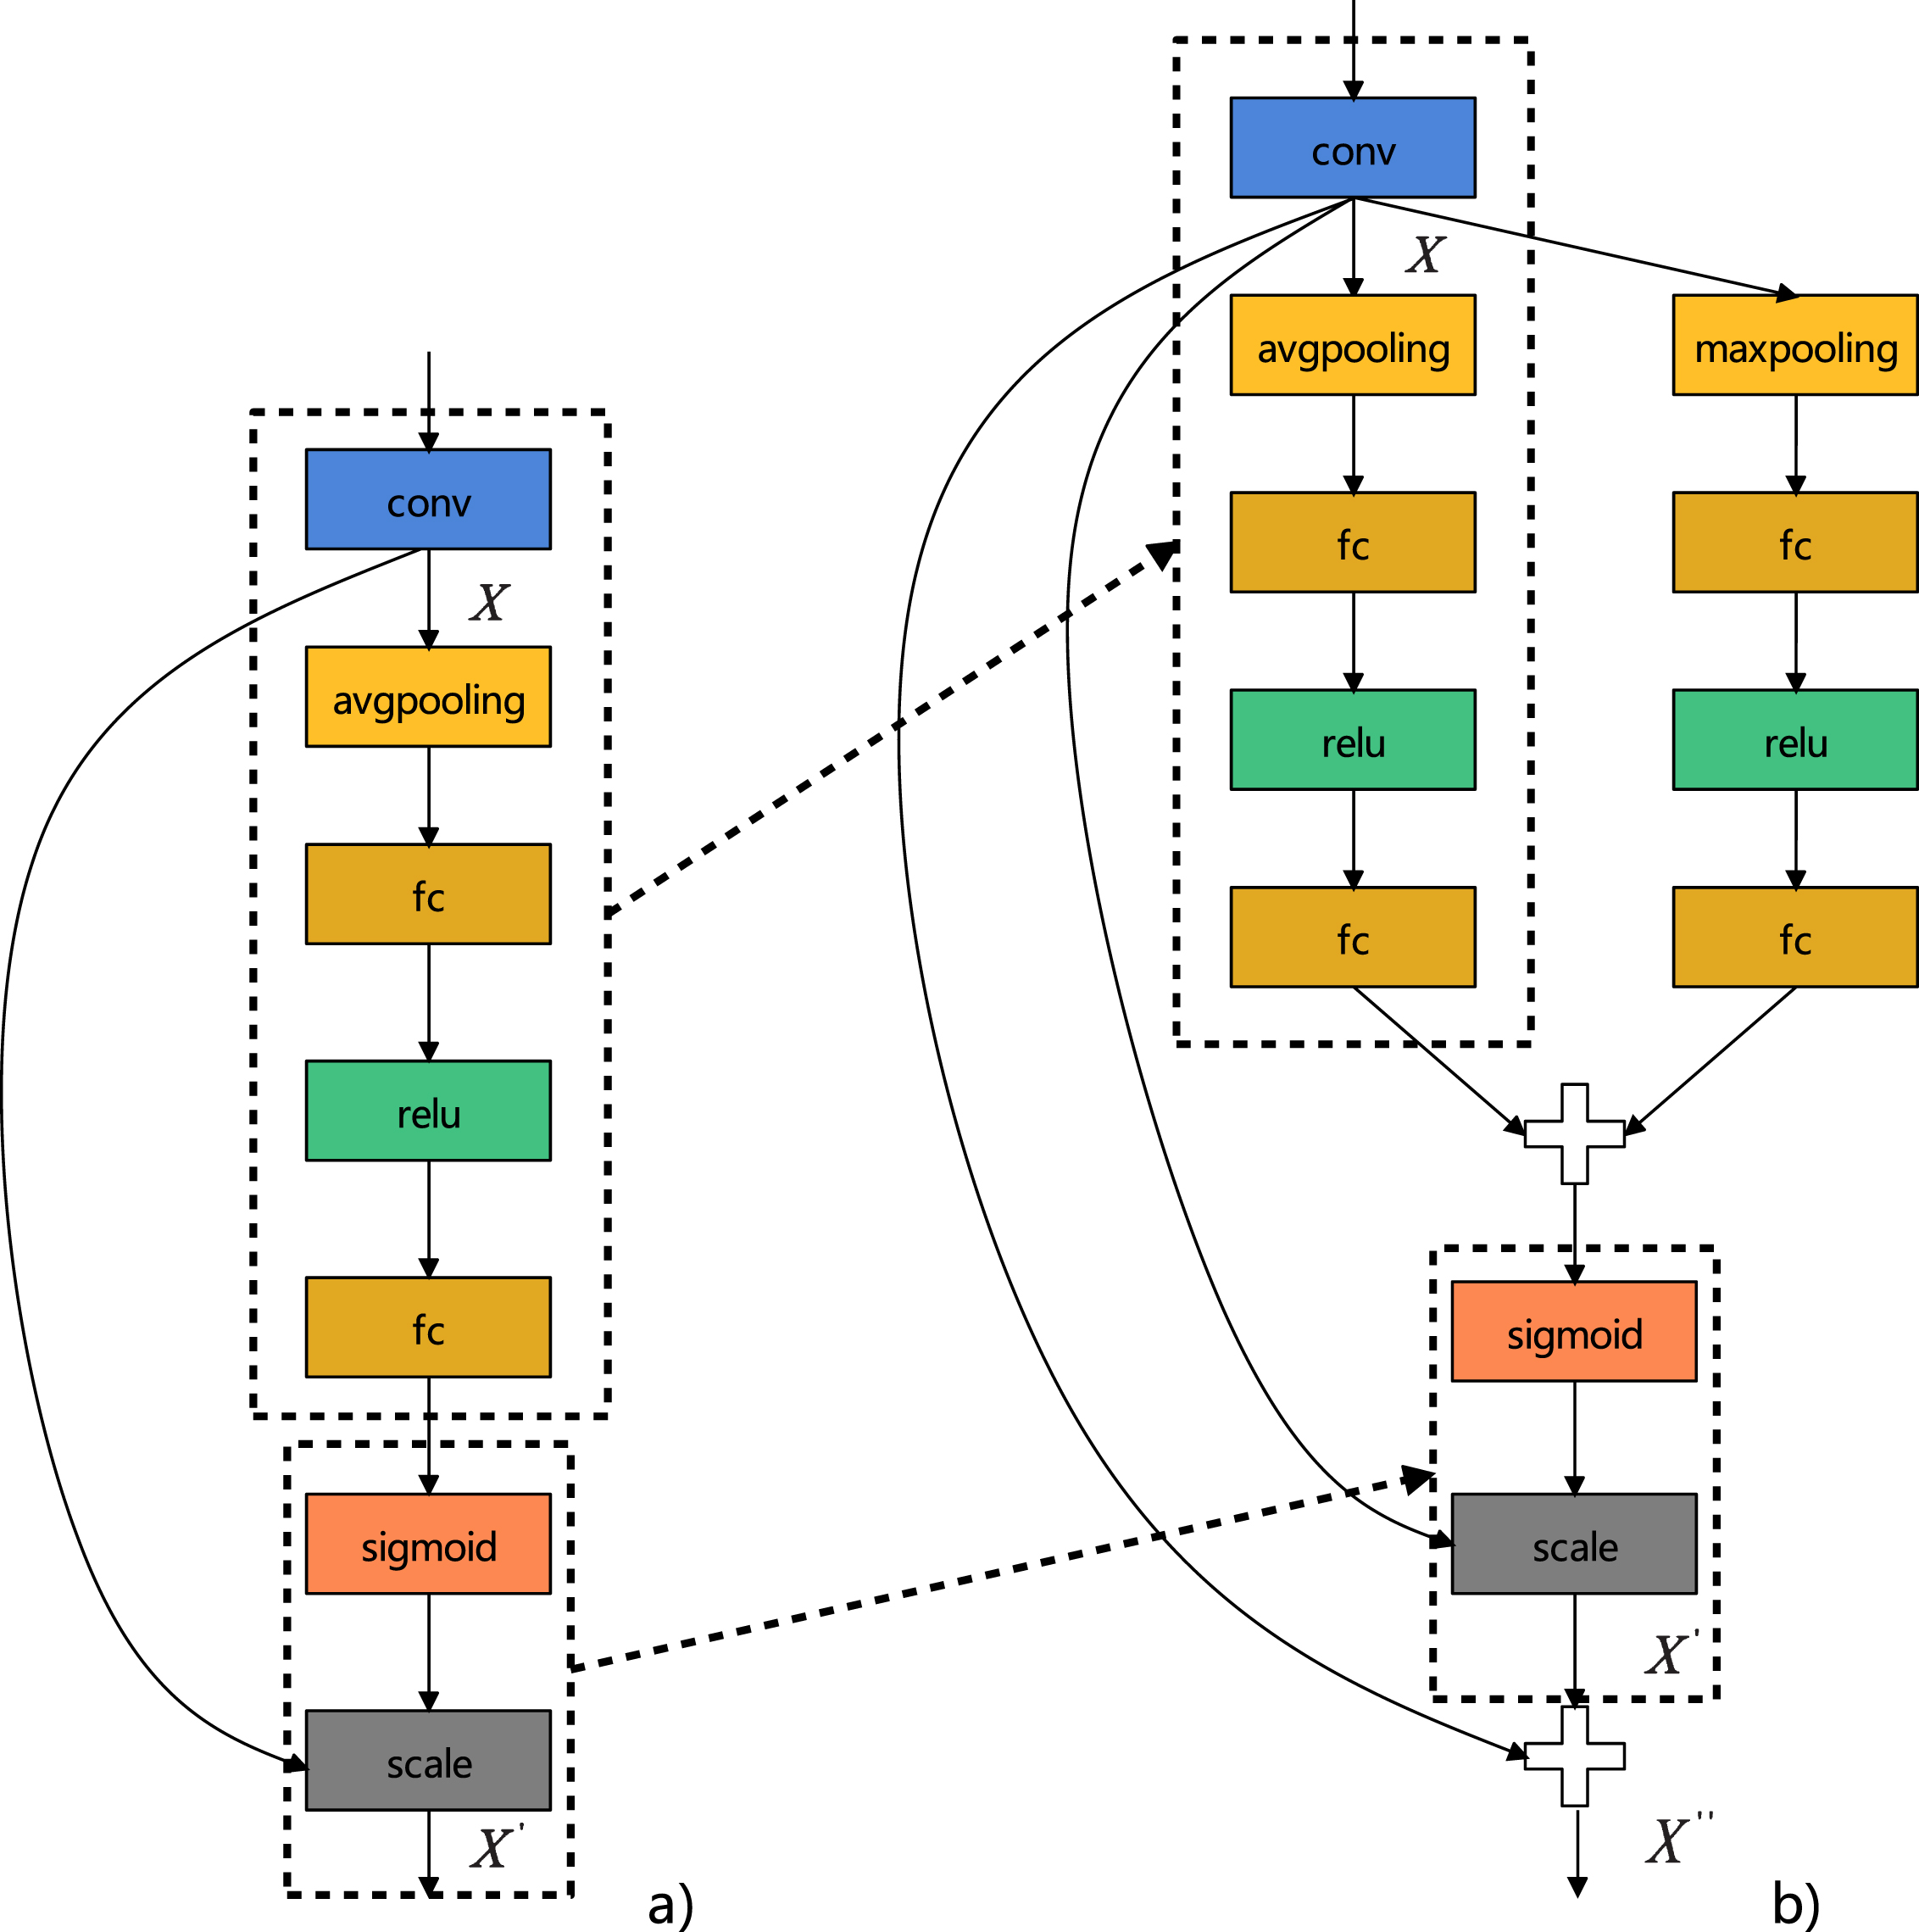
figure 4.a) shows the structure of the SE module, and figure 4.b) shows the structure of our C-SE module. The parts framed by dashed lines represent the same structure.
The loss function of Patch SVDD was used in this study:
Classification using only linear layers may result in gradient disappearance or gradient explosion, which is detrimental to the convergence of the model. Inspired by the residual blocks, this paper replace the convolution layer with the linear layer and remove the maximum pooling layer. As shown in Fig. 5, the classifier consists of several LBR modules and every LBR module is composed of Linear-BatchNormal-ReLU. The BatchNormal layer ensures a relatively stable distribution of input data for each linear layer and the ReLU function reduces the number of parameters.

The ResBlock module and LBR module have been shown.
Anomaly detection in natural images is the key to many tasks in computer vision. Unsupervised anomaly detection requires real and valuable data to train and evaluate new methods. The MVTec [24] anomaly detection dataset contains thousands of high-resolution color images of different objects and texture categories. It contains normal images for training and abnormal images for testing. These anomalies include breaks, scratches, pits, contaminations, and various structural changes. MVTec is a comprehensive industrial anomaly detection dataset. Each class consists of a training set, a testing set, and a ground truth. The training set consists only of normal images. The test set is divided into normal images and abnormal images. The abnormal images are subdivided into several different types of anomalies, such as minor damages and large-scale damages. Ground truth indicates the manually marked abnormal area, which is a binary image. We use the AUROC [25] function as the evaluation index, which represents the area under the ROC(receiver operating characteristic) curve. For the anomaly detection score, we take the standard AUROC as a detection metric. For the anomaly segmentation score, we use the pixel-level AUROC as a segmentation metric. We evaluated our approach on the MVTec anomaly detection dataset to demonstrate the benefits of our approach. In addition, we compare with the other methods.
Anomaly detection and segmentation results
As shown in Table 1, our anomaly detection and segmentation average AUROC scores on the MVTec anomaly detection dataset are respectively 3.0% and 0.7% higher than Patch SVDD. Our method has improved on all classes, with significant improvements in leather class, wood class, and screw class. The experimental results indicate that adding SE modules directly to the Patch SVDD network does not achieve good results but our method has significantly improved performance.
Comparison of anomaly detection and segmentation performance on the MVTec anomaly detection dataset. The anomaly detection and segmentation scores of each category have been given, as well as the average scores(AUROC%) of 15 categories. Different values of the hyperparameter λ affect the score of each class
Comparison of anomaly detection and segmentation performance on the MVTec anomaly detection dataset. The anomaly detection and segmentation scores of each category have been given, as well as the average scores(AUROC%) of 15 categories. Different values of the hyperparameter λ affect the score of each class
We compare our proposed method with other anomaly detection works, including RIAD [26], PatchSVDD [3], PEDENet [27], RegAD [28], DifferNet [29] under the metrics of image-level AUROC and pixel-level AUROC. The encoder-decoder network proposed by the RIAD method has been replaced by ResNet [13] and VIT [12]. The network of Patch SVDD method did not fully extract features. Self-supervised learning did not consider the convergence of loss function. The PEDENet method sets multiple adjustable parameters for the loss function, which means that it takes more time to fine-tune. The RegAD method proposed a universal anomaly detection model that can directly detect new categories. However, RegAD requires multiple categories of images to be trained together. For anomaly detection of a specific category in industrial production, we only need to train the normal images of that category separately. The normalizing flow [30] proposed by the DifferNet method is too complex, and some connecting branches can be removed. We only used a few lightweight C-SE modules to achieve significant performance improvements The detailed comparison results of all categories are shown in Table 2. Our average anomaly detection performance is higher than all the above methods. The anomaly detection score on the all texture classes reached 97.8%.
Comparison of our methods with the others for anomaly detection and segmentation on the MVTec anomaly detection dataset. The results are shown as tuples(AUROC%)
Comparison of our methods with the others for anomaly detection and segmentation on the MVTec anomaly detection dataset. The results are shown as tuples(AUROC%)
As shown in Table 3, adding SE modules to the PatchSVDD network does not have a positive impact. We can observe a significant improvement in anomaly detection and localization performance after adding the C-SE module to the network. On this basis, using LBN modules can further improve performance.
The impact of each module on performance
The impact of each module on performance
The C-SE module can achieve good performance through stacking, but not every layer embeds the C-SE module for the best performance. Based on experience, embedding C-SE modules in deep networks can achieve good results, so we choose to embed C-SE modules sequentially from back to front. Table 4 shows which layers can embed C-SE modules. We abandon embedding C-SE modules in the first two layers of the network because low dimensionality is not conducive to feature calibration after dimensionality reduction. Table 5 validates our scheme. Taking the bottle class as an example, embedding the C-SE module in the last six layers achieved the best performance.
C-SE modules are embedded in some layers
C-SE modules are embedded in some layers
The impact of C-SE modules on performance
Table 6 shows the effect of parameter r on performance. Taking cable class as an example, when r = 16, the anomaly detection score is highest, and when r = 4, the anomaly segmentation score is highest. Overall, when r = 16, the performance of the C-SE module is the best.
The impact of parameter r on performance
The impact of parameter r on performance
They [3] mentioned in the paper that λ will affect different categories’ performance. The anomaly detection performance of the object class is good under small λ, and the anomaly detection performance of the texture class is good under large λ. However, our experimental results show that the size of λ is not closely related to whether the image is an object class or a texture class. We set four values of λ, respectively 0.001, 0.01, 0.1, and 1, and conducted experiments on the influence of different λ values. As shown in Figs. 7, Fig. 6 represents the influence of the hyperparameter λ on anomaly detection performance, and Fig. 7 represents the influence of the hyperparameter λ on anomaly segmentation performance. We can observe that the performance is better when λ is taken as 1 or 0.001. We do experiments for each of the 15 classes at λ=1 and λ=0.001. When λ = 1, capsule class, hazelnut class, pill class, screw class, wood class, and zipper class on performance are best.

The influence of different λ values for the leather class and wood class on anomaly detection performance has been shown.

The influence of different λ values for the leather class and wood class on anomaly segmentation performance has been shown.
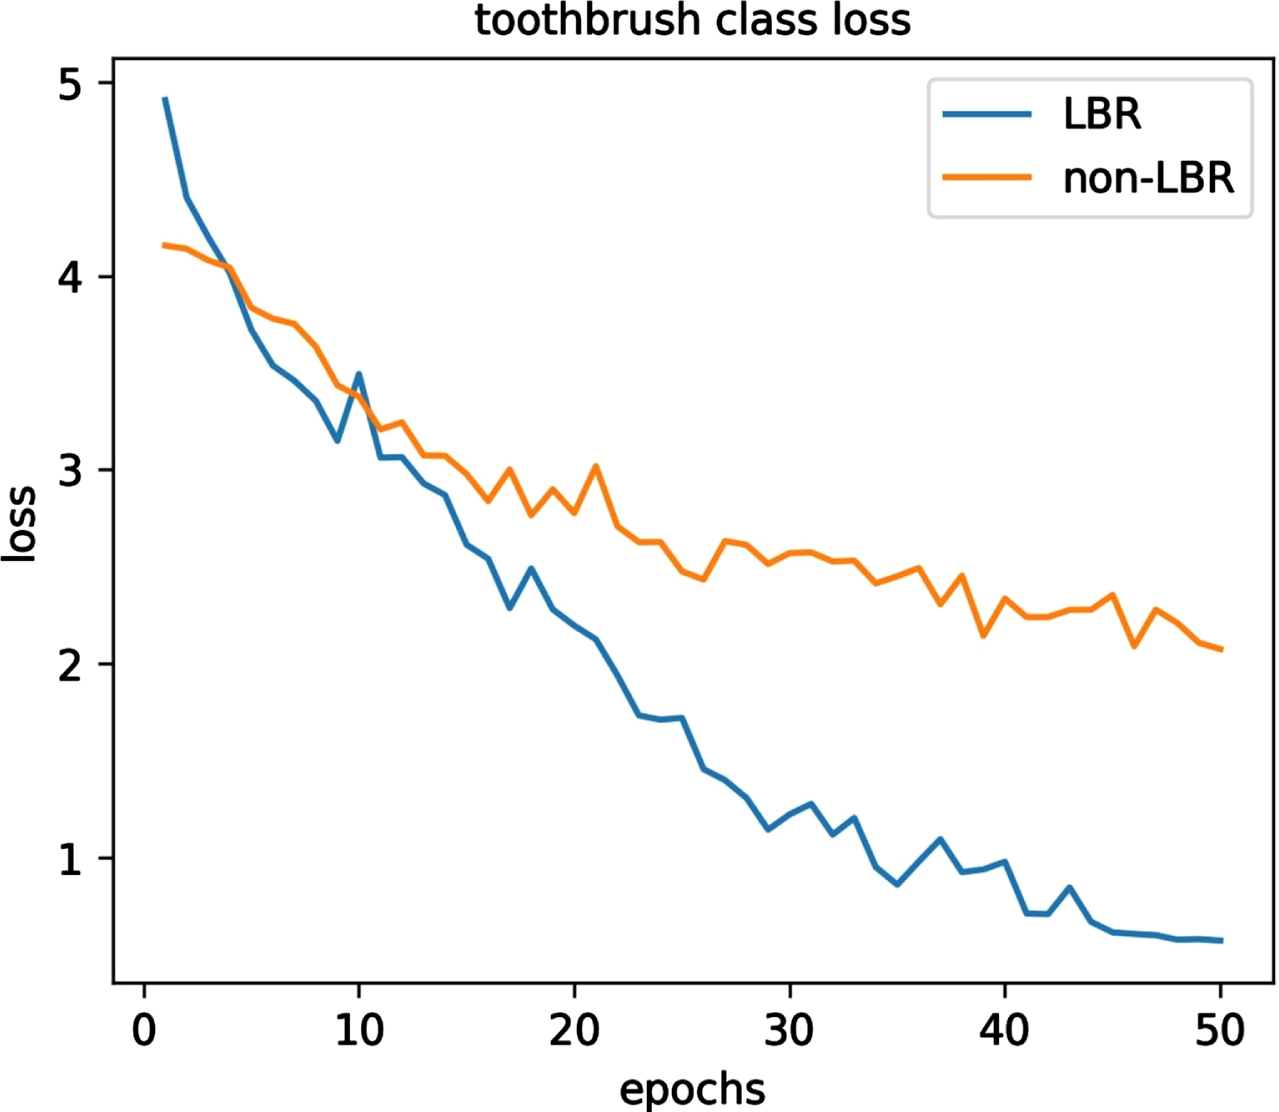
Through ablation experiments, we proved that the LBR module plays a role in the rapid convergence of the loss function. Figure 8 shows the relationship between training epochs and loss. Take the toothbrush class as an example. Although the LBR module has a high initial loss value, the loss function has a fast rate of convergence. Although the initial loss value is low without LBR module, the rate of convergence is too slow. After 50 epochs of training with LBR module, the loss function is stable. On the contrary, without the use of LBR modules, the loss value remains high. We can conclude that the LBR module improves the rate of convergence and training efficiency of the loss function.
The impact of LBR module on loss has been shown.
To prove the authenticity of the experimental results, we give the change chart of ROC during the training process. Figure 9 shows the ROC in anomaly detection. False Positive Rate represents the number of false positive samples detected divided by the number of all true negative samples, while True Positive Rate represents the number of true positive samples detected divided by the number of all true positive samples. The larger the area under the ROC, the better the detection performance. We can observe that the bottom class has the best performance with fewer ladder changes. capsule class has the lowest performance with multiple ladder changes.
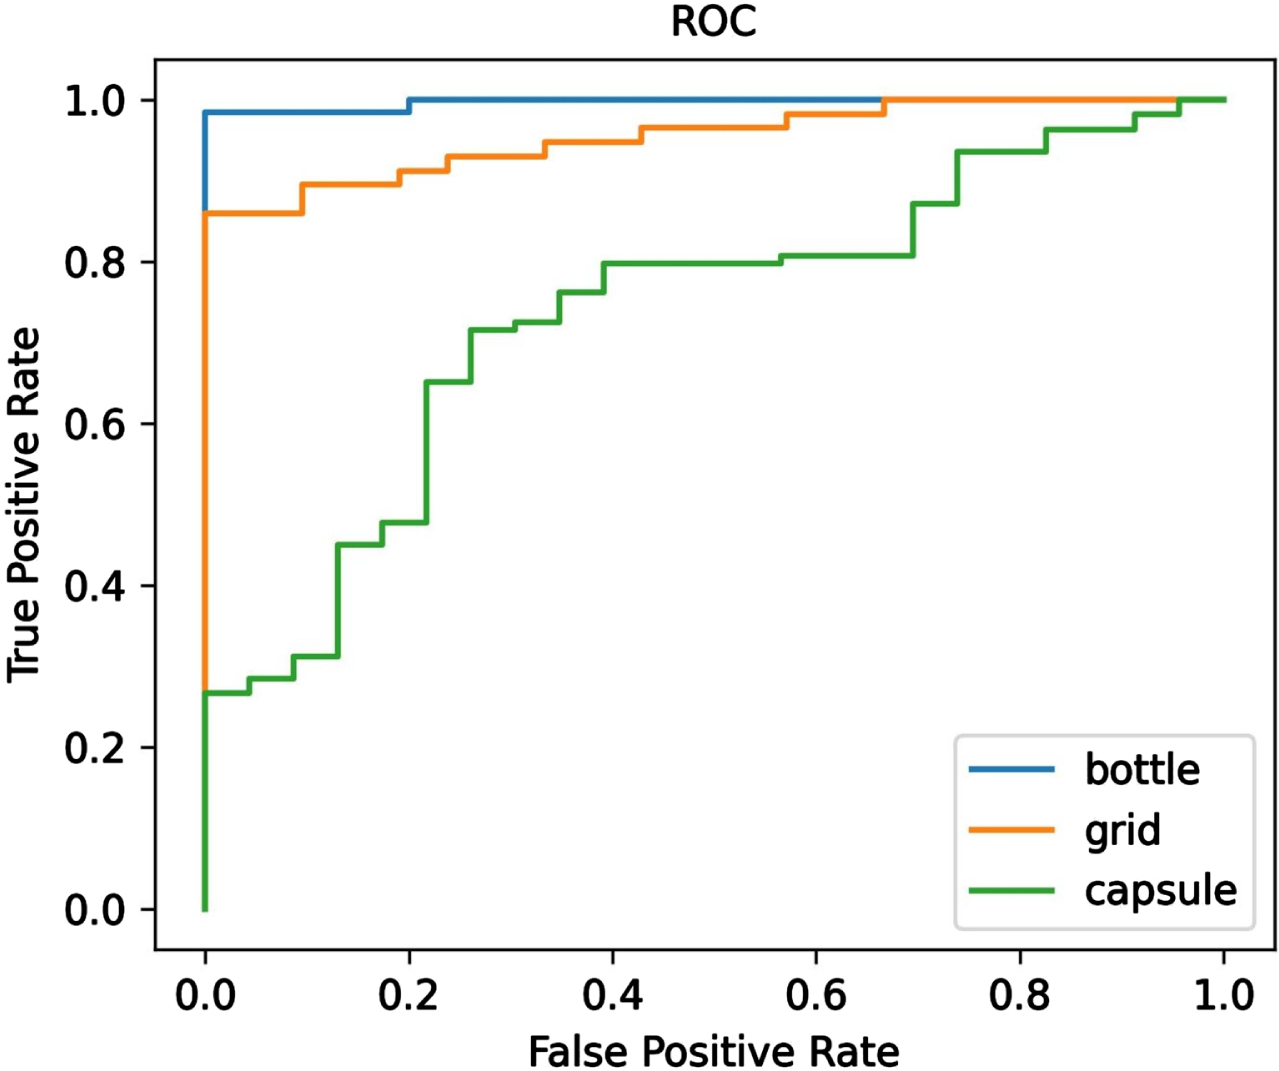
The ROC curves have been shown.
Figure 10 shows the performance comparison between the C-SE module and the SE module. Take the grid class as an example. From the figure, we can see that the ROC curve corresponding to the C-SE module is always above the SE module. C-SE is a lightweight module that can be easily embedded into convolutional layers. Long connection make the C-SE module more stable, and maximum pooling branches make the C-SE module more suitable for anomaly detection.
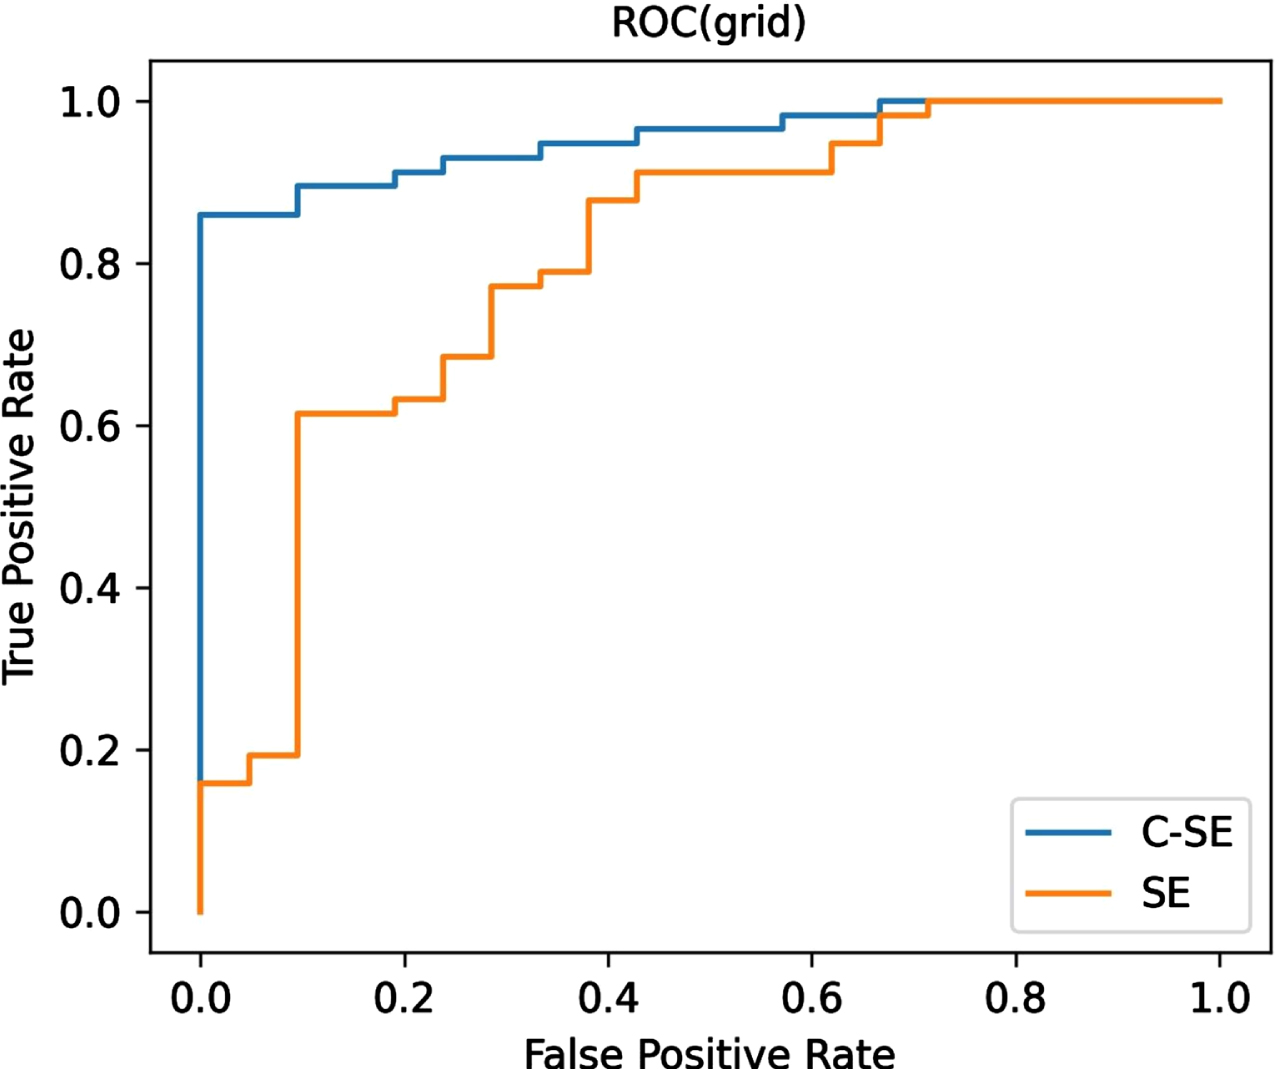
The C-SE and SE ROC curves have been shown.
We verify the robustness of the model by adding Gaussian noise to the training image. Gaussian noise is determined by mean m and variance v. m = 0. Take the toothbrush class as an example. From Table 7, we can observe that when the Gaussian noise is weak, the model performance is high. When the Gaussian noise gradually increases, the performance gradually decreases. It can be concluded that our model can resist slight interference.
The impact of Gaussian noise on performance. v represents variance
The impact of Gaussian noise on performance. v represents variance
Anomaly localization is an important part of the anomaly detection task, which is to identify the abnormal area of the image. Figure 11 shows the anomaly localization effect of the abnormal image. The left side of the image represents the positioning results of the real image, and the abnormal areas are circled in red. The right side represents the thermodynamic diagram. The darker the color, the more anomalous the area.
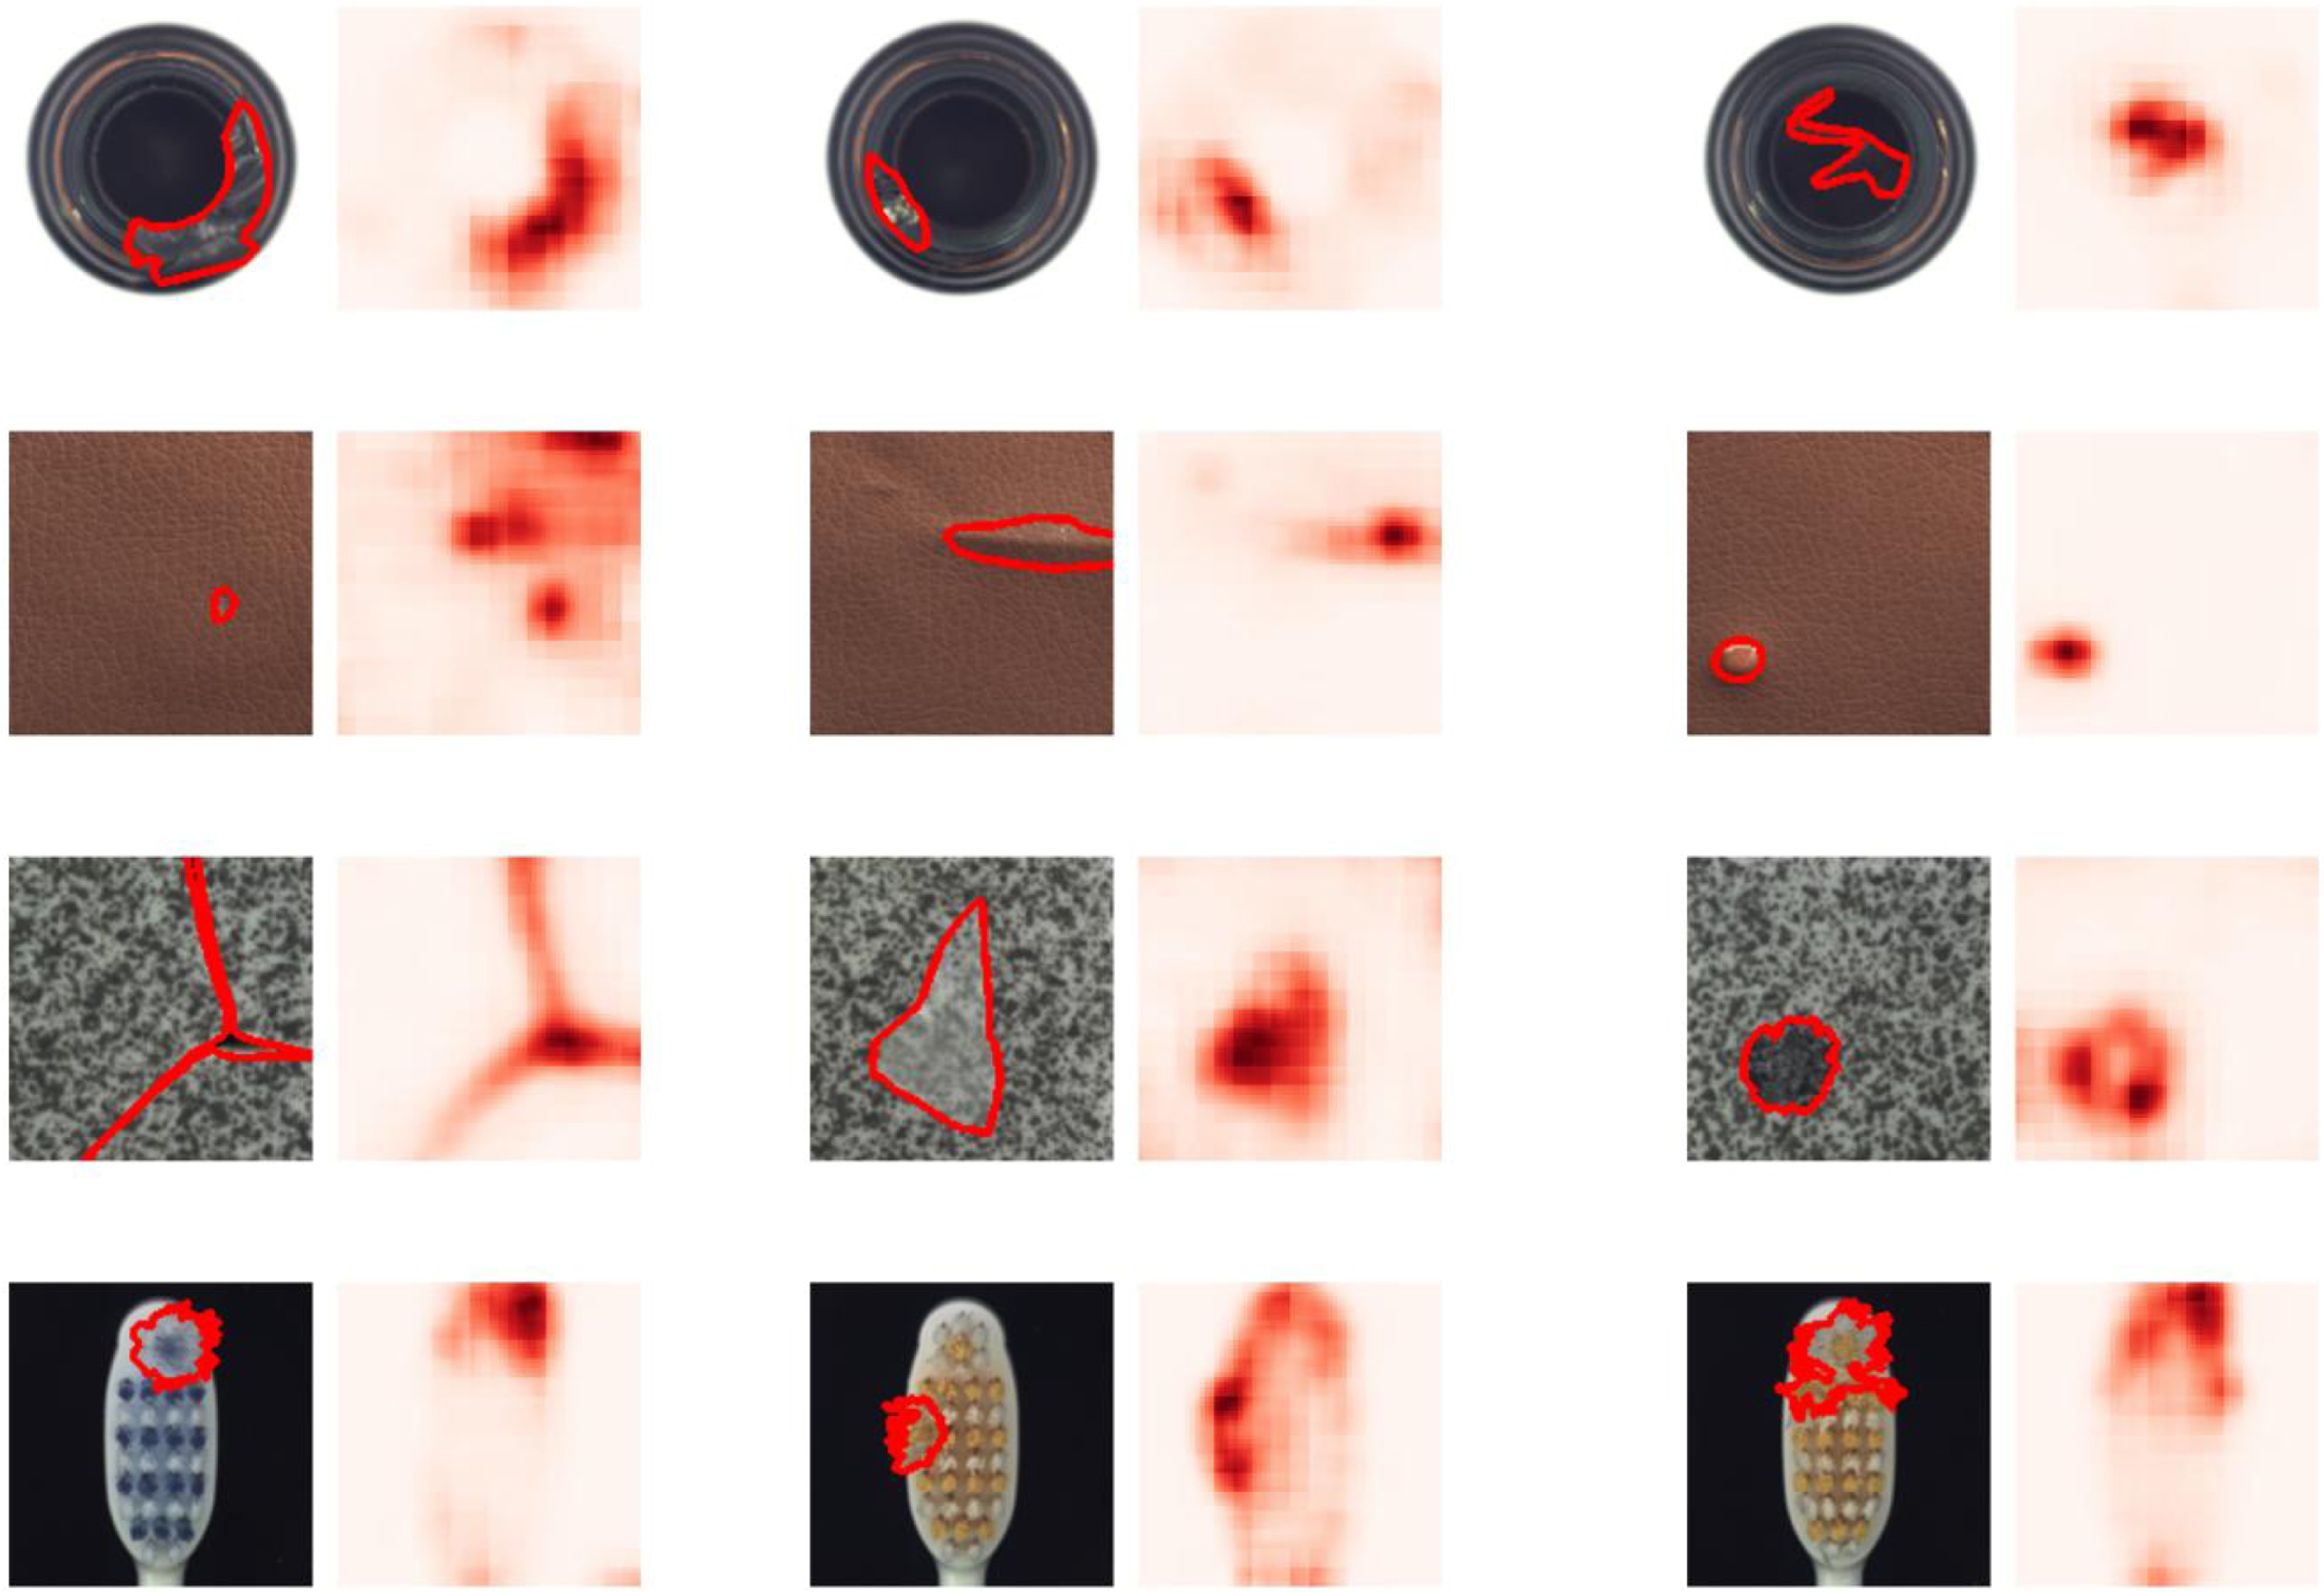
The abnormal positioning rendering has been shown. From top to bottom are bootle class, leather class, tile class, and toothbrush class.
We proposed a lightweight channel attention module suitable for anomaly detection. The C-SE module is very stable and has a significant effect on detecting texture anomalies. C-SE module effectively improves the representation ability of deep convolutional neural networks. This enables small models to achieve good anomaly detection performance. Inspired by ResBlock, we propose an LBR module and improve the ability of classifier. LBR module can make linear layer parameter changes more stable and reduces the amount of computation. The anomaly detection AUROC on the all texture classes reached 97.8%. C-SE is 5.2% higher than SE in detection AUROC on the MVTec anomaly detection dataset. In the future, we hope to design a universal channel attention module that can be directly embedded into other anomaly detection tasks. In this way, we can only focus on the implementation of downstream tasks without considering the feature extraction part. Our model has some shortcomings. The detection ability of model will weaken for images that are heavily perturbed by Gaussian noise. This may require adding low-quality images to the training set to enhance the model’s anti-interference ability. Currently anomaly detection still faces some problems. We can detect anomalies by training images of known categories, but if a new category appears, the model may not be able to detect whether the category image is abnormal. If the model can learn the differences between similar images, even if new categories appear, it can still distinguish whether they are abnormal. Therefore, the universal anomaly detection model has great prospects.