
Abstract
This paper proposed a multi-objective-based Generation Expansion Planning (GEP) for the real-word power generation system of Tamil Nadu, an Indian state. GEP aims to solve numerous conflicting problems for constructing new power plants. The proposed approaches are Multi-Objective Comprehensive Learning Particle Swarm Optimization (MOCLPSO) and Circle Search algorithm. The key objectives of the proposed method is to reduce budget, to maximize reliability and to minimize the pollutant discharge. Therefore, the apt formulations are modeled and solved to establish the conflicting facets of GEP problem. This paper implements MOCLPSO algorithm to solve Multi-Objective GEP (MOGEP) problem for 7-year and 14-year planning horizon. By then, the proposed model is implemented at MATLAB/Simulink platform and the implementation is calculated. The proposed method shows better results in all approaches like Seagull Optimization Algorithm (SOA), Particle Swarm Optimization (PSO) and Cuckoo Search algorithm. The outcomes establish the competence of MOCLPSO and Circle Search Algorithm to offer good-ranged Pareto optimal non-dominated solutions.
Introduction
Power sector is a vibrant aspect for financial development of a nation [1]. The speedy exhaustion of fossil fuels is prompted the power disaster and deepened the environmental anxieties [2]. Therefore, in the past era, the Renewable Energy Sources (RES) such as wind and solar photovoltaic has been got additional attention [3]. Particularly, India accelerated to set up RES [4]. In this perspective, GEP becomes vital for a power sector. Generally, GEP intends to reduce the overall cost of the power plants to be erected. The outcomes of GEP problem describe the type and volume of the units by satisfying the demand and the reliability restraint [5]. Therefore, GEP was investigated using PSO algorithm [6], the honey bee algorithm [7], the Genetic Algorithm (GA) [7], Integer Programming (IP) [8], Linear Programming (LP) [8], Taboo Search (TS) [9] and Ant Colony (AC) and Dynamic Programming (DP) [10]. Besides dissimilar goals for instance revenue augmentation, reliability enhancement, budget reduction, and pollutant reduction [11] were attained. Also, the grid safety and investment prices [12–15] were deliberated as restraints while solving GEP problem. Game theory is applied to examine the impact of investment cost competitiveness and transmission line on GEP. Without taking into account the uncertainty element, a fixed model of the work is used. Because it may employ the bidding procedure, game theory is an excellent model for resolving the problem. This objective function is resolved using bi-level optimization method, and multi-period framework can be applied to a static GEP.
Because of the aggregating anxiety on ecology, policy goals and reliability, the GEP prompted to encompass multi-goals [16]. A comprehensive study was done with 14 dissimilar goals [17]. A MOGEP study was performed for a standard IEEE test system by minimalizing budget and pollutant discharge [18]. Additionally, MOGEP problem with the consideration of coal importations and energy cost threat was solved [19]. From a comprehensive survey, it is acknowledged that abundant MOGEP studies were done by minimalizing total price. GEP problem is extended over a designed period with the future demands obtain from RA method [20]. A problem in a generation is a fault in the network the S/S device, resulting in a partial power shortfall owing to a power outage halfway through. Transmission line breakdown and partial power shortage, lightning in the transmission line/electrical storm, unfinished electricity due to power shortage, transmission line/rainstorm, and total system dissatisfaction. The major prominent one is partial power shortfall owing to a generation issue. The following framework is assumed by the Multi-Objective Linear Problem (MOLP) ideal: 3 linear objective functions (size of non-hydro RES, overall expansion, and cost energy safety); the four choice variables for the three types of limitations sub-period reflects the power to be established in the methodologies under consideration (wind, hydro, biomass and solar). Multi-objective optimization problems (MOPs) are widely presence in some field like medicine, management, industry, economy and so on. To find an optimal solution is challenging at that time allowing each objective to be optimal.
The stricture of the manuscript is mentioned below: Section 2 describes recent researches and their background. Section 3, Tamilnadu utility power system is clarifies structure of MOGEP. Description of MOLPSO and Proposed CSA based GEP for utility is discussed on Section 4. Section 5 clarifies discussion and results. Sections 6 conclude the paper.
Review on recent researches
Many researches were done based on the power system performance improvement and multi-objective expansion planning using various methods and features. Some of them were reviewed here,
An optimization tool that depends on financial and reliability objectives has been developed [21]. A multi-period structure and multi-objective function are used with game theory to attain this purpose. The reliability limit function was the objective function, whilst the economic objective was a model to identify the price reduction. As a result, the two functions cannot be integrated, and the problem must be solved using a bi-level optimization method. It employs hybrid strategy probability values to get the best answer. A hybrid strategy’s values were determined using a linear quadratic programme based on the quasi-Newton approach. In [22], an investigation has been done to evaluate a competent, profitable MOGEP. The cost, fuel consumption, risk of energy rate, gas emission, and reliability of the producing units were all factors examined in this MOGEP. By way of those plants touch the end of their useful life, the withdrawal of prevailing power plants was factored into the predicted model. To tackle the estimated power growth and withdrawal scheduling paradigm, a Chaotic Grasshopper Optimization Algorithm (CGOA) was suggested. A € -constraint fed multi-objective technique according with mixed integer linear programming (MILP) while accounting for network loss has been introduced [23]. After linearizing and incorporating the operational network loss into the model, the operational loss cost was calculated. The supply price curve used to represent the cost of production, and the energy price of every load level was attained using linear model. Pareto optimum front was designed using the€ -constraint technique, which presents the decision maker with numerous alternatives that demonstrate the link between conflicting objectives. The optimal compromise option was then obtained using a Fuzzy satisfactory approach.
MOGEP model that incorporates a large proportion of RES has been developed [24]. The model takes into account 3 objective functions (maximizing generation at peak load, reducing the overall price, and increasing the role of non-hydro RES). Ultimate demand and non-hydro RES generating objectives cause greater solar power generation. A multi-objective optimization structure that combines tractability selection of potential plan into long-span GEP has been created in an efficient and accurate manner [25]. Together with traditional economic and environmental goals, operational flexibility was viewed as a separate goal. An investigation was done to establish the capacity of the projected methodology to deliver significant insights by correlating tractability, overall price, and CO2 discharge. Flexibility of a high level evaluation was provided in GEP to steady overall demand with varying unpredictability. Lastly, a decision-making approach to select the optimal plan amid the several results alternatives supplied by the MOO structure was suggested. A unique approach for archive management and gbest selection based on adaptive angle segmentation is developed [26]. The targeted space angular region was adaptively altered and divided uniformly based on the amount of elements in the present collection. The particle with the highest international ranking was chosen from the particle distribution’s less-solidity angle province: Simultaneously, unnecessary particles were eliminated from the more-solidity angle province. As a result, gbest selection and exterior collection set update were synchronized, which included best result set generation and exterior collection set maintenance. As the ideal solution set consistency was improved, consolidation and diversity were ensured. As the coverage spread efficiency was improved the population variety was maintained in these two methods. As peer algorithms, 4 advanced evolution MOO (EMOO) processes and 2 old EMOO processes were chosen to test the MOPSO based on adaptive angle division algorithm. The MOPSO was modeled for determining the best design for each subsystem [27]. The optimization goals were to reduce carbon dioxide emissions (RCDE) while minimizing the simple payback period (PBP). Finally, after optimization, the energy performance of the selected building sites and kinds was examined. Most recently, a risk-informed tactic for GEP and Transmission Expansion Planning (TEP) was established. It incorporated cost-based GEP and risk-based TEP. Interconnecting these 2 models to do synchronized GEP and TEP resulted in outcomes that were profitable, reason for the risk insinuations of the general vicissitudes, and ensure system safety [28]. A novel optimization for long-span GEP has been proposed [29]. The model optimized both asset choices and hourly working choices. It optimized both the chief and reserve power plants capacity to enhance the reliability.
Motivation for the research work
The recent research work reveals the optimization of the planning which is high cost, reliability is low, lack of power, and the energy crisis are occur. Distribution expansion planning (DEP) is a MINLP problem with numerous decisions to evaluate because of the nonlinearity. Limited operational flexibility and longer timescales are becoming more common. Each stage of fossil fuel operations, such as power plants, including electricity generation and greenhouse gas emission costs, distribution, and end-user training, has an impact on environmental pollution. This scientific work is motivated by inspiration. This paper works the efficacious variant of MOPSO viz. MOCLPSO to solve MOGEP problem by considering 3 dissimilar objectives such as lessening of the total price, reduction of carbon discharge and maximization of the reliability. The uniqueness of this study is to deliberate the recuperation of elder units.
Configuration of MOGEP
This section defines multi-objective GEP, which should take into account the combination of RES and energy storage technologies (EST).
A power station can provide its descending utility with carriers by its power network. The mechanism consists of Power station, utility [30]. The power plants consist of solar, wind, coal, hydro, nuclear, biogas, oil, gas. The proposed technology, power grid with others through can be transacting electricity. The proposed method goal is to minimize total cost, pollution emissions, and increase reliability. Figure 1 depicts the Structure of MOGEP problem.

Structure of MOGEP problem.
GEP should reflect RES and Energy Storage Technologies (EST) alongside existing plants to conquer issues like hesitations in predicting investment constraints for power generation [31], source types and obtainability for producing units, environmental policy depends on emission restrictions. The anticipated loads till 2034 are taken from [32].
Minimization of Cost
Minimization of total price is succeeded by resolving Equation (1).
Here,
The minimization of pollutant emission has been achieved by the solving Equation (8).
The enlargement of the reliability is succeeded by reducing the outage cost as follows.
where,
O ( X t )cost if outage in practice and the new units,
OC outage cost, $/ MWhrs
s′ the random habits identify that maintenance cost is estimated at every year midpoint:
OC is assessed from the Expected Energy Not Served (EENS). The function of equal energy method is used to assess the EENS and Loss Of Load Probability (LOLP).
The following constraints must be met by the minimum cost goal function.
Building Range
Let Ut imply the units to be erected at phase tthat must satisfy
Here Umax, t refers maximum unit size at phase t.
The units must satisfy the maximum and minimum reserve limits.
Here,
Rminis the minimal reserve limit, Rmax represents maximal reserve limit; D t shows demand at stage t (MW); Xt,i denotes collective size of plant i at stage t
The new and old plants should satisfy the FMR.
Here,
The new and old plants should satisfy the LOLP constraint.
Here “ɛ” is the maximum tolerable LOLP. The requirement for a divide demand constraint is ignored by the lowest reserve margin constraint.
The pollution discharge restraints
ec j implies emission coefficient, λ implies total emissions minimization [35].
The detailed study on MOCLPSO and its implementation on MOGEP problem has been performed by the authors [36]. Moreover the fuzzy based methodology has been used to find out the Best Compromise Solution (BCS).
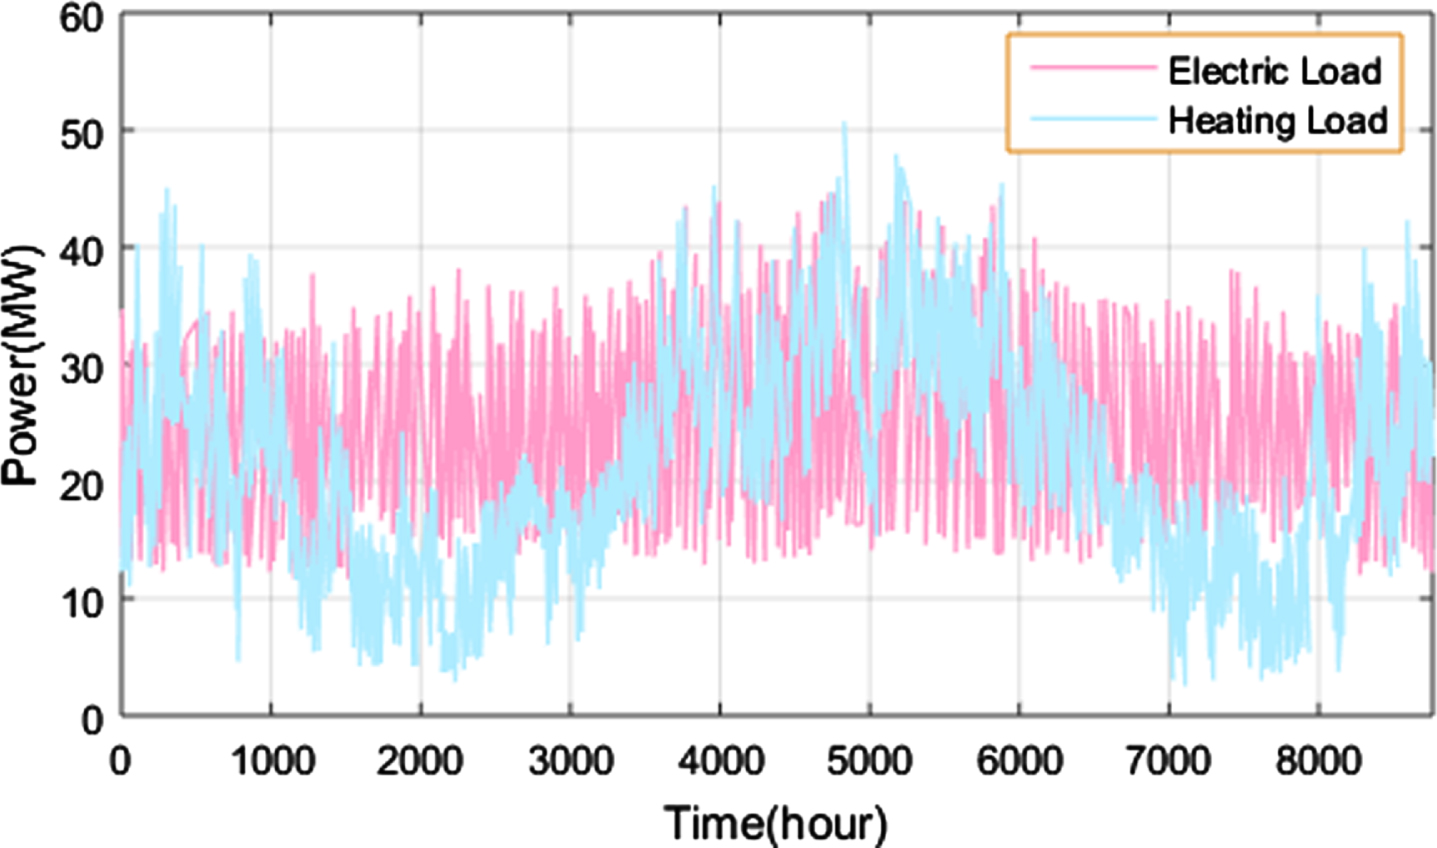
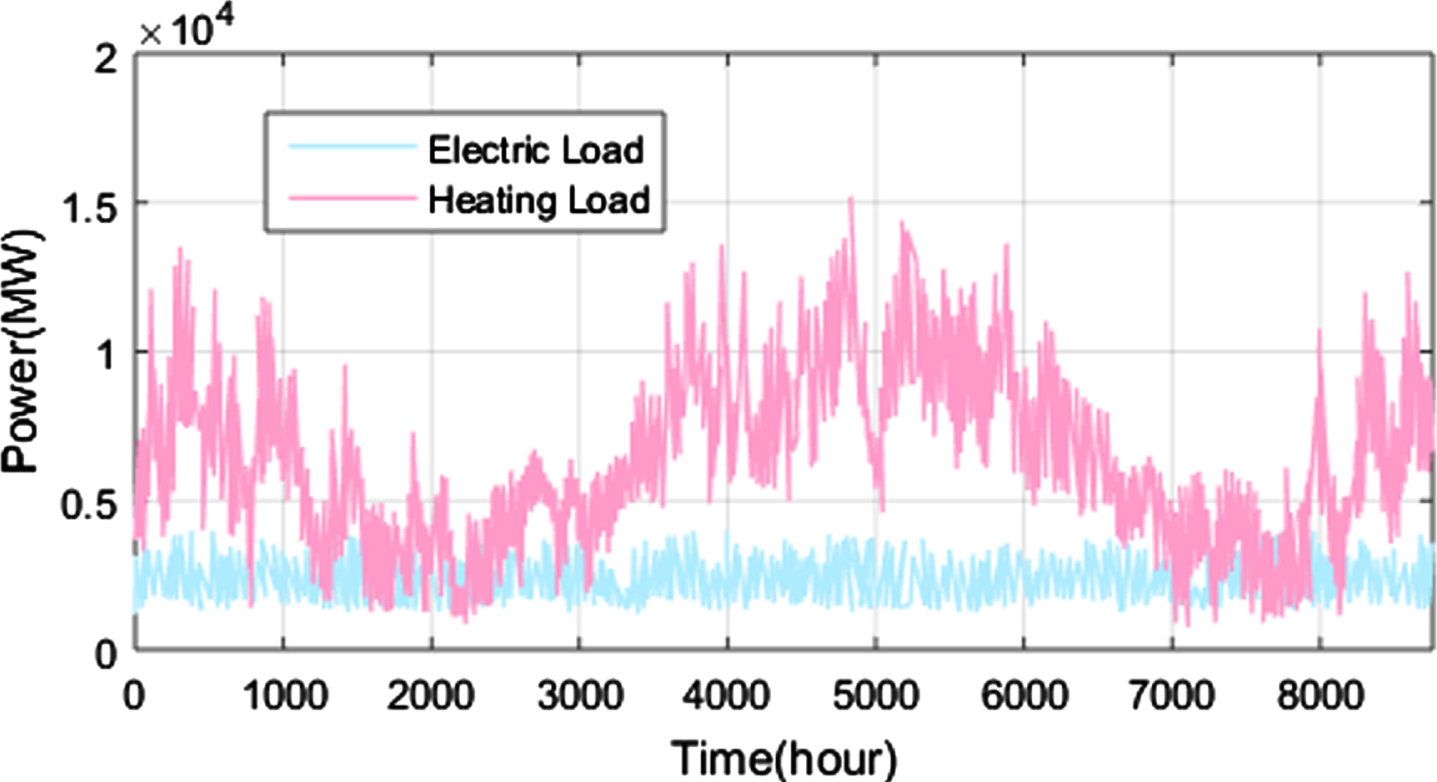
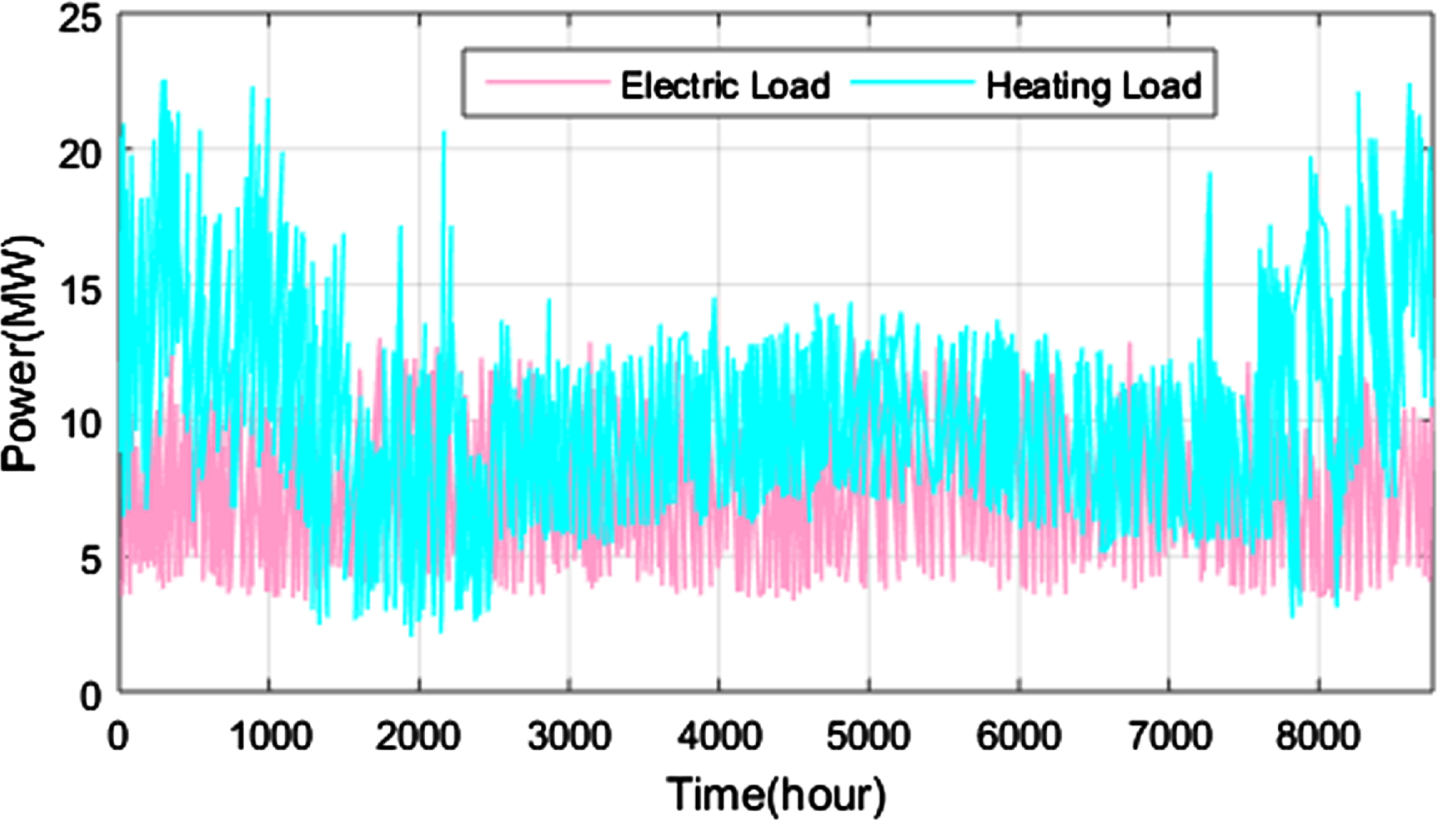
Analysis of hourly thermal and electric load of 9-bus system.
The surrounding systems are growing at the time the human life becoming more intelligent that results in greater complexity and cost. Optimization algorithms are significant at reduction of total price, reduction of carbon discharge, and augmentation of reliability. The transient performance of the CSA approach is improved by reduction of cost and pollutant emission. The complete clarification of the CSA approach is designated in below sections.
Circle Search Algorithm
Circle search algorithm is a brand-new met heuristic optimization technique that is motivated by circles’ geometrical characteristics (CSA). The most famous geometric object is the circle, which has many structures including a diameter, a center, a perimeter, and tangent lines. The behavior of the CSA in terms of exploration and exploitation is significantly influenced by this aspect. Accordingly, a viable option for solving complex problems have developed in met heuristic algorithms. CSA is applying to solve high-dimensional functions.
Step 1: Initialization
Initiate the input parameters, the input parameters are demand, voltage and current of source, and constraints. The search agents are then set up to operate between the top and lower limits of the search space according to Equation (15):
Here R refers random vector between [0, 1].
Step 2: Random Generation
Next to initiation, the input strictures are generated arbitrarily
Here, Iis the random generation and, zrepresent the gain parameter k p , k i
Step 3: Fitness Function
The initialized parameters is based on current best position are resolute. Calculate the fitness value for every individual
Step 5: Exploration and Exploitation:
Exploration: iter > (C . max iter): it refers that angle θ = ω × Rand every time may be used to recover the inspections method of CSA and escape local inertia.
Exploitation: iter < (C . max iter)it refers that angle θ = ω × p every time may be utilized to increase the inspections method of CSA.
Step 6: Termination Criteria:
Check the termination criteria, if it met the condition means optimal solution is obtained, otherwise repeat the process. Flowchart of CSA approach is shows in Fig. 2.
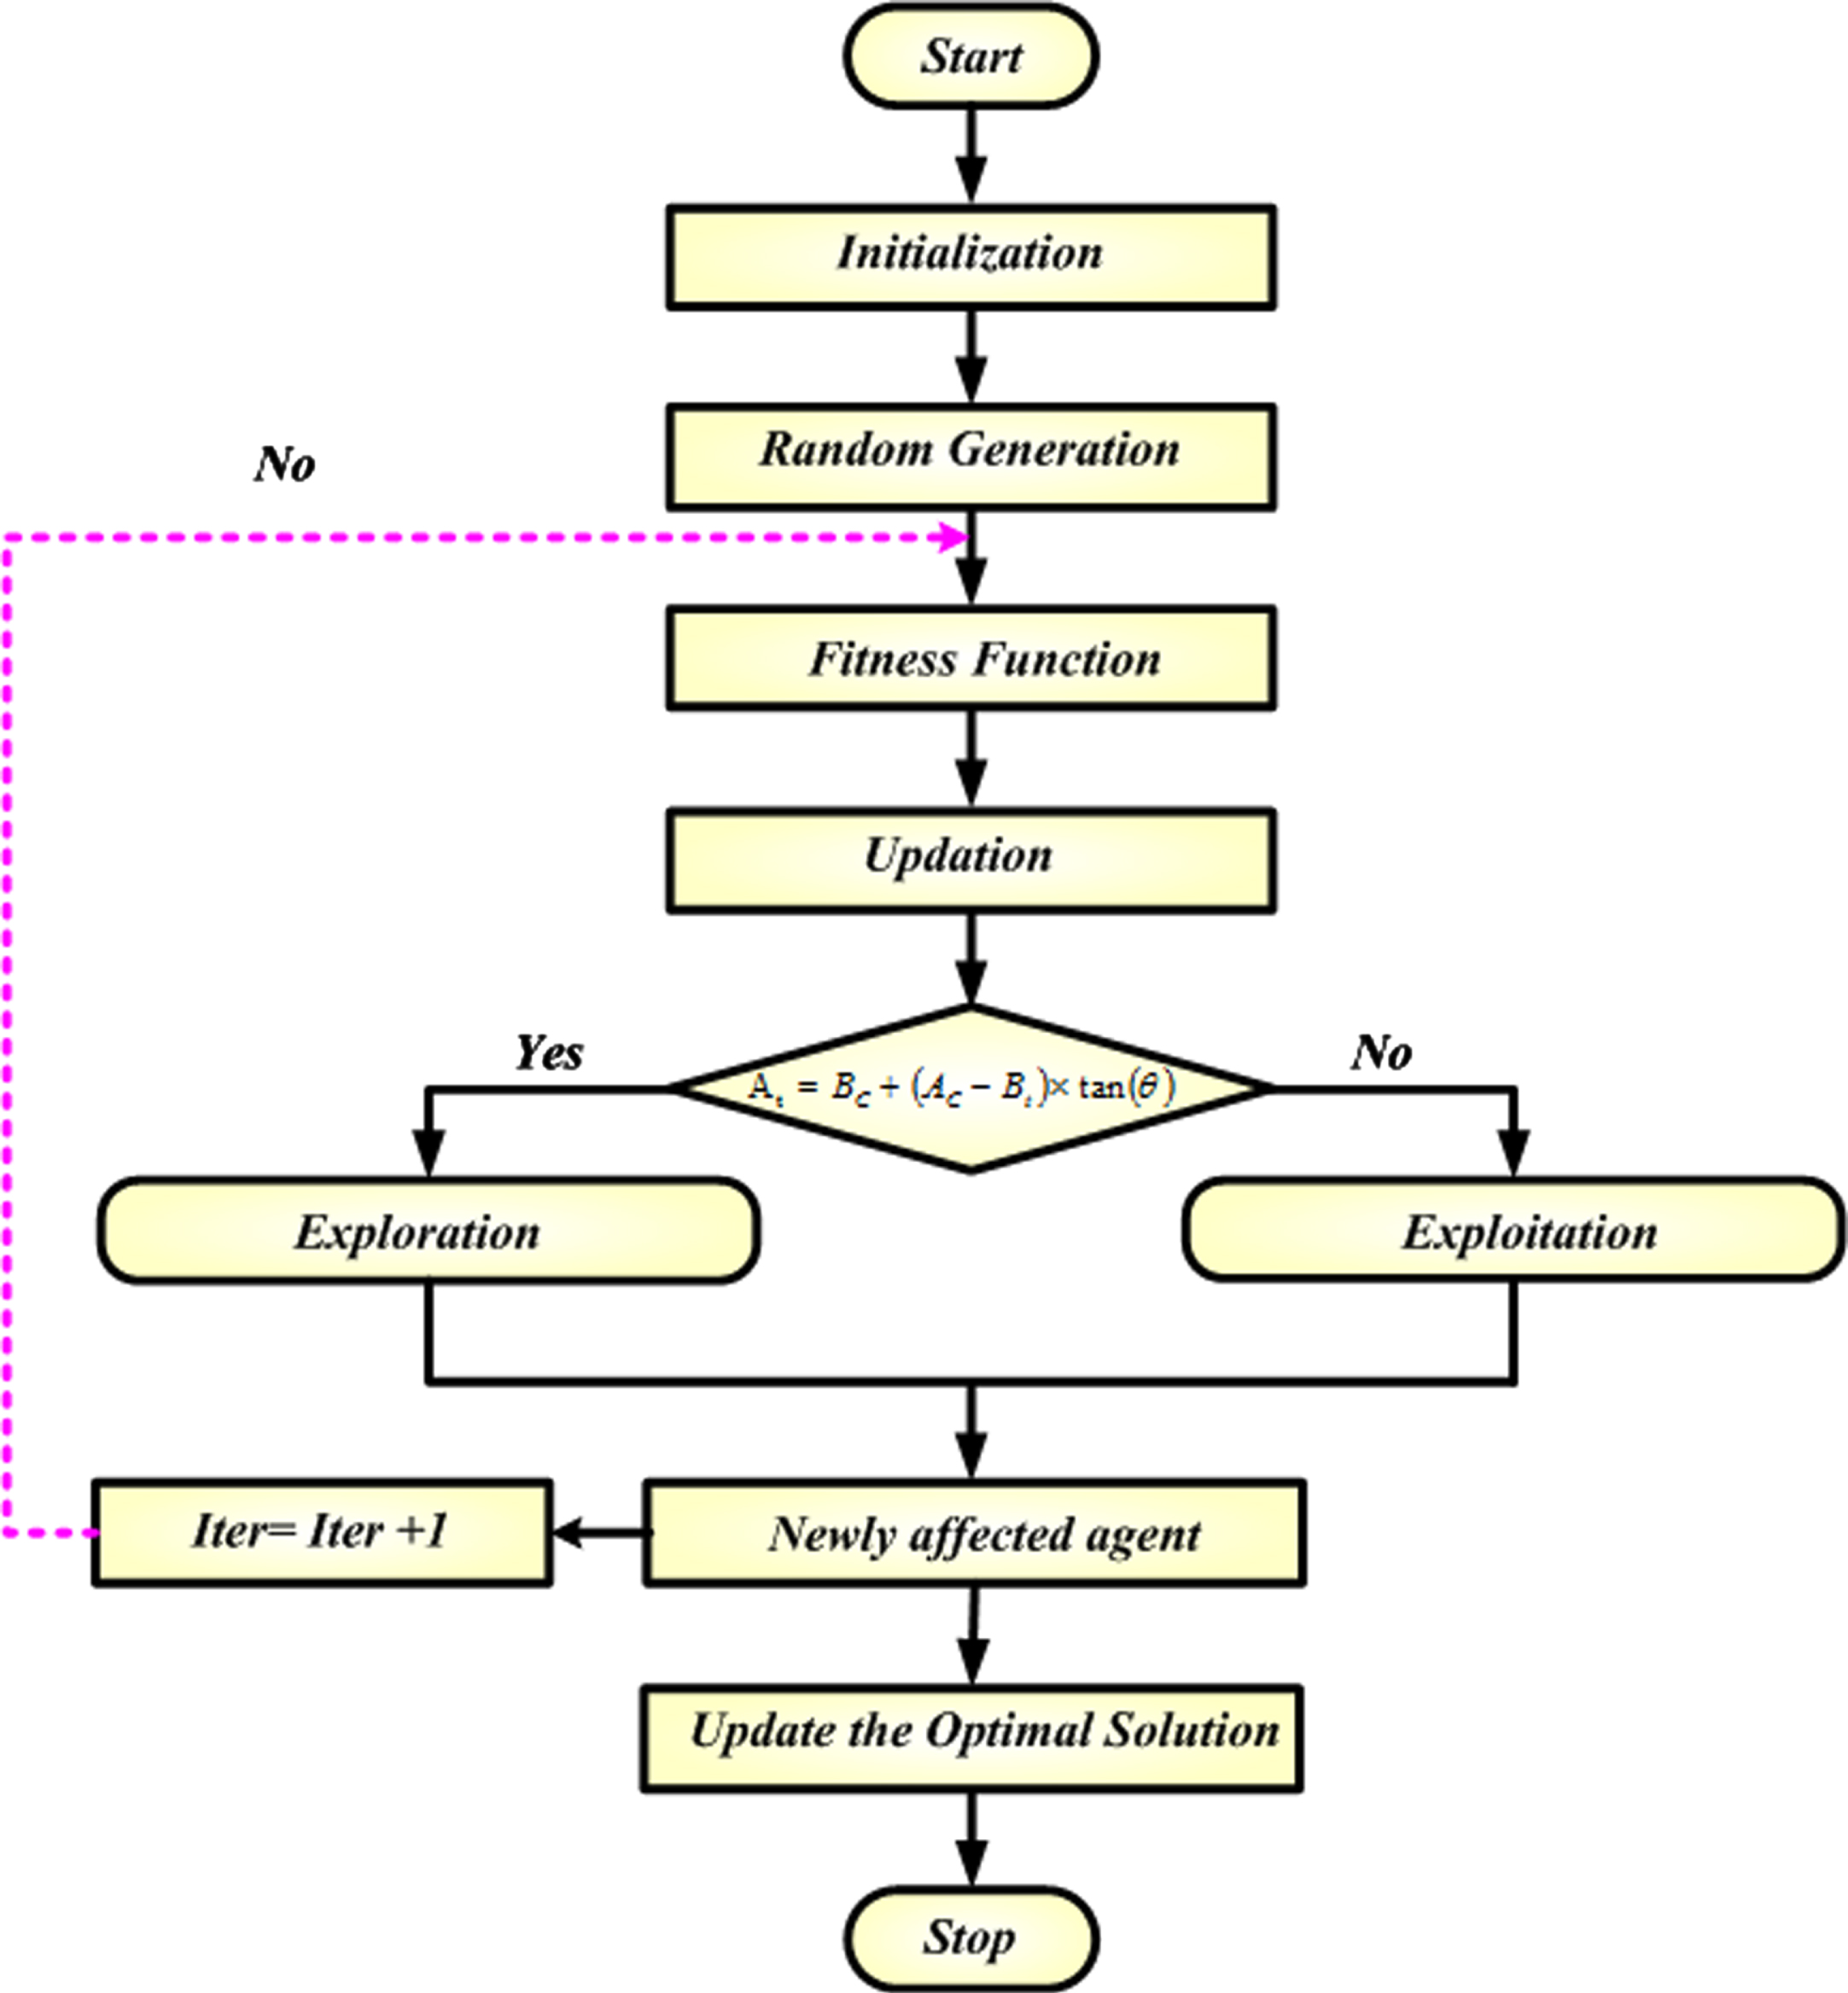
Flowchart of CSA.
This chapter outline the enactment of the projected aproach based based on the simulation outcome. Cost reduction, pollutant emission reduction, maximization of reliability are the objectives of the proposed system. CSA is executed using MATLAB platform and the results are compared with existing approach.
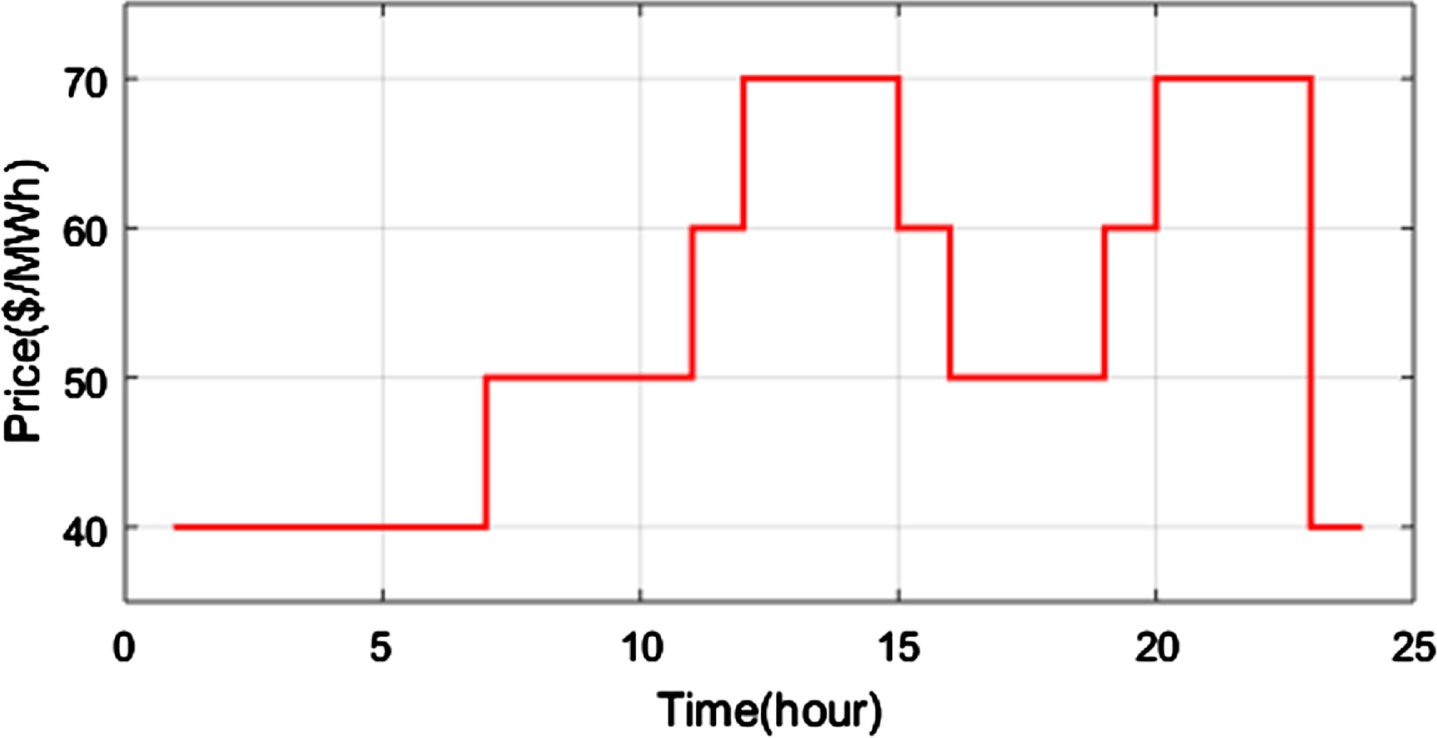
The cost is reduced by the introduced CSA, which is utilized to estimate the proposed algorithm solutions. DCNEP (Distributed Cogeneration and Network Expansion Planning) decreased the entire expenses for 9-bus, 33-bus, as well as 123-bus systems. Figure 3 depicts the analysis and forecasting of electric and heating peak demand for 9-bus test system. The analysis of first to fifth year load is steadily increased in every bus test system. The highest power is occur at 8.5 MW in the second bus system. The lowest power is occur at 4 MW in the fourth bus system. The analysis of yearly and hourly energy consumptions is done. The power transaction is chosen from 0.1 MW step for 9-bus test system. Figure 9 depicts an analysis of the hourly thermal and electric demand of 9-bus system during the planning horizon for wind turbine and solar panel. The highest power of the heating load is 50 MW, which is occurring at 4850th hour. The lowest power of the heating load is 5 MW, which is occurring at 7100 hour. The Electric load is performed at in between of the heating load. Figure 5 depicts the hourly electricity market price of 9-bus system during the planning horizon. Highest price is $70, which is occur at different times, they are 12th, 13th, 14th, 20th, 21st, 22nd hours. The lowest price is $40, which is occur at different times, they are 1st, 2nd, 3rd, 4th, 5th, 6th, 23rd, and 24th hours. The layered analysis of the optimal heating and electric of the 9-bus system is shown in Fig. 5 (a) and (b). The boilers supply majority of the heating load, and the Combined Heating and Power (CHP) are committed at full load. Figure 6 (a) shows the boilers are occurring at first, and then CHP1 to CHP4 are occurred. The CHP4 is entering the power of 50 W, which is occurring at the 4800hour.That is the highest peak. Figure 6 (b) shows the CHP1 to CHP4. The CHP1 is starts the power at 0 W and ends at 2 W. The CHP2 is starts its power at 2 W and ends at 4 W. The CHP3 is starts its power at 4 W and ends at &W. The CHP4 is starts its power at 7 W and ends at 10 W. The time is low at CHP4. The time is high at CHP1. Figure 7 depicts an analysis of the weighted column of projected PVAs and SWTs generation of power for 9-bus system’s ultimate planned horizon. The greater value of PVAs generation of electricity is 5.96 MW. The greater value of SWTs generation of electricity is 50 kW. Figure 7 (a) shows the analysis of power and time. The highest peak is occurring at 6 MW in the power, which is in between the hours of 3400 to 3500. The lowest peak is occurring at 4.2 W, which is 3380 hour. Figure 7 (b) shows the lowest peak is occur at 0.025 MW, which is 3180 hour. The highest peak is occurring at 0.05 MW. Figure 8 depicts an analysis of the evaluated values of per unit DLC, DERs generation of electricity as upper network of 9-bus system’s ultimate planning horizon. DLC has a higher value of 0.286 PU. Figure 9 depicts an analysis of the projected heating for varied DHN of 9-bus system and ultimate planning horizon. The greatest value is 0.52 MW, which occurs at 3–5 buses. Figure 10 depicts an analysis of hourly thermal and electric load of 33-bus system during the planning horizon. The heating load has a maximum value of 1.5 MW. At 0.1mW, the minimum value occurs. Figure 11 depicts an analysis of the base electricity price of the 33-bus test system. The 33-bus system has a dissimilar pattern of electric and thermal load based on electrical and thermal loads of 9-bus system, and 33-bus system heating load is greater to their electric load. The peak price occurs between the 13th and 15th hours and the 20th and 23rd hours. Figure 12 depicts a stacked column of anticipated best heating dispatch of 33-bus system’s ultimate planning horizon. The 330 kW CHP is fully committed, and the load was tracked by the other CHPs. CHPs are completely loaded when they are turned on. CHP250B is operating at a higher power value of 11 MW. Stacked column analysis of estimated SWT and PVA for the 33-bus system’s shown in Fig. 13 (a) and (b). The maximum value of PVA’s power generation is around 0.788 MW. The maximal value of SWT’s electricity generation is approximately 70 kW. SWT’s generation of power has a reduction value of roughly 0.27 kW. Figure 14 depicts an analysis of per unit values of DLC, DERs generation of 33-bus system’s final planned horizon. The maximal value of DERs generation of power is around 0.681PU. DLC has a maximum value of around 0.351PU.

Analysis of five-year peak demand forecasts for the 9-bus test system’s electric and heating loads.

The 9-bus system’s hourly electricity market price during the year 2021.
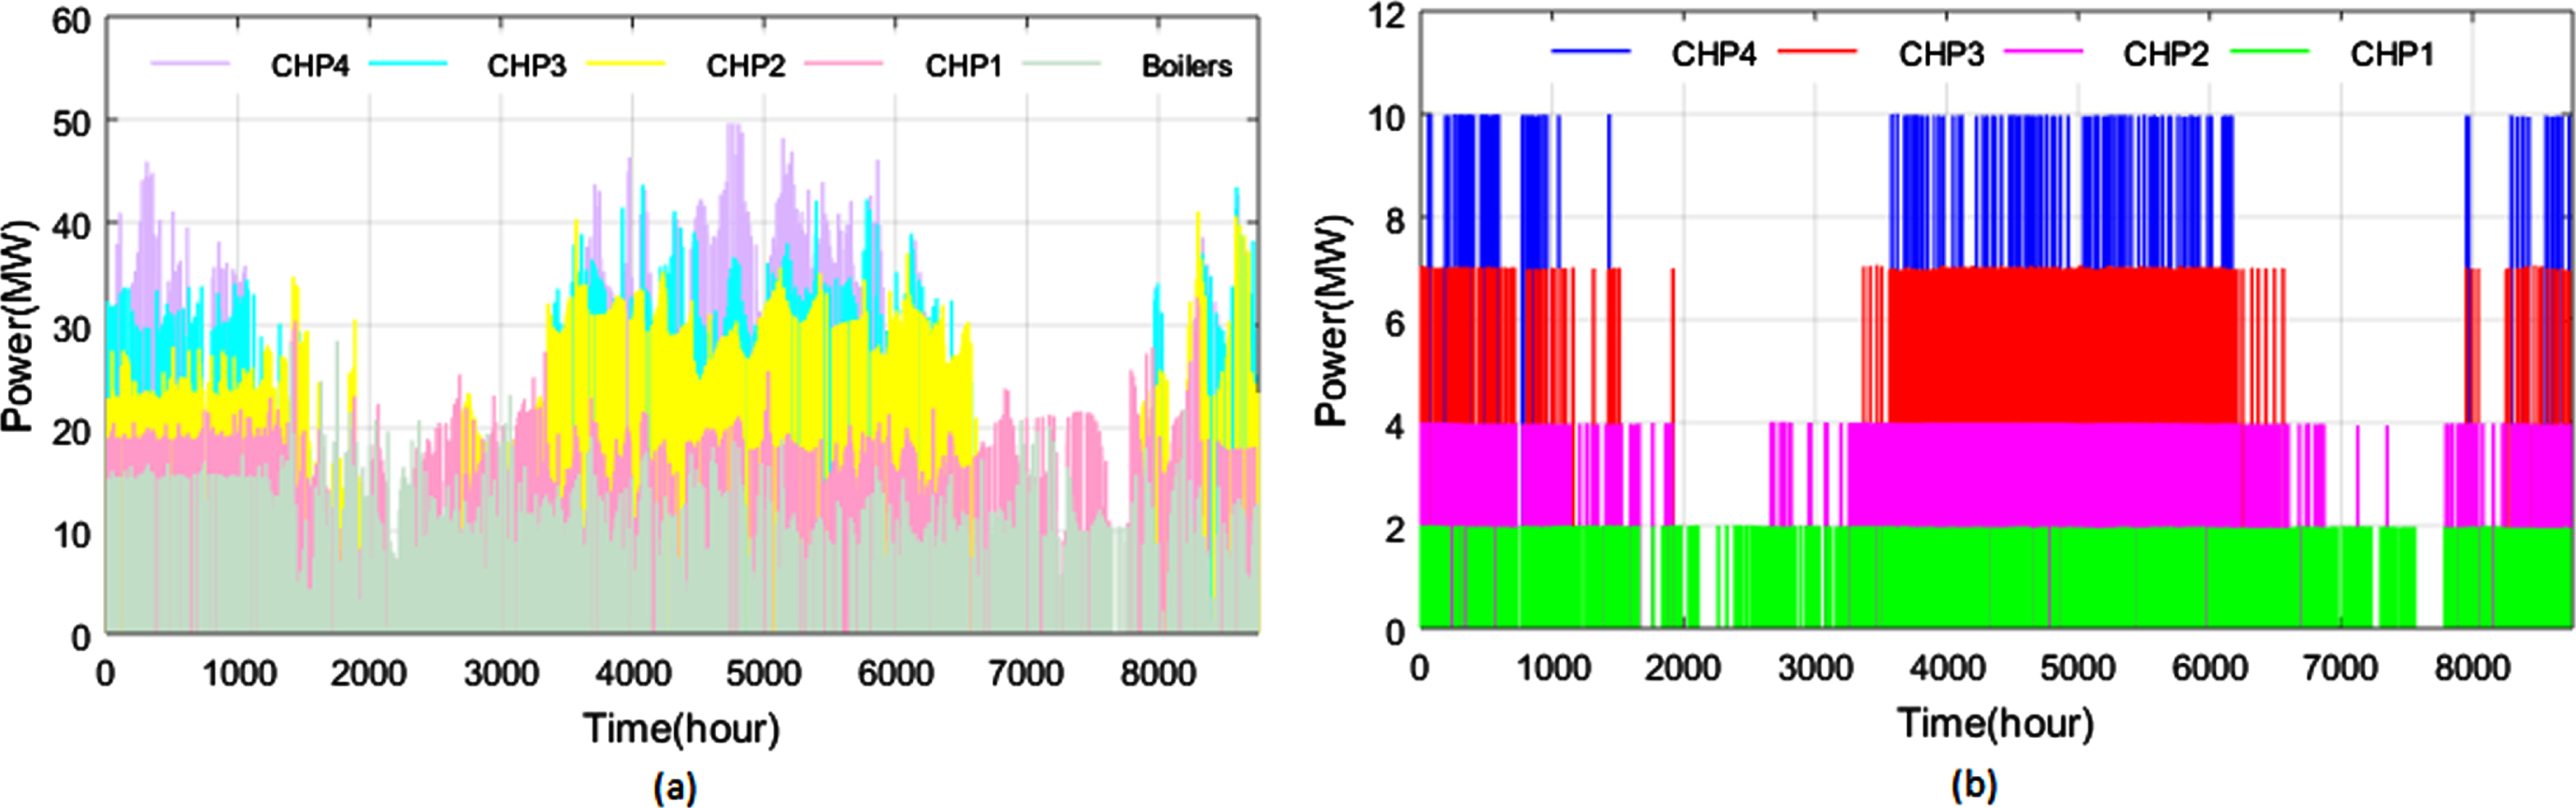
(a) and (b): Analysis of weighted column of the ideal heat and electricity dispatch of 9-bus system.

(a) and (b): Analysis of stacked column of expected PVAs and SWTs electricity over 9-bus system’s ultimate planning horizon.
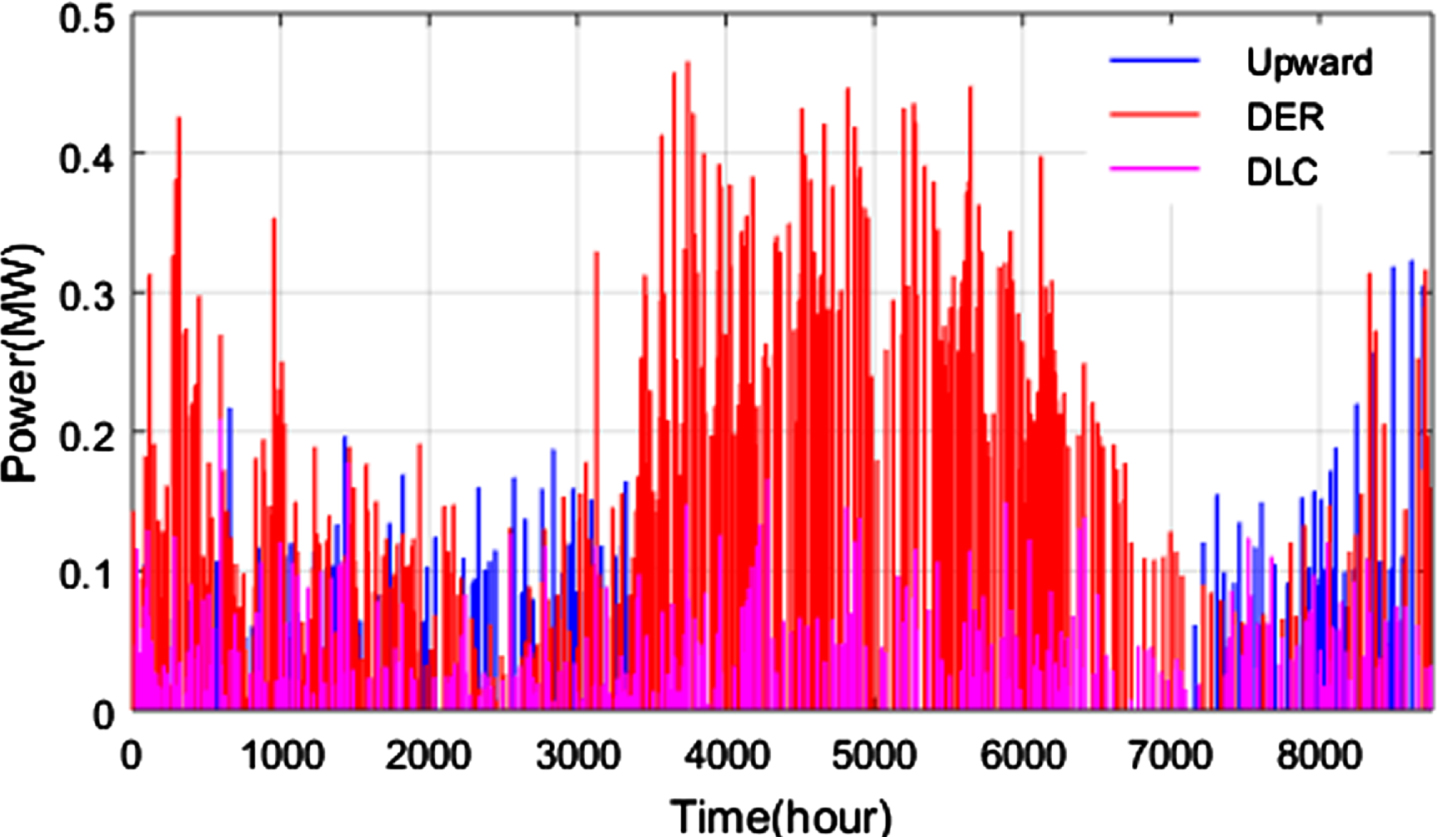
Analysis of projected values of per-unit DLC, DERs generation of 9-bus system’s final planned span.
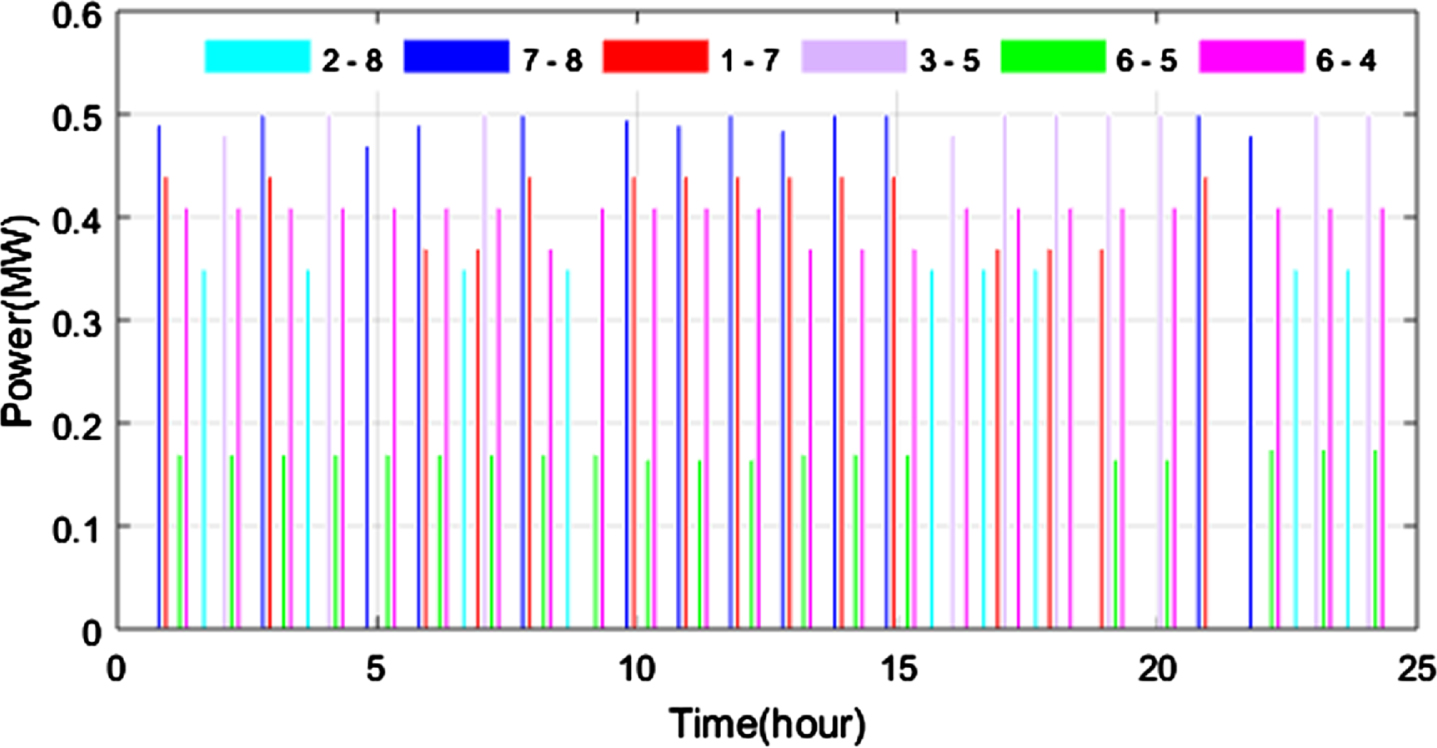
Analysis of expected heating dispatch for 9-bus system’s varied DHN and last planning horizon.
Hourly thermal and electric load analysis for 33-bus system.
Analysis of base electricity price of 33-bus test system upward network.
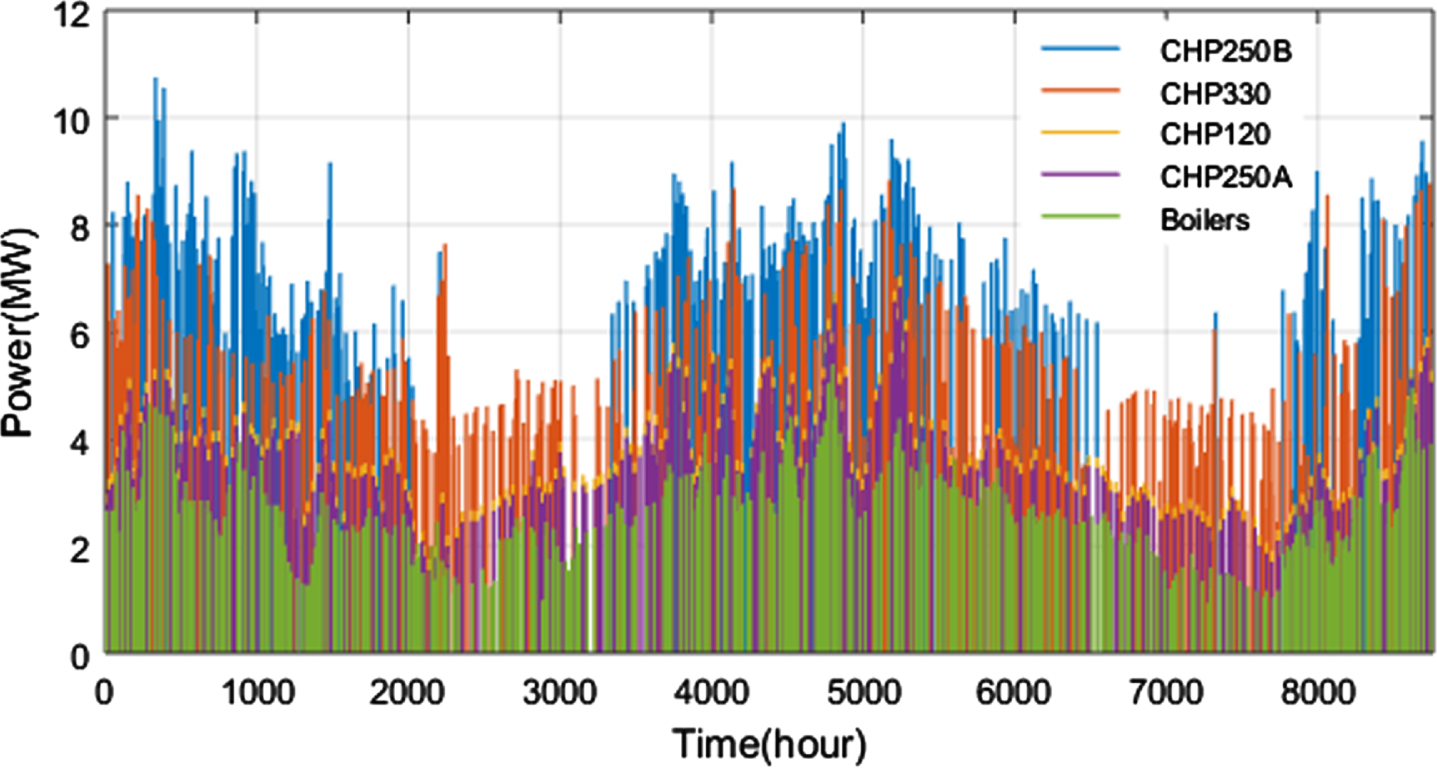
Stacked column of anticipated optimal heat dispatch.
(a) and (b): Analysis of weighted column of projected SWT’s (b) Analysis of PVA’s electricity generation for the 33-bus system.

Analysis of per unit values of DLC, DERs power generation, and upstream network.
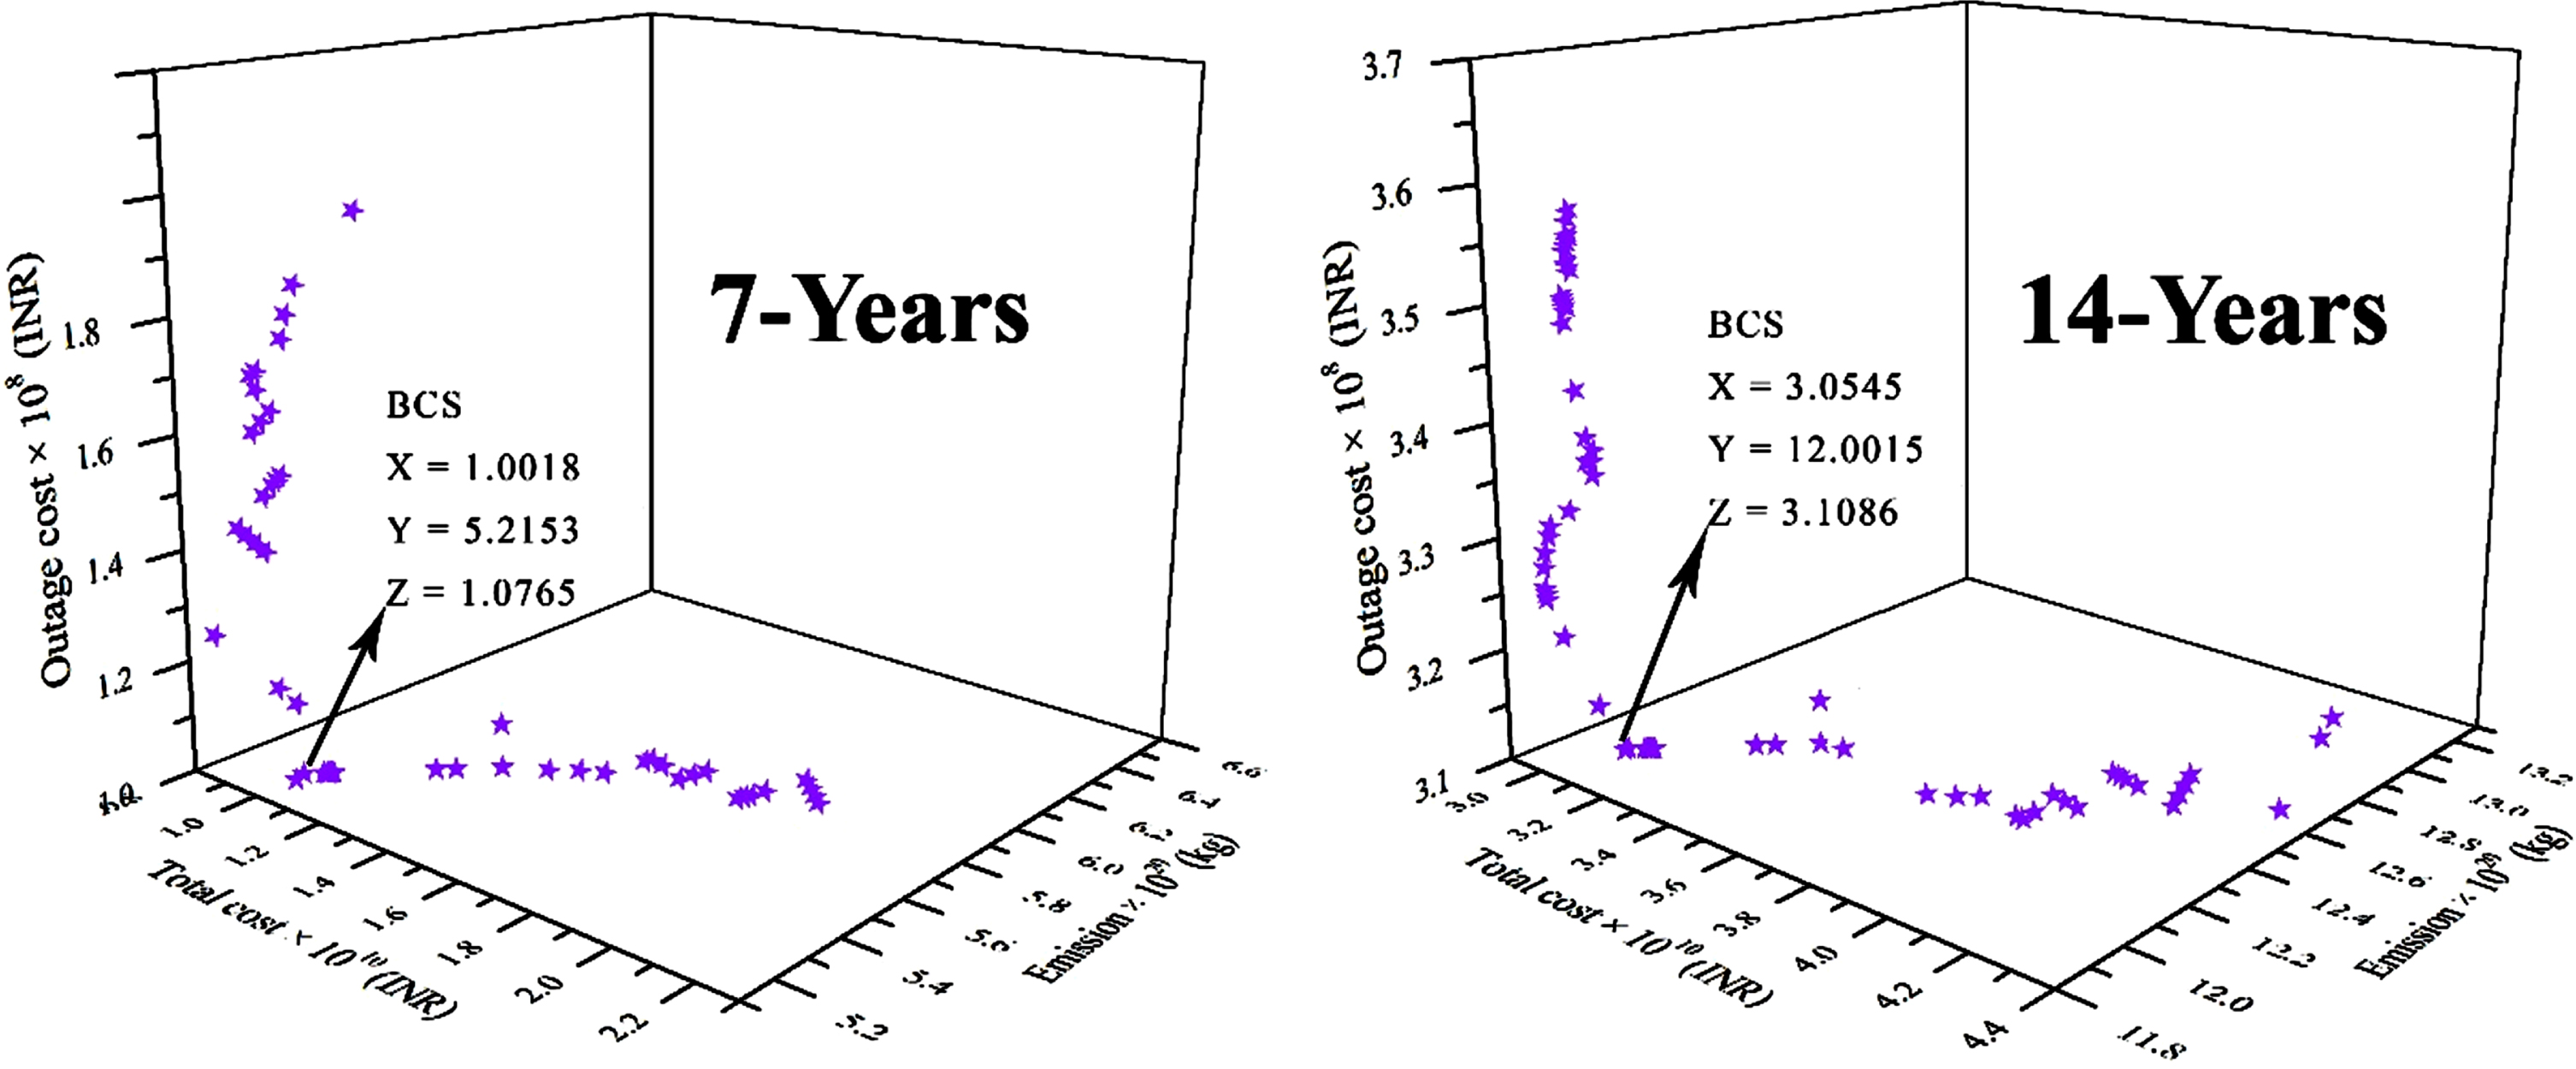
Pareto front of case 4 for 7 and 14-year planning horizons.
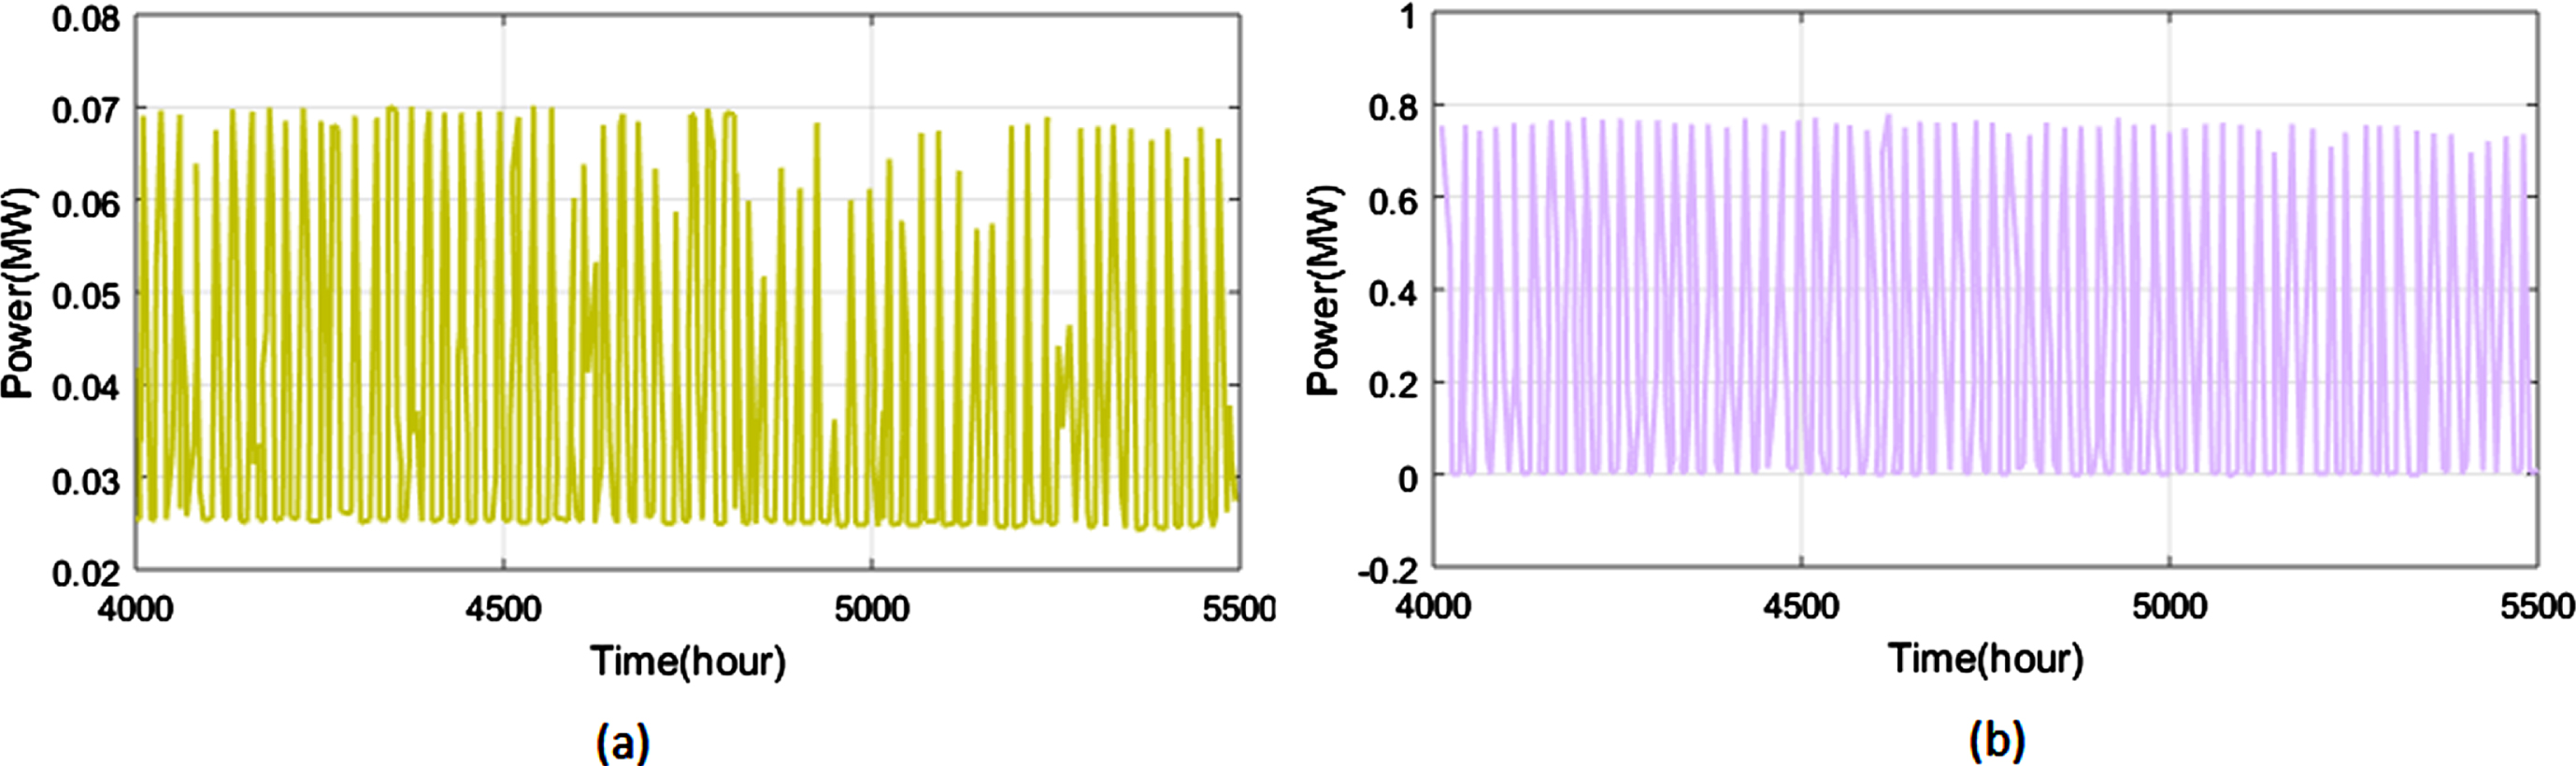
Figure 15(a) and (b) provide an analysis of projected values of EESs and TESs optimal charge and discharge of peak periods of electric and heating systems of 33-bus system. TES and ESS were employed by DCNEP to reduce unintentional system load under contingent scenarios. Moreover, energy storage facilities are used to boost the transmission capacity of EDC’s electrical network while lowering operational expenses. Figure 16 depicts an analysis of hourly and electric loads of 123-bus test system. DCNEP parameters of 123-bus test system are similar for the 33-bus test system. The greatest value is found at 23 MW. At 3 MW, the minimal value occurs. Figure 17 depicts an analysis of stacked column of the anticipated best heat dispatch of 123-bus system’s final planning horizon. Figure 17 (a) depicts the maximum value of the boilers, which is 22 MW. Figure 17 depicts the CHP250B and CHP250A. (b). The system’s peak load was met by the 120 kW CHP facilities. Figure 17 (c) depicts CHP120B and CHP120A. The 330 kW CHPs are committed to supplying the dependent load, and boiler tracked heat load, as illustrated in Fig. 17 (d). Figure 18 depicts an analysis of stacked column of anticipated optimal electricity dispatch of 123-bus system’s final planning horizon. Figure 18 (a) depicts the 250 kW CHPs facilities that provided the system’s peak load. Figure 18 (b) depicts the 120 kW CHPs facilities that provided the system’s peak load. The 330 kW CHPs are committed to providing the base load, as shown in Fig. 18(c), and the boiler tracked the thermal load. Figure 19 (a) and (b) depict an analysis of PVAs and SWTs power generation of 123-bus system’s final planned horizon (b). The maximum value of PVAs generation of power is 0.53 MW. The greatest value of SWTs electricity generation occurs at 0.07 MW. Figure 20 depicts an analysis of per-unit values of DLC, DERs, and upstream network of 123-bus system’s ultimate planning horizon. The greatest value of DERs generation of electricity is occurring at 0.743 PU. Figure 21 shows the comparison of total cost ($). The comparison of existing system and the proposed system, the proposed system is occurring low cost. Comparison is done by the existing systems, which is PSO, SOA, CSA and the proposed systems. The low cost is occurring in the proposed system of bus123, which is $135. Figure 22 shows the comparison of the emission cost in the bus9, bus33, and bus123 Low emission cost is occur at the proposed system of the bus33, which is $0.12. The PSO, SOA, CSA, are the existing systems which are occur at high emission cost, compared to the proposed system. Figure 23 shows comparison of electric storage efficiency (%) of bus9, bus33, and bus123. The high efficiency (%) is occurring at the proposed system of the BUS123, which is 0.8% . All Buses high efficiency is occur at the proposed system. The existing systems are PSO, SOA, and CSA; occur at low electric storage efficiency (%). Figure 24 shows the comparison of thermal storage efficiency (%) of bus9, bus33, and bus123. The efficiency is high in the proposed system for bus9, bus33, bus123, which is 95% . The efficiency is low in the existing systems, which are PSO, SOA, and CSA. Figure 25 shows the comparison of reliability index in the bus9, bus33, and bus123. The high reliability index is occurring at the proposed system of bus9 that are 9.5. Bus33, the reliability index is occurring at 7.9, in the proposed index. Bus123 is occurring at 8th index in the proposed system. The existing systems are PSO, SOA, and CSA; occur at low reliability index in all the buses.
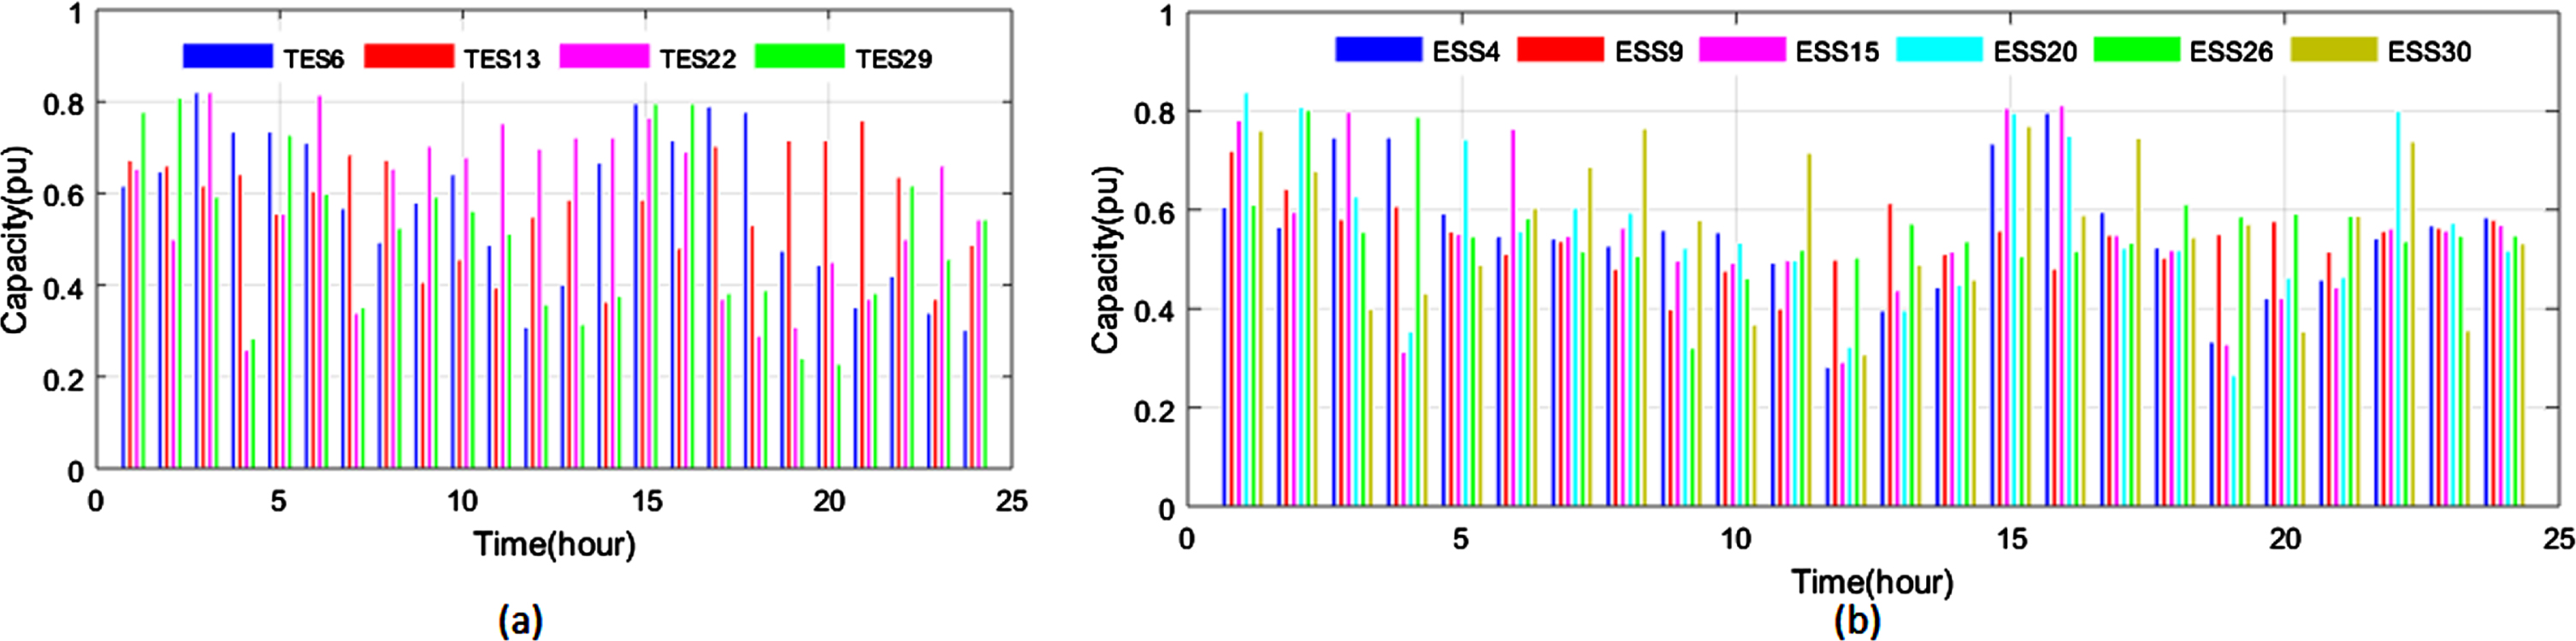
(a) and (b): Analysis of estimated values of TESs, EESs optimal charge and discharge peak periods of electric heat.
Analysis of hourly and electric loads of 123-bus test system.

Stacked column analysis of estimated optimal heat dispatch of 123-bus system.
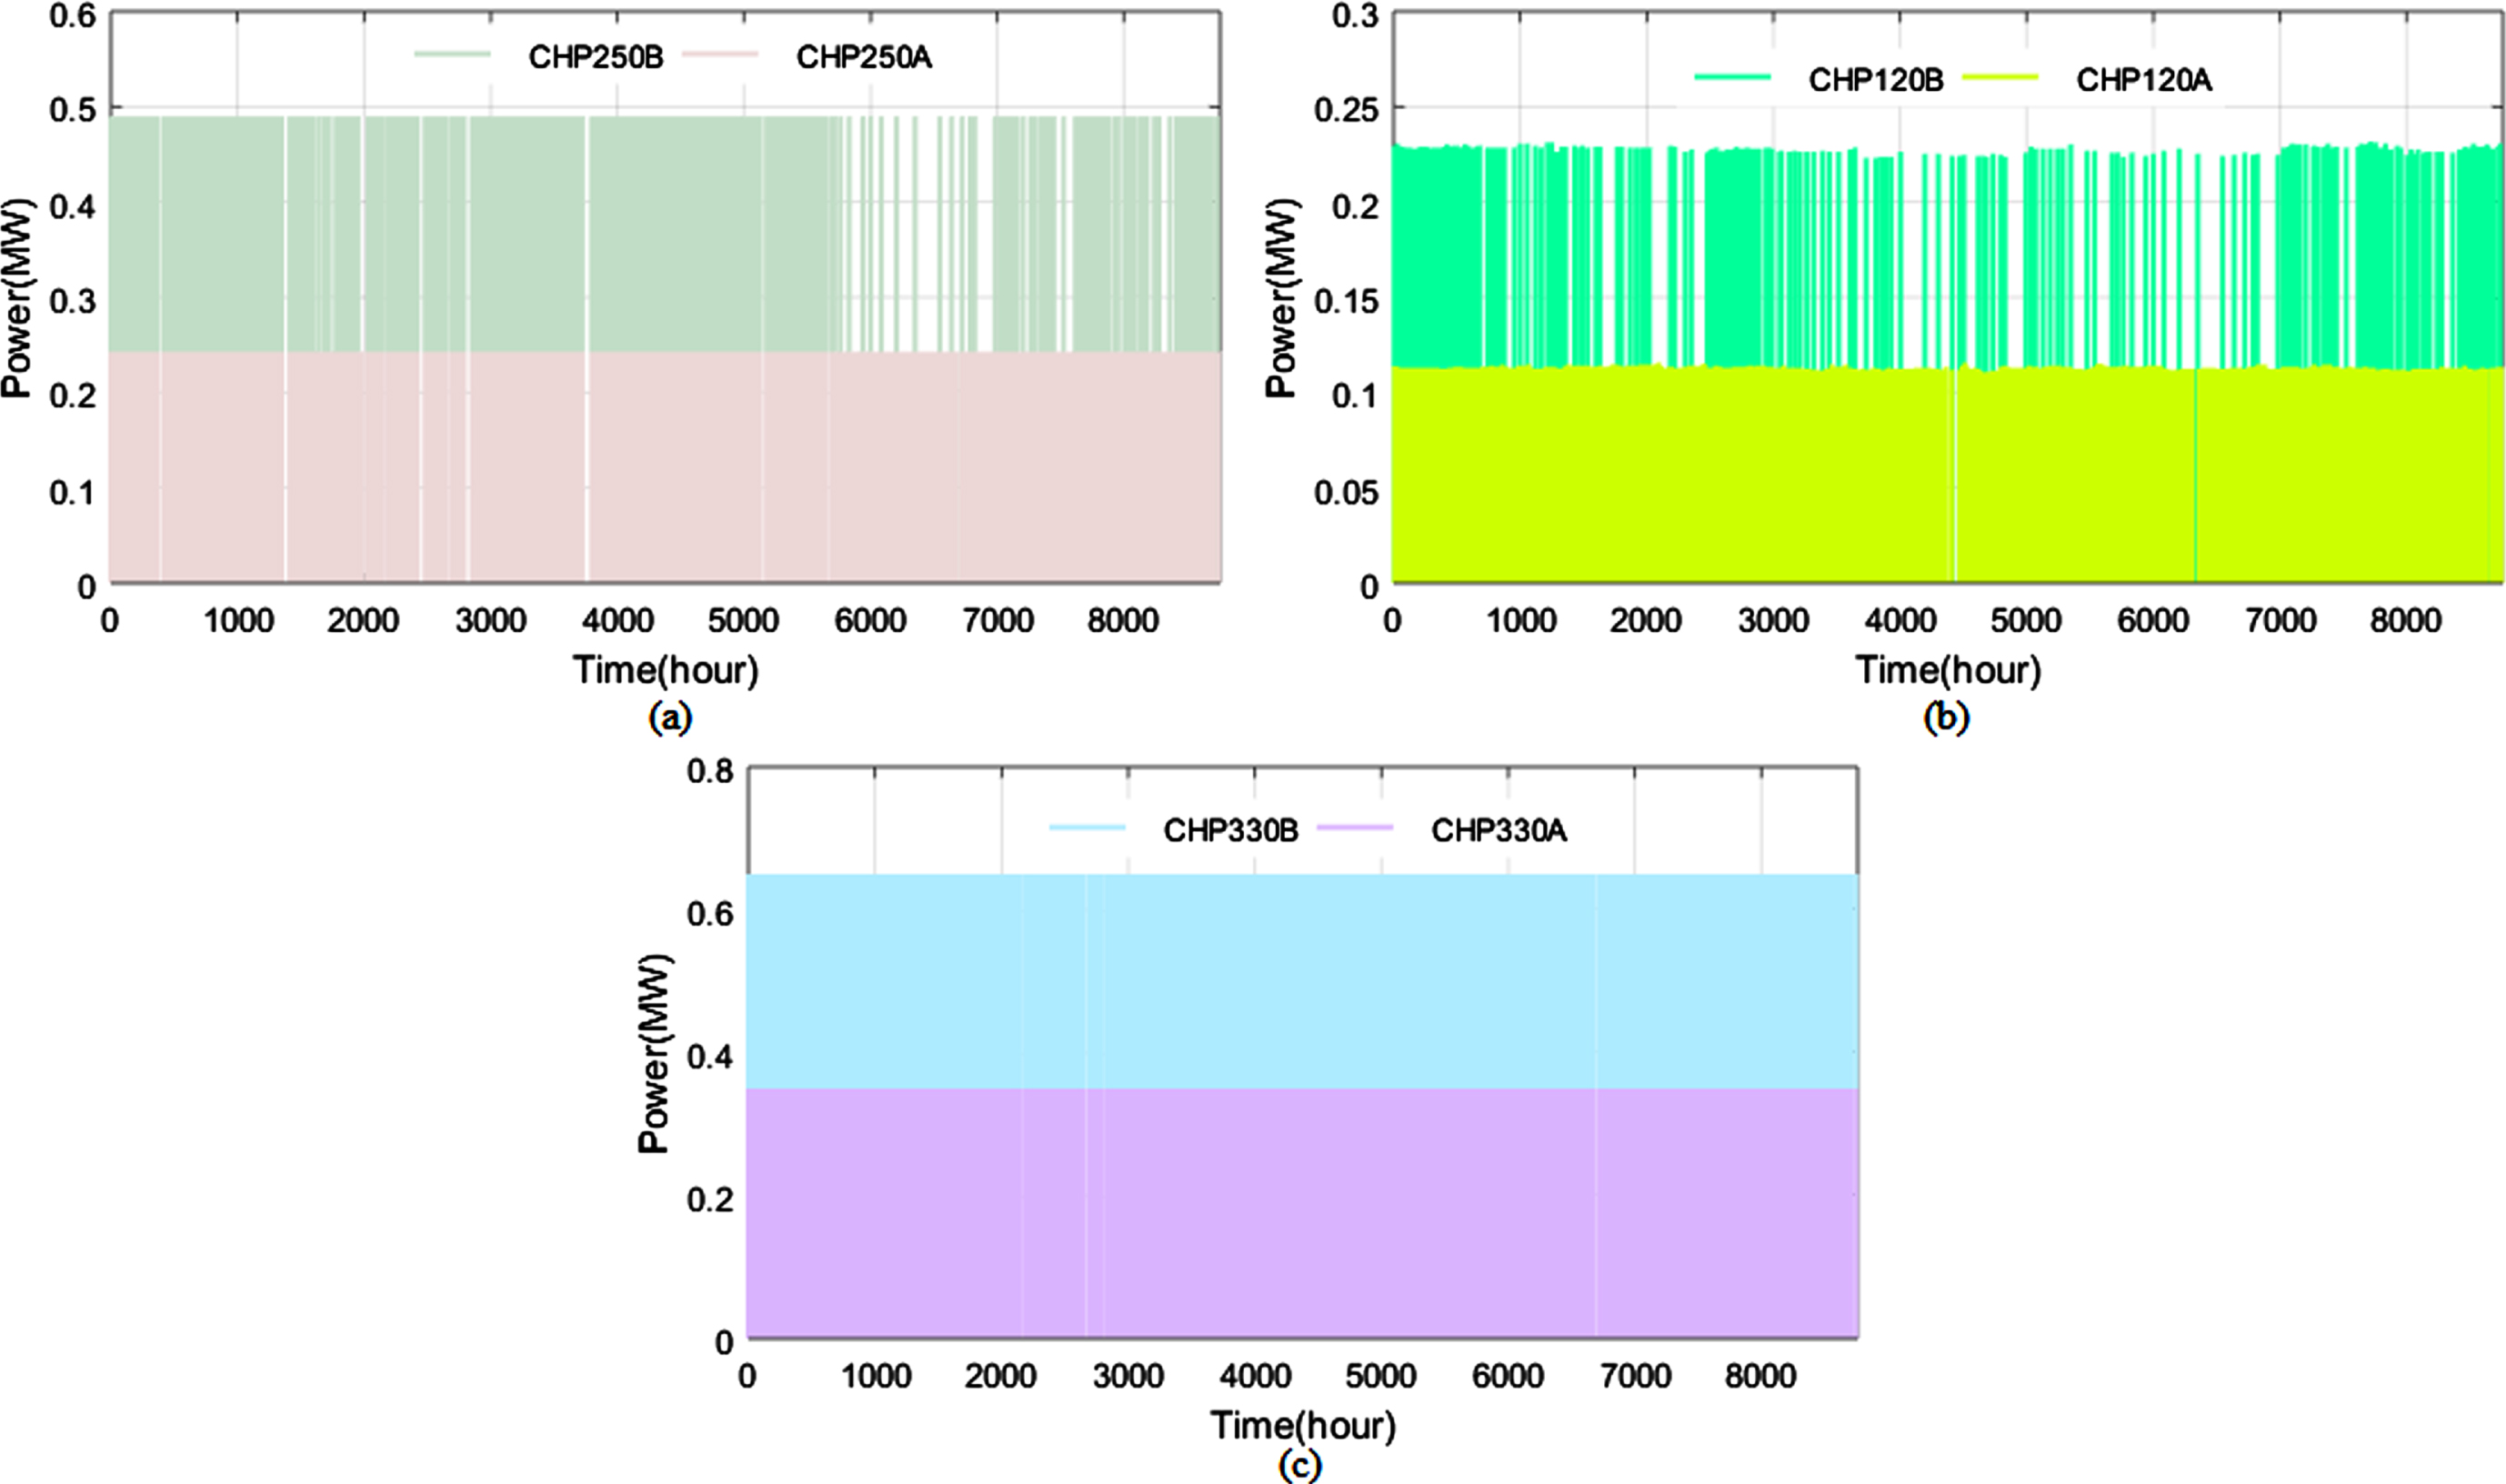
Analysis of stacked column of 123-bus systems anticipated optimal electricity dispatch.
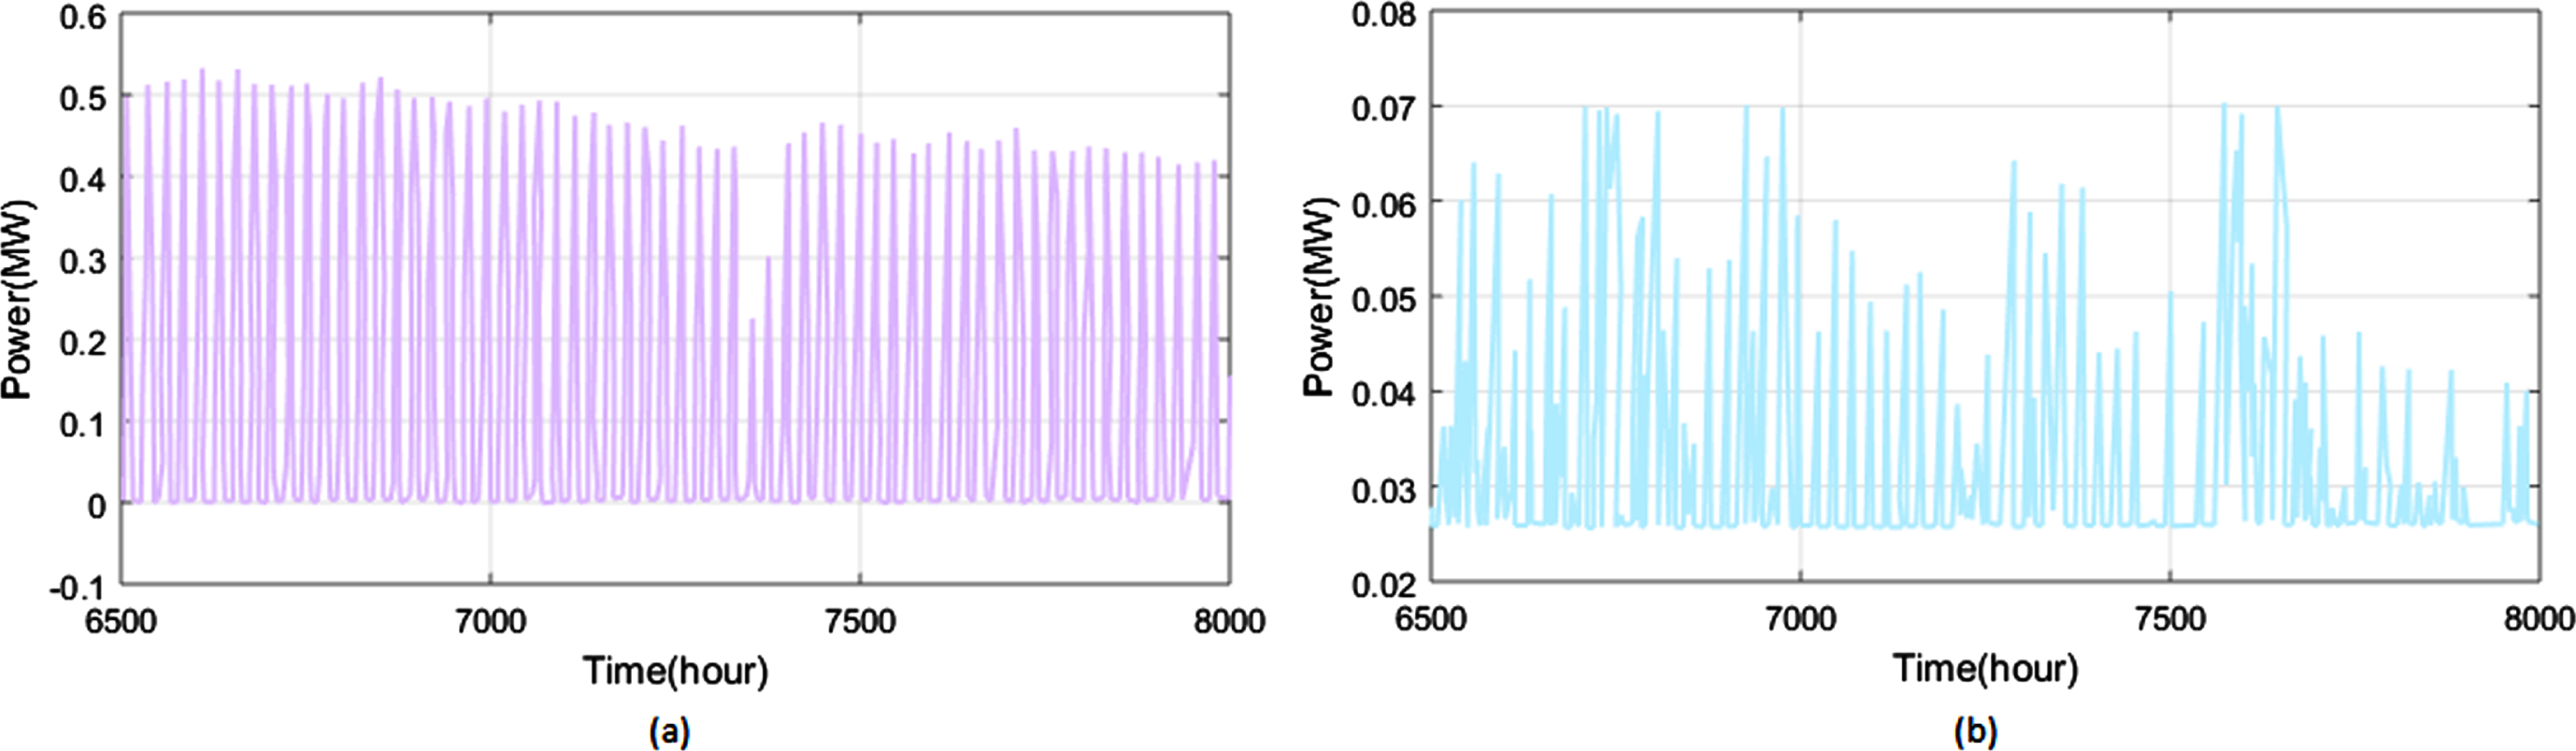
(a) and (b): Analysis of PVAs and SWTs power generation of 123-bus system’s final planning horizon.
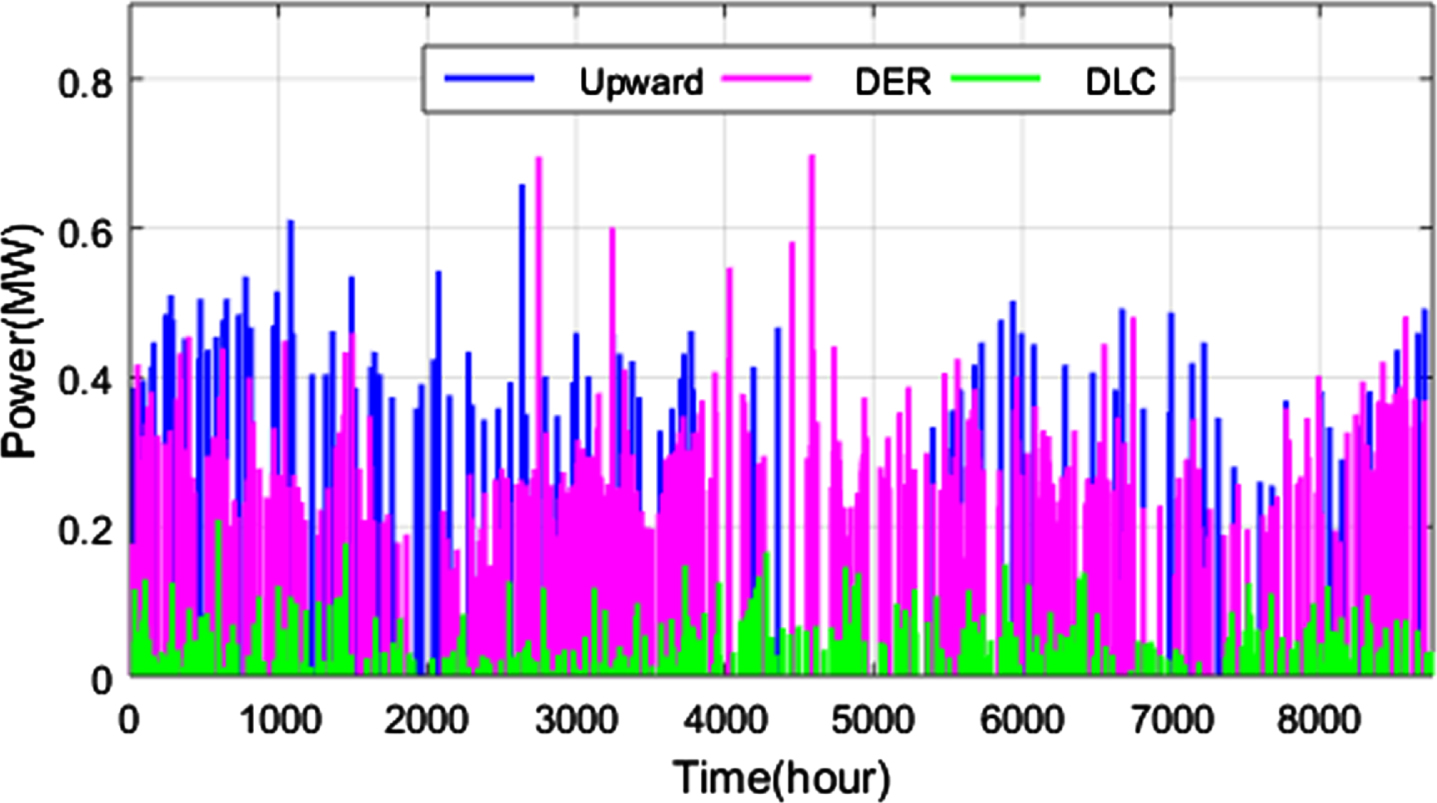
Analysis of per-unit values of DLC, DERs, electricity generation and upward network.
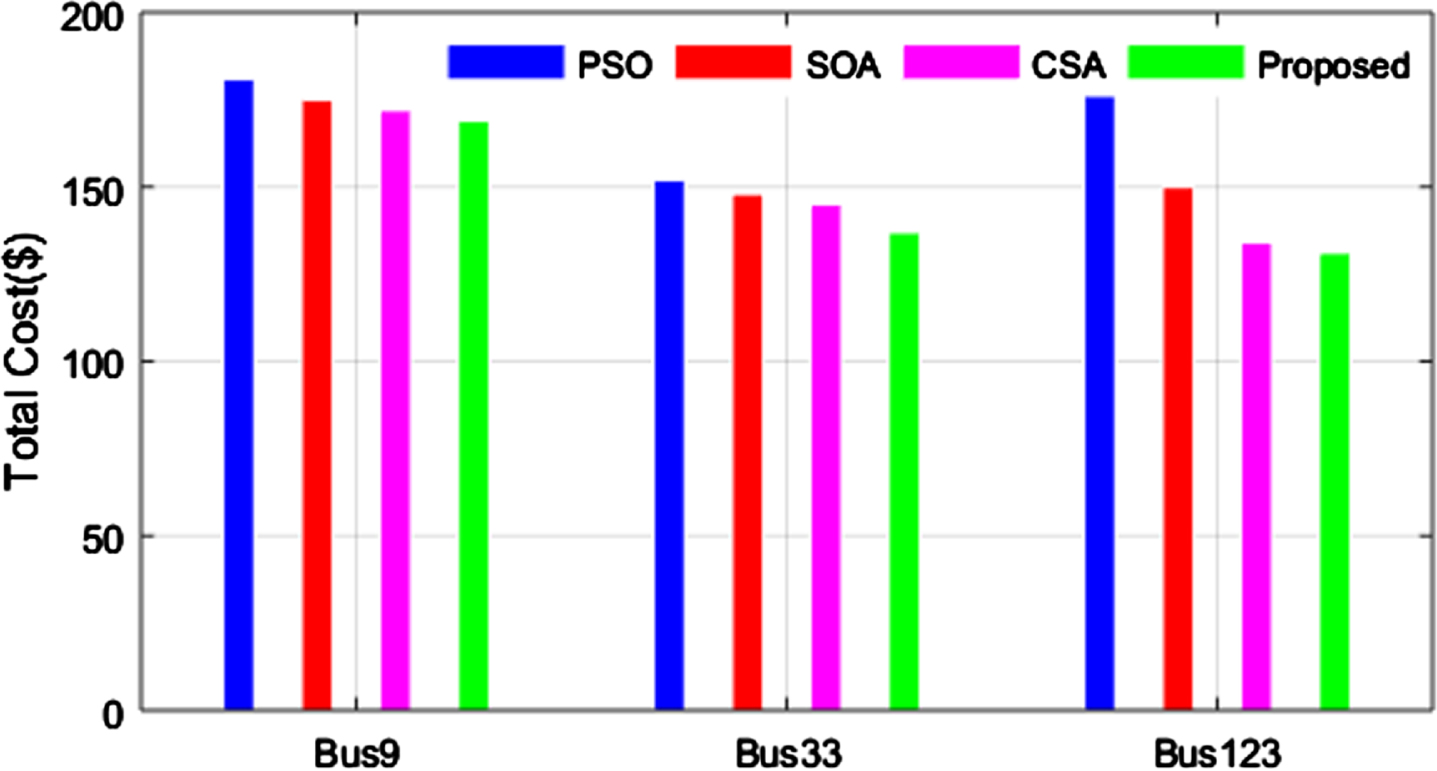
Comparison of total cost ($).
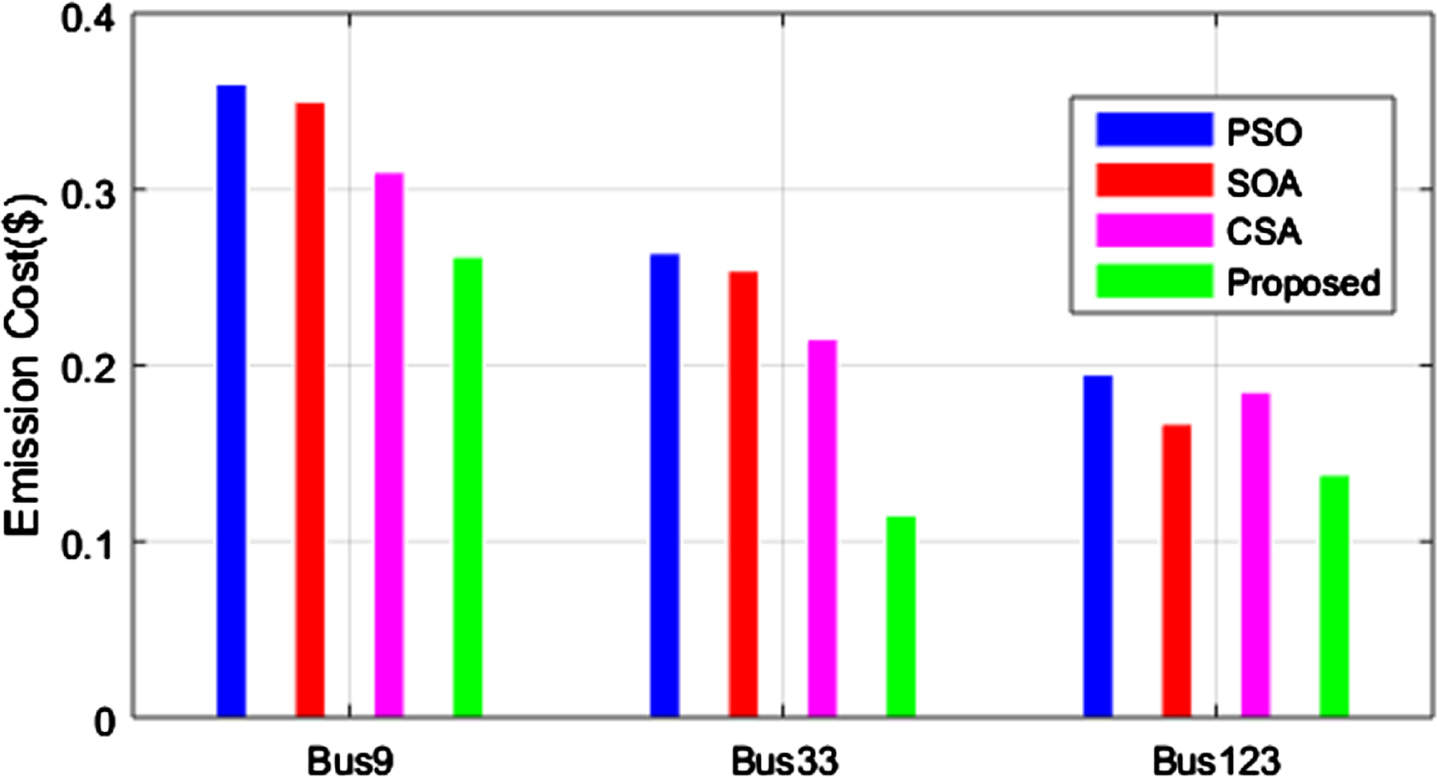
Comparison of emission cost ($).
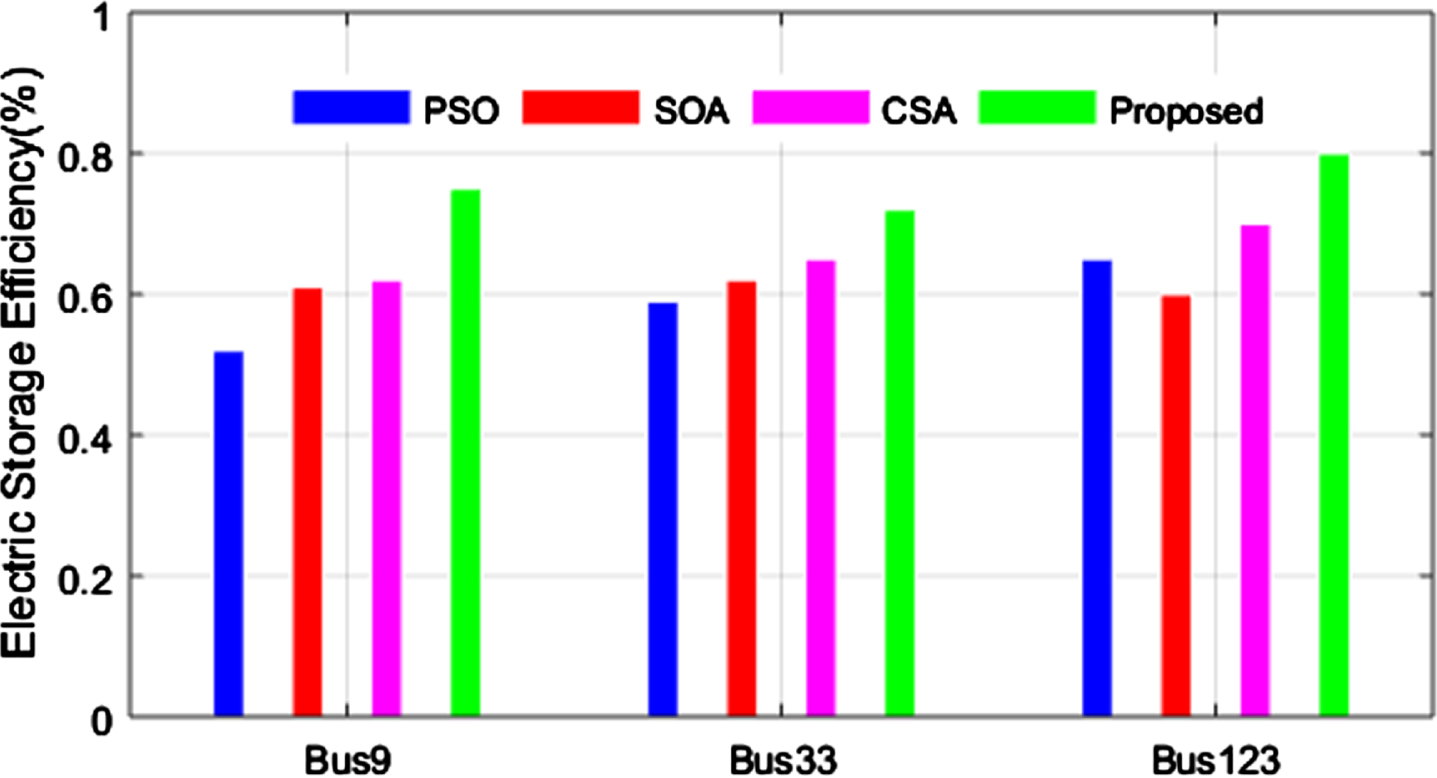
Comparison of the electric storage efficiency (%).
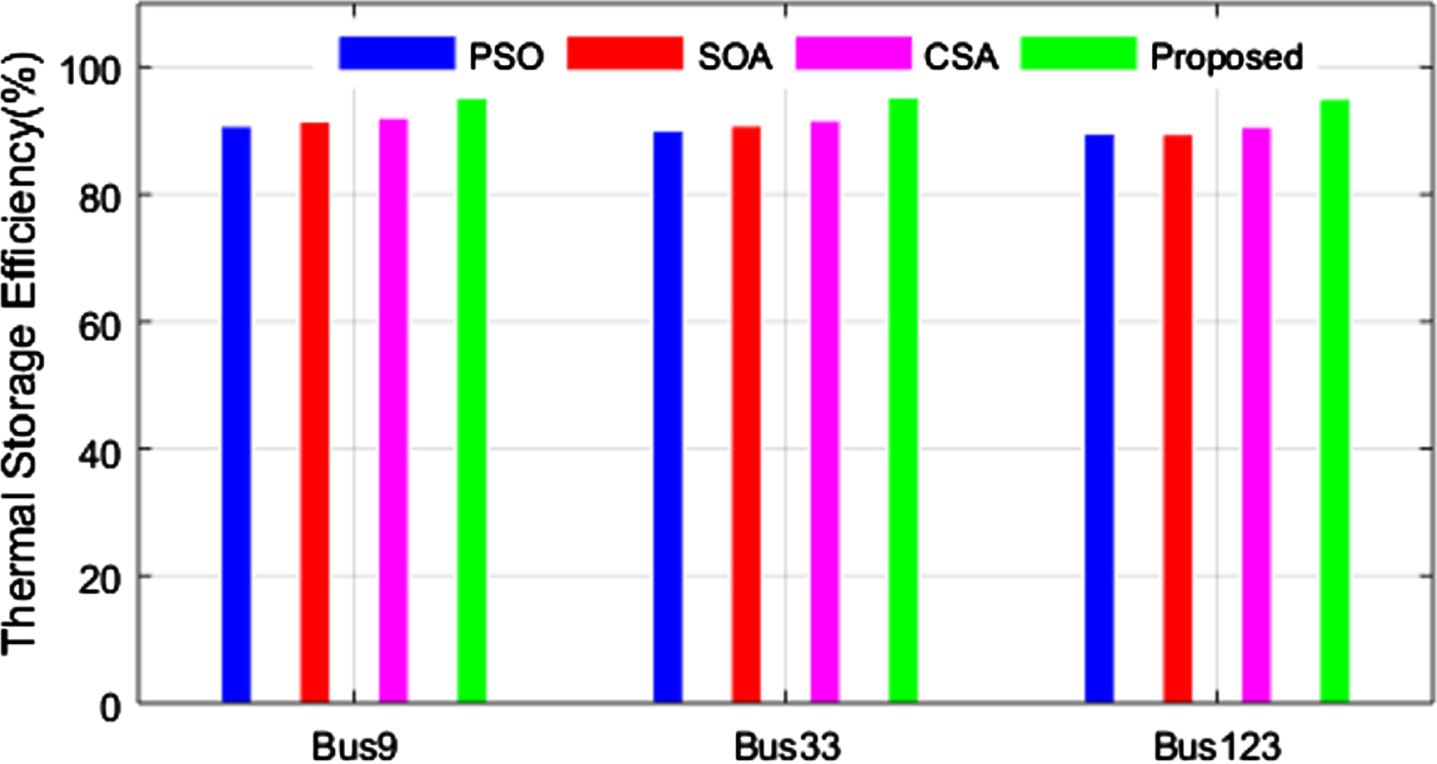
Comparison of thermal storage efficiency (%).

Comparison of reliability index.
The MOGEP study is investigated with 4 different cases. Case 1: Basic MOGEP; Case 2: MOGEP with retirement; Case 3: MOGEP with recuperation; Case 4: Combination of Cases 2 and 3. The authors have experienced that the outcomes of case 4 is optimal. So the outcomes of case 4 are given elaborately.
Results of Case 4
The combined deliberation of recuperation and retirement has more benefits.
Assessment of enactment metrics
The enactment metrics of case 4 is provided in Table 2.
Assessment of enactment metrics
Assessment of enactment metrics
The outcomes of case 4 is genuine to accept. It offers a complete elucidations to the decision makers. The results of case 4 is compared with the actual installed capacity stated by Central Electricity Authority (CEA) [37] for the year 2022 in Table 3. It authenticates the outcomes and enhances the heftiness of the suggested plan.
Comparison between actual and projected installed capacities for 2022
Comparison between actual and projected installed capacities for 2022
This study suggests working MOGEP for Tamil Nadu power sector by deliberating recuperation of elder units using MOPSO and CSA approach. MOCLPSO method is implemented to solve MOGEP problem and CSA is apply to solve the high dimensional problem. The goal of proposed method is to reduce the overall price, to reduce carbon discharge, and to enhance the reliability. Four dissimilar cases are solved by deliberating retirement and recuperation of the elder plants. The combined consideration of retirement and recuperation offered optimal solution. The projected method can be implemented for any similar power sector. After this, the contributors would like to prolong this study by considering variability in fuel charges, ambiguity in load, deregulation etc. The results also demonstrate that the suggested process performs particularly better than the other optimization techniques.