
Abstract
The mechanical structures of the rapier loom are strongly coupled, resulting in faults that are characterized by strong coupling, hierarchy, phase dynamics, and a transient nature. However, current fault diagnosis methods using a single approach are not satisfactory. Additionally, fault diagnosis of the entire operation cycle of the rapier loom equipment is lacking. This paper proposes a fault tree diagnosis method with probabilistic neural network optimization to build a complete fault diagnosis system for rapier looms and improve their intelligent diagnosis capability. The method has strong fault tolerance and self-adaptive capability, allowing for accurate location of the root cause of the fault from multiple fault sources. By accumulating fault samples and continuously improving the diagnosis network, the accuracy of diagnosis can be further enhanced. Initially, the failure mechanism of key subsystems of rapier loom is analyzed. A fault tree model is established for each subsystem based on expert experience and historical data. The model identifies the characteristic sign quantities of typical fault types and serves as the basic input for fault identification. A probabilistic neural network is used to train the fault sample set and complete the diagnosis of the cause of the fault. According to field experiments, the proposed method has demonstrated a significant improvement in the efficiency of locating and identifying fault signs in rapier looms. This improvement allows for accurate and quick identification of faults.
Introduction
The intelligent level of rapier loom equipment is constantly being improved, and the equipment control system is becoming increasingly complex. In order to meet the needs of users in the new era of rapier weaving machine development, the current research hot spot is to ensure the safety and reliability of the rapier weaving machine operation process. Due to the complex mechanical structure of the loom equipment and the weaving process, the probability of failure is high. If a failure causes downtime, it not only causes economic losses but even endangers the lives of production staff. Therefore, effective fault diagnosis is an important measure to ensure the normal operation of rapier loom equipment.
From the current mainstream fault diagnosis technology and rapier loom equipment fault diagnosis application research work [1]. The rapier loom fault diagnosis technology is divided into the following three areas. Fault diagnosis technology based on expert experience is the earliest and most used fault diagnosis technology for rapier loom fault diagnosis [2]. This method mainly analyzes the fault of rapier loom equipment, constructs expert diagnosis knowledge base, and finally realizes the fault diagnosis of rapier loom [3]. Yang Jing et al [4] analyzed the causes of warp breakage for warp breakage arising from different positions, including reed part, carrier position, heald place, warp stopper, back beam and warp beam, etc., in conjunction with production practice. They proposed the corresponding solutions and achieved better weaving results. Chen Yonghong et al [5] summarized the causes and solutions of weft breakage in rapier looms. They analyzed the causes of weft breakage and the troubleshooting process according to the location of weft breakage in rapier looms, and proposed corresponding solutions. All the above studies are only for the local equipment failure of the loom. The equipment maintenance method based on manual experience can directly reduce the productivity and even danger when the failure occurs during the operation of rapier loom due to its difficulty in troubleshooting and untimely troubleshooting. The fault diagnosis technique based on the system mathematical model is used to construct the rapier loom fault diagnosis model by analyzing the rapier loom process parameters, and finally to carry out fault diagnosis analysis and research [6]. Chennan Yu et al [7] proposed a new type of eccentric circle-noncircular gear planetary wheel system weft guidance mechanism and established a mathematical model to invert the mechanism parameters from the ideal weft guidance motion characteristics. This method improves the stability of the weft guiding mechanism and reduces the probability of its failure. Wei Zhan et al [8] improved and established a contact collision force model applicable to the wefting cam system based on the existing contact collision force hybrid model. In turn, the collision force and collision deformation are solved, which is an effective means to carry out wefting cam fault analysis. This article [9] presents a modified genetic algorithm (MGA) to determine the five degrees of freedom parameters, namely Kp, Ki, Kd, λ, and μ of a fractional order proportional integral derivative (FOPID) controller to achieve the speed control of a brushless direct current (BLDC) motor by sensorless technique. Fault diagnosis techniques based on intelligent signal processing, also known as data-driven fault diagnosis techniques [10]. This technique is a major research direction in the field of fault diagnosis by performing signal processing on the data with a large amount of raw data already available, and then extracting and selecting features of the data for algorithm learning. It can effectively solve the problems such as multiple signs and multiple faults of large complex systems. Zhang et al [11] proposed a recurrent neural network with low computational complexity, i.e., echo state network. It was applied to process low-cost state signals in mechanical fault diagnosis to improve the fault classification accuracy and reduce the computational effort. Sarik et al [12] proposed a fuzzy diagnosis algorithm based on electrical parameter classification specifically for identifying common faults in power plants. Singh et al [13] constructed two different support vector machine models for implementing phase detection of two types of faults using a heuristic feature selection method to find the optimal features and improve the fault classification accuracy. Mahesh A et al [14] presents a novel Whale Optimization Algorithm (WOA) approach for optimal tuning of Fractional-Order Proportional Integral and integral-order Controller (FOPI λ) is used to solar Photo-Voltaic (PV) fed sensorless speed control.
However, with the increasing complexity of mechanical fault diagnosis, scholars at home and abroad have proposed the method of fusing intelligent fault diagnosis methods to achieve the expected fault diagnosis effect in the last two years of research. Vanchinathan K et al [15] studied the fault detection and diagnosis method of sensorless brushless DC motor under external disturbance. And they came to this conclusion after experiments that the WOA-based FDD strategies are very effective for both bearing and stator winding faults detection and diagnosis in sensorless BLDC motor drives. Xiao et al [16] proposed a fault diagnosis method for high-speed looms based on rough sets and Bayesian networks. The rough set theory is applied to normalize the fault cause and result attributes, and the minimum normalization and classification rules are derived. Then a Bayesian fault diagnosis network model is constructed to calculate the probability of each fault cause and derive the maximum probability to obtain the diagnosis results.
The coupling between the mechanical structures of rapier looms is strong, and the causes of failure are complex and diverse. The use of a single fault diagnosis method is affected by its own limitations, and the diagnosis effect is not ideal. The current research on rapier weaving machine mainly focuses on the local fault system of the equipment, such as weft breakage diagnosis system, etc., but lacks the complete fault diagnosis system research on the whole operation cycle of rapier weaving machine. Second, the current rapier loom fault diagnosis and disposal process still relies excessively on the manual experience of technical experts, and lacks automatic and intelligent online fault diagnosis. To solve these problems, we propose a fault diagnosis method for rapier looms based on fault trees and probabilistic neural networks. The fault diagnosis method based on fault tree builds the corresponding analysis model from the top event according to the tree building rules of the fault tree, analyzes the connections at each level one by one, and determines the minimum cut set to achieve fault diagnosis [17]. The fault tree analysis method has a clear structure, but the reasoning speed is slow for complex multi-layer fault trees, and with the aging of the equipment and other reasons, there may also be fault types that are not included in the fault tree. In recent years, a probabilistic neural network (PNN) methodology has began to be used in fault diagnosis. PNN is a neural network based on Bayesian optimal classification decision theory and the Parzen window estimation method in nonparametric estimation of probability density functions [18]. With incomplete information, it is difficult to obtain more accurate diagnosis results using a single fault tree analysis method. The traditional multilayer forward network uses BP algorithm for backward error calculation, while probabilistic neural network (PNN) is a forward process that can construct pattern recognition classifier for state detection in combination with the operation state of the diagnosed object and analyze the observed feature data information for fault diagnosis. The fault diagnosis system based on fault tree and probabilistic neural network is more effective in reducing the misclassification rate and has a higher classification accuracy than a single fault tree.
In this paper, We first studied the process and mechanical mechanism of the rapier loom and divided the rapier loom into three subsystems for fault analysis: the start-up inspection subsystem, the weaving subsystem and the warp feeding and winding subsystem. The fault tree model for each subsystem is proposed, and the inference mechanism of fault tree combined with probabilistic neural network diagnosis is proposed due to the limitation of the fault tree. The simulation of the diagnosis algorithm is also performed using MATLAB software. Field experiments also show that this method can achieve 100% discrimination of fault signs. At the same time, it can give suggestions for locating and investigating the causes of faults, greatly improving the efficiency of rapier loom fault diagnosis.
The remaining sections of this paper are organized as follows: In Section 2, The mechanical structure of the rapier weaving machine and the weaving process are analyzed to get the connection between the signs of failure of the subsystems and the causes of failure; In Section 3, We review the theory of fault trees and probabilistic neural networks and introduce probabilistic neural networks in the fault diagnosis process due to the limitations of fault trees; In Section 4, A fault diagnosis model based on fault trees and probabilistic neural networks is proposed and the process of fault diagnosis is given; In Section 5, Fault trees for each subsystem of the rapier loom are created and fault diagnosis simulations are performed using the proposed method. The fault diagnosis effectiveness of the method is also demonstrated by field experiments. In Section 6, We have summarized the full text.
Analysis of rapier loom failure mechanism
Analysis of rapier loom mechanical structure and weaving process
The mechanical structure of rapier loom equipment can be divided into five major mechanisms according to their relative independence: warp feeding mechanism, weft opening mechanism, weft selection mechanism, weft drawing mechanism and weft beating mechanism. The warp feeding mechanism mainly consists of warp feeding servo, fixed back beam, tension roller, warp stopper and warp feeding shaft; the opening mechanism mainly consists of dobby opening heald frame; the weft guiding mechanism is the most complicated mechanism, including the weft storage device for storing weft thread, the weft selector for selecting color and other functions, the weft guiding cam for pulling weft thread, and the weft feeding and weft catching sword head for beating weft; the weft beating mechanism has the weft beating action cam and reed; the weft winding mechanism has the friction roller, the winding servo and the weft winding roller controlled by it. In the weft beating mechanism, there is a weft beating cam and a reed; in the winding mechanism, there is a friction roller, a winding servo and a cloth winding roller controlled by it. As is shown in Fig. 1, schematic diagram of the mechanical structure of the rapier loom.

Schematic diagram of the mechanical structure of the rapier loom.
The weaving process of a rapier loom includes four main processes: start-up inspection, let-off, weaving and winding. After the rapier weaving machine control system is powered up, it enters the weaving preparation phase, i.e. the start-up check process. If the start-up check system is normal, the parameters involved in the production process of the rapier weaving machine, such as warp tension, weft tension, main motor speed, etc., are initialized and set. In the normal continuous weaving process of rapier weaving machines, the main role of the let-off mechanism is to continuously transport the warp yarn to the weaving mechanism via the warp feeding and winding axis. The main function of the weaving mechanism is to realize the interweaving of yarn warp and weft to form the fabric by the mutual cooperation of each component and transport it to the winding mechanism. The main role of the winding mechanism is to wind the fabric through the winding shaft to form the woven product. The three main mechanisms of warp feeding, weaving and winding work together in a cycle to complete the entire continuous weaving process. The process flow diagram is shown in Fig. 2.
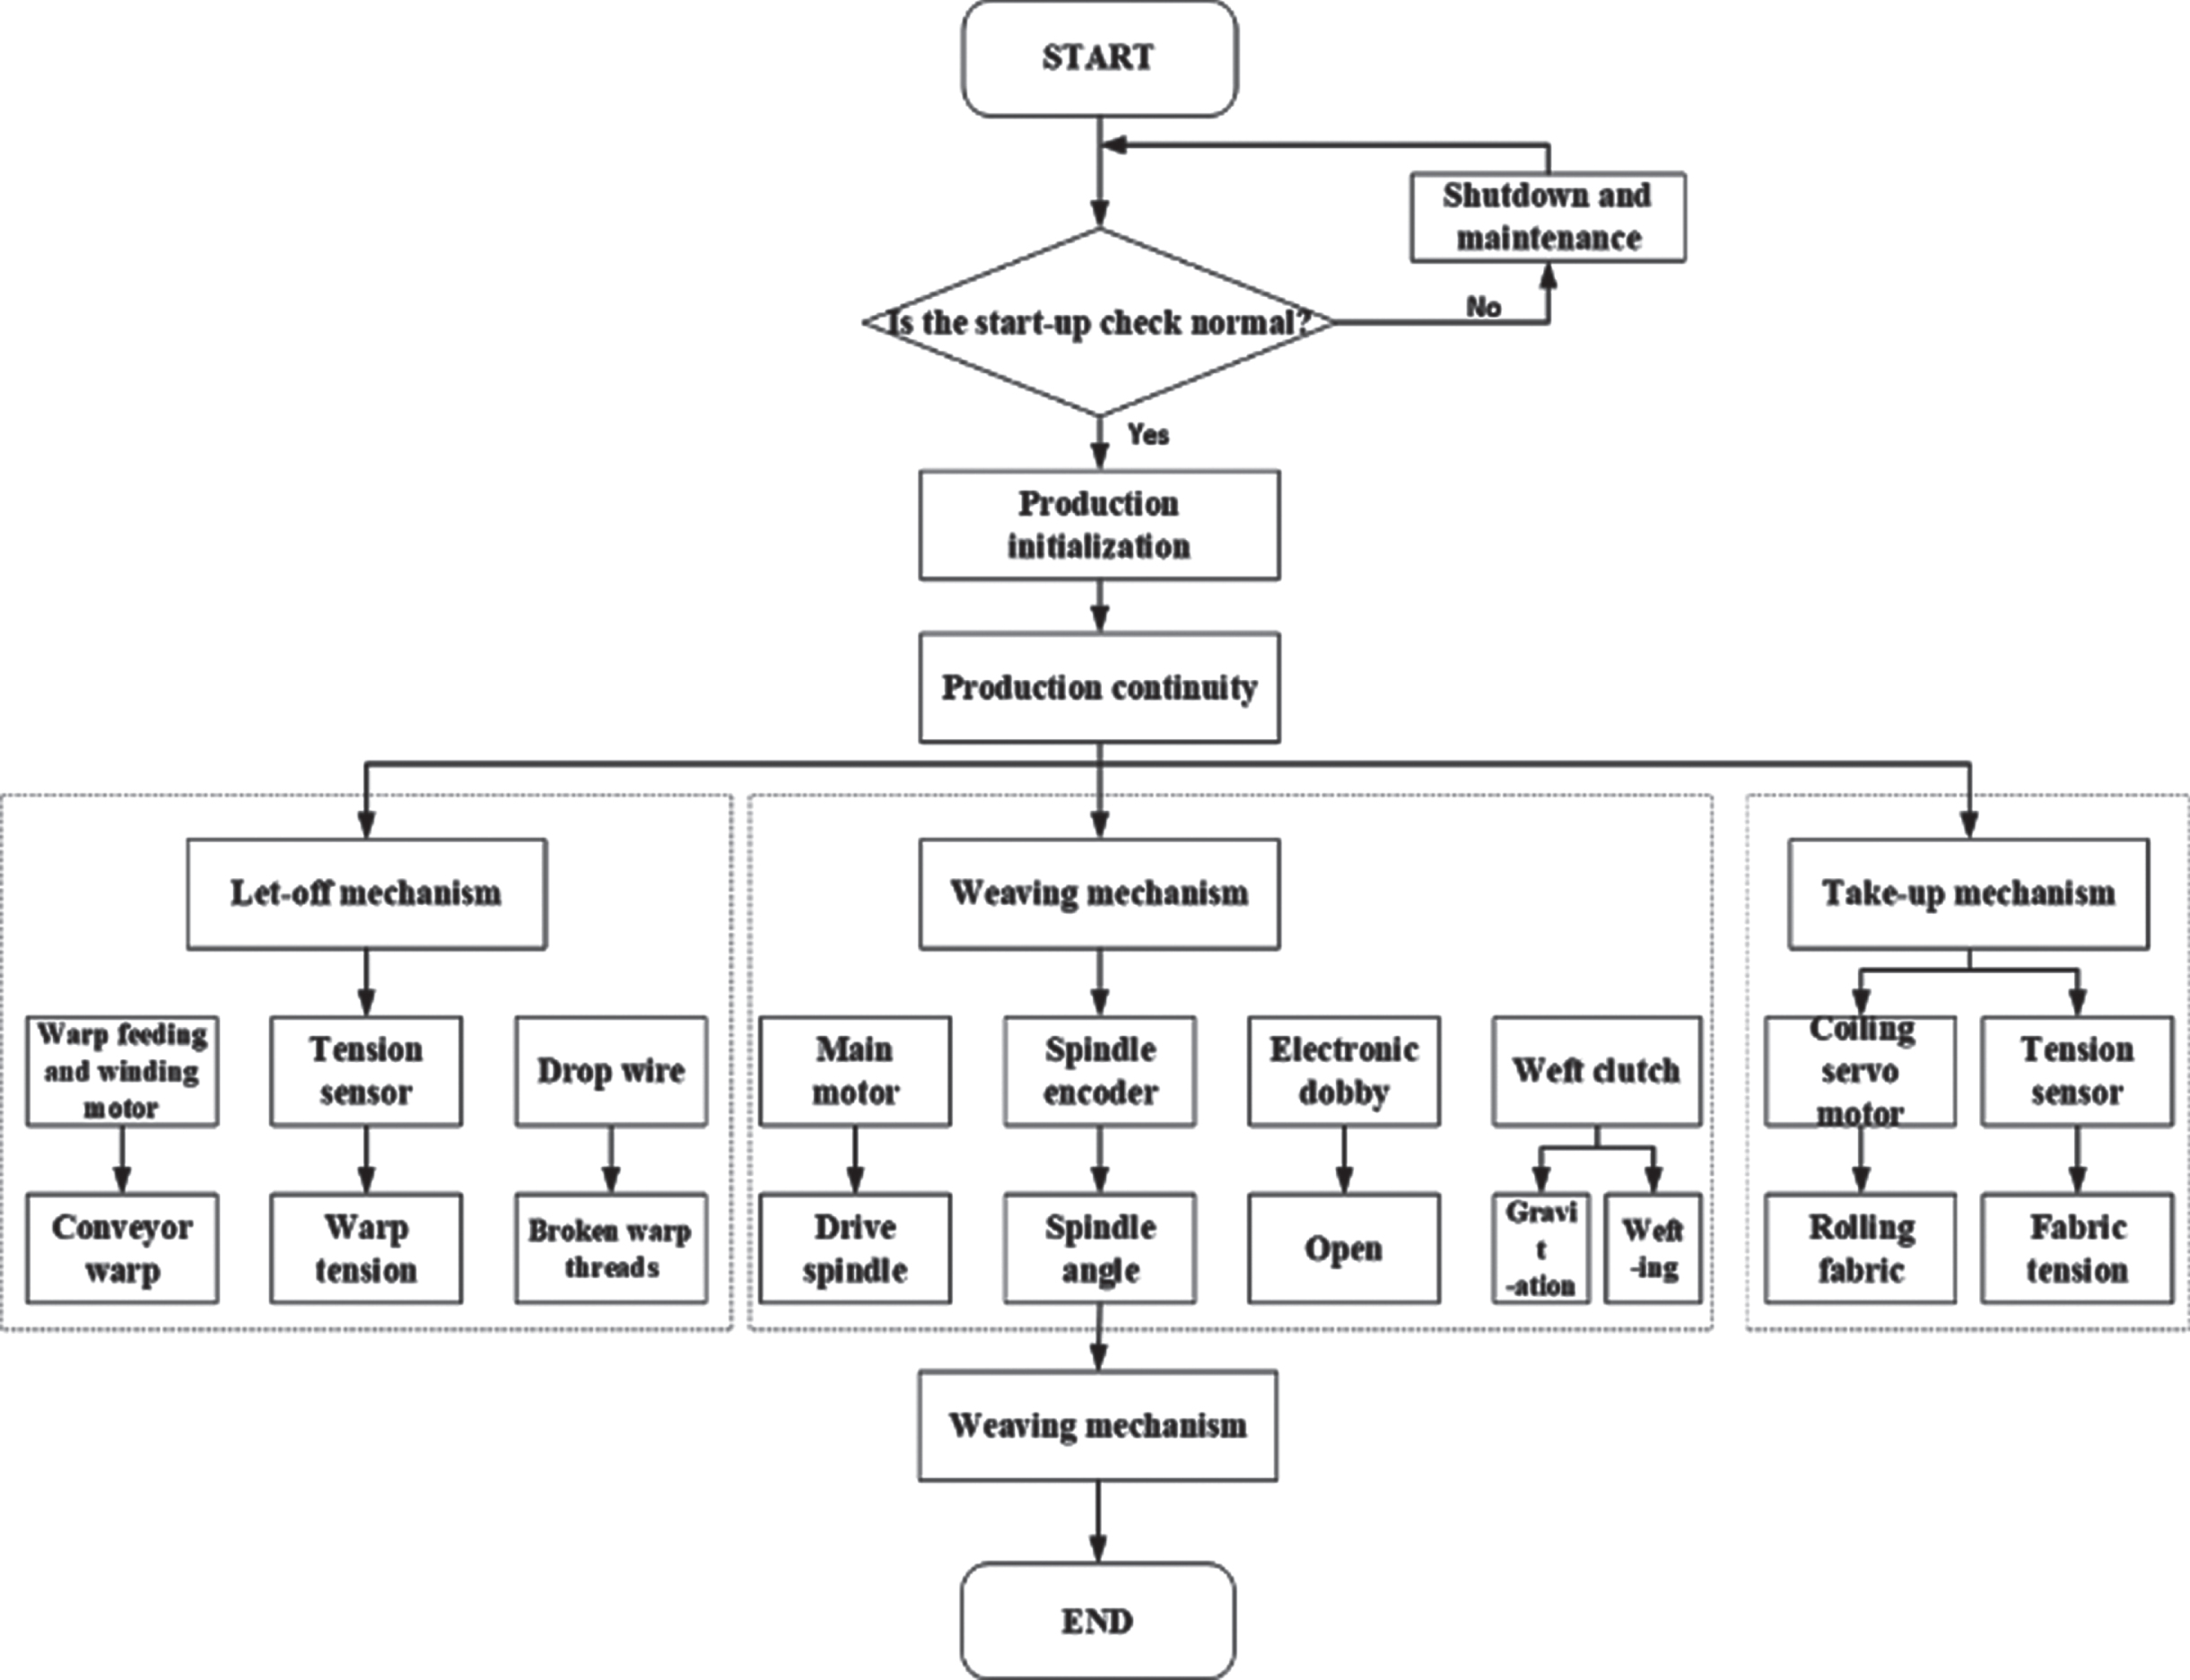
Flow chart of the weaving process of the rapier loom.
In the let-off mechanism, tension sensors detect the warp tension in real time and transmit the warp tension signal to the control system of the rapier weaving machine. The control system indirectly regulates the speed of the warp feeding and winding motor by controlling the warp feeding servo motor, thus maintaining the warp tension within a reasonable range for the initial production setting. Each warp yarn is suspended through the drop wires. If the warp yarn is broken, the drop wires fall and a fault signal is sent to the control system.
The weaving mechanism is the most complex part of the continuous production weaving process. The weaving machine control system sends control signals to the electronic dobby mechanism to control the heald frame movement to form the opening. The weft storage selects the yarn according to the initial setting and transports the weft to the weft feeder by means of the weft guide cam. The weft feeder drives the weft yarn through the warp opening to the weft catcher, where it is fed back to the shuttle opening. The upper and lower positions of the heald frame are exchanged to form a new opening, and the cycle repeats itself to form a fabric with interlocking warp and weft yarns. When the heald frame is in the maximum opening position, the weft clutch controls the weft feed and weft take-up saber heads to complete the weft feeding and beating action. At 10°, the heald frame starts to open on both sides and the weft picking finger is extended; at 57°, the heald frame opens to its maximum position, the weft picking finger is in place, the weft feeder starts to feed the weft by clamping the weft yarn, and the weft picker is extended for weft picking; at 156°, the heald frame switches to the flat position; at 160°, the weft picking finger is retracted; at 156°, the weft picking finger is retracted. The weft selection finger starts to retract at 156°; at 220° the retraction of the weft selection finger is completed; at 285° the weft is drawn in and the reed drives the weft yarn into the weaving opening; at 310° the heald frame reaches the heald flat state.
In the winding mechanism, the fabric interlaced with warp and weft yarns in the weaving mechanism is pulled out and rolled onto the winding axis to form a roll of finished fabric. In this mechanism, the fabric tensioning force needs to be kept within a suitable range to ensure that the finished fabric can be rolled into a neat roll. The tension sensor detects the fabric tension in real time and transmits the fabric tension signal to the control system, which indirectly realizes the speed adjustment of the winding motor by controlling the winding servo motor, so that the fabric tension is maintained within the reasonable range set by the production initialization. A sketch of the process structure of the continuous production weaving link of the rapier loom equipment is shown in Fig. 3.

Diagram of the process structure of the continuous production weaving link.
Based on the above analysis of the mechanical structure and process of the rapier loom equipment, the equipment failures are analyzed and studied in three parts in this section: start-up inspection subsystem failures, weaving subsystem failures and warp feeding and winding subsystem failures.
The main faults of the start-up check subsystem include low oil level, insufficient oil pressure, oil level sensor failure, oil pressure sensor failure, slow clutch not in place, slow clutch not reset, slow clutch failure, main clutch not in place, main clutch not reset, main clutch failure and proximity switch failure, etc. The signs of failure and causes of failure are shown in Table 1.
Signs of failures and causes of failures in the Start-up inspection subsystem
Signs of failures and causes of failures in the Start-up inspection subsystem
The main faults of the warp feeding and winding subsystem include too tight tension, too loose tension, large tension fluctuation range, tension sensor failure, warp feeding and winding motor failure and fabric winding motor failure. The fault signs and fault causes list is shown in Table 2.
Signs of failures and causes of failures in the warp feeding and winding subsystem
The main faults of the weaving subsystem include main encoder fault, main slow motor fault, weft departure fault, heavy weft, shrinking weft, empty weft, fast car can’t start, loom positioning timeout and loom stop timeout, etc. The list of failure signs and causes of failure is shown in Table 3.
Signs of failures and causes of failures in the weaving subsystem
Fault tree theory
Fault tree analysis is an analytical method for diagnosing complex systems by constructing fault trees. It completes the process of logical reasoning, combining expert experience, sorting out the causes of the complex failure of the top event, and comprehensively recording and linking the cause events that may cause the failure. It graphically expresses the relationship between the fault phenomenon and the cause of the fault in the form of a tree diagram, which visually and clearly expresses the logical relationship between the top event and the bottom event.
The basic structure of a fault tree is composed of a top event, a logic gate, an intermediate event, a logic gate, and a bottom event in a tree structure from top to bottom. By analyzing the causes and conditions that would directly cause the top event to occur, the intermediate event and the logical relationship between the top event and the intermediate event can be determined, and the first level of the tree is built. Taking this as an example, the tree is analyzed downward layer by layer until the root cause of the fault, i.e., the bottom event, is finally identified that cannot be analyzed further downward. The basic elements of the fault tree are shown in Table 4.
The basic elements of fault tree
The basic elements of fault tree
The analysis of the fault tree mainly consists of qualitative and quantitative analysis. In the diagnosis process, qualitative analysis of the fault tree can reason out the various causes of this fault in the system and their combination patterns, i.e., find the minimum cut set. The minimum cut set allows to identify the weak components of the faulty equipment, and to optimize and improve the system reliability by finding the potential causes of system failure. The minimum cut set is the combination of the minimum number of underlying events that trigger the occurrence of the top event. Usually the more minimum cut sets, the higher the probability that something can happen and the lower the system reliability.
In a complex thing or a complex process, the interplay of multiple contradictions and the causality of their intrinsic motion processes can be represented by Boolean algebra. Therefore, Boolean algebra is used for the quantitative calculation of fault tree diagnosis model. In Boolean algebra, the symbol “+” characterizes the logical or, indicating that the relative position of the two contradictions connected by this symbol is parallel; the symbol “×” characterizes the logical with, indicating that the relative position of the two contradictions connected by this symbol is series [19].
The quantitative analysis of the fault tree can obtain the probability of this fault occurring in the system and provide decision support for manual handling of the fault, performing maintenance, etc. The quantitative calculation of the fault tree diagnosis model is mainly to calculate the failure probability and importance to achieve rapid fault identification and location. The probability of failure refers to the probability of failure of each component of the fault tree model, and the importance refers to the degree of influence of the bottom event on the top event.
Assume that the fault tree diagnostic model has n different bottom events that do not intersect with each other. Introduce the logical variable X i , which indicates the state of whether the ith bottom event occurs or not.
Similarly, the logical variables Φ, Φ (X) = Φ (X1, X2, X3, …, X n ) is introduced to indicate the state of whether the top event T occurs or not.
Where, k denotes the number of minimum cut sets in the fault tree model.
The expression for the minimum cut set structure function is defined from Equation 3.3 as shown in Equation 4:
Where, g is the failure probability equation of the system.
The bottom event importance describes the magnitude of the influence of the bottom event on the top event. The three importance levels of the bottom event are probability importance, structural importance and critical importance.
The probabilistic importance of the bottom event is the effect of the failure of the bottom event on the system. The probability of occurrence of the bottom event i is q
i
, and the degree of change in the probability of occurrence of the top event T caused when q
i
changes is called the probabilistic importance of the bottom event i, denoted as
Where, Q is the probability of failure of the whole system,
The bottom event structure importance expresses the importance of a certain bottom event in the system fault tree structure. Assuming that the fault tree diagnostic model has n bottom events, when bottom event i occurs, the occurrence or non-occurrence status of the other n-1 bottom events is uncertain, and there are 2n-1 possible states. Therefore, the structural importance coefficient of bottom event i is shown in Equation 10:
The critical importance of the bottom event is the ratio of the rate of change of the failure rate of the whole system to the rate of change of the failure rate of the bottom event that causes that change. The degree of change in the rate of change in the probability of occurrence of the top event T caused by a change in the probability of occurrence of the bottom event i is called the critical importance of the bottom event and is denoted as I c (i). The mathematical expression is shown in Equation 11:
After analyzing the importance of the events at the bottom of the rapier loom fault tree, the equipment components and parts can be ranked according to their importance, thus providing a reference for the importance and weakness of the rapier loom for daily maintenance and repair.
Probabilistic neural network is a feedforward network widely used in the field of pattern recognition [20], and in contrast to traditional neural networks, probabilistic neural networks do not have learning or training rules, assigned weights for the connection layers, and predefined convergence rules. The structure of the probabilistic neural network algorithm clearly reflects the basic components of the algorithm and the corresponding intrinsic mapping relationships between the components. The probabilistic neural network consists of four parts, namely the sample data set input layer, the fault type classification pattern layer, the fault probability summation layer, and the fault result output layer, and its structure is shown in Fig. 4 [21].
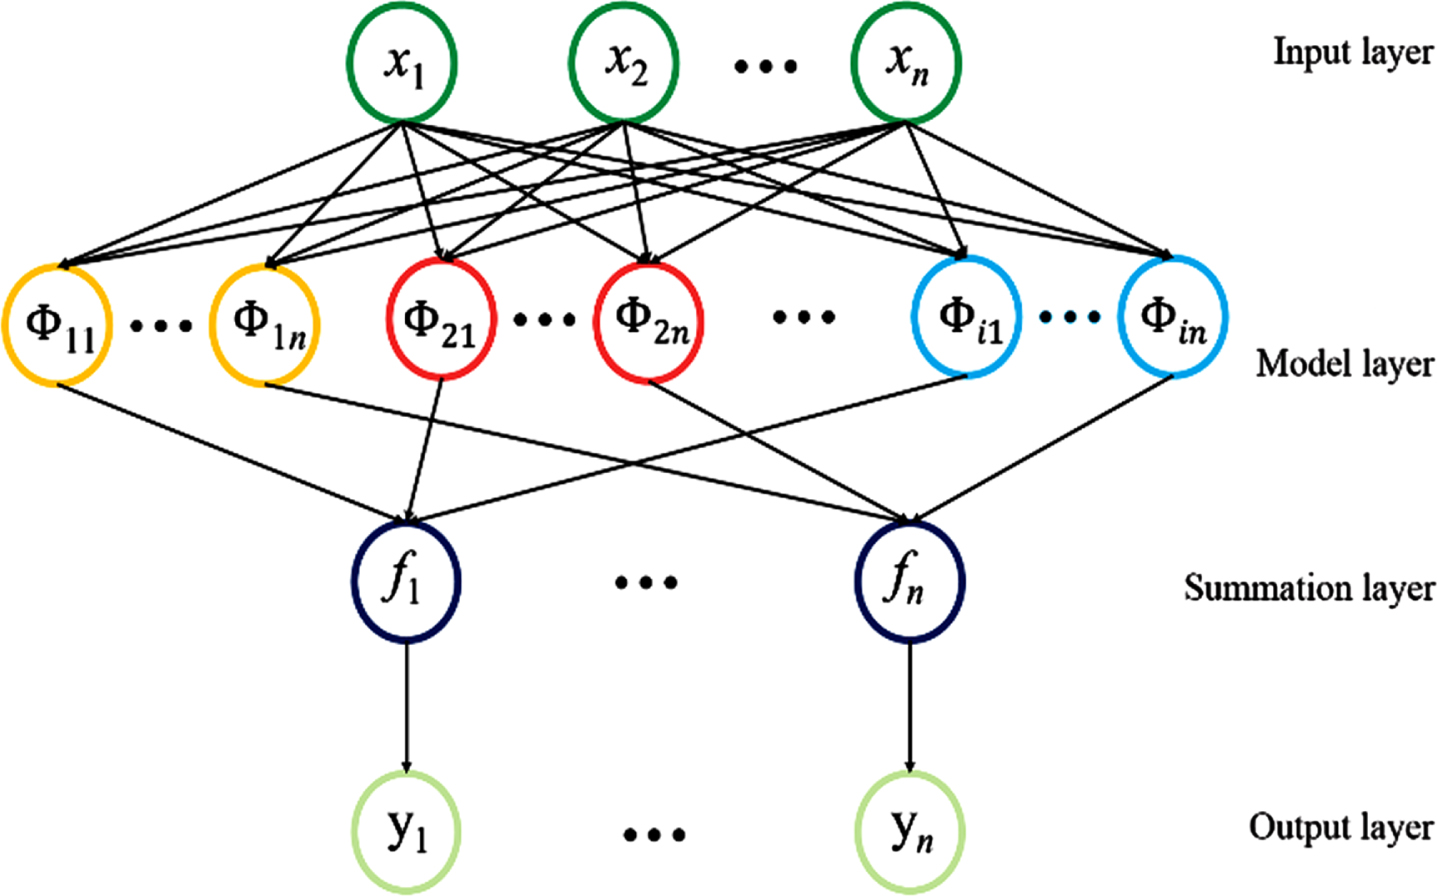
Probabilistic neural network structure diagram.
The structure diagram shows that from the fault type classification pattern layer to the fault probability summation layer is sparsely connected, and the other two layers are fully connected.
1). Sample dataset input layer: the number of layers consists of the number of features of the fault sample dataset. If the input training sample has n features, the input feature vector X can be represented by a matrix with n dimensions X = [x1, x2, …, x n ]. No computation is performed in this layer, and only the fault dataset is passed to the fault type classification pattern layer;
2). Fault type classification pattern layer: the number of layers in this layer is the same as the number of layers in the input layer of the sample dataset, again determined by the number of features in the fault sample dataset. The mode layer is connected by radial basis nonlinear vector connection computation to obtain vectors for vector connection computation and weight mapping of the incoming and outgoing input mode network layers and radial basis noninput mode layer, respectively [22]. The Gaussian function value of the j-th mode cell in the class i fault data set feature is calculated and its expression is shown in Equation 12:
3) Fault probability summation layer: This layer consists of the categories of the sample data set, and each summation unit aggregates and averages the outputs of the pattern units belonging to the same category. The output of the i-th summation unit can be expressed as:
4) Fault outcome output layer: this layer is a decision output layer based on Bayesian optimal decision rules [23], assuming that the prior probability of each fault feature class in the input layer is the same, the neurons in the fault outcome output layer can determine the class X of the input vector by Equation 14:
The fault diagnosis system uses an algorithm combining fault tree and probabilistic neural network for diagnostic reasoning. First, the fault tree model of each key subsystem is established, and the minimum cut set of events is obtained by using the qualitative analysis of the fault tree. The minimum cut set corresponds to the bottom event fault cause of the fault tree, and also corresponds to the failure mode of the probabilistic neural network. After that, whether the minimum cut set occurs or not is used as the output of the probabilistic neural network, and the sign signals corresponding to the cause of the fault and the association between them are combined as the input of the probabilistic neural network. The network is trained to learn by inputting a large number of training samples, and then the tested samples are input into the network for fault diagnosis to obtain the probability of occurrence of each fault mode. The fault mode with the highest probability is output to get the diagnosis result, and then judge whether the diagnosis result is correctly written into the database. The flow chart of this fault diagnosis model is shown in Fig. 5.
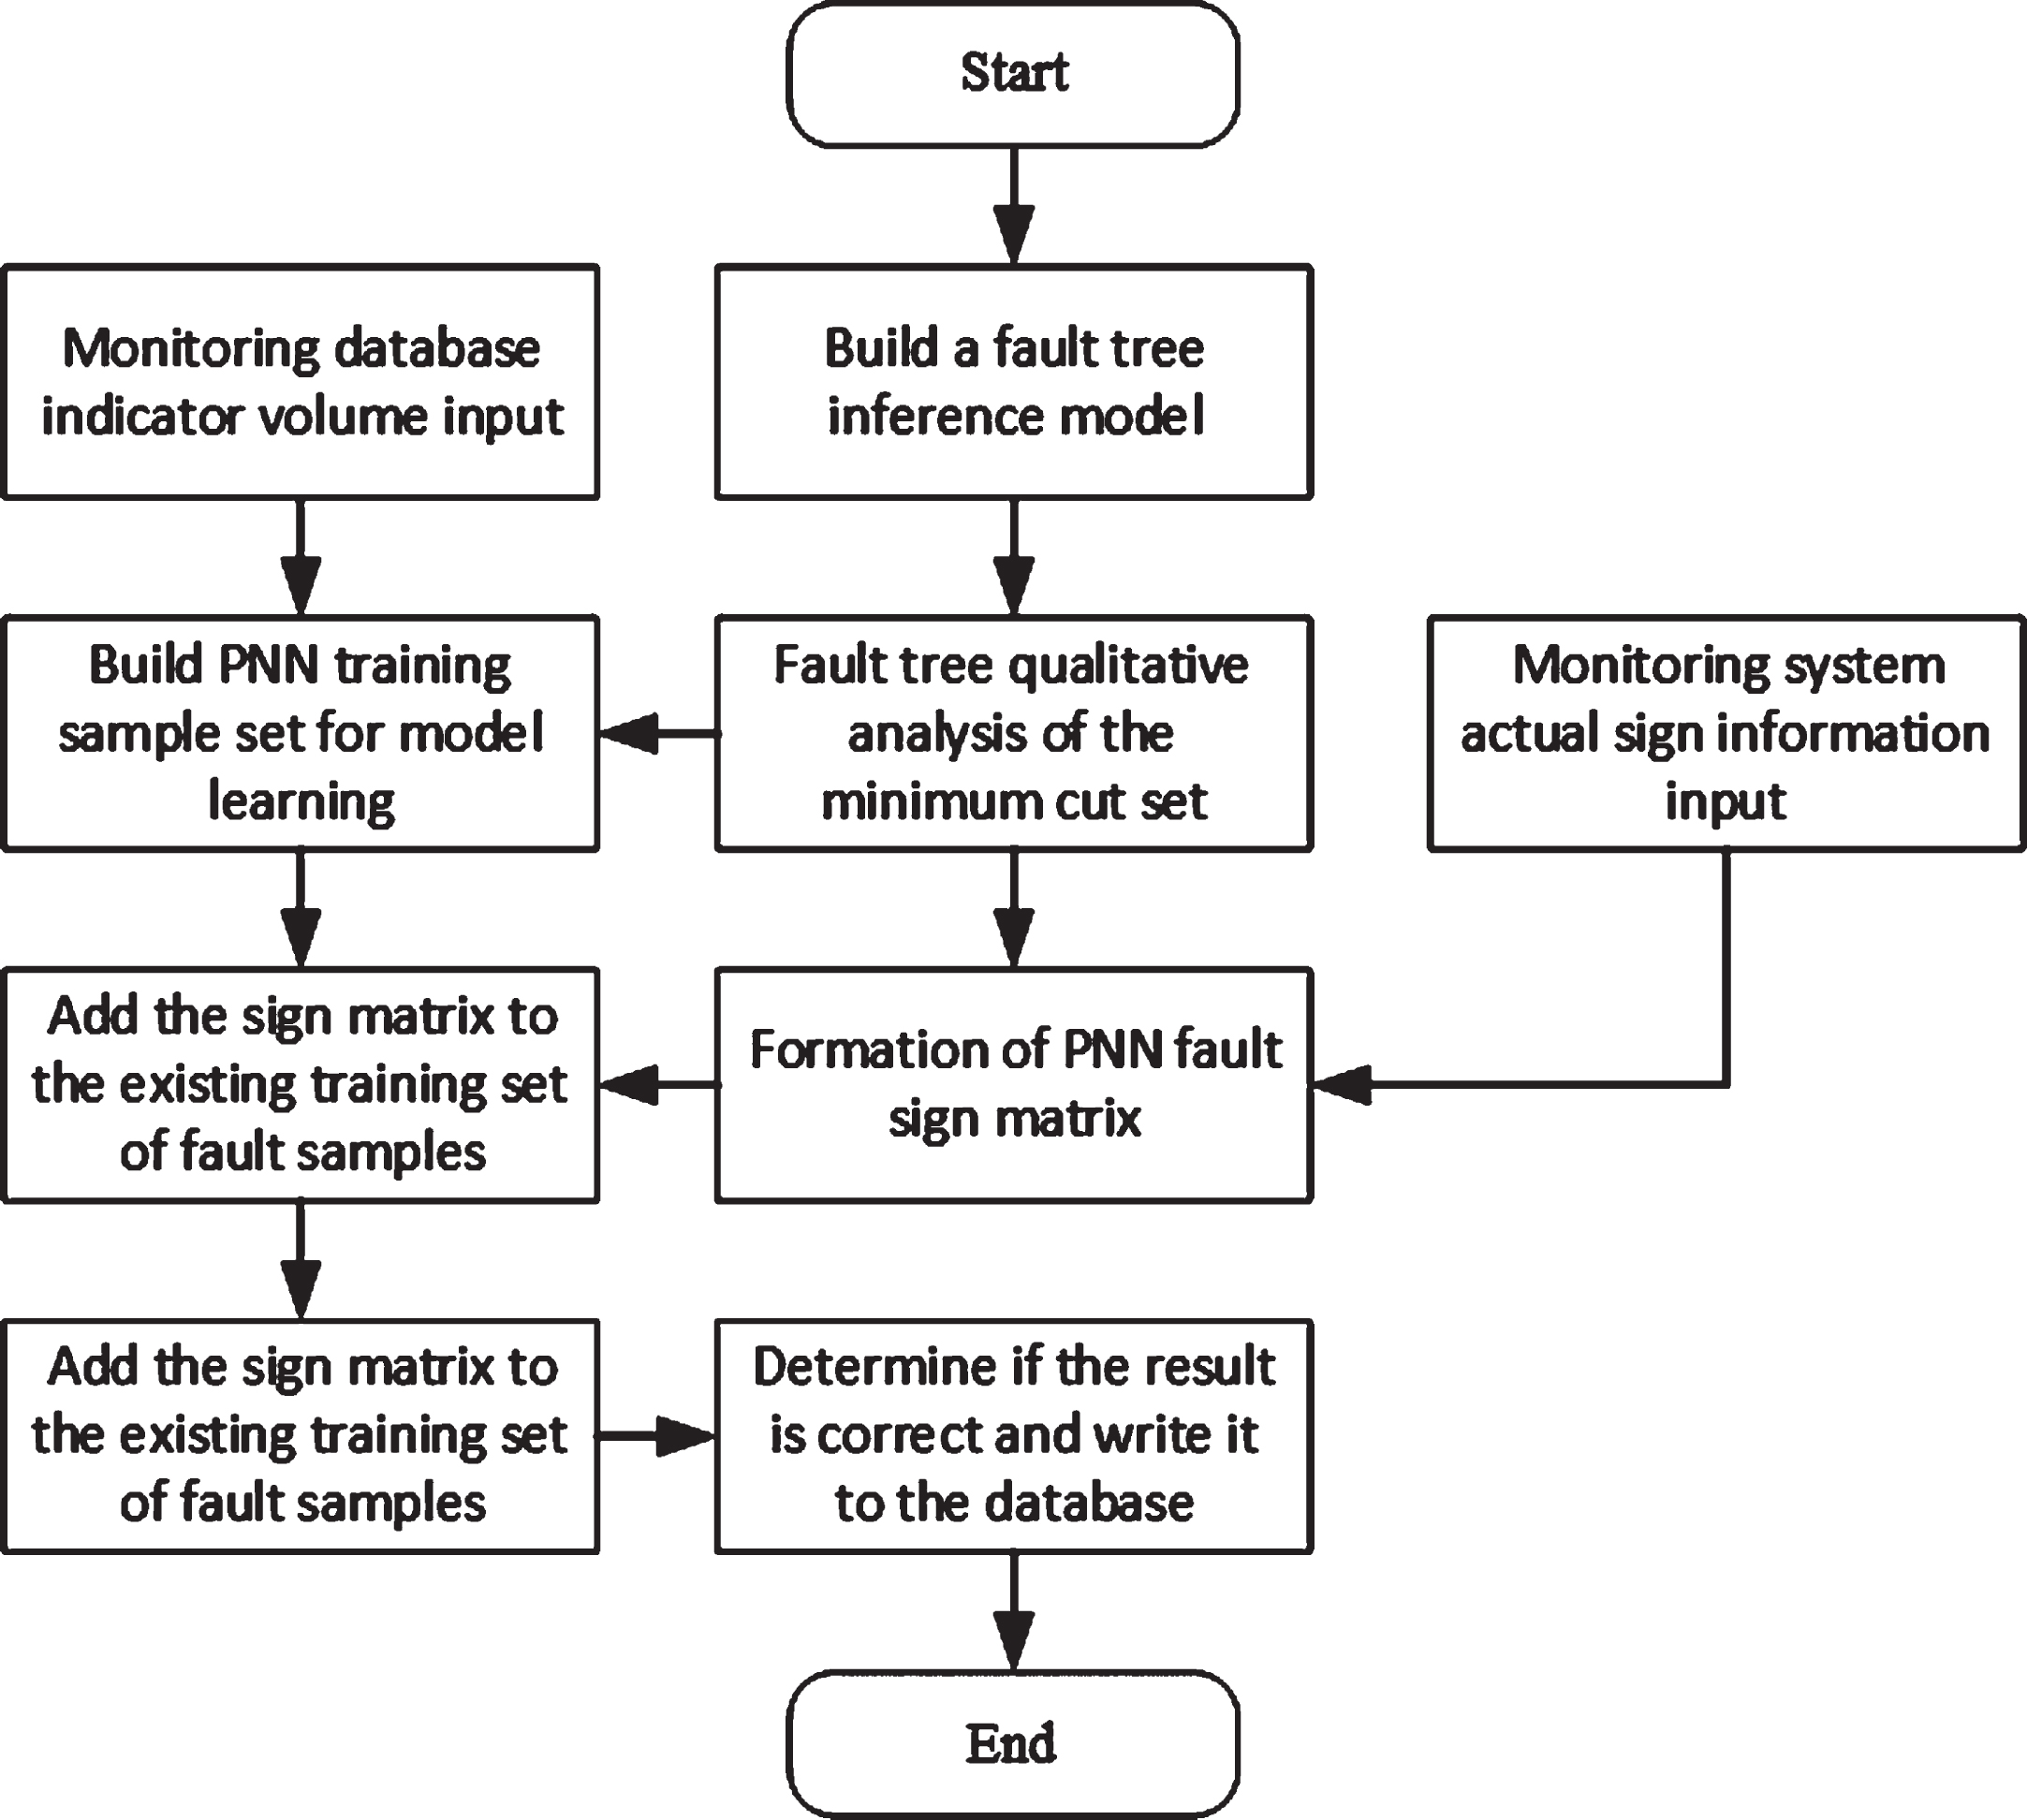
Flowchart of fault diagnosis system.
The specific process is as follows:
Step 1: The rapier loom sample dataset was constructed. A rapier loom fault tree model is established, and a model fault sign data set is constructed. The system data is monitored in real time and a new status dataset is constructed for the monitoring system. The above two sample datasets are integrated to form the rapier loom sample dataset.
Step 2: The rapier loom fault sign matrix is created and normalized.
Suppose the sample dataset contains n features, and each feature contains m sets of feature data. A sample data set matrix X with m rows and n columns is constructed, and the X expression is shown in Equation 15.
For example, x86 denotes the eighth set of data in the sixth fault feature in the sample data set.
The sample feature matrix is normalized to eliminate the effect of differences in the values of different features in the data set on the results. The sample normalization matrix Nor expression is shown in Equation 16.
Where, x i , max = max(x ji ) (j = 1, 2, …, m) x i , min = min(x ji ) (j = 1, 2, …, m).
Step 3: Probabilistic neural network training using normalized fault sign matrix.
The rapier loom fault sign matrix is normalized to the fault type classification pattern layer. In this layer, the fault sample data set is trained for fault sign classification. Assuming that there are n fault signs in the sample dataset and each set of fault signs contains p sets of data, the expression of the normalized matrix of the sample dataset is shown in Equation 21:
Where, s ij denotes the initial probability that the ith measured sample belongs to classification j after the summation.
The failure probability threshold is specified. The probability of failure signs below the failure probability threshold is output as 0, and the probability of failure signs above the failure probability threshold is output as 1. The final output results in a matrix of 1 rows and n columns.
Step 4: The probability importance of the fault cause corresponding to the fault sign with output result of 1 is calculated. And according to this result, the fault diagnosis result and the fault location ranking order suggestion are output. Finally, the complete calculation process of the fusion algorithm model is completed.
Fault tree modeling of rapier looms
The top event of the fault tree is that the rapier weaving machine does not work properly. Combining the rapier weaving machine mechanical structure composition, weaving process and fault mechanism, the rapier weaving machine system fault is divided into 3 intermediate events of the fault tree: start-up inspection subsystem fault, weaving subsystem fault and warp feeding and winding subsystem fault. Each intermediate event is then analyzed in detail, resulting in a total of 34 intermediate events and 73 bottom events. To facilitate the addition of new fault signs and causes in the system later, coding space is reserved in each subsystem. For the start-up inspection subsystem, the intermediate event code starts at M100 and the bottom event code starts at X100. The weaving subsystem has an intermediate event code starting at M200 and a bottom event code starting at X200. The intermediate event code of the warp feeding and winding subsystem starts at M300 and the bottom event code starts at X300. The fault tree of the rapier weaving machine is listed in Table 5.
List of rapier weaving machine fault trees
List of rapier weaving machine fault trees
The fault tree model of the rapier weaving machine start-up check subsystem is shown in Fig. 6.
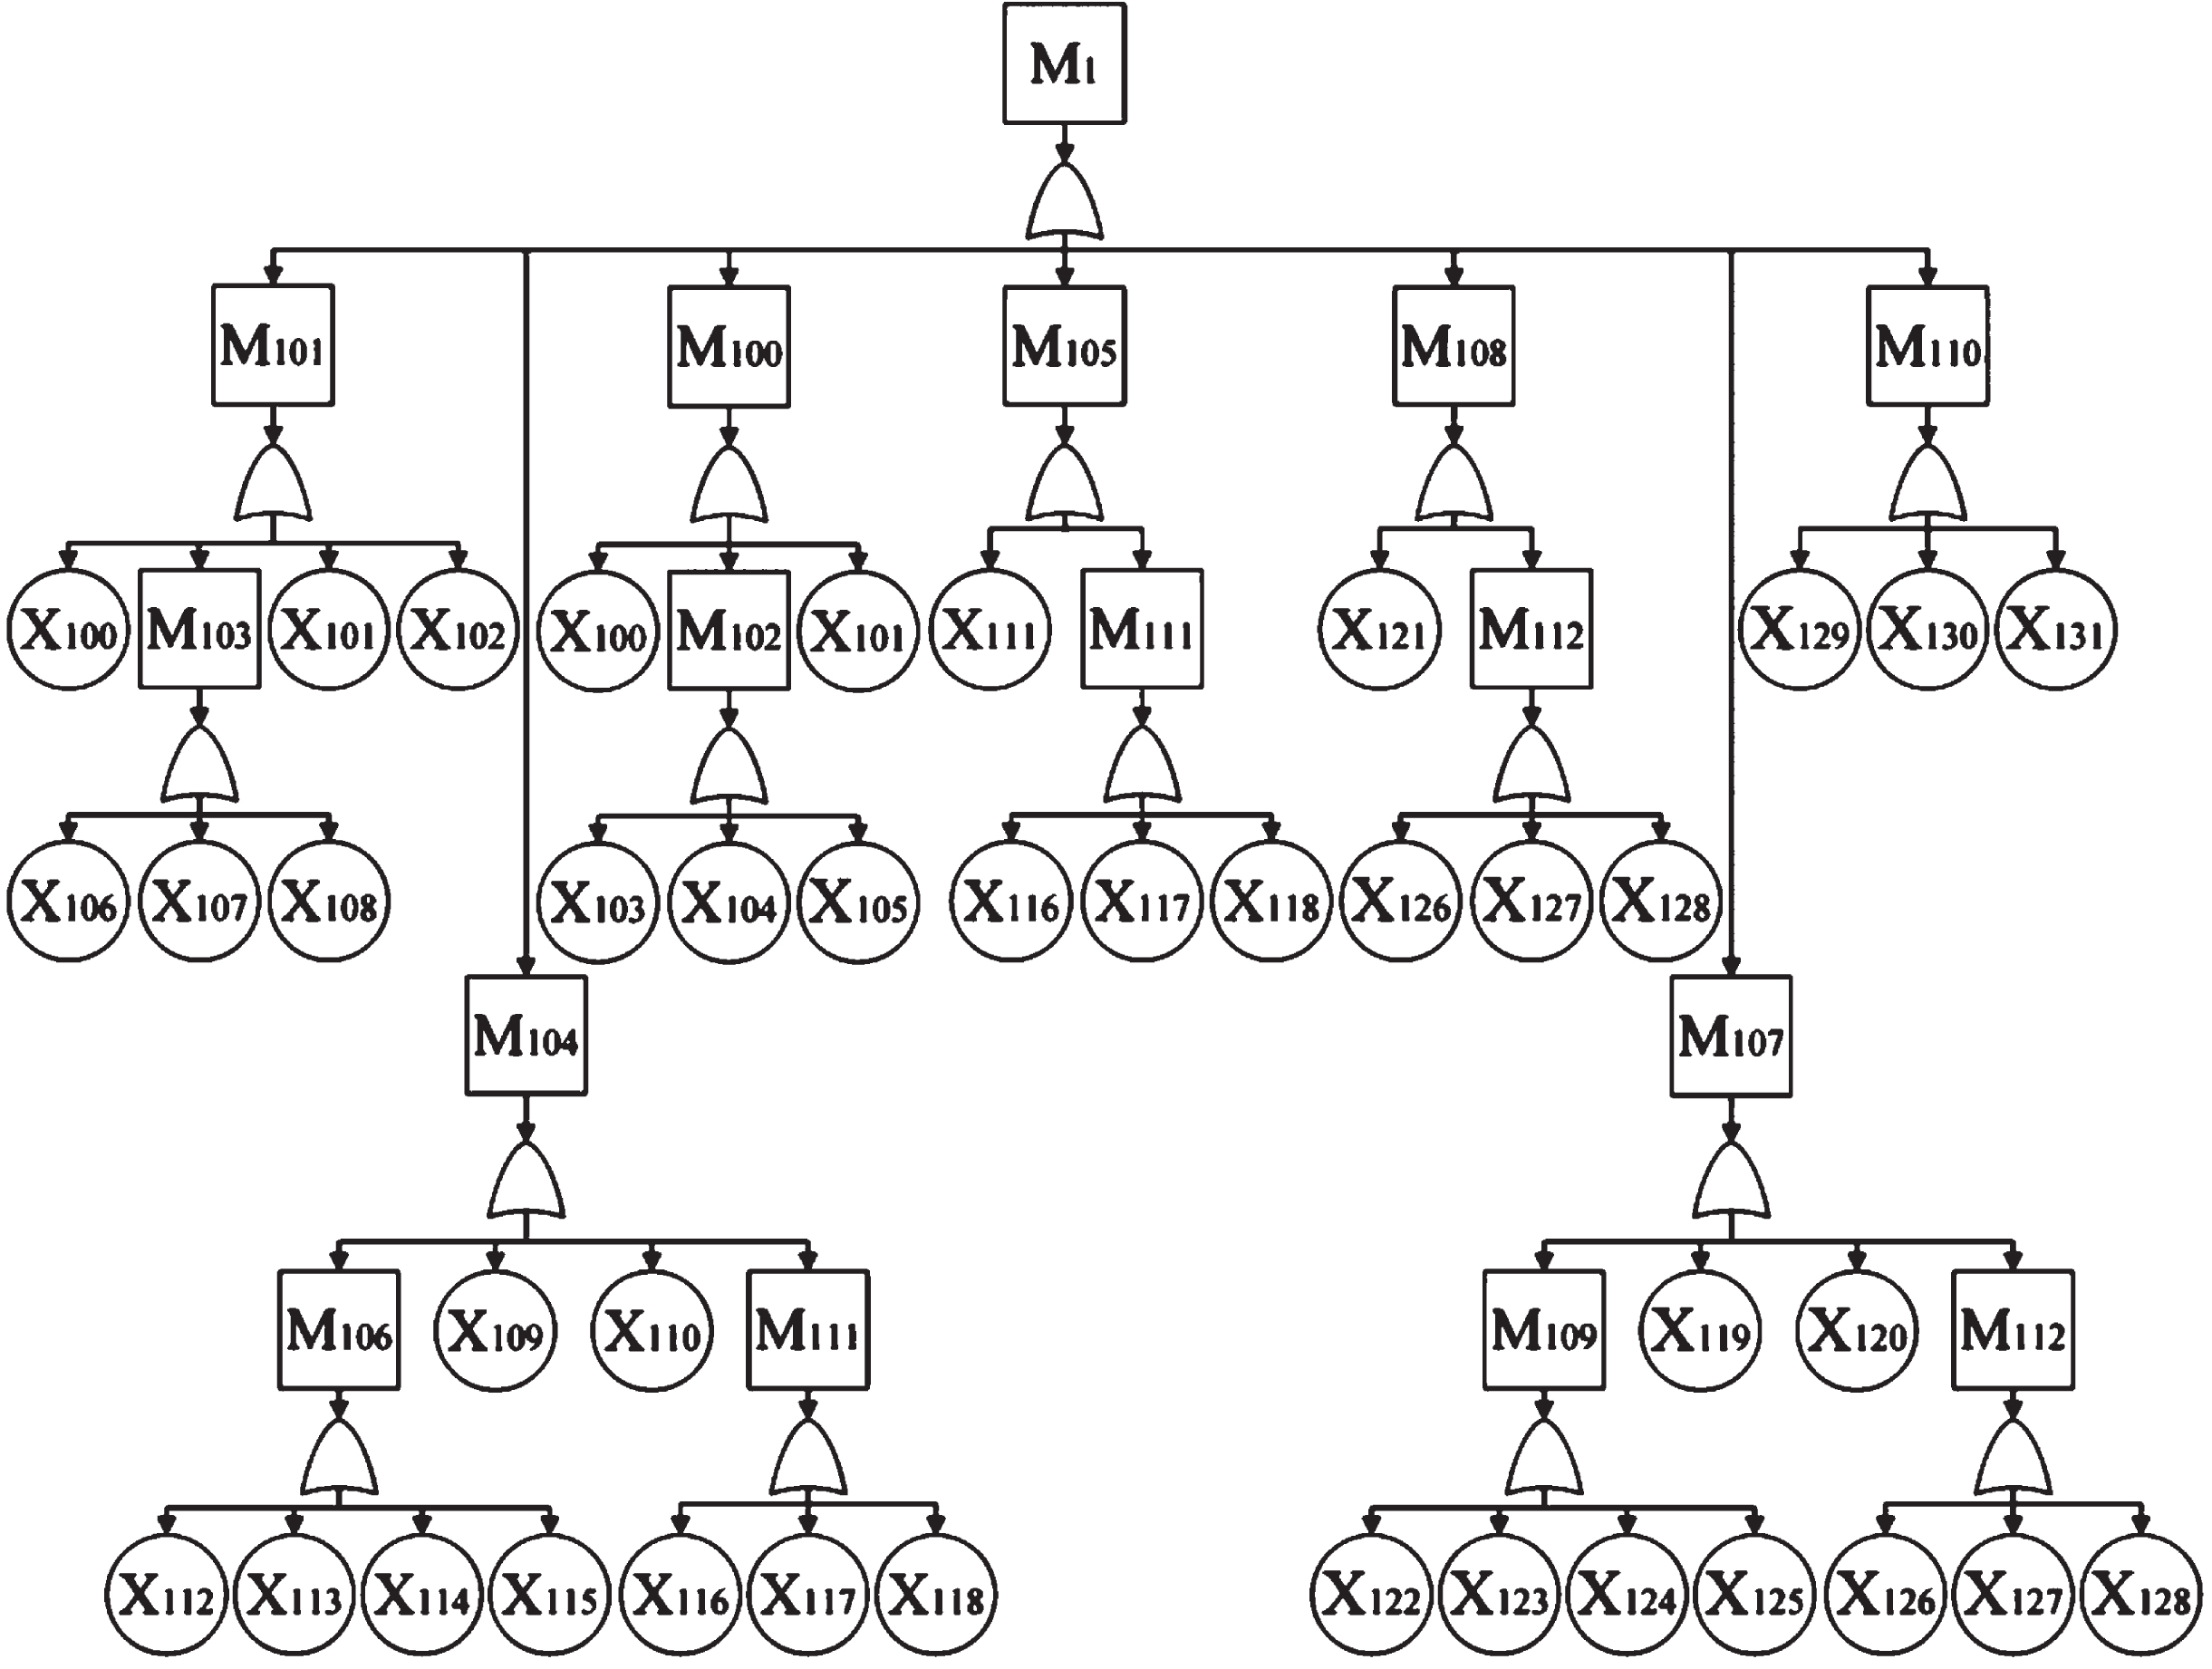
Fault tree of Start-up check subsystem.
The details corresponding to the fault tree of the rapier weaving machine start-up check subsystem are shown in Table 6.
Start-up check subsystem fault list for rapier loom
The fault tree model of the rapier loom weaving subsystem is shown in Fig. 7.
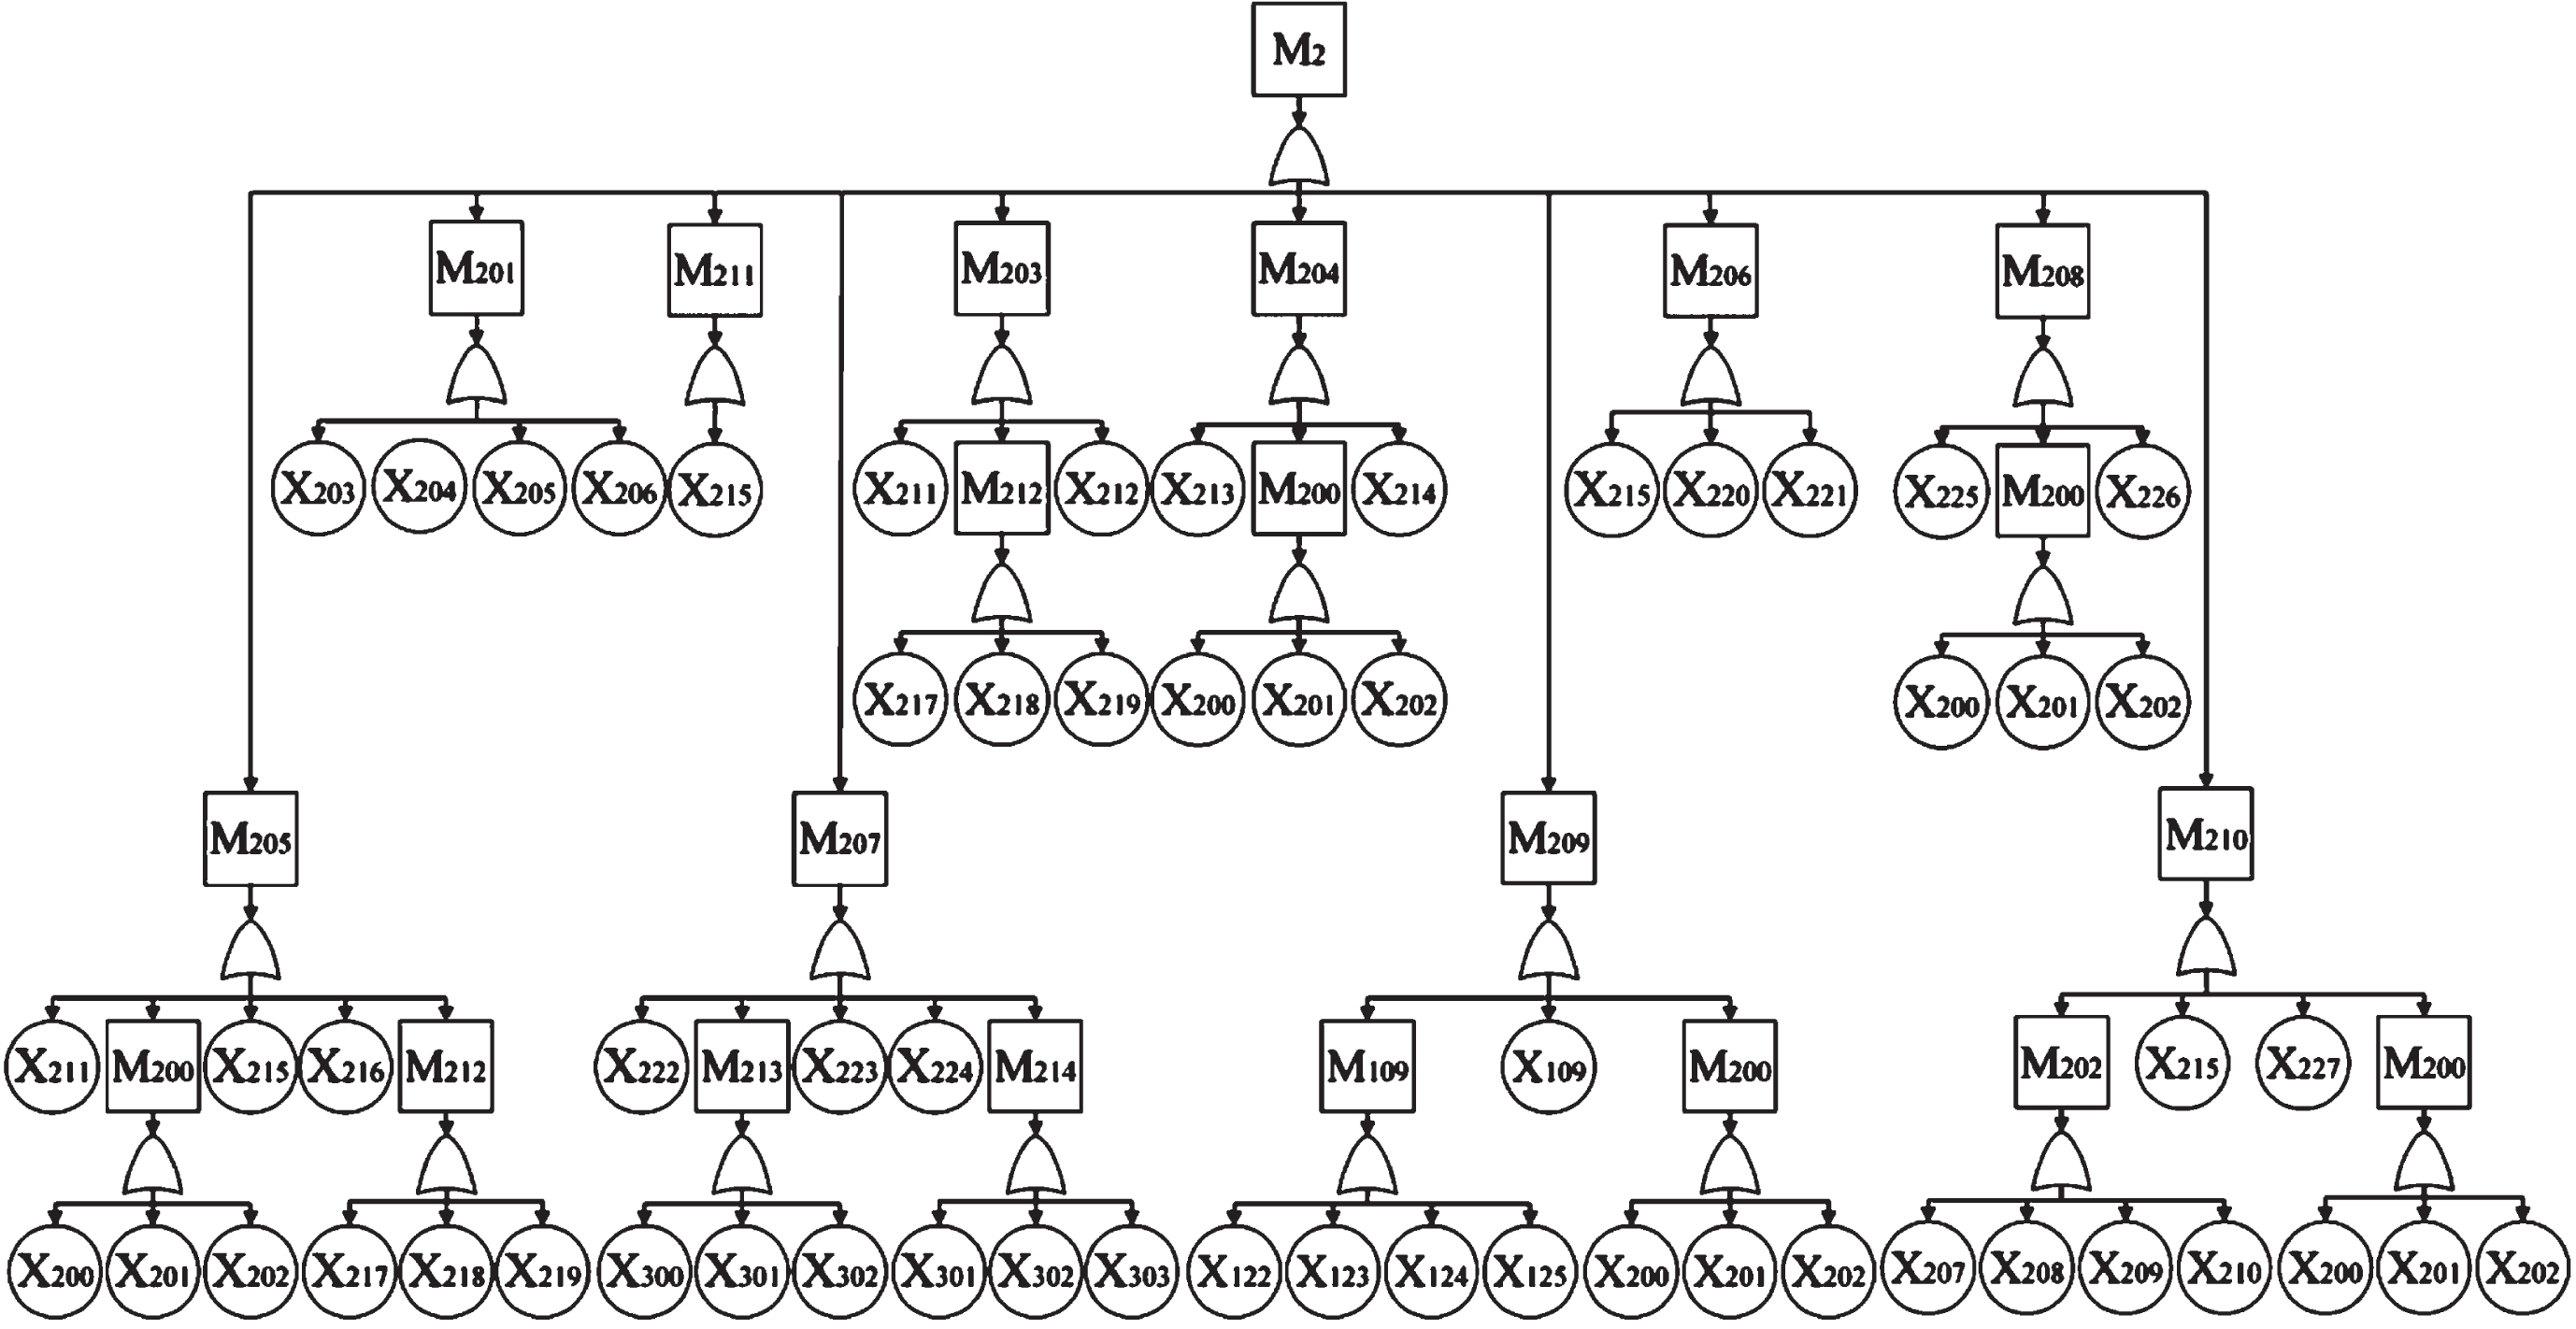
Fault tree of weaving Subsystem.
The details corresponding to the fault tree of the rapier weaving machine weaving subsystem are shown in Table 7.
Weaving subsystem fault list for rapier loom
The fault tree model of the rapier weaving machine warp feeding and winding subsystem is shown in Fig. 8.
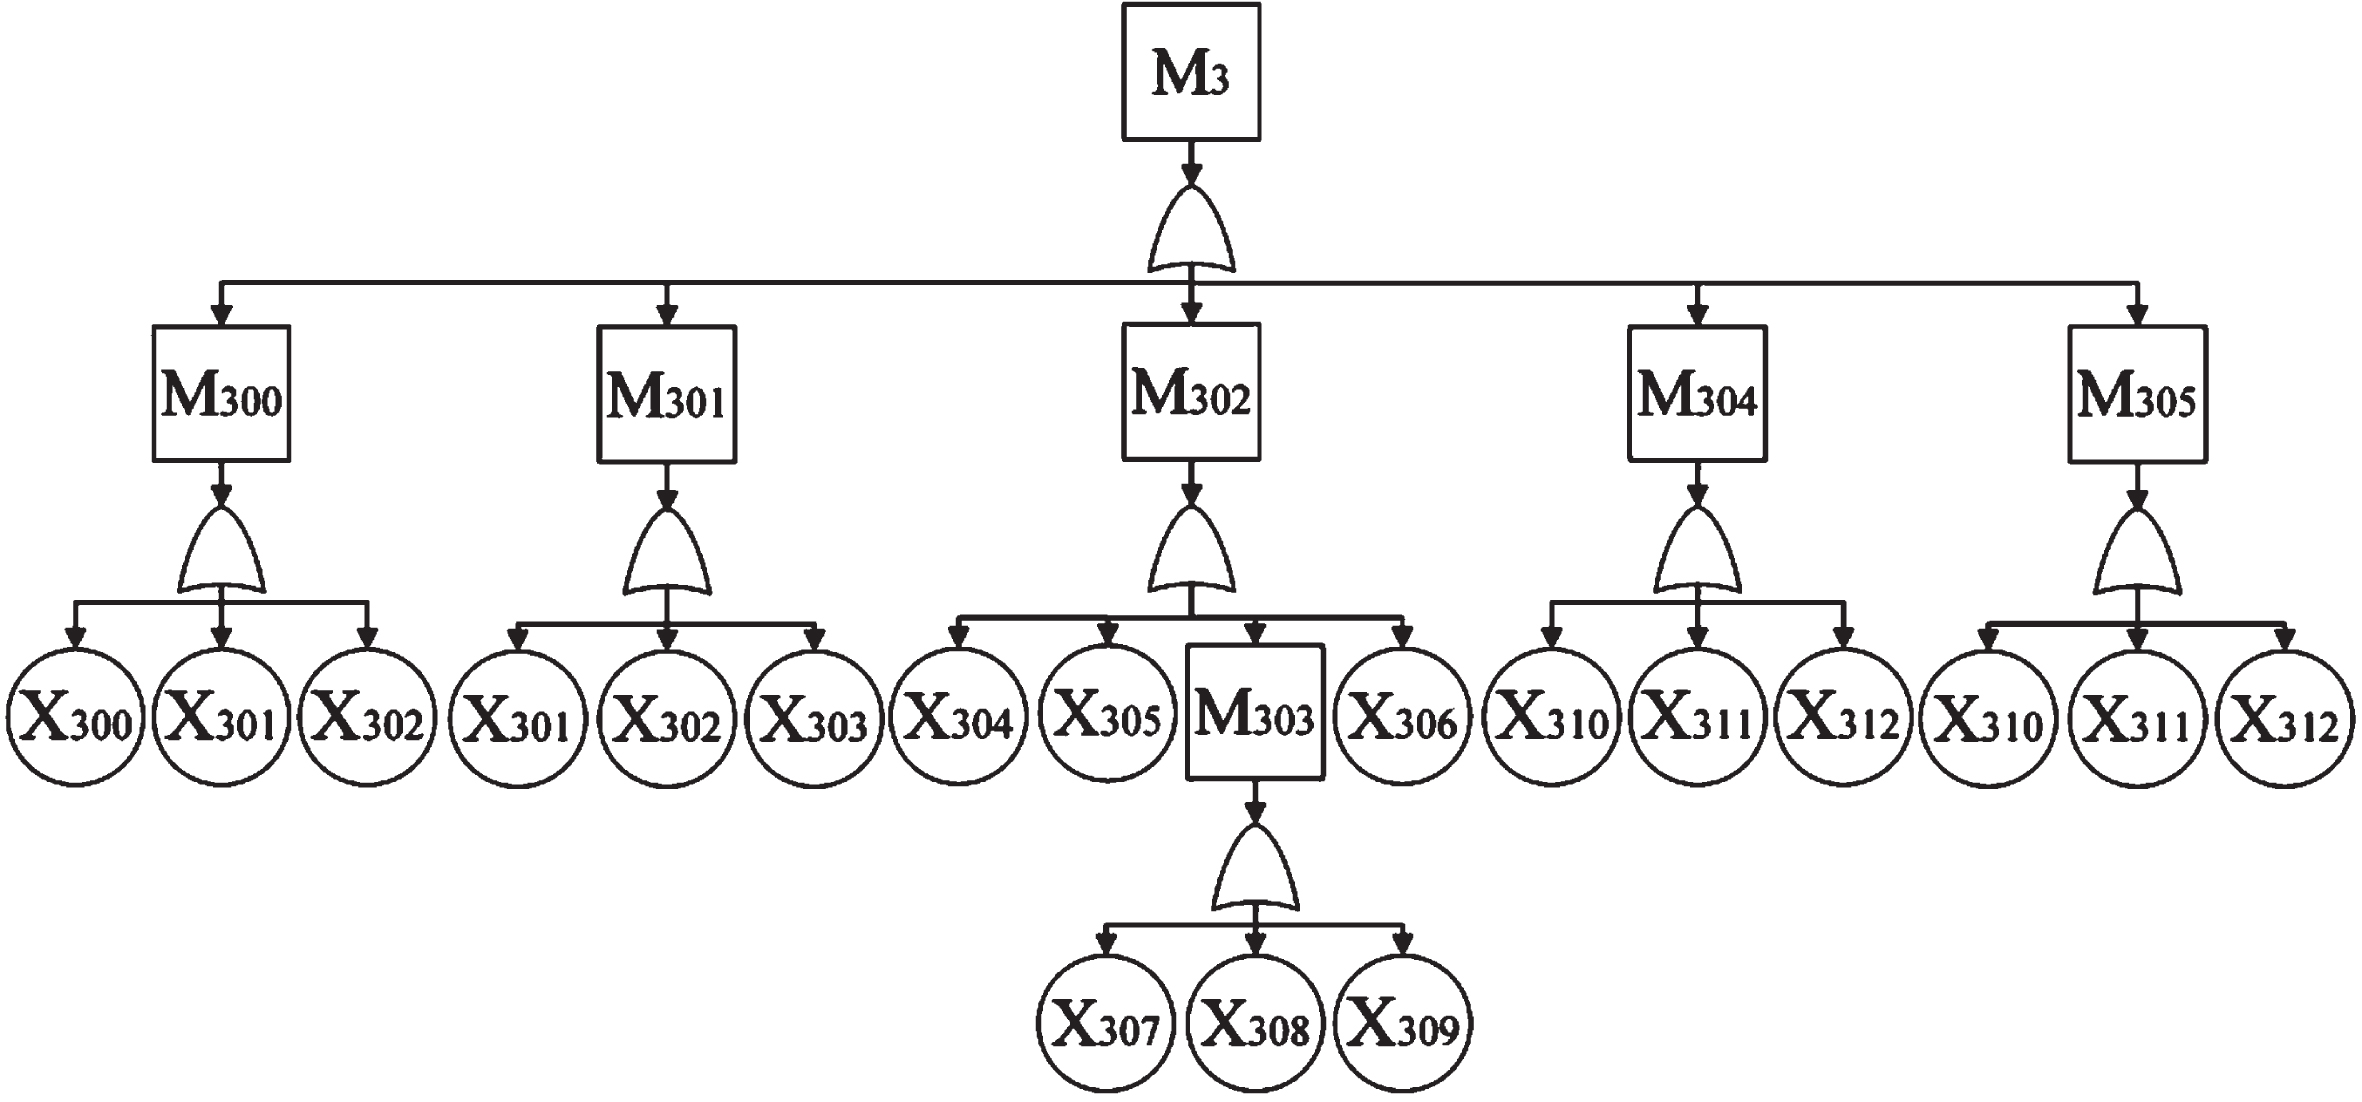
Fault tree of the warp feeding and winding subsystem.
The details corresponding to the fault tree of the rapier weaving machine weaving feed warp winding subsystem are shown in Table 8.
Warp feeding and winding subsystem fault list for rapier loom
There are many types of data involved in the rapier loom fault diagnosis system, this section selects some rapier loom fault sign data as the sample data set for the simulation experiment of rapier loom fault diagnosis fusion algorithm. A total of 11 rapier loom fault signs are selected as the rapier loom fault diagnosis sample data type in the fault sign collection, and grouped into h1 h11 in this order. 34 fault causes correspond to the above fault signs. The normal range of the fault sign samples is shown in Table 9, and the values are expressed by the output signals of the sensors.
Failure symptom status
Failure symptom status
The rapier loom sample dataset was divided into two parts: the training sample dataset and the test sample dataset. 1320 samples were randomly selected from the sample dataset as training samples and the remaining 330 samples were used as test samples. The normalized sample matrix of the training set is a matrix with 130 rows and 11 columns. The input layer of the probabilistic neural network for the rapier loom fault diagnosis training set is the same as the number of fault signs, with 11 neuron inputs. To ensure that the probabilistic neural network can correctly locate the fault signs, the training categories are categorized according to the number of fault signs, i.e., the pattern layer has 11 category layers. Each category layer has 130 neurons corresponding to the number of sample groups in the training set, and a total of 1430 neurons in the pattern layer correspond to the number of sample training sets. The summation layer calculates the probability of occurrence of each fault sign and has 11 neurons. The output layer outputs the result of the probability calculation of the fault sign, the probability is greater than 50% output 1, that is, the fault sign is determined to occur, otherwise set to 0. In summary, the training sample data set training structure, rapier loom fault diagnosis training set probability neural network structure is shown in Fig. 9.

Training set probabilistic neural network structure diagram.
The training effect of pattern classification recognition for the training sample datasets is shown in Fig. 10. There are 130 sets of samples for each group of fault signs and a total of 1430 datasets for 11 groups of fault signs.
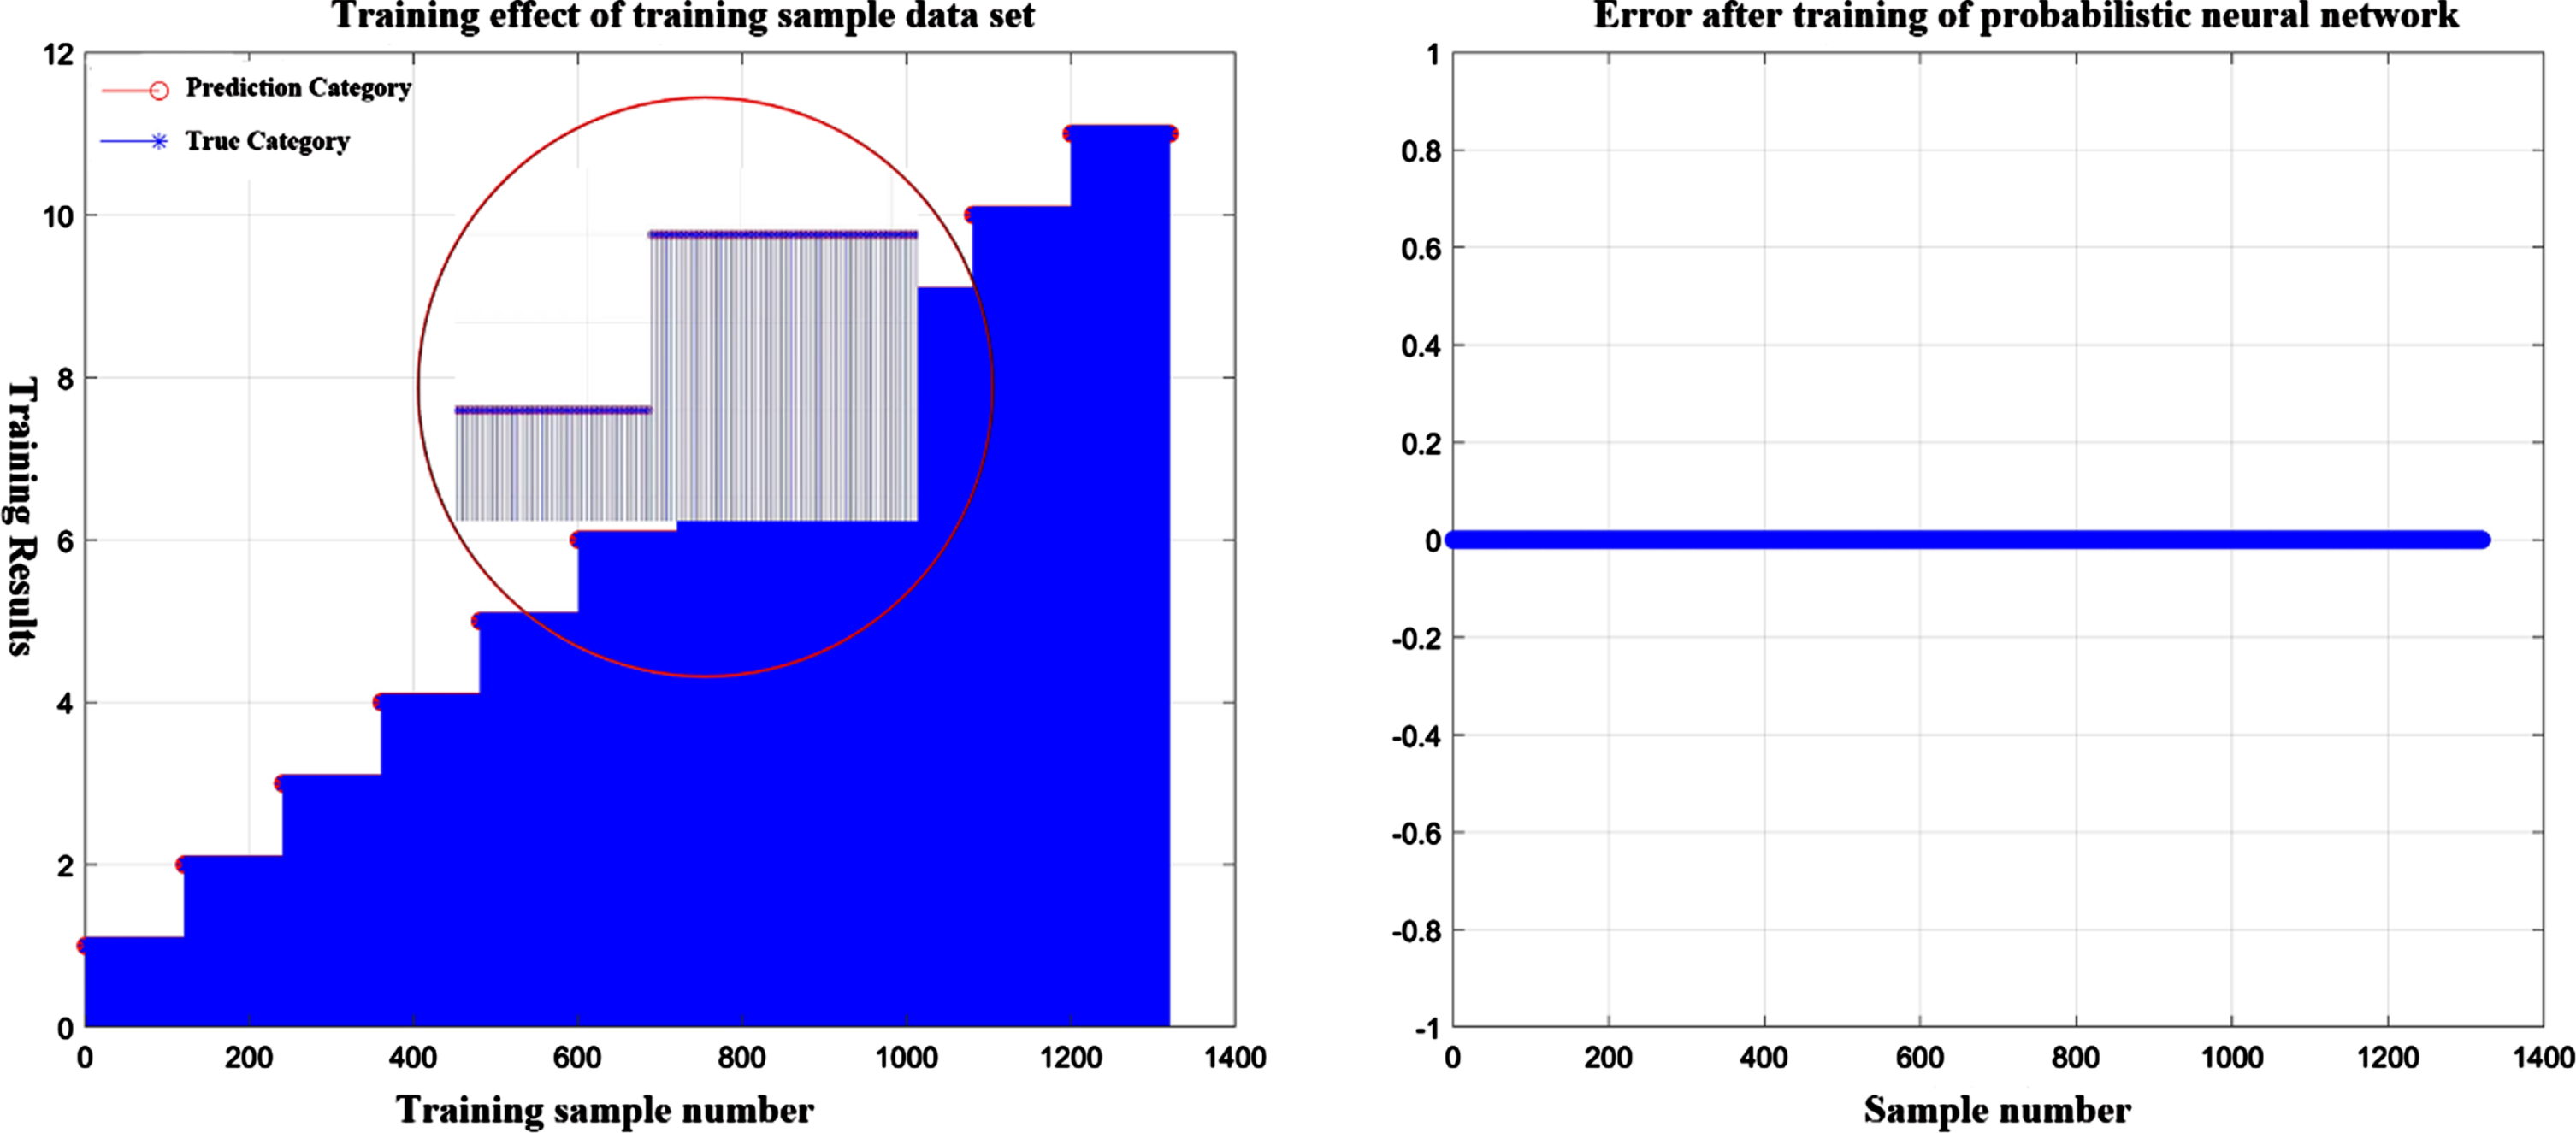
Training set pattern classification recognition training effect graph.
As can be seen in Fig. 10, the predicted and true categories of the 1430 training sets are exactly the same, and the training error is zero, which shows that the training is relatively good. It proves that the training set probabilistic neural network structure for rapier loom fault diagnosis can achieve 100% correct classification recognition of fault signs. Therefore, the network structure can be used as the basis for fault sign classification and recognition on the sample test set to verify the classification and recognition effect of the network, and further improve and optimize the network structure based on the training results.
The normalized sample matrix of the test set is a matrix with 30 rows and 11 columns. The probabilistic neural network structure of the test set has 11 neurons in the input layer, 330 neurons in the pattern layer, 11 neurons in the summation layer, and 11 neurons in the output layer. The training effect of pattern classification recognition for the sample test set is shown in Fig. 11.
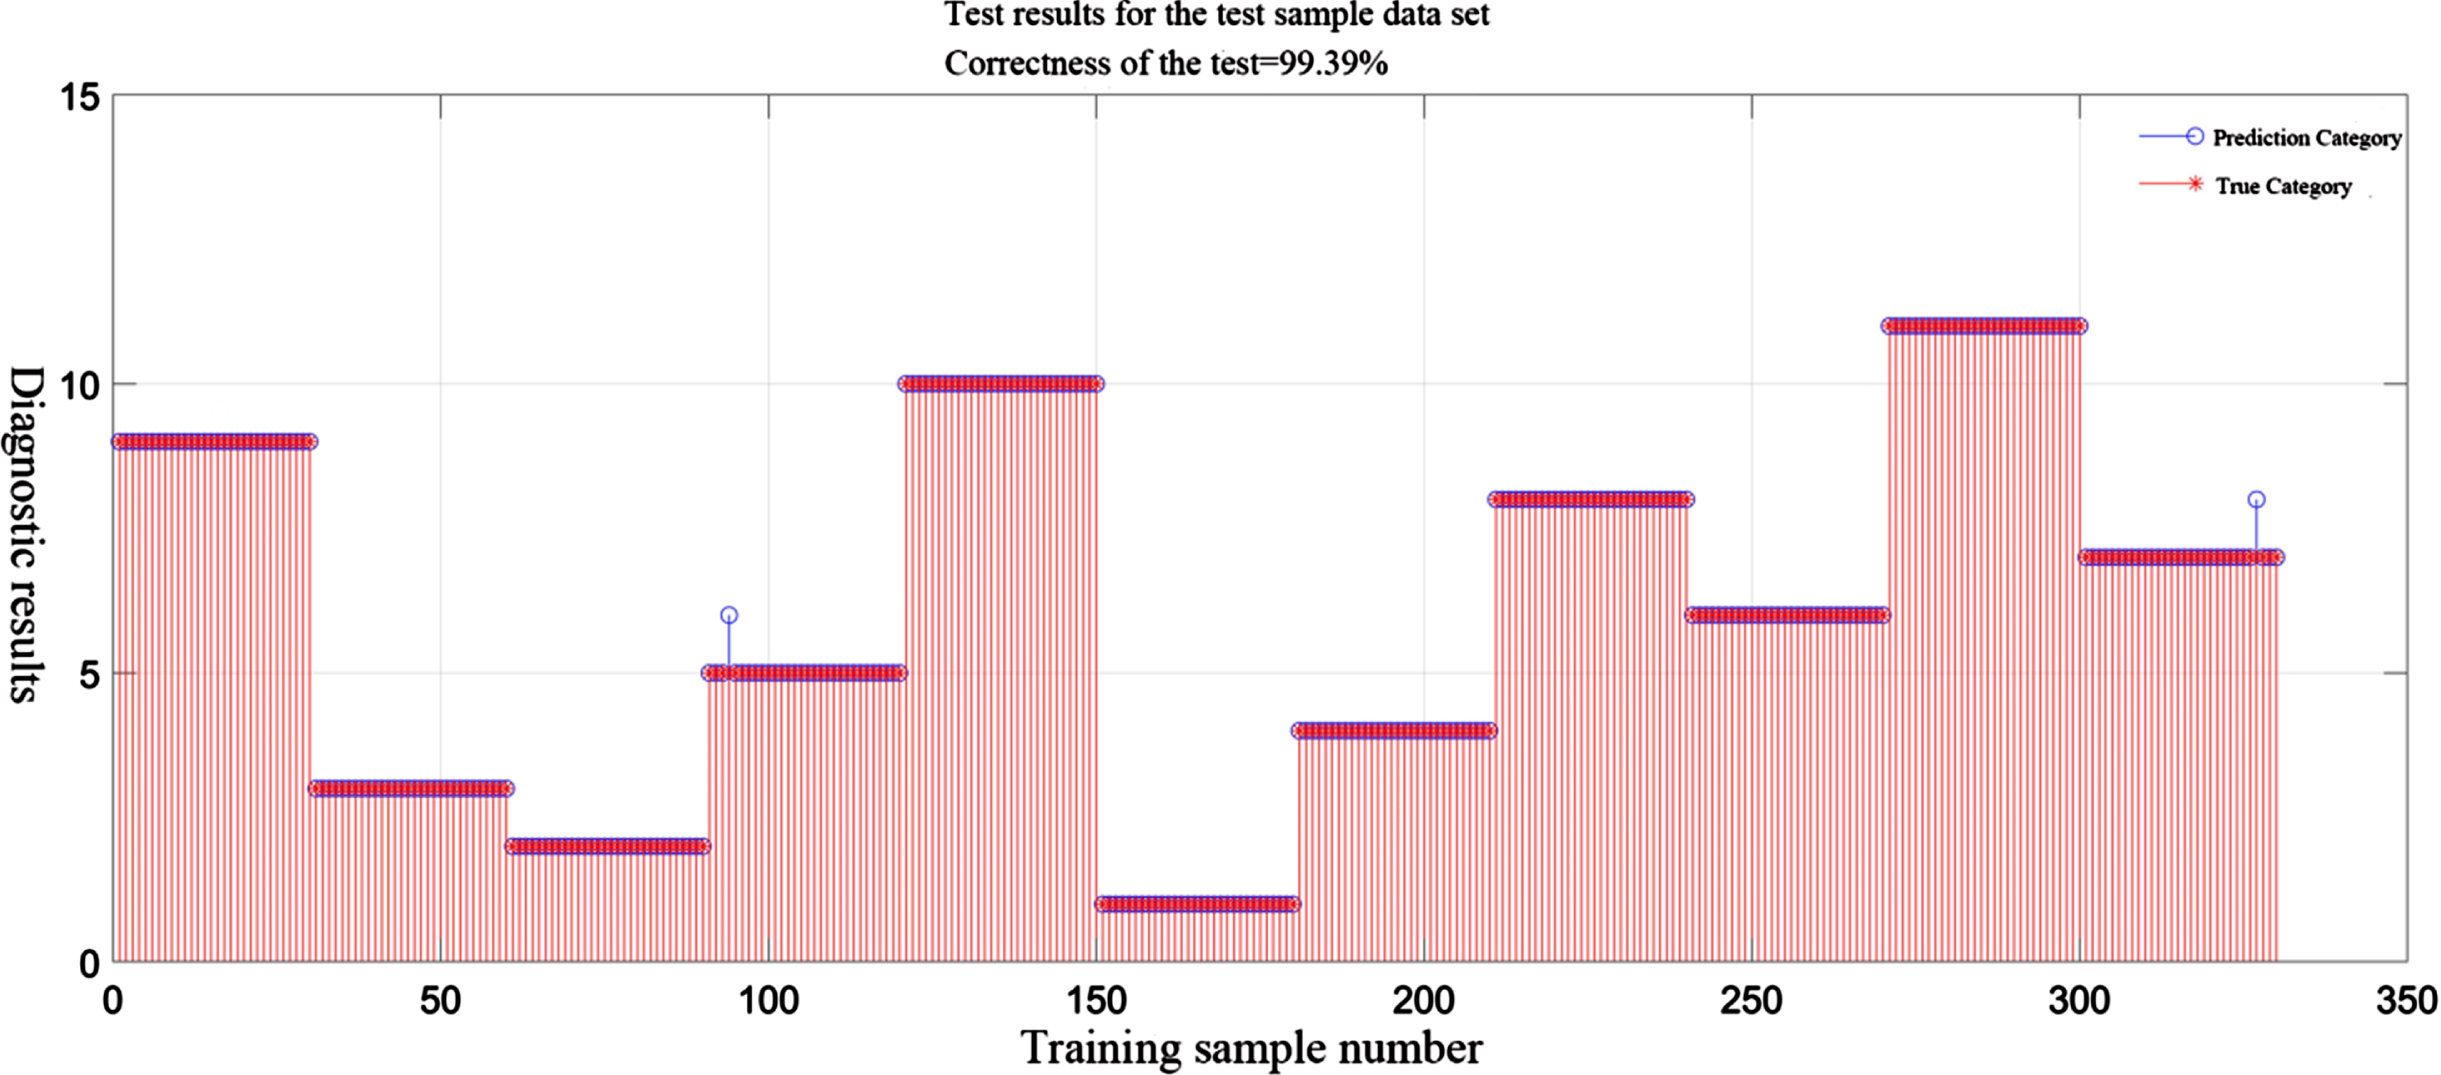
Test set pattern classification recognition training effect graph.
As can be seen from Fig. 11, the correct classification recognition rate of the test set of the fault signs is 99.39%, which can basically achieve the accurate classification of the fault signs, and the training results of the algorithm are relatively good. The incorrect samples in the training results of the test set are analyzed. Fault sign 5 was classified as fault sign 6 and fault sign 7 was classified as fault sign 8. By querying the fault signs of some rapier weaving machine fault diagnosis systems, it is known that: fault sign 5 is the warp tension value, fault sign 6 is the weft tension value, fault sign 7 is the warp feeding servo motor speed, and fault sign 8 is the winding servo motor speed. The fault diagnosis signals of the two fault signs are similar, so the error diagnosis can be considered to be within the allowable error range.
The 13th row of the fault sign matrix is selected for diagnosis and the resultant vector matrix
Troubleshooting results
The 2 sample datasets that were misclassified in the test set were eliminated, and the remaining 328 test sample datasets were diagnosed. Among them, the data of 6 sample data sets are not in the range of normal status values, and the data of the remaining 322 sample data sets are in the range of normal status values. The diagnosis is performed by the diagnostic algorithm, which can accurately identify the problematic sample failure signs in the six sample data sets, and the vector matrix of the remaining 322 sets are composed of 0.
The experimental results show that the correct rate of pattern classification recognition of the test set is 99.39%, which can achieve accurate fault sign type recognition and can also give fault location and troubleshooting sequence suggestions. The simulation results improve the fault diagnosis efficiency and the excellence of the probabilistic neural network-based rapier loom fault tree diagnosis strategy is demonstrated.
During the actual operation of the rapier weaving machine, the red warning light above the weaving machine control cabinet lights up and the MCGS configuration screen jumps to the fault alarm and diagnosis window when the warp tension limit alarm occurs. The system fault alarm and diagnostic window shows a fault indication that the warp tension has exceeded the limit, the cause of the fault shows that the upper warp tension limit is set too small, the warp beam diameter parameter is set incorrectly and the weaving machine equipment parameter is set incorrectly. The suggested sequence of location checks shows the upper warp tension value, the parameter setting of the weaving machine and the parameter setting of the warp beam diameter. After adjusting the parameter settings to the correct range and starting up the rapier weaving machine, the fault diagnosis system no longer alarmed and the machine operated normally. This proves the correctness of the fault diagnosis system. The fault alarm and display of the warp tension overrun at the experimental site are shown in Fig. 12.

Fault alarm and display of warp tension value exceeding the limit.
Since it is not possible to destroy the weaving machine equipment to complete the fault diagnosis work, the actual fault data is sent to the data acquisition device simulated by the test platform of monitoring and diagnosis using the fault data provided by the manufacturer. The fault diagnosis is completed on the software to get the cause of the fault. 100 groups of faults contain 10 fault signs, namely low oil level, oil level sensor fault, insufficient oil pressure, oil pressure sensor fault, slow proximity switch fault, slow clutch fault, main clutch fault, slow clutch not in place, tension sensor fault and main encoder fault, and 10 groups of diagnostic system experimental tests are conducted for each group of fault signs. The experimental effect diagram of its pattern classification recognition is shown in Fig. 13.
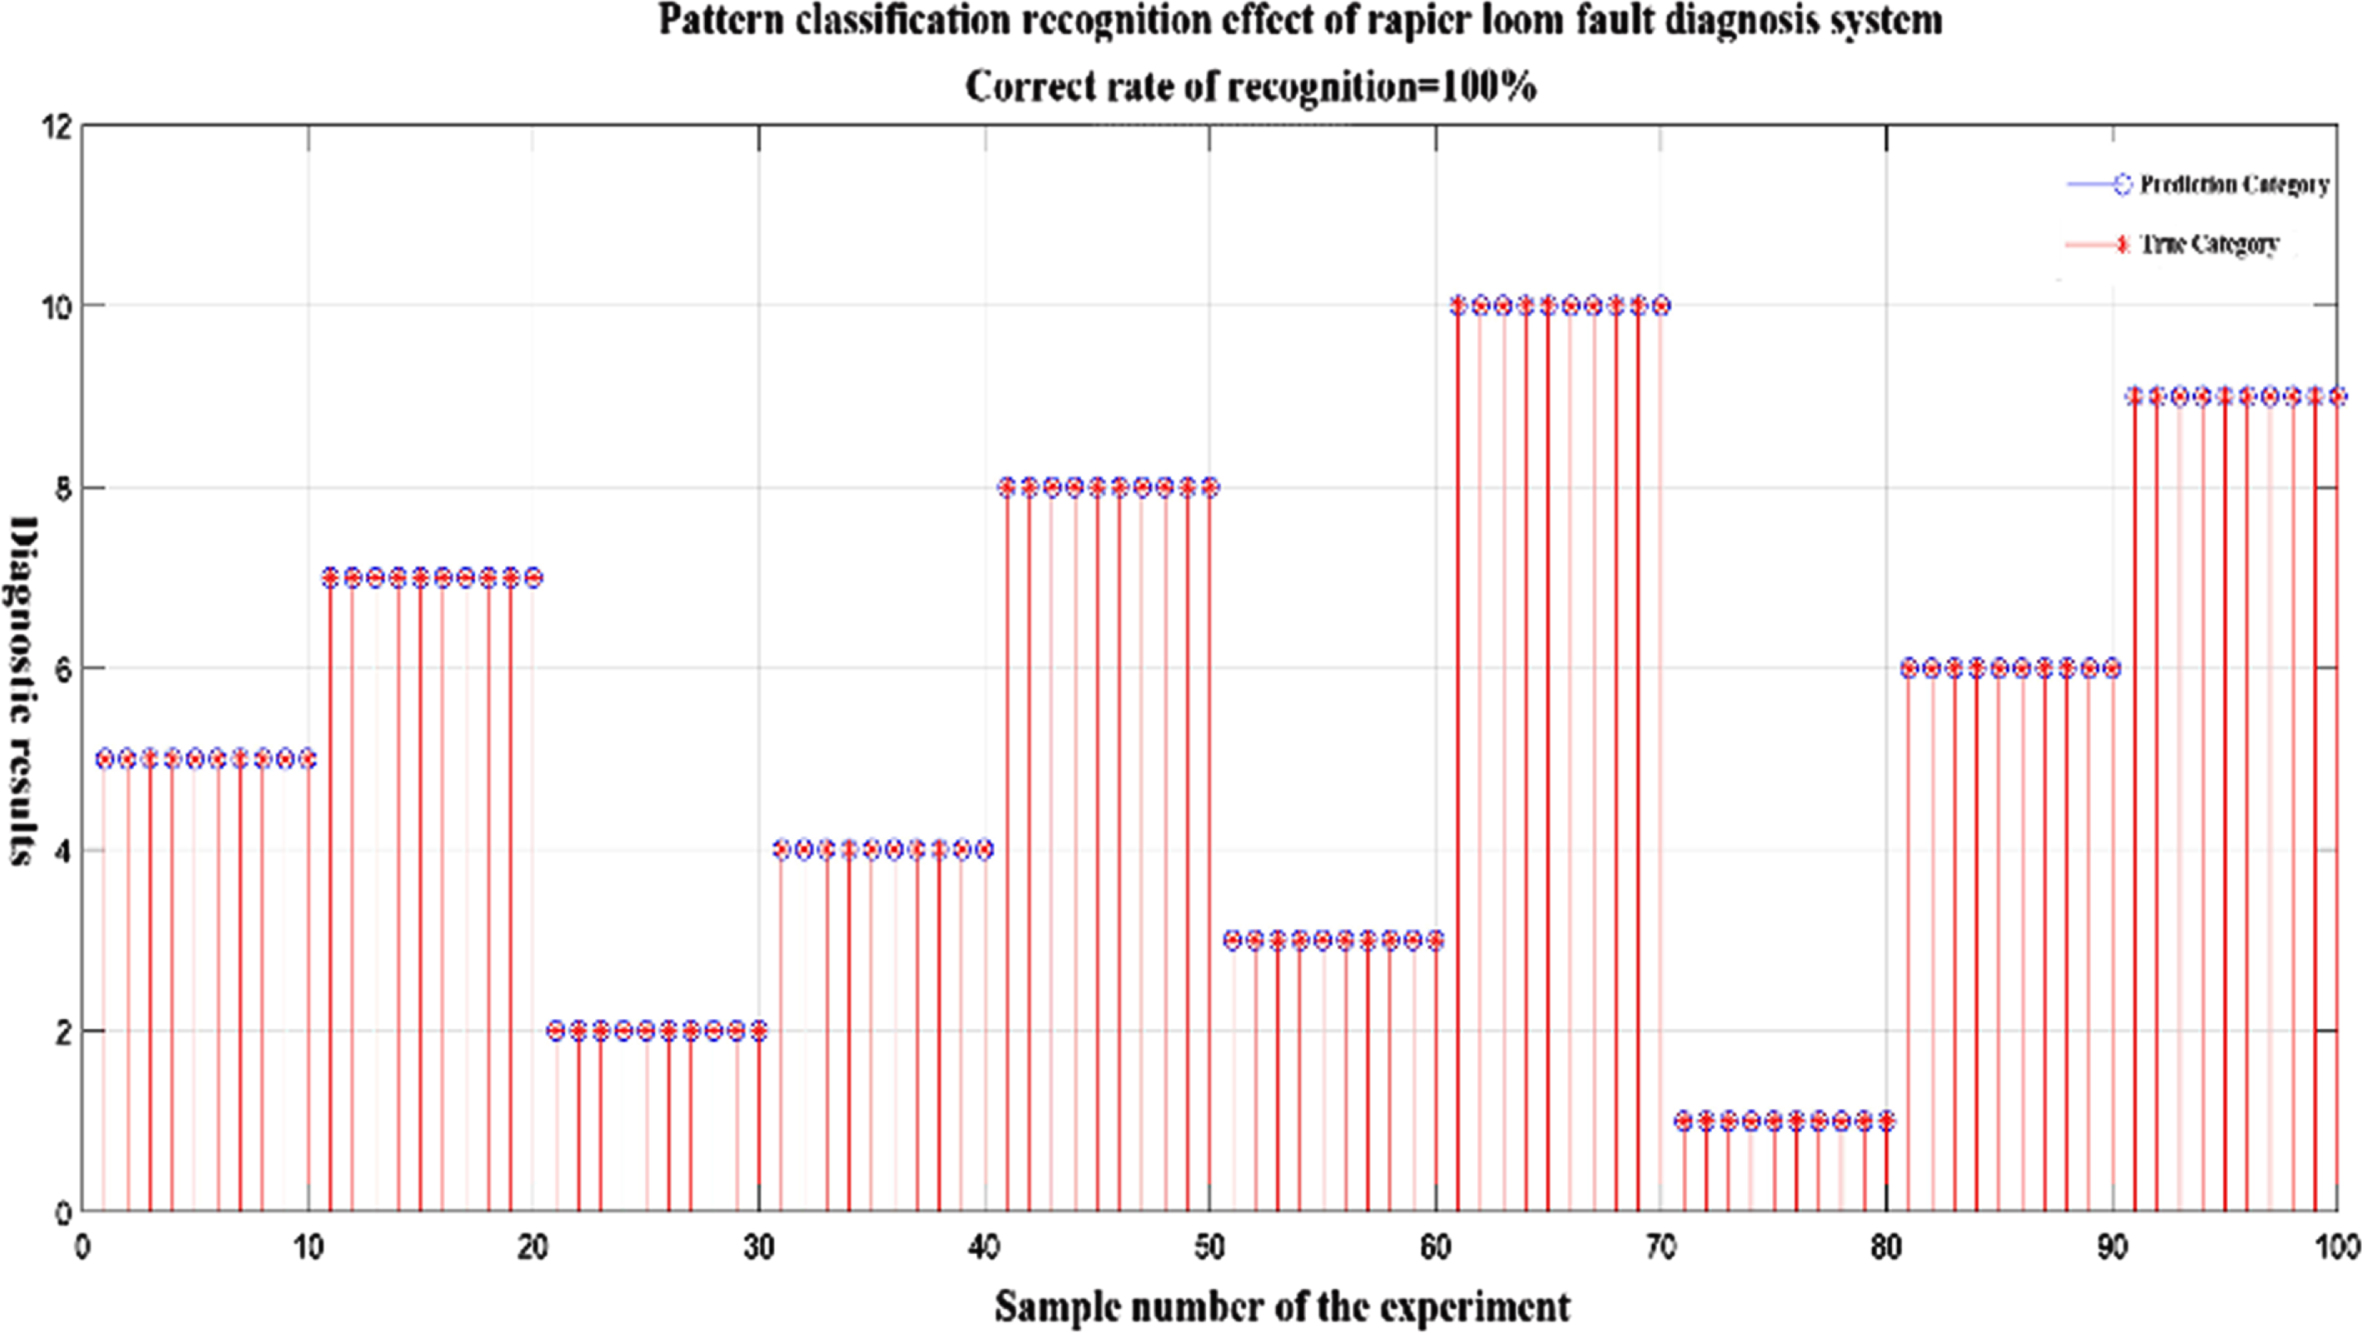
Rendering of fault symptom classification and identification of rod weaving machine fault diagnosis system.
As can be seen in Fig. 13, the fault diagnosis system can achieve the correct classification of 100 groups of fault signs. This proves that the system has a strong self-learning pattern recognition capability and can meet the intelligent requirements of the diagnosis system for the complex control system of rapier loom. The fault diagnosis efficiency is significantly improved compared with the disorderly sequential search by adopting the suggested positioning and ranking order given by the fault diagnosis system. The comparison of the fault cause location and ranking efficiency is shown in Table 11. The disorderly ranking efficiency is the fault location ranking efficiency of the existing diagnosis system of rapier loom, and the orderly ranking efficiency is the fault location ranking efficiency of the rapier loom fault diagnosis system constructed in this topic.
Comparison of troubleshooting efficiency
From Table 11, it can be seen that in the rapier loom fault diagnosis experiment, the efficiency of locating and investigating the fault causes corresponding to the 10 selected fault signs has been improved more obviously. Among them, the slow clutch in place fault sign has the most obvious efficiency improvement, which is because this fault sign corresponds to the most fault causes, and when there are more fault causes, the more significant is the efficiency improvement of orderly positioning and investigation. As the complexity of the rapier loom control system increases, the number of causes of faults corresponding to the fault signs will gradually increase, and the diagnostic efficiency of the fault diagnosis method proposed in this study will be improved more significantly.
In this paper, a new probabilistic neural network optimized fault tree for rapier loom fault diagnosis is proposed. The problems of low fault diagnosis efficiency and inaccurate identification of fault signs when strongly coupled faults occur are solved. After analyzing the fault mechanism of rapier loom, we selected typical faults and established fault trees for each subsystem. Based on the limitation that the fault tree analysis cannot accurately determine the non-linear relationship contained between the cause of failure and the amount of signs, the probabilistic neural network diagnosis method is introduced, and the fault diagnosis model based on the fault tree and probabilistic neural network is given by combining the minimum cut set of the fault tree, and the simulation of fault diagnosis of typical fault signs of rapier loom is carried out by using MATLAB software. Finally, the diagnostic capability of the fault diagnosis system is experimentally tested, and the experimental results show that the method has a strong self-learning pattern recognition capability and can accurately identify fault signs, while its localization and troubleshooting efficiency has been greatly improved. The method provides good guidance and reference for the equipment maintenance management of rapier looms.