
Abstract
In recent times, the rapid advancement of deep learning has led to increased interest in utilizing Electroencephalogram (EEG) signals for automatic speech recognition. However, due to the significant variation observed in EEG signals from different individuals, the field of EEG-based speech recognition faces challenges related to individual differences across subjects, which ultimately impact recognition performance. In this investigation, a novel approach is proposed for EEG-based speech recognition that combines the capabilities of Long Short Term Memory (LSTM) and Graph Attention Network (GAT). The LSTM component of the model is designed to process sequential patterns within the data, enabling it to capture temporal dependencies and extract pertinent features. On the other hand, the GAT component exploits the interconnections among data points, which may represent channels, nodes, or features, in the form of a graph. This innovative model not only delves deeper into the connection between connectivity features and thinking as well as speaking states, but also addresses the challenge of individual disparities across subjects. The experimental results showcase the effectiveness of the proposed approach. When considering the thinking state, the average accuracy for single subjects and cross-subject are 65.7% and 67.3% respectively. Similarly, for the speaking state, the average accuracies were 65.4% for single subjects and 67.4% for cross-subject conditions, all based on the KaraOne dataset. These outcomes highlight the model’s positive impact on the task of cross-subject EEG speech recognition. The motivations for conducting cross subject are real world applicability, Generalization, Adaptation and personalization and performance evaluation.
Keywords
Introduction
Disability represents an intrinsic and vital aspect of human existence. Globally, approximately 1.3 billion individuals confront various forms of disabilities. A Brain-Computer Interface (BCI) constitutes a mechanism enabling interaction between the brain and external devices, like computers or prosthetic limbs. BCIs possess diverse applications, encompassing prosthetic limb control, reinstating communication for paralysis-affected individuals, and managing devices in home or workplace settings. BCIs operate by gauging brain activity, such as electrical signals or neural responses, and converting this data into directives for external device manipulation. Continual research advances BCIs, and while some promising strides have been made, substantial challenges persist prior to wide-ranging clinical BCI implementation. Silent speech recognition denotes an innovation enabling communication devoid of vocalization. It leverages electrodes or sensors positioned on a person’s face or neck to detect muscle movements linked to speech production, even when sound is absent. These muscle actions are then interpreted into words or instructions via computer algorithms [1]. This technology holds potential for aiding speech-impaired individuals, facilitating covert communication in demanding or secure contexts, and enhancing human-computer interfaces by controlling devices or games using facial or neck gestures. Recent strides in machine learning and neural networks have notably bolstered the accuracy of silent speech recognition [2]. However, challenges persist in developing dependable systems that accurately recognize a wide array of speech sounds and accommodate individual speech production variations. Electroencephalography (EEG) plays a role by capturing brain signals through strategically placed electrodes [3]. Silent speech recognition has emerged as a focal point in research, fueling applications like AlterEgo and Speakup.
In single-subject analysis, the focus is on studying the behavior, responses, or characteristics of individual subjects. Cross-subject analysis involves comparing data across multiple subjects to identify general trends, patterns, or principles that apply across a group or population. The motivation towards the silent speech recognition is the AlterEgo - “AlterEgo” refers to a wearable device and associated technology developed by researchers at the Massachusetts Institute of Technology (MIT). It is designed to enable silent communication between users and computers by interpreting internal verbalizations, or subvocalizations, without the need for actual speech or any audible output. The motivation towards the cross subject analysis is generalization, bias, performance evaluation and personalization. The issue at hand involves conducting cross-subject analysis using Brain-Computer Interface (BCI) technology to develop a silent speech interface. This approach aims to help the learning algorithm comprehend how the brain produces speech, facilitating alternative communication methods for individuals with disabilities. Ultimately, it seeks to enhance the quality of life for patients who are locked-in or suffer from significant communication impairments. The main objective of the research is to develop a speech BCI based assistive technology for silent speech interface that recognizes data from the measure of a user’s brain signals and to obtain the phoneme level classification for the single subject and cross subject analysis over thinking and speaking state using the EEG signals.
Silent Speech Recognition is one of the popular areas in research and it is used in applications such as AlterEgo and Speakup. Several Studies using EEG signals on imagined speech, emotion detection over Cross subject analysis have been published. The related works on the cross-subject analysis of thinking and speaking states by using the KaraOne dataset are very minimal. Hongde Wu and Feichen experimented on imagined speech using the KaraOne dataset. The time window features are extracted from EEG signals and implemented over the Gaussian process regression layer and the Vocoder synthesis layer has been used to evaluate the performance of the model. With the cross-subject analysis, the raw and the processed data are compared and achieved 57% of accuracy [4]. Maurice Rekrut, Mansi Sharma et al discussed cross-subject analysis on imagined speech. The evaluation has been carried out for 5 words of a real-time dataset and feature vector and Common Spatial pattern feature extraction methods are used to retrieve time and frequency domain features and it is implemented over the Support Vector Machine and achieved an accuracy of 60.4% [5]. Yisi Liu, Zirui Lan et al investigated cross-subject analysis for mental fatigue patients. The Fast Fourier Transform is used to retrieve the spectral features and it is implemented over the transfer component analysis over the cross-subject analysis producing 72.70% accuracy [6]. Arti, Dilip Singh et al, discussed the cross-subject concept for emotion recognition. The entropy and energy features are extracted from EEG signals and it is fed into the Fourier Bessel series expansion-based empirical wavelet transform with neighborhood component analysis over the two datasets SJTU and SEED datasets and achieved better results [7]. Saha et al. experimented using KaraOne dataset and achieved 28.08% accuracy over 7 phonemes and 4 words. The Convolutional Neural Network has been implemented over the dataset for imagined speech recognition [8]. Zhao et al retrieved statistical features from the KaraOne dataset for the imagined speech using EEG signals and achieved 18.08% accuracy [9]. Ying Sun and Wenzheng Ding et al researched cross subject of the steady-state visual evoked potential-based brain computing interface. The Canonical correlation analysis is applied over the cross-subject analysis and achieved an average accuracy of around 13.16% [10]. Ana-Luiza and Ovidiu experimented on Imagined Speech using the KaraOne dataset and implemented it over the CNN-LSTM model. The author has used the cross-covariance concept and achieved an accuracy of 43% [11]. Jinyu Li, Haoqiang et al discussed the cross-subject using EEG signals for emotion recognition using DEAP and SEED datasets. The author has proposed Multi scale residual network, meta-transfer learning and CNN for the implementation [12].
Silent Speech recognition using EEG signals across single subjects and cross-subjects has a tremendous scope of improvement from past studies. In the literature review, most of the researchers focused on improving the performance of the imagined speech using the KaraOne dataset, emotion recognition, and mental fatigue detection. Most of the past studies have used only time, frequency, and energy features retrieved from the EEG signals. To the best of my knowledge, there was no research focused on the cross-subject analysis of thinking and speaking states using the KaraOne dataset. As suggested by Maurice and Mansi [5], the temporal and spatial features extracted from the proposed model along with the 24 statistical features retrieved using the math functions provides better results than other models as discussed in the related works.
The Major Contributions of the study are as follows: The 24 statistical features are obtained from the signal and the temporal and Spatial features are obtained from the proposed hybrid model. Substantial experiments are performed to obtain relevant feature sets using the SelectKbest method and the Select Percentile method. Investigated LSTM + GAT, a hybrid model for analyzing Speech recognition using EEG signals across single subject and cross-subject on KaraOne dataset. The performance of the proposed LSTM + GAT model is compared with the state of art base models.
Proposed methodology (LSTM-GAT Attention model framework):
LSTM Model
The significant gap between the input data poses a challenge for conventional RNNs, as they struggle to effectively capture and process this information. To address this issue, the LSTM (Long Short-Term Memory) architecture is introduced. LSTM is essentially a type of recurrent neural network (RNN) that employs a mechanism called a “gate” to enhance the memory retention of its cells. Within the realm of LSTM, various versions exist, and one notable variant is the LSTM with a forget gate, illustrated in the below Fig. 1. There are three different types of gates are associated with LSTM, they are The “forget gate” serves to decide which information should be discarded. The “input gate” is responsible for determining which fresh information should be stored in the cell state. The “output gate” plays a role in deciding which aspects of the cell state information should be included in the output.
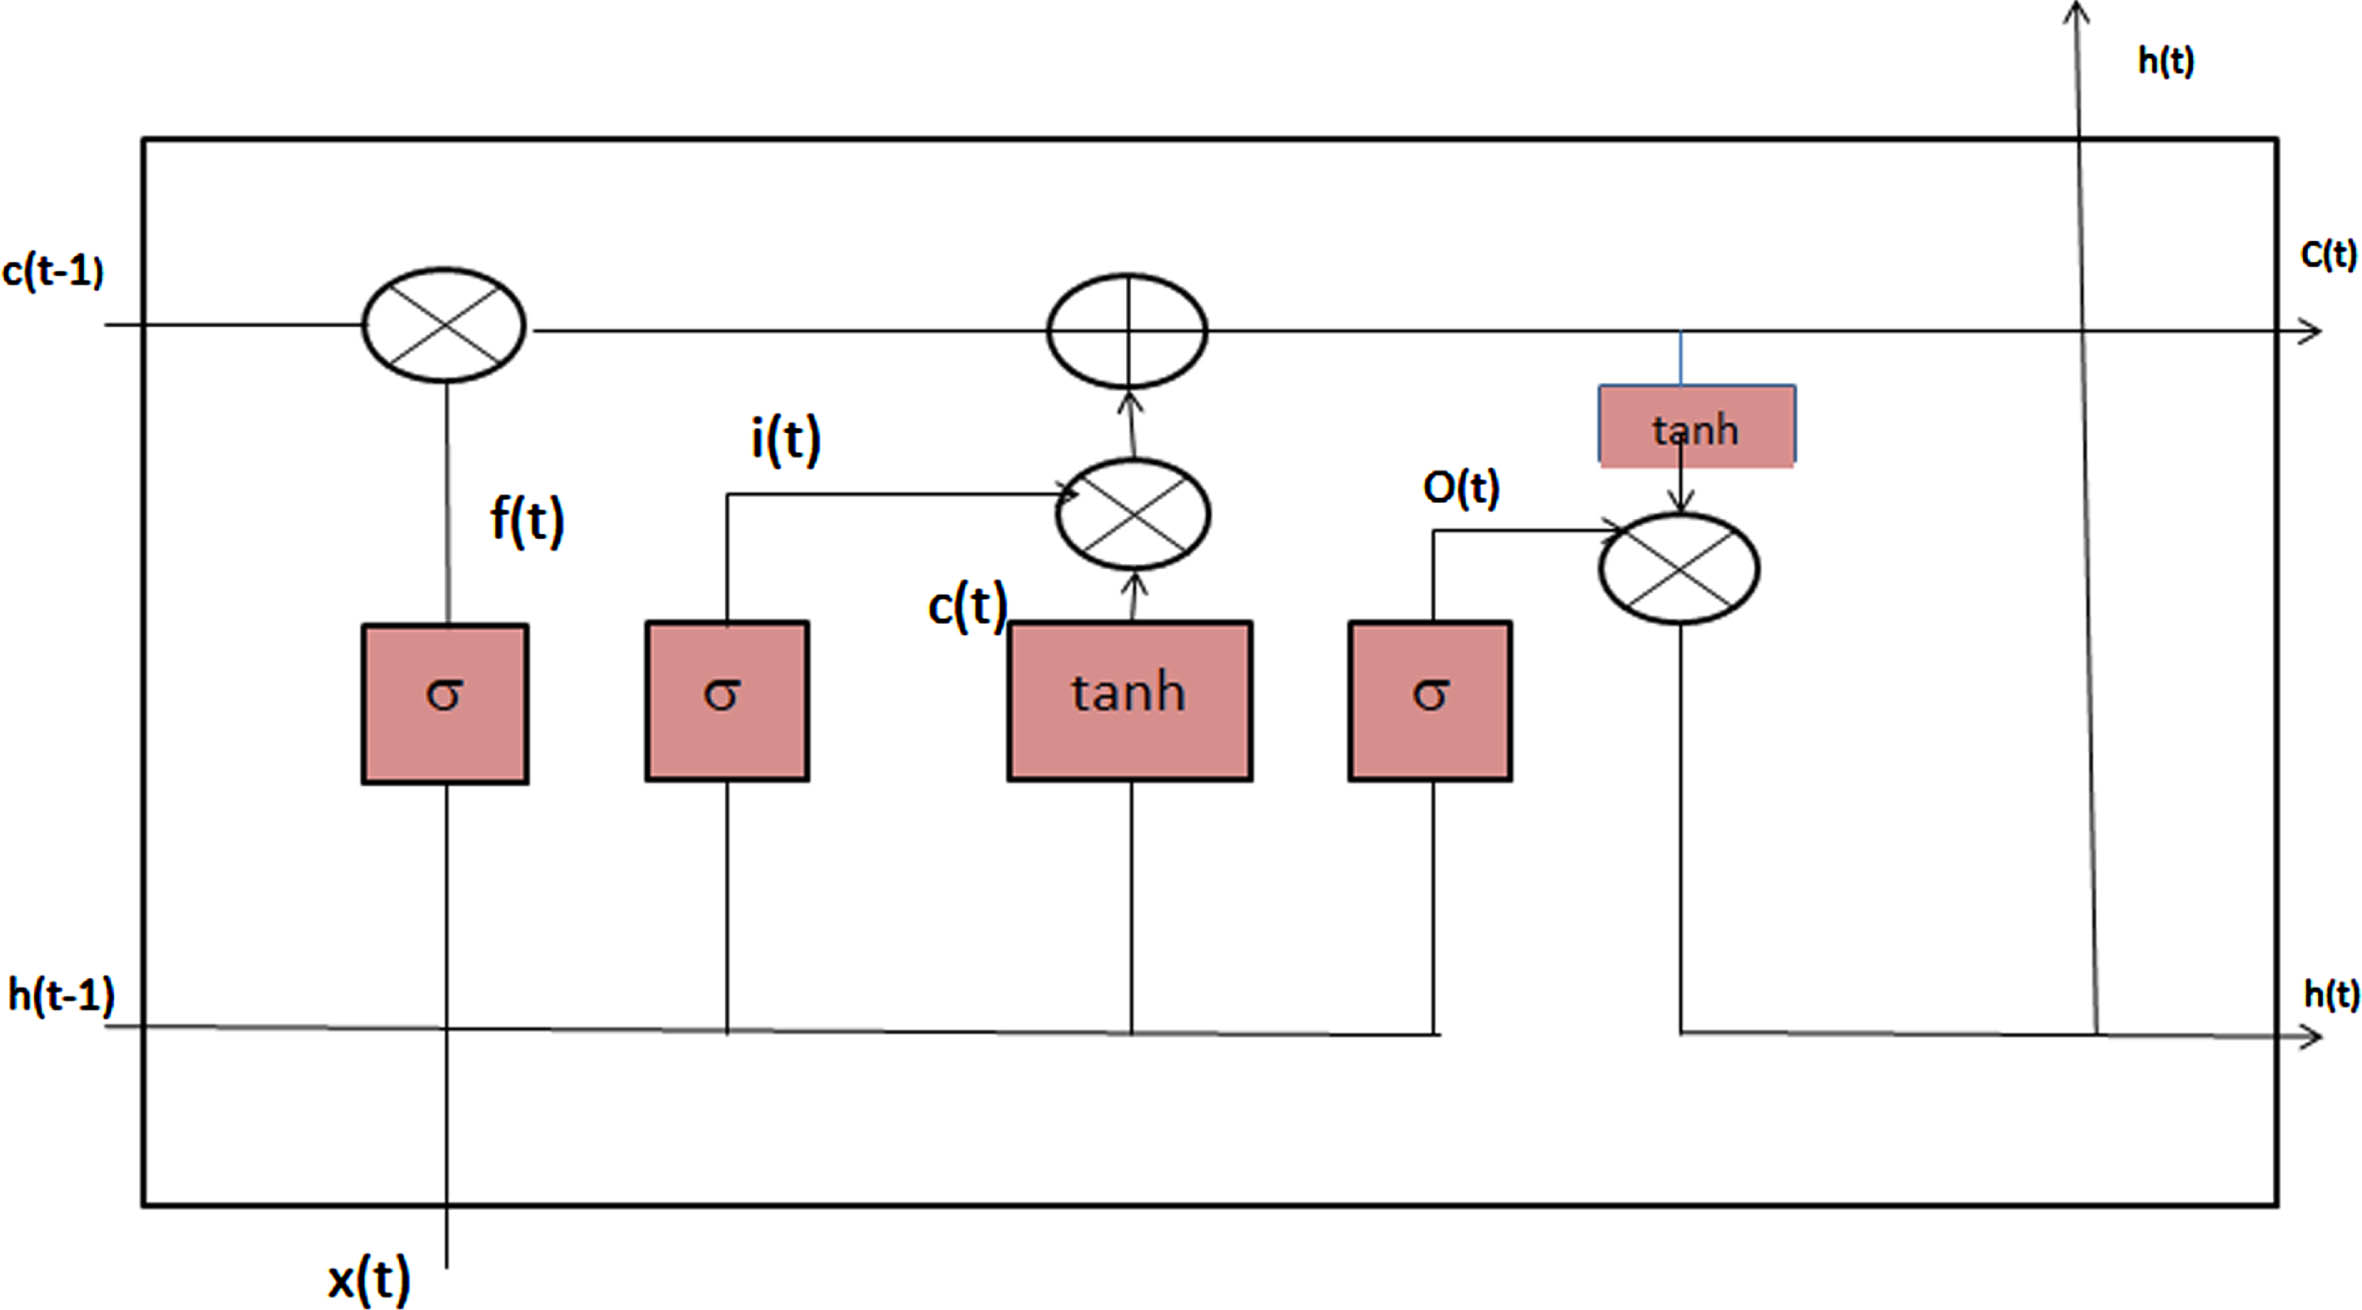
Diagram for LSTM.
The functionality of the cell is defined as follows:
where,
ft: is the forget gate
Wf: Weight of the forget gate
xt:Input at time t.
bf:Bias of the forget gate
bi: Bias of the input gate
bc: bias of the memory content
bo: bias of the output gate
ht-1: Hidden vector at time t-1
σ: Sigmoid function
it: Input gate
ot: Output gate
ct: Memory cell content
From the above equations 1 to 6, three gates are constructed using the σ function and the output of one particular cell is designed using the tanh function.
Graph Attention Network (GAT) is a neural network architecture particularly designed for processing graph structured data such as social networks and recommendation systems. GAT is also a part of Graph Neural Networks to address the limitations of traditional GNNs called Graph Convolution Network (GCN). The key concept of GAT is that the attention mechanism is used to weigh the contributions of neighboring nodes differently when aggregating information in each layer of the network. The workings of the GATs are as follows: Node Representations: Every node in the graph is assigned an initial feature vector, represented as a vector of numbers. The initial features are the characteristics of the nodes. Self-Attention Mechanism: The main part of the GAT is the self-attention mechanism. For every node, the GAT calculates the attention coefficients for its neighbors, which determines the importance of every neighbour information. The attention coefficients are learned through training. Aggregation: The aggregated information from neighbors is computed by taking a weighted sum of neighbor node representations, where the weights are determined by the attention coefficients. Multi-Head Attention: GAT uses the multi head attention to capture the multiple patterns in the graph. The heads learn different sets of attention weights and their outputs are concatenated or averaged to create a single representation for every node. Non-linearity: Once aggregation is performed, the node representations are passed through non-linear activation function such as RELU. Output: The final node representations can be used for various graph related tasks such as node classification. The proposed Architecture is depicted in the below Fig. 2
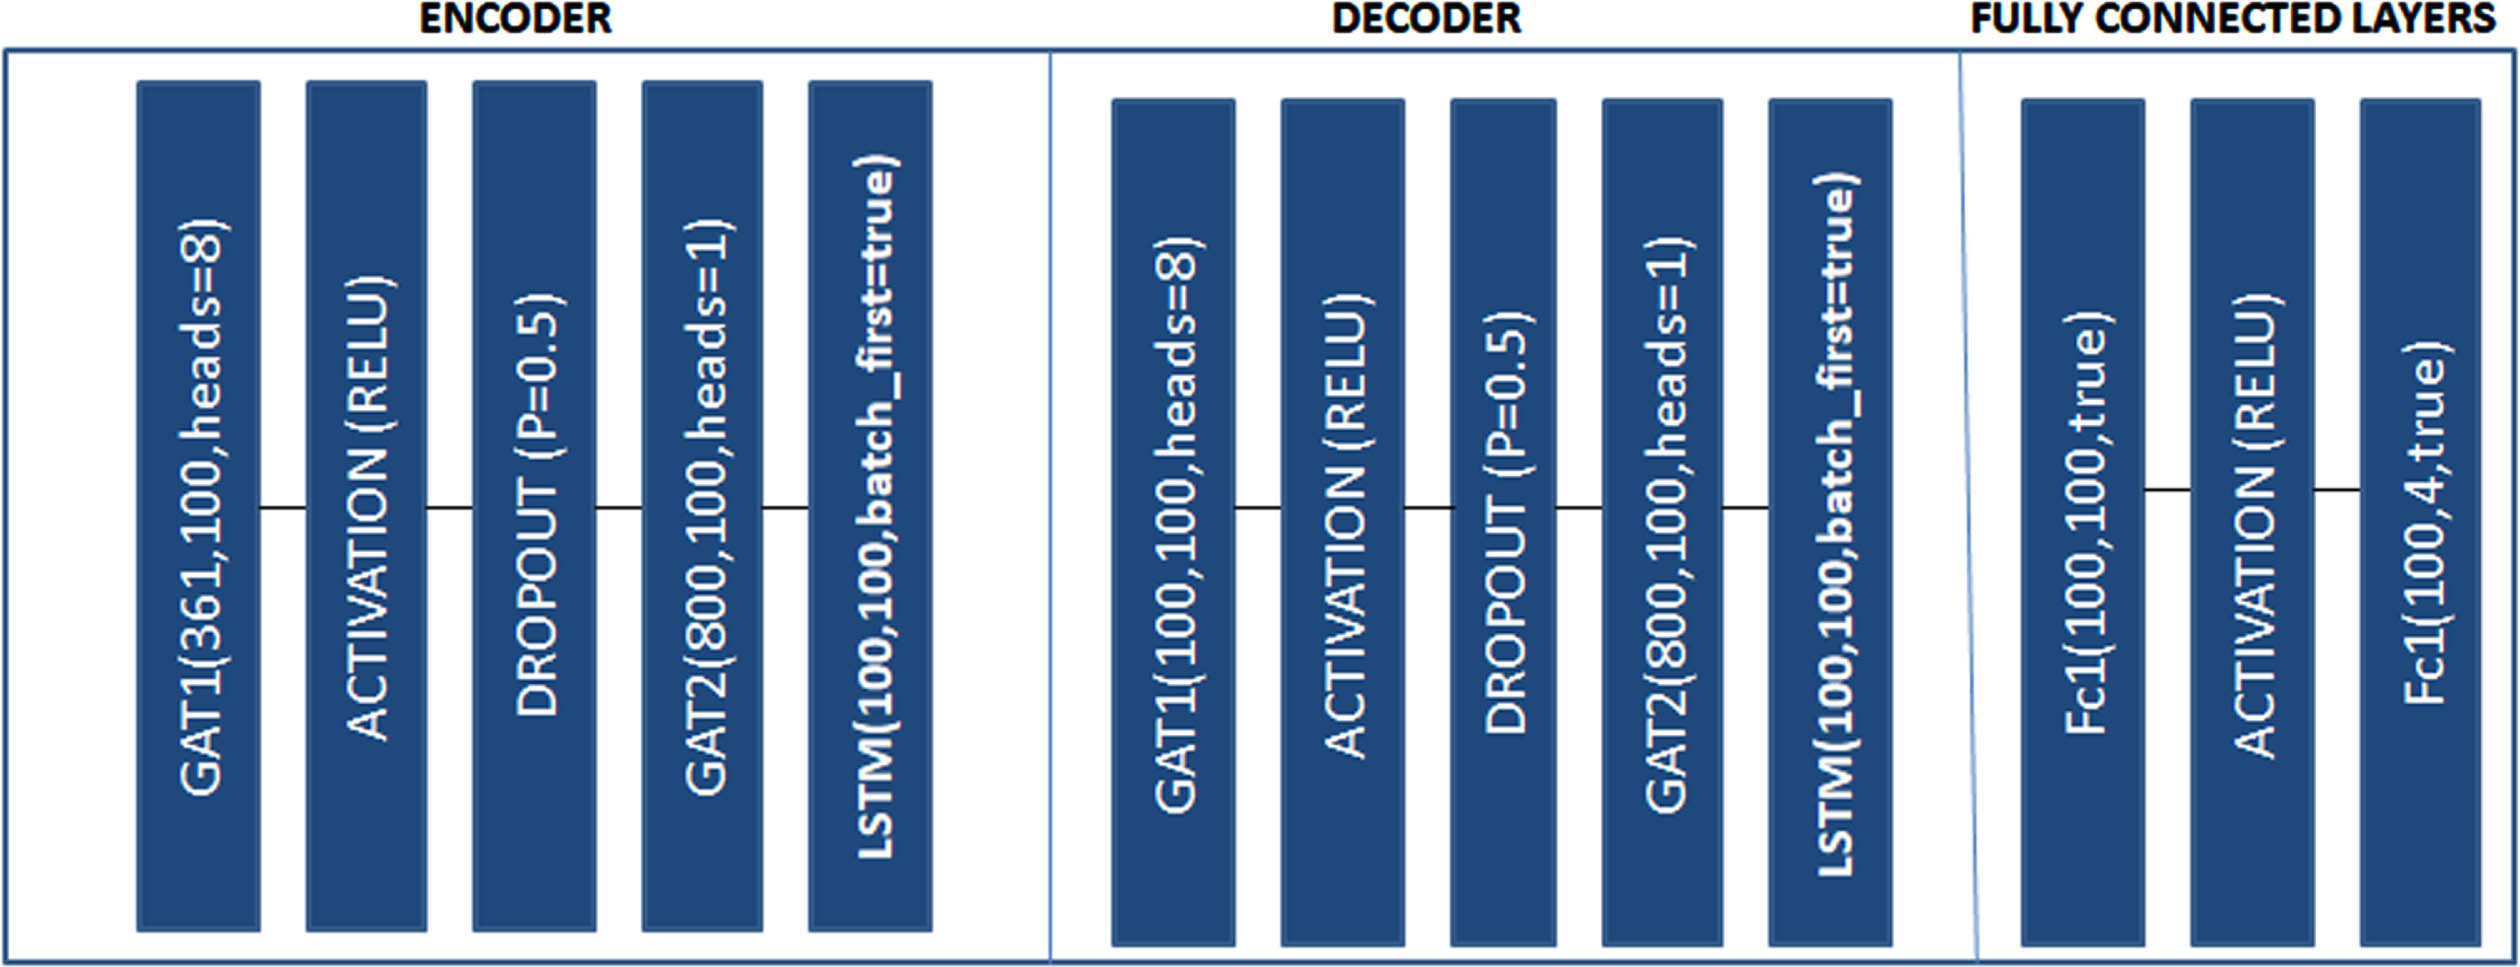
Proposed LSTM-GAT Architecture.
The above Fig. 2 depicts the proposed LSTM-GAT architecture. The architecture is designed with encoder decoder model and fully connected layer. In the encoder model, the GAT has an input of 361 and heads is considered as 8. The activation function RELU is utilized in the proposed architecture. The dropout value 0.5 has been assigned. The LSTM takes input and hidden size of the model. The phonemes acquired from different participants are fed as an input to the model, and the output is the classification accuracy. The model will predict the most probable output of phonemes from the features of the signal. The below Fig. 3 depicts the process flow of the proposed model.
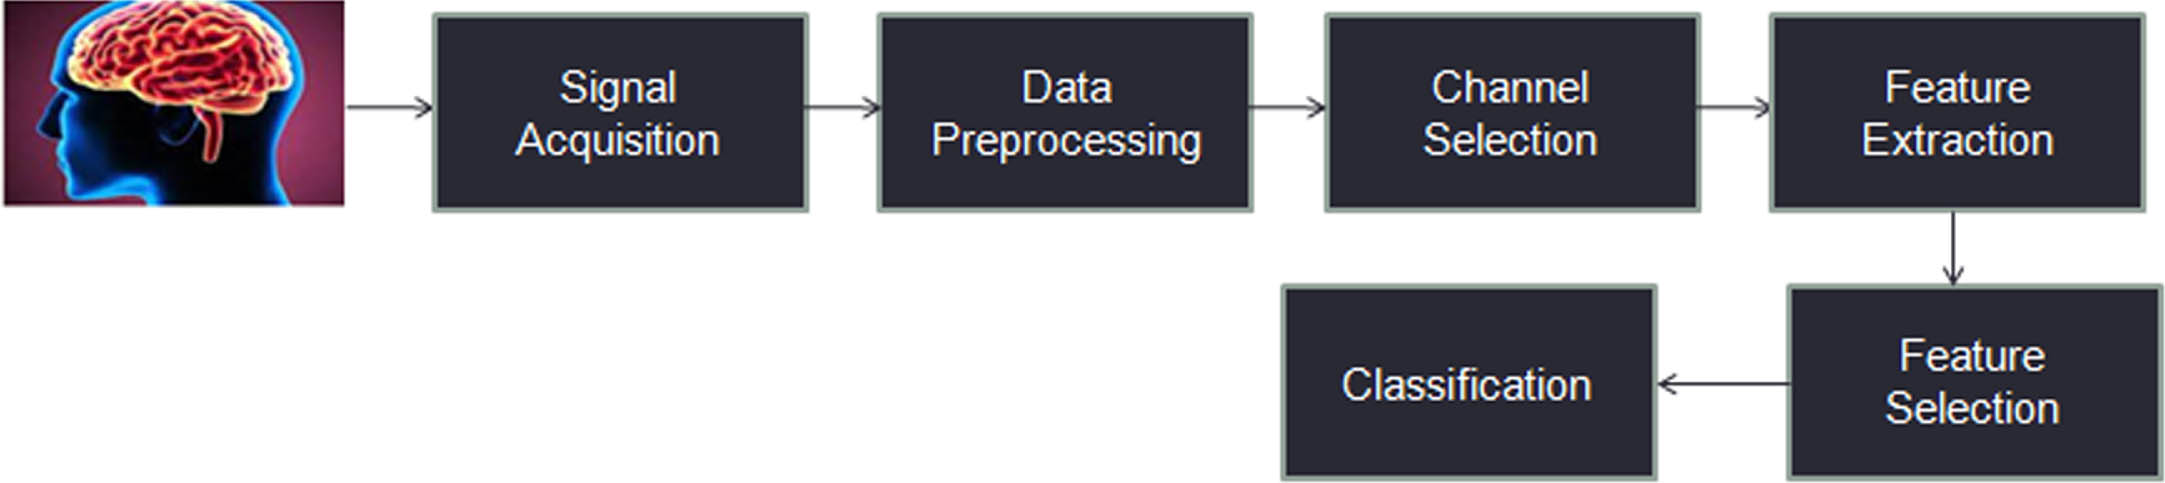
Process flow of the proposed methodology.
The above Fig. 2 depicts the process flow of the methodology and each step is explained in detail in the following section.
The experimental phase involves the utilization of the KaraOne dataset, developed at the University of Toronto, Canada. This dataset is a multimodal compilation that incorporates EEG, face tracking, and audio signals. The EEG cap within the dataset encompasses 64 channels. Collaboratively, 14 participants contributed to the dataset’s creation. The dataset encompasses four distinct states: Resting, Stimuli, Imagined, and Speaking. Each of these states is captured within 5-second epochs. Participants provided prompts in the form of 7 phonemes (iy, uw, piy, tiy, diy, m, n) and 4 words (pat, pot, knew, gnaw). The EEG cap configuration is designed with 64 channels, as depicted in Fig. 2. The sampling frequency is set at 1200 Hz, with each trial spanning approximately 30 to 40 minutes. Specifically, the analysis focuses on the following channels: FC6, FT8, C5, CP3, P3, T7, CP5, C3, CP1, and C4. The dataset can be downloaded from – www.cs.toronto.edu/complingweb/data/karaOne. The channel allocation is shown the below Fig. 4.
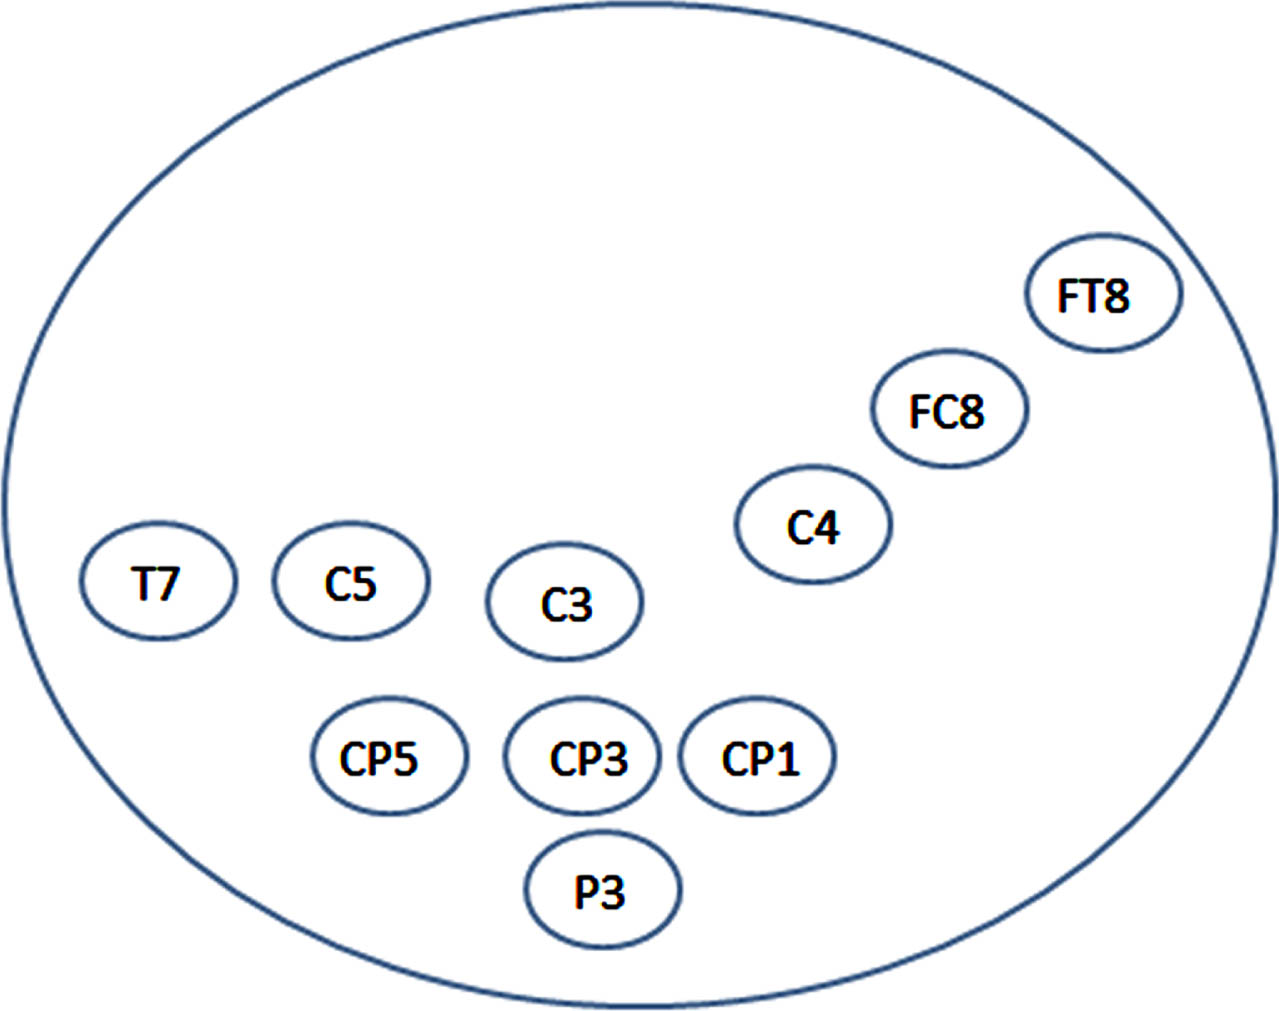
Channell location for KaraOne dataset.
The KaraOne dataset consists of 64 channels, but for the purpose of analysis, only a subset of 10 channels is taken into account. These selected channels, namely FC6, FT8, C5, CP3, P3, T7, CP5, C3, CP1, and C4, were chosen based on Pearson correlation calculations involving 1197 audio features and each of the 62 EEG channels in the dataset. The main objective of this analysis was to assess the predictive capacity of each EEG channel regarding the resulting audio. The table showcases the ten highest absolute correlations, all of which exhibit moderately positive relationships. These prominent EEG channels are centrally positioned, with T7 and FT8 situated on the left and right temporal sides, respectively, near the auditory cortex and above the lateral fissure. The presence of left-sided dominance (C5, CP3, P3, T7, CP5, C3, and CP1) indicates their likely involvement in planning speech articulation, thereby supporting their distinct roles and activations during the process of speech articulation. Through the examination of correlations between audio features and EEG channels, the researchers gain valuable insights into the neural dynamics associated with speech planning and execution. The information regarding the Mean Pearson correlations between acoustic features and the most highly correlated EEG sensor locations can be found in Table 1, while Fig. 3 visually depicts the spatial distribution of these channel locations.
Average Pearson Correlation values between characteristics and strongly correlated EEG sensor positions
Average Pearson Correlation values between characteristics and strongly correlated EEG sensor positions
Speech, characterized by its dynamic nature, undergoes temporal changes while maintaining its stationary attributes. In order to dissect speech instances and enhance the quality of spectral depiction, two fundamental processes are executed: framing and windowing. During framing, input frames are partitioned using a window of 20 to 25 milliseconds duration and a stride of 12 milliseconds. Given that raw input signals are prone to noise contamination, a noise reduction step is essential. For this purpose, the Butterworth high-pass filter is employed as a preprocessing measure to eliminate unwanted noise from the signal. The mathematical formulation of the Butterworth filter is as follows:
In the above equation (7), ωc is the cut-off frequency and n is the filter order. The value of n is considered as 4, used to flat the input frequency. The KaraOne dataset consists of 64 Channel EEG cap. The research is more focused on Silent Speech Recognition; the appropriate 10 channels are selected from the dataset as shown in the above Fig. 2. The data collected from these channels are only considered for the analysis. After selecting the channels, the next step is Feature extraction.
The proposed approach focuses on specific channels (FC6, FT8, C5, CP3, P3, T7, CP5, C3, CP1, and C4) taken from the KaraOne dataset, contributing to the analysis. These ten channels are integral to the investigation. Individually derived from these channels in both datasets, a set of 24 statistical features is obtained from each EEG signal. This aggregation leads to a total count of 240 features for the dataset. These 24 features encompass attributes like positive area, negative area, total area, total absolute area, amplitude, latency, latency with amplitude ratio, absolute amplitude, absolute latency with amplitude ratio, peak-to-peak value, peak-to-peak time window, zero crossings, peak-to-peak slope, zero crossing density, standard deviation, variance, mean signal value, median signal value, mode signal value rounded to one decimal, mode signal value rounded to two decimals, frequency domain features, mean frequency (centroid of spectrum), mode frequency, and median frequency. To streamline the feature set for analysis, the SelectKbest method and Select Percentile feature selection techniques are employed from the pool of 240 features.
Feature selection methods
The process of manually or automatically selecting the features that contribute the most to the expected variable or output is known as feature selection. The feature selection process is used to increase the model’s accuracy. The irrelevant features in the dataset will downgrade the accuracy; hence the following feature selection methods are employed [13].
SelectKbest method
The SelectKbest technique is employed within the realm of machine learning and data analysis to refine model efficiency and quality. In practical terms, the SelectKbest method retains the highest-scoring K features, discarding the remaining ones. The value of K is context-dependent and can be established via diverse avenues like domain expertise, experimentation, or cross-validation. By implementing SelectKbest, extraneous or less informative features are pruned, leading to enhanced model performance, mitigated over fitting risks, and expedited computational processes. This technique proves especially advantageous in grappling with intricate datasets where feature reduction streamlines and elevates the modeling endeavor.
Algorithm:
Step: 1 A dataset with n instances and m features. A target variable or labels associated with each instance. A positive integer K representing the desired number of selected features.
Step: 2 Calculate Feature Scores: For each feature, compute a score that reflects its relevance to the target variable. The choice of scoring metric depends on the specific problem, but common metrics include mutual information, chi-squared, F-test, or ANOVA. Assign a score to each feature based on its relationship with the target variable.
Step: 3 Sort Features: Rank the features in descending order based on their calculated scores. Select Top K Features, Choose the top K features with the highest scores from the sorted list.
Step: 4 Output: The selected subset of K features, which are considered the most relevant to the target variable.
Select percentile method
The Select Percentile method is a feature selection technique commonly used in machine learning to choose a subset of the most important features based on their statistical significance. This method operates by retaining features that exceed a certain percentile threshold in terms of their scores or statistical measures. Here’s a basic algorithmic outline for the Select Percentile method.
Algorithm:
Step: 1 Input: A dataset with n instances and m features. A target variable or labels associated with each instance. A percentile value p (e.g., 10th, 25th, 50th) representing the desired threshold.
Step: 2 Calculate Feature Scores: For each feature, compute a score that reflects its relevance to the target variable. The choice of scoring metric depends on the specific problem and could include methods like chi-squared, ANOVA F-test, or mutual information.
Step: 3 Determine Threshold: Calculate the pth percentile of the feature scores. This value will act as the threshold below which features will be discarded.
Step: 4 Select Features Above Threshold: Retain features whose scores exceed the calculated threshold.
Step: 5 Output: The selected subset of features, which are considered statistically significant based on the chosen percentile threshold.
The above two feature selection methods are implemented over the traditional benchmark datasets (KaraOne dataset).
Results and discussion
Experimental settings
The suggested approach involves constructing individual subject models and cross-subject models to assess the performance of LSTM + GAT. In the case of individual subjects, the training and testing data are split into 80% and 20% segments, both sharing similar labels. Conversely, in the cross-subject scenario, EEG signals from one subject are chosen as the target domain, while EEG signals from all other subjects comprise the source domain. For instance, if subject s1 is chosen as the target domain, the remaining 13 subjects serve as the source domain. The specified hyperparameters of the method can be found in the below Table 2. The optimization is performed using the Adam optimizer along with the cross-entropy loss function.
Hyperparameters of the proposed model
Hyperparameters of the proposed model
The LSTM + GAT model is pitted against a range of alternative approaches, including Recurrent Neural Networks (RNN), Long Short-Term Memory (LSTM), Gated Recurrent Unit (GRU), and Graph-based Neural Networks such as Graph Convolution Neural Networks (GCN), Graph Attention Networks (GAT), and Encoder-Decoder models. While much of the focus in cross-subject analysis has been on Imagined speech, this study stands out as the inaugural research that delves into both thinking and speaking states. The study showcases the accuracy results of classifiers utilizing both single subject and cross-subject training approaches. Comparative evaluations encompass not only a Gaussian process regression layer and Vocoder Synthesis layer [4] but also a comparison involving the Common Spatial Pattern combined with Support Vector Machines (SVM) [5]. Alternative strategies encompass Fast Fourier Transform with Transfer Component Analysis [6], [CNN], [CNN + LSTM] [8, 11], in addition to the use of solely statistical features [9] and Canonical Correlation Analysis [10]. In contrast to [5, 11], this research capitalizes on statistical, temporal, and spatial features from the proposed model and implements two distinct feature selection methodologies, incorporating varying combinations with K values set at 50 and 60 and select percentiles at 10% and 20%. The selectKbest method with K value as 60 resulted in superior accuracy for both single subject and cross-subject analyses, as affirmed by the findings presented in the provided table. All experiments were conducted on a personal computer equipped with an Intel Core i7 processor.
Evaluation
The study involves two distinct approaches for Silent Speech Recognition using EEG signals. In the first approach, EEG signals from a single individual are employed as the training set. Conversely, the second approach combines EEG data from multiple subjects to create a collective training dataset. The primary objective of this research is to compare the outcomes of employing Single Subject and Cross-Subject analyses in the context of Silent Speech Recognition. In the Cross-Subject analysis, the training and testing data originate from different individuals. The classification task centers around distinguishing between 4 phonemes (/m/n/diy/iy) and 4 words (/pat/pot/gnaw/knew) within the KaraOne dataset. The proposed methodology, which is applied, focuses on phoneme classification and presents individual score outputs. The evaluation of performance involves the computation of various metrics for all subjects using both training and testing data.
For assessing cross-subject analysis, the Leave-One-Subject-Out cross-validation principle was applied. In this methodology, the unlabeled data from a particular subject were treated as the target domain, while the labeled data from all other subjects were treated as the source domain. Metric calculations were performed by comparing the labeled target data. For single subject analysis, the dataset was partitioned into 80% for training within the source domain and 20% for testing. The average accuracy for the single subject and cross subject for both thinking and speaking state are depicted in the below Table 3, 4, 5 and 6.
The average accuracy of the proposed model for the thinking state, using the SelectKBest method with a value of k = 60 for single subjects
The average accuracy of the proposed model for the thinking state, using the SelectKBest method with a value of k = 60 for cross subject analysis
The average accuracy of the proposed model for the speaking state, using the SelectKBest method with a value of k = 60 for single subjects
The average accuracy of the proposed model for the speaking state, using the SelectKBest method with a value of k = 60 for cross subjects
In the above Table 3, 4, 5 and 6, the average accuracy for single subject analysis and cross subject analysis for the thinking state using the Karaone dataset is presented. It was observed that the LSTM + GAT approach achieved the highest accuracy of 65.7% on single subject and 67.3% on cross subject over the thinking state. During the speaking state, the highest accuracy obtained over single subject is around 65.4% and cross subject is around 67.4%. In both the states, it is observed that the cross subject analysis gave better accuracy. The proposed method demonstrated a significant improvement compared to other deep learning models. When comparing the proposed model with other models as shown in the Table 7, the classification accuracy improved by 8% compared to the Gaussian process regression layer and vocoder synthesis layer by Hongdewu et al, the classification accuracy improved by 47% while using statistical features used by Zhao et al. [9], the proposed model improved accuracy 12 to 15% on comparing with CNN-LSTM model by Ana et al. [11]. This indicates that the proposed model includes preprocessing, channel selection, feature extraction, feature selection methods and the LSTM along with GAT model performed well. The combination of statistical, temporal and spatial features in our proposed model contributed to the increased accuracy. The advantages of the proposed model is its ability to capture the unique signal characteristics of the experimental paradigm. By incorporating the cross entropy loss, the model effectively bridges the gap between the source and the target domain. Moreover, through careful selection of features, our LSTM + GAT achieved the best classification result.
Performance Comparison for Cross Subject Analysis
Performance Comparison for Cross Subject Analysis
A confusion matrix is a table used in the field of machine learning and statistics to assess the performance of a classification model. It helps visualize the performance of a model by presenting the true positive, true negative, false positive and false negative predictions made by the model. The confusion matrix for the cross subject analysis for the thinking state is depicted in the Fig. 5
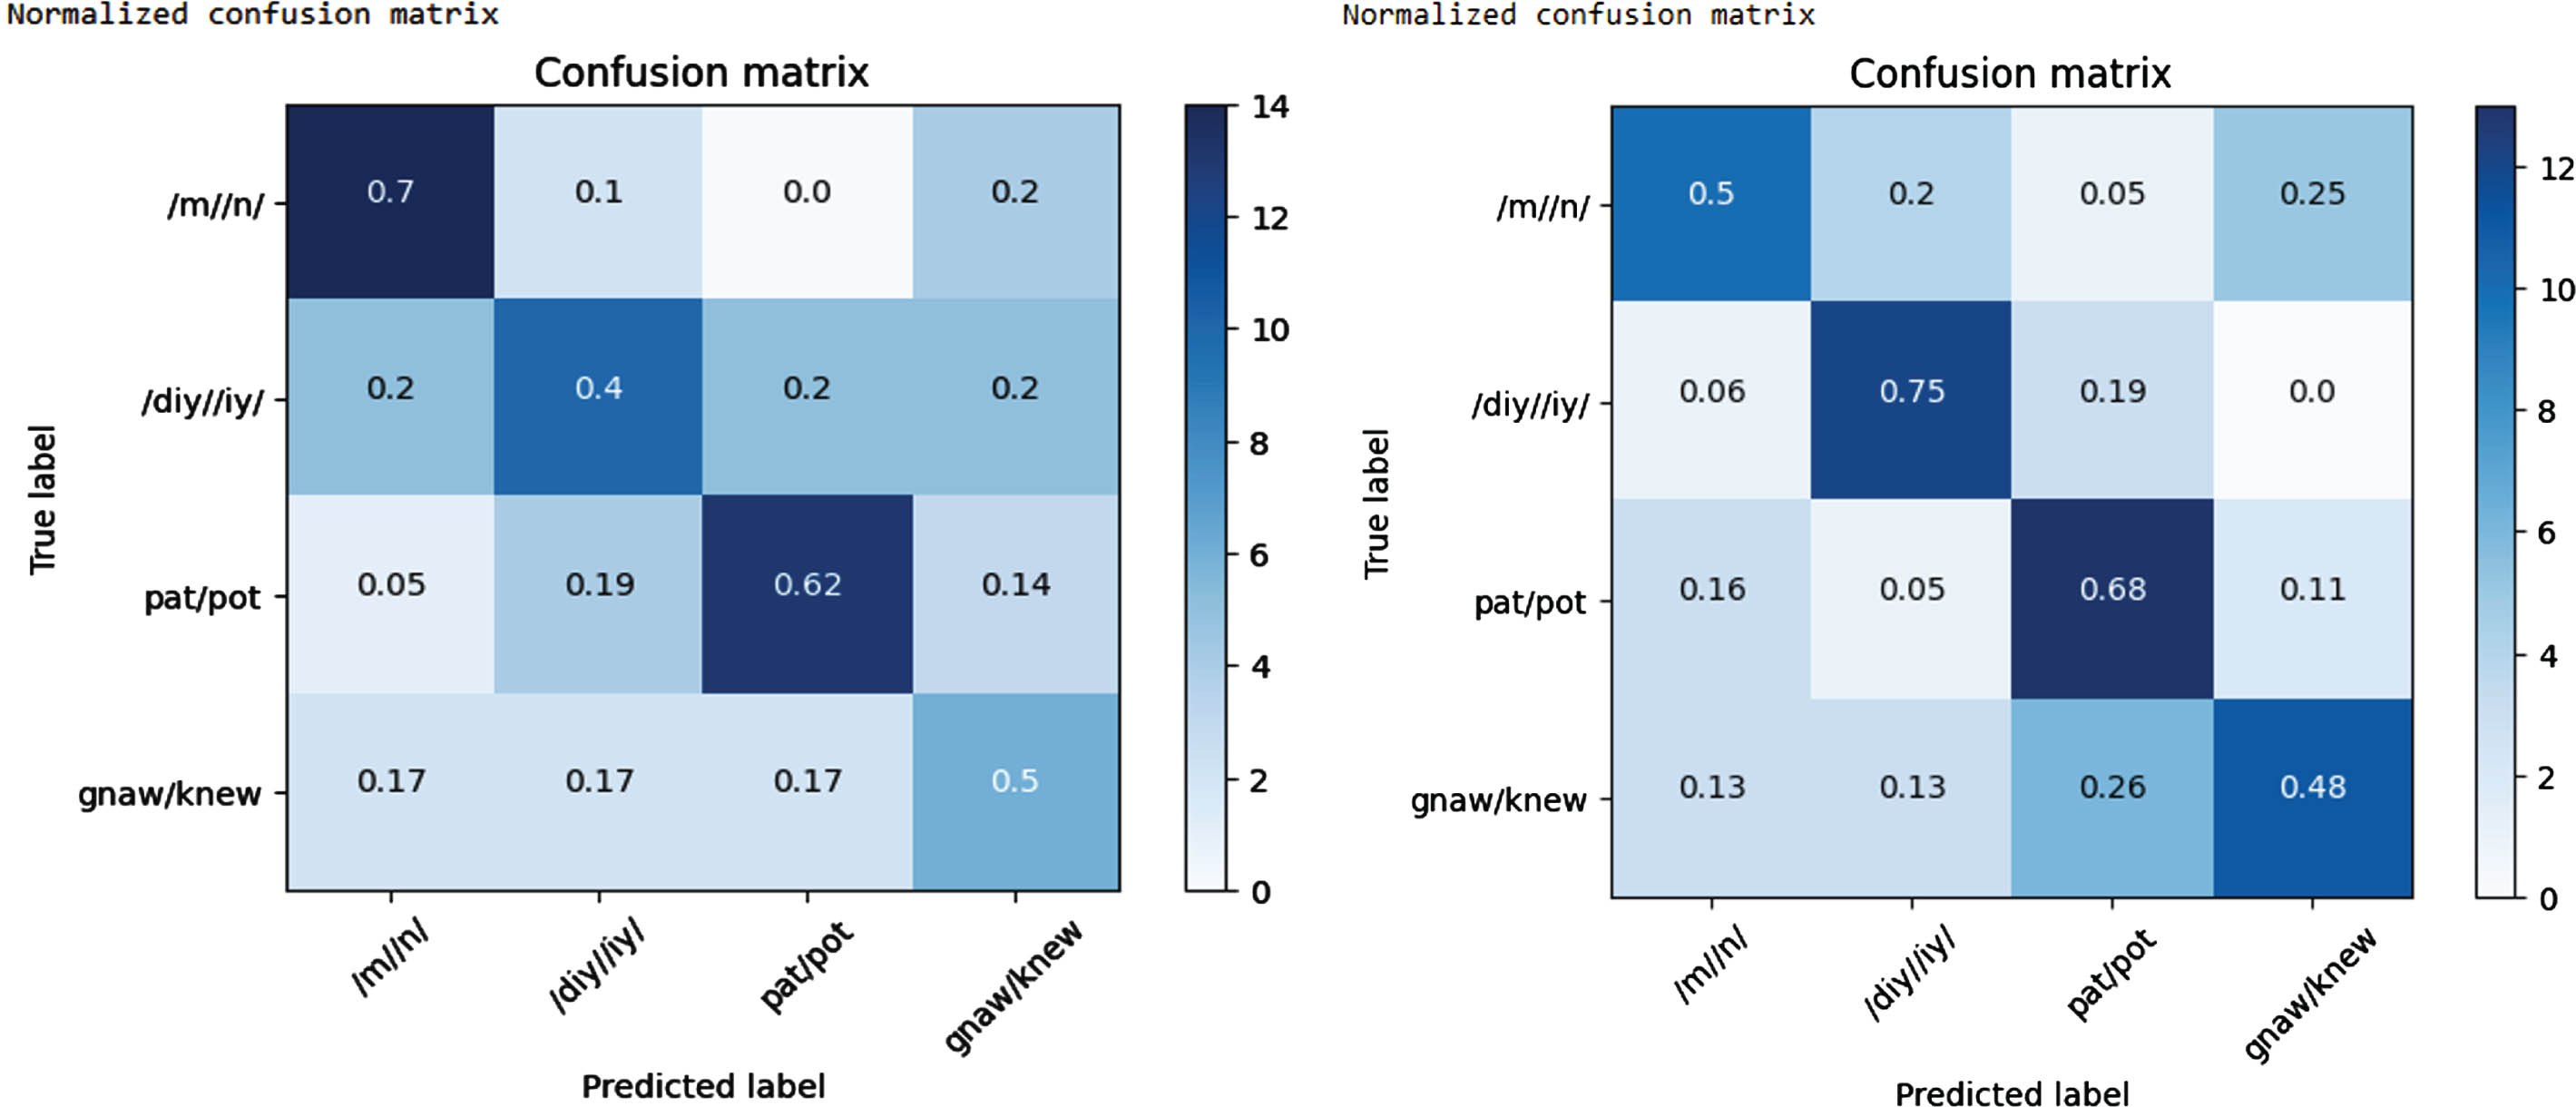
Confusion matrix for the cross subject analysis over thinking and Speaking state.
From the above Fig. 3, the confusion matrix pertains to the analysis conducted across subjects during the thinking state. The figure illustrates the depiction of 4 specific phonemes and 4 words, all of which are considered as labels. These 4 phonemes are categorized into 2 distinct classes: (/m/n/, /diy/iy/), while the 4 words are similarly grouped into 2 classes: (pat/pot, gnaw/knew). The methodology involved in this analysis includes the combination of trials involving these phonemes, utilizing a total of 13 subjects for training data and reserving one subject for testing purposes. For each unique combination, the average accuracy is computed. The calculations involved in determining the values are expressed through the equations (2), (3), (4), and (5) as delineated in the Fig. 3. This process results in the generation of a confusion matrix, which visually captures the relationships between the predicted labels and the actual labels based on the calculated average accuracy values. This comprehensive analysis provides valuable insights into the model’s performance across different phoneme categories and word groups during the thinking state.
The primary objective of the suggested approach, denoted as LSTM + GAT, for recognizing thinking and speaking states in EEG data across different individuals, is to enhance classification accuracy. This is achieved by fusing signals from diverse subjects. The LSTM + GAT model, a hybrid design encompassing both a Graphical Neural Network and two distinct feature selection techniques, is employed. The most optimal features are chosen from one of these methods. The proposed LSTM + GAT model effectively captures both temporal and spatial features from input signals, thus amalgamating statistical, temporal, and spatial characteristics for improved performance. The model integrates cross entropy loss. Our experimentation demonstrates that the LSTM + GAT model yields superior accuracy outcomes compared to alternative deep learning models when tested on the KaraOne dataset. This suggests that training the LSTM + GAT model with data from various subjects has the potential to construct effective classifiers for target subjects engaged in thinking and speaking tasks.