
Abstract
The static risk assessment method has difficulty tracking variations of the risk level, which is not conducive to the dynamic control of construction. Tunnel collapse during the construction of mountain tunnels has a dynamic evolution law and contains great risk of harm, and the corresponding dynamic risk assessment is extremely important. This study proposes a static and dynamic fuzzy uncertainty assessment method for the collapse risk of mountain tunnels. First, 150 tunnel collapse accidents were investigated and analysed, and the static and dynamic risk assessment index system of mountain tunnel construction collapse was established. Second, the DEMATEL method is processed by applying fuzzy logic, the subjective weight of each index is calculated, and the interaction between the indexes is analysed. Finally, the traditional VIKOR method is improved upon, and the weight of each assessment index is coupled and analysed. A static and dynamic uncertainty assessment model of the construction collapse risk of multiple construction sections is constructed. This method has been successfully applied to the risk assessment of tunnel collapse, and the assessment results are consistent with the actual construction situation. This study provides a new method for the static and dynamic assessment of mountain tunnel collapse risk.
Introduction
Mountain tunnels have experienced many disasters and accidents due to the existence of poor geological conditions, such as large deformation of the surrounding rock, tunnel collapse and water inrush, which seriously delay tunnel construction and can even cause casualties and/or property losses. Collapse is the most common and serious geological disaster during mountain tunnel construction [18, 31]. From 2002 to 2018, domestic tunnel collapse accidents accounted for 62.89% of the total number of tunnel geological disaster accidents, and approximately 150 workers died [39]. Through investigation, it was found that the irrationality of the excavation method, the complexity of geological conditions and the uncertainty of risk are important causes driving tunnel collapse [42]. Clearly, the mountain tunnel collapse risk assessment has become important an important work for predicting the risk level.
Frequent reports of tunnel construction accidents have attracted attention of scholars at home and abroad, and corresponding risk assessment theory has been created and risk assessment norms or standards have been formulated. H.H.Einstein [11, 12] described the risk analysis and risk decision-making processes and proposed the concept of tunnel risk assessment. On this basis, many scholars have proposed a series of tunnel risk assessment theories and methods and applied them to the construction of highway tunnels [22, 30, 33], railway tunnels [8, 32, 36] and subsea tunnels [2, 16, 51]. These studies have laid a theoretical and practical foundation for the development of tunnel risk assessment. In view of the necessity and importance of conducting tunnel risk assessment, many countries have developed and promulgated a series of norms or standards related to tunnel risk, such as the “Guidelines for Tunneling Risk Management” issued by the International Tunnelling Association [14], and the British Tunnelling Society and the Association of British Insurers jointly issued the “United Kingdom Tunnel Engineering Construction Risk Management Joint Specification” [34]. Additional resources include: “European Tunnel Safety Guide” developed by Inge Trjssenaar et al. [35], the “Interim Provisions on Risk Assessment and Management of Railway Tunnels” issued by the Ministry of Railways of China [27] and the “Analysis of Construction Risk Assessment System and Guide for Highway, Bridge and Tunnel Engineering” issued by the Ministry of Transport of China [13].
The collapse of mountain tunnels is the result of the chain reaction of internal factors (such as geological and natural conditions, etc.) induced by external factors (such as improper construction techniques, management defects, etc.) These factors are complex and undoubtedly uncertain [4], and many scholars have proposed solutions to these uncertain problems. For example, Huang et al. [19] proposed a new method for risk assessment of shield tunnel based on two-dimensional cloud model, which effectively addresses the issues of fuzziness and stochastic uncertainty in risk assessment of shield tunnel. Zhang et al. [46] established a tunnel collapse risk assessment index system based on the rough set theory and used the fuzzy comprehensive assessment method to evaluate risk. Wang et al. [38] evaluated the collapse risk of mountain tunnels before excavation commenced and support was emplaced based on the Mountain Tunnel Collapse Risk Assessment System (TCAS). Zhou et al. [50] used the analytic hierarchy process and fuzzy comprehensive evaluation method to construct a shallow tunnel collapse risk assessment model and proposed a suitable risk aversion method. Although the existing research has considered the risk uncertainty of tunnel construction, defects still exist, especially when referencing the lack of connection between the static analysis before construction and the dynamic analysis during construction, and the interaction between risk assessment indicators has not yet been quantified. To compensate for these defects, Zhang et al. [45] proposed a multilevel weighted iteration method to analyse the static risk and introduced the efficacy coefficient method to quantitatively characterize the dynamic risk. Zhan et al. [48] developed a risk assessment expert system for mountain tunnel collapse based on fuzzy mathematics and artificial intelligence methods, which avoids decision-making defects based on a single index during the assessment process. Chen et al. [4] coupled the information entropy of each risk factor to the set pair analysis system and established the entropy weight-set pair analysis model of tunnel risk assessment, which solved the distortion problem of the evaluation result caused by the maximum membership degree principle. However, most methods ignore the comprehensive impact of multiple indicators on the tunnel risk level and they only rely on the maximum risk level of a certain indicator as the tunnel risk level. In the process of calculation, there is a lack of refinement of risk assessment, and the comparison of internal risk degree is often neglected, which leads to the inconsistency between the evaluation results and the engineering practice. Moreover, most studies are limited to static risk assessment and fail to quantitatively analyze the dynamic risks in the construction process.
Multi-Criteria Decision-Making theory (MCDM) is the key to solving the above problems. Commonly used multi-attribute decision-making methods include the Technique for Order Preference by Similarity to an Ideal Solution (TOPSIS) method [21] and the VlseKriterijuska Optimizacija I Komoromisno Resenje (VIKOR) method [25]. Although the TOPSIS method can maximize the use of the original sample data, it cannot fully consider for the correlation between attributes [28, 29]. In contrast, the VIKOR method has a greater advantage in balancing the risk of the project and the risk of the most unfavourable indicators. Meanwhile, in the face of a large index set and a large number of index data, the VIKOR method can evaluate multiple schemes at the same time, which greatly simplifies the tediousness of the evaluation process. Currently, the VIKOR method has been applied and developed in other fields, such as urban disaster resilience assessment [49], combat threat assessment for air defence [24], Quality of Service (QoS) factor analysis [1], Sustainable Supply Chain Management (SSCM) research in the social science field [17] and Ideal vaccine administration research for COVID-19 [26]. In addition, the VIKOR method has been successfully applied to tunnel construction schemes and the selection of construction lines [40, 43]. In view of the advantages of this method, how to apply the VIKOR method for dynamic risk assessment of tunnel construction is worthy of further exploration [37].
In this study, a static and dynamic fuzzy uncertainty assessment method for the collapse risk of mountain tunnels is proposed by using the DEcision MAking Trial and Evaluation Laboratory (DEMATEL) method and the VIKOR model. The purpose is to improve the accuracy of the evaluation results, simplify the complexity of the evaluation process, and achieve simultaneous static and dynamic risk assessment of multiple construction sections and multiple sections. First, according to the statistical case results of tunnel collapse accidents and the monitoring indicators of mountain tunnel projects, the static and dynamic evaluation index system of collapse risk is established. Second, the DEMATEL method combined with fuzzy set theory is introduced to calculate the influential degree D, the influenced degree R, the centrality degree F and the cause degree G of each index, and then the causal relationship is analysed between the indexes and the index weight is determined. Then, based on the improved VIKOR method, the weight of each index is coupled to calculate the “comprehensive risk value” of each attribute. Finally, according to the static and dynamic risk assessment criteria, the risk level at each stage and section of construction is evaluated. Taking an actual tunnel as an example, the static and dynamic risk levels of tunnel construction collapse are also evaluated.
Assessment index system
Static assessment index system
For this study, the authors collected 150 tunnel collapse accident cases within China and abroad and summarized the main causes of these accidents, as shown in Appendix Table A. The statistical results show that tunnel collapse is the result of internal factors induced by external factors. Most collapse accidents are caused by the primary factors such as groundwater, grade of the surrounding rock, construction factors and heavy rainfall events, as shown in Fig. 1.
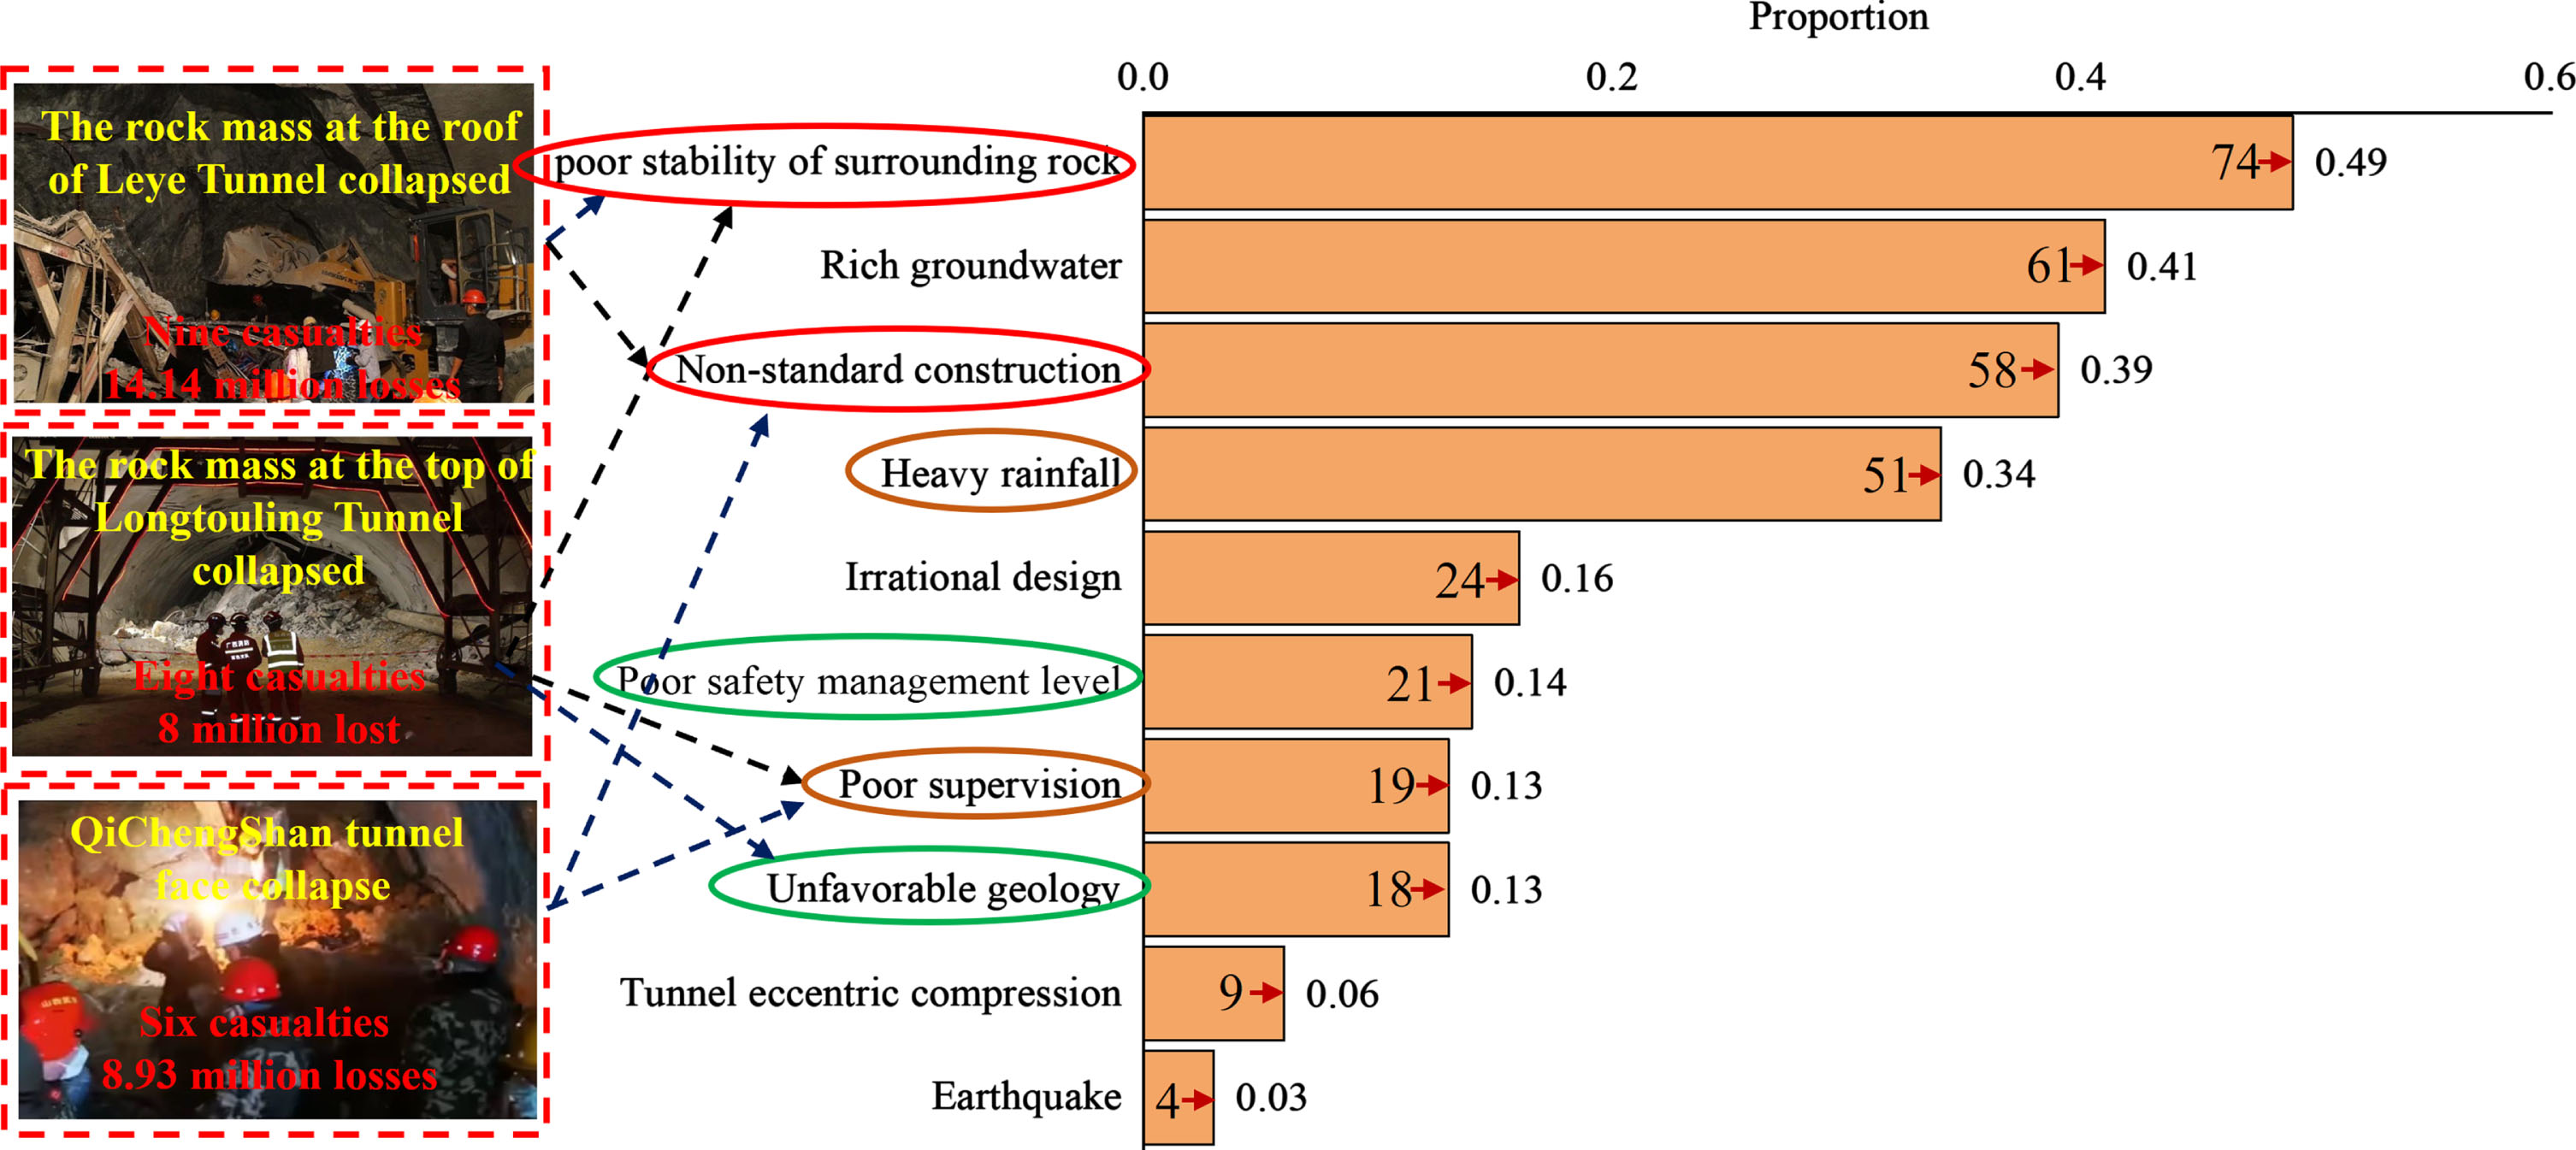
Survey results of tunnel collapse accidents.
Referring to the existing research reports, the secondary factors influencing mountain tunnel collapse are supplemented in [3–5, 46], and the static assessment structure system of mountain tunnel construction risk is established, as shown in Fig. 2. These include six first-level indicators, named in this study as: hydrogeological factors, construction factors, organizational management factors, intrinsic tunnel factors, natural factors and topographic factors. The first-level indicators are further subdivided into 25 secondary evaluation indicators such as the grade of the surrounding rock and the groundwater status. The risk level is divided into four grades by referring to the “Analysis of Construction Risk Assessment System and Guide for Highway, Bridge and Tunnel Engineering” [13], and the corresponding assessment scores are between 0-1. Among them, the grade I assessment score is [0,0.25], the grade II assessment score is (0.25,0.5], the grade III assessment score is (0.5,0.75], and the grade IV assessment score is (0.75,1]. Table 1 shows the assessment criteria of each index.
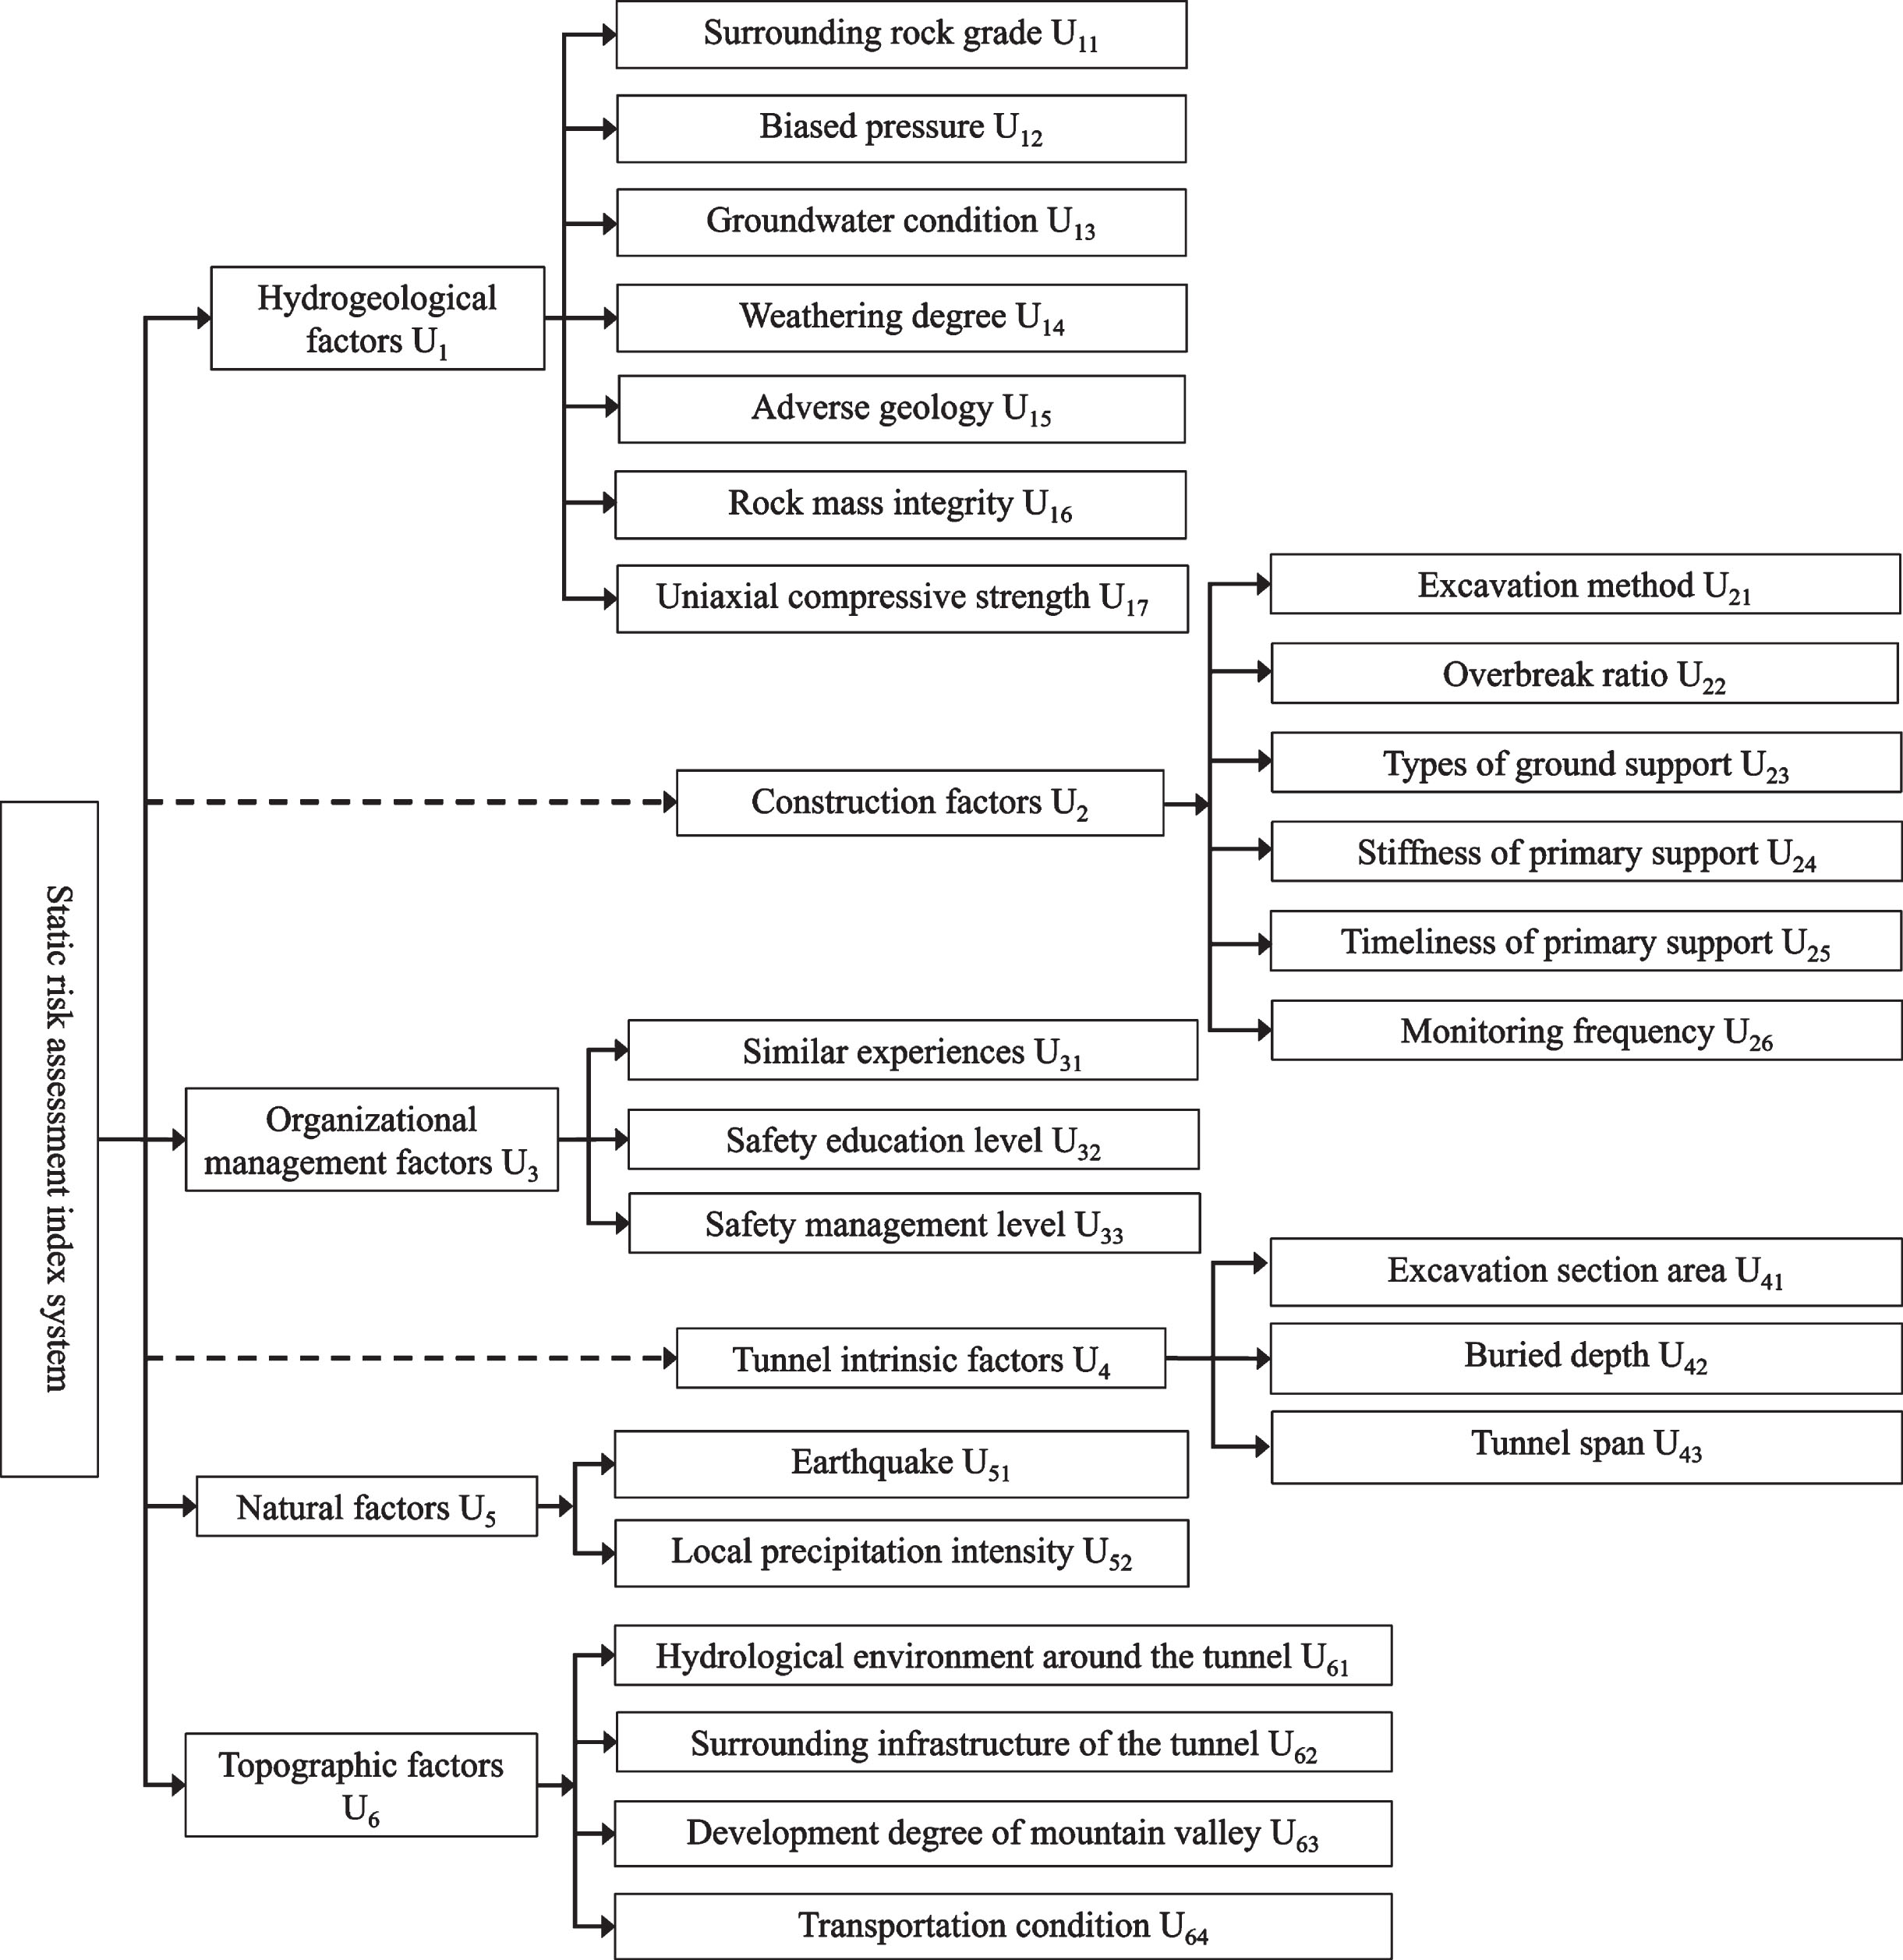
Static risk assessment index system.
Standard reference value of risk assessment index
A single monitoring project cannot accurately reflect the risk status during tunnel construction. To solve the problems of numerous measurement data and tedious analysis processes during the construction process, for this study, the main measurement items are used as the risk assessment indicators, and the data of each measurement item are quantified into comprehensive risk safety values through risk analysis methods. Among them, the vault subsidence and surrounding displacement that must be measured in the construction measurement system of the “new Austrian method” are used as the first-level indicators, and the first-level indicators are subdivided into different second-level indicators to establish a dynamic risk assessment index system for mountain tunnel construction, as shown in Fig. 3, including three measuring points of vault subsidence and two measuring points of surrounding displacement. The cumulative deformation value and deformation rate of each measuring point are taken as an independent influence index, and the arrangement of the monitoring points is shown in Fig. 4.

Dynamic risk assessment index system.
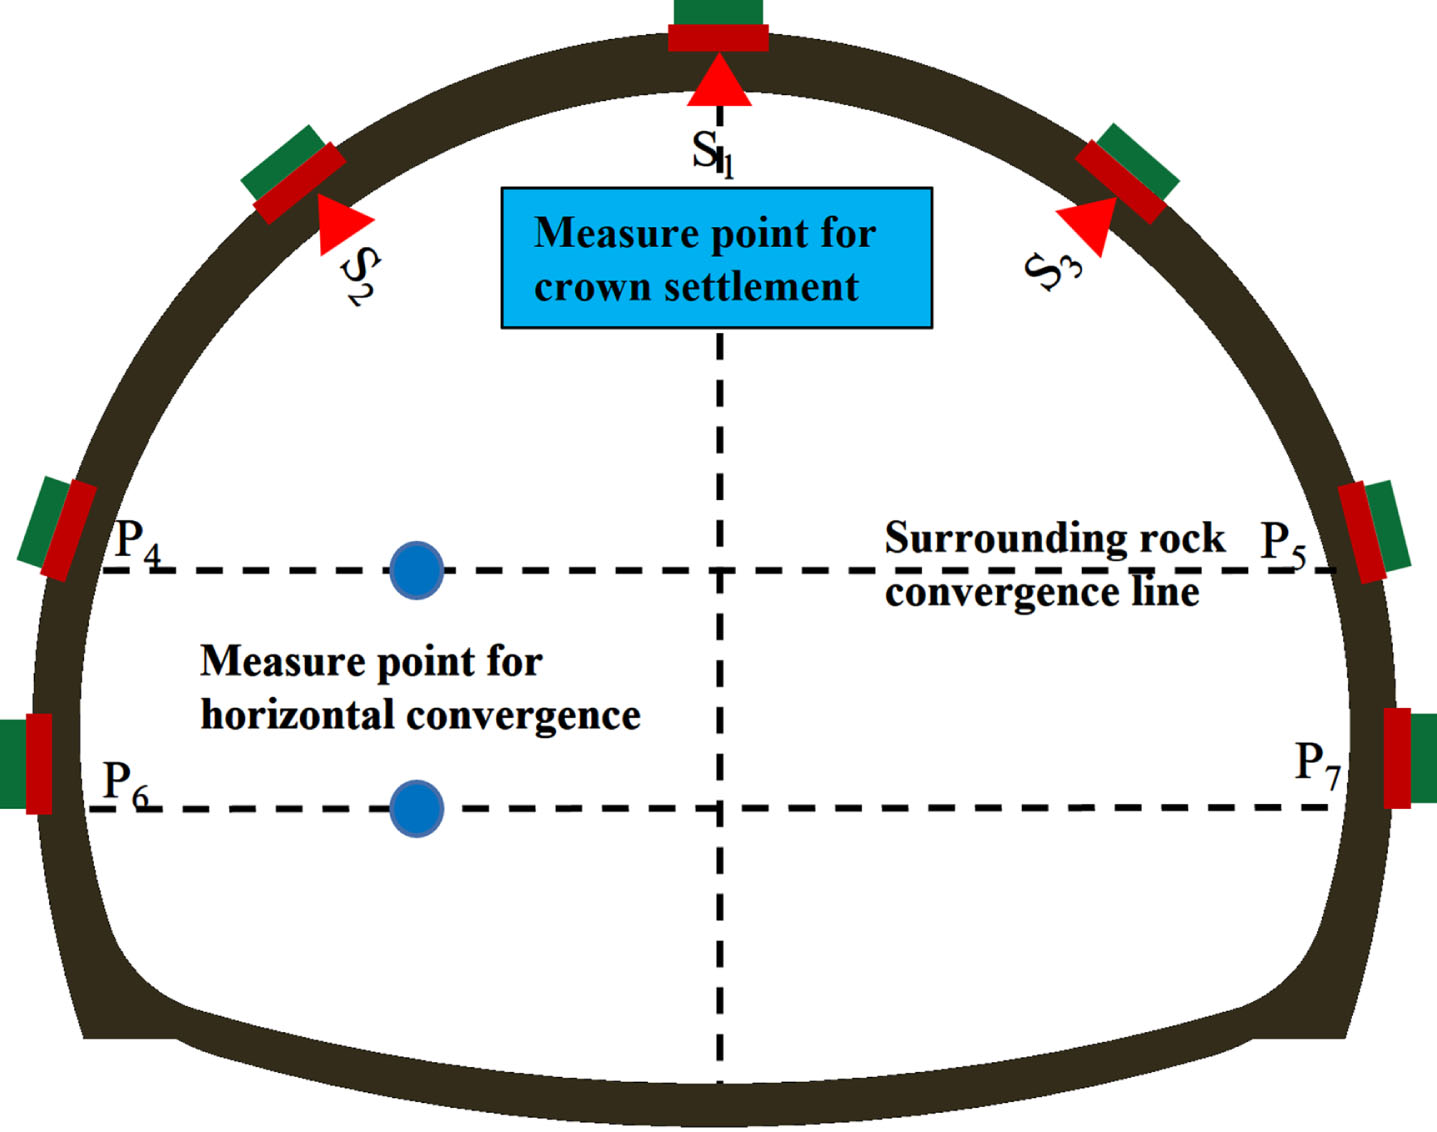
Monitoring point arrangement.
The assessment indexes are divided into three types: benefit, cost and moderate. The larger the actual data of the index, the more dangerous it is, which is categorized as a benefit assessment index, and the smaller the actual data of the index, the more dangerous it is, which is categorized as a cost assessment index. The indicators that should not be too large or too small are moderate indicators [47]. In the dynamic assessment, the required indicators are all efficiency indicators, and the greater the value of such indicators, the higher the degree of danger. To judge the safety state of the monitoring section, the early warning value and the dangerous value are set. According to the Technical Specification for Monitoring of Railway Tunnels: Q/CR 9218—2015, the reserved deformation of vault displacement and surrounding displacement is selected to be the dangerous value for the section, and 2/3 of the dangerous value is taken as the early warning value of the section.
Fuzzy DEMATEL method
The DEMATEL method combines graph theory and the matrix proposed by scholars A. Gabus and E. Fontela (Battelle Laboratory, Geneva, 1971). This methodology constructs a direct influence matrix based on the degree of influence between various factors and calculates the centrality and affected degree of each factor by quantifying the influence degree between each factor. Finally, based on the centrality and the affected degree, the logical relationship between the elements and the importance of each element in the system are determined [15]. The fuzzy DEMATEL method introduces fuzzy set theory into the traditional DEMATEL method, which can better address the uncertainty of information [9]. Therefore, to simply and efficiently solve the uncertainty of complex systems, this study uses triangular fuzzy numbers to address the problem of expert language evaluation [23]. From the data displayed in Table 2, the relationship between linguistic variables and fuzzy numbers is established. The steps of calculating the weight of each element by fuzzy DEMATEL are as follows [44]:
The mapping relationship between linguistic variables and fuzzy numbers
The mapping relationship between linguistic variables and fuzzy numbers
Step 1: Collect expert opinions according to Table 2, assume that
Step 2: Using the defuzzification method proposed by Opricovic et al. [28], the direct influence matrix
(1) Standardization of triangular fuzzy numbers
where (
(2) Reduce the fuzzy number and calculate the left and right standard values.
The left standard values are:
The right standard values are:
(3) Calculate the total standardized value and standard influence degree of influencing factor i of the expert scoring on influencing factor j.
where
(4) Calculate the influence degree a ij of influencing factor i of all expert scoring on influencing factor j.
where a
ij
is the value of column j and row i of direct influence matrix
Step 3: Calculate the standard influence matrix
Step 4: Calculate the comprehensive relationship matrix
Step 5: Calculate D i , R i , F i , and G i .
where D i represents the influence degree, representing the sum of the influence degree of index i on all other indexes; R i represents the affected degree, which means that factor i is affected by all other indicators; the centrality F i indicates the importance of the index; and the cause degree G i represents the strength of causality between indicators.
Step 6: Calculate the weight of each index.
The Delphi method is used to collect the assessment data of each index, and then the index weight is calculated according to the fuzzy DEMATEL method. First, tunnel industry experts from project design units, universities and construction units are invited to score the assessment indicators according to Table 3 (select the five most representative assessment results) and construct the initial evaluation matrix. Then, according to steps 1–4 in Section 3.1, the direct influence matrix is constructed by defuzzifying the initial assessment matrix, and the comprehensive relationship matrix is calculated. Finally, according to steps 5-6 in Section 3.1, the influence degree D i , the affected degree R i , the centrality F i and the cause degree G i of each factor are calculated to determine the weight w i of the assessment index. Tables 3 and 4 are the results of the static and dynamic assessment index weights, respectively.
Static assessment index weight calculation results
Static assessment index weight calculation results
Based on the calculation results of Tables 3 and 4, the causality diagram between each assessment index is drawn with the centrality F i as the horizontal axis and the cause degree G i as the vertical axis, as shown in Figs. 5 (a) and (b). The causality of each index in the diagram is divided into four categories: Quadrant I indicates that the index is of high importance and is the cause factor, quadrant II indicates that the index is of low importance and is the cause factor, quadrant III indicates that the index is of low importance and is the result factor, and quadrant IV indicates that the index is highly important and is a result factor.
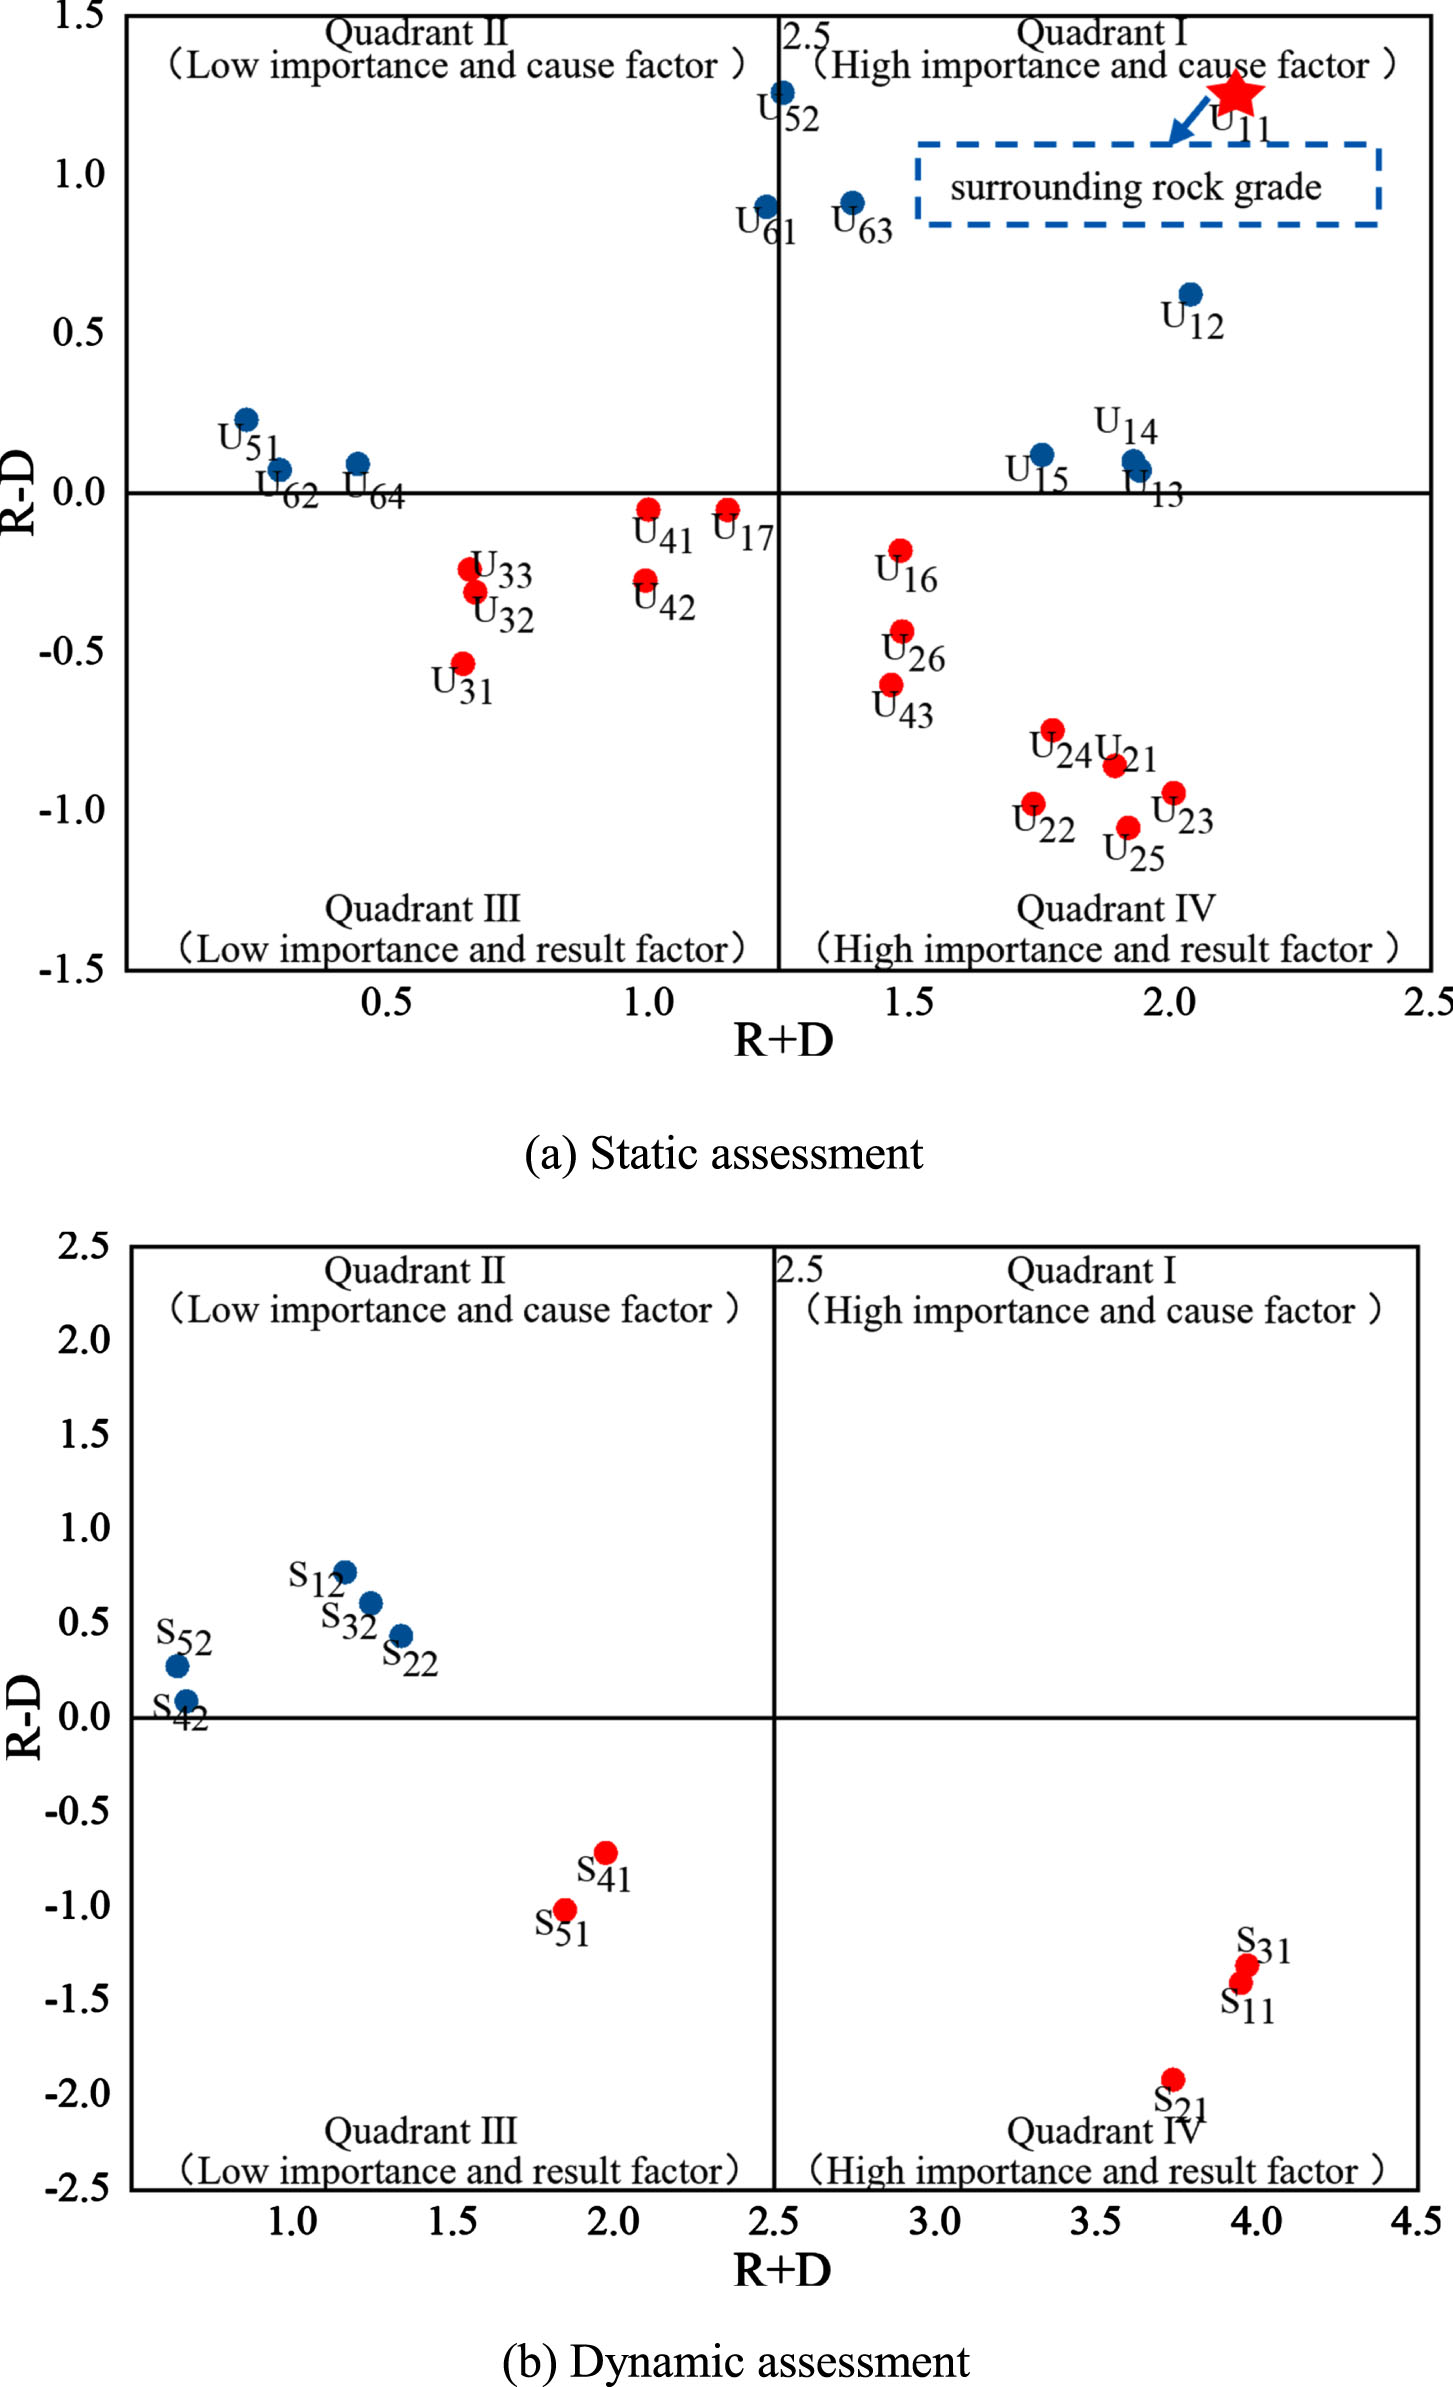
Causality between indicators.
Dynamic assessment index weight calculation results
From Fig. 5 (a), it can be seen that index U11 (surrounding rock grade) is in quadrant I, and the centrality and cause degree are the highest, indicating that the index surrounding rock grade is the most important in the evaluation process and has the greatest impact on other indicators. For example, when the surrounding rock grade is high, it will affect the selection of excavation methods, stratum support types, monitoring frequency and other indicators. Indexes U21, U22, U23, U24, and U25 are in quadrant IV, with a high degree of importance, meaning they are outcome indicators and are more susceptible to other indicators. It can be seen from Fig. 5(b) that the indicators S31, S11 and S21 are in quadrant IV, which are highly important, are result factors and are easily affected by other factors.
Through the above analysis, it can be found that when evaluating the collapse risk during mountain tunnel construction, each index does not act alone but affects each other. Therefore, when calculating the weight, it is necessary to consider the degree of interaction between the indicators and distinguish whether the indicators belong to the cause group or the result group. This weight calculation method can more accurately evaluate the safety of the tunnel, which is of great significance for safe tunnel construction.
The VIKOR method is a comprehensive assessment method for multi-index decision-making problems. The traditional method ranks the alternatives by maximizing the group effect value and minimizing the individual regret value, accounting for the overall project risk and the risk of the most unfavourable indicators, but it cannot quantify the risk loss of each scheme. To give full access to the inherent VIKOR method advantages, the VIKOR method is improved as follows: a) The concepts of “dangerous group”, “safe group” and “early warning group” are introduced when constructing the standardized decision matrix, which solves the problem that there is no uniform standard for calculating L p measure degree and is used as a threshold in dynamic evaluation to judge the safety state during excavation. b) To more comprehensively describe the difference between the alternative and the positive ideal solution, the concept of “direction” is introduced into the distance formula. c) The “comprehensive risk value” is proposed as a safety value to quantify the degree of risk loss.
Principle of the improved VIKOR method
The VIKOR method uses the distance measure L p to characterize the proximity of a certain point to the ideal point after considering the weight of different indicators [28, 29]. This study introduces the concept of “direction” based on the concept of “distance measure” in the traditional method. As shown in Fig. 6, when the measured value of a point is greater than the positive ideal solution, the direction of the distance between the point and the positive ideal solution is negative, and vice versa, which is shown in Equation (17).

Improved VIKOR method L p measure diagram.
where ω
j
represents the weight of each index in the attribute set,
Step 1: Collect data and construct a standardized decision matrix.
Static assessment: For these quantitative indicators, the measured data of each indicator are converted to values between 0 and 1 according to the evaluation criteria (Table 1). For these qualitative indicators, summarize the scores of each expert and take the average value as the final evaluation score. Then, the scheme set is composed of different construction sections, dangerous groups and safety groups, and the attribute set is composed of each risk index, which together constitute the standardized decision matrix
Dynamic assessment: Prior to the stability of the surrounding rock, the deformation value and deformation rate (of all monitoring points) of the monitoring section are collected every day. Taking 7 days as a cycle, the cumulative deformation value and average deformation rate within 7 days are calculated. Then, the initial matrix is constructed by the cumulative deformation value, average deformation rate, dangerous group, safety group and early warning group. The standardized decision matrix
where x ij is the data of i scheme under j index, which represents the measured data in the initial matrix in this paper. When the value is greater than the dangerous value, y ij is greater than 1. x m is the safety value, taken as the index threshold in the safe state, and x w is the risk value, taken as the index threshold in the dangerous state.
Step 2: Calculate the positive and negative ideal solution, group effect value and individual regret value.
where w i represents the weight of each index and S i represents the group effect value rwhich reflects the overall degree of risk of each construction section after considering the influence of all evaluation indexes. The smaller the value is rthe higher the risk level of the construction section is rand the more dangerous it is than other construction sections. R i represents the individual regret value rreflecting the worst performance of each construction section under a single index. The smaller the value is rthe more dangerous the construction section is compared to other construction sections.
Step 3: Calculate the comprehensive evaluation value.
where v represents the decision coefficient, v ∈ 0,1], whenv > 0.5, focus is placed on considering the tunnel overall risk decision, when v = 0.5, both the overall risk of the tunnel and the local risk are considered for decision-making, and when v < 0.5, focus is placed on considering the most unfavourable risks of the tunnel for decision-making.
Step 4: Calculate the comprehensive risk value.
Static assessment:
Dynamic assessment:
Static risk assessment criteria
According to step 1 of Section 4.2, the calculated comprehensive evaluation value is a higher dimensional distance value obtained after comprehensively considering distance between all indicators and the positive-negative ideal solution value, and the comprehensive evaluation value is within the risk level [0-1] of Table 1. Therefore, according to the specification “Analysis of Construction Risk Assessment System and Guide for Highway, Bridge and Tunnel Engineering” [13], the comprehensive risk value calculated by Equation 23 is divided into four intervals, which are low risk, medium risk, high risk and extremely high risk, as shown in Table 5.
Static assessment risk classification criteria
Static assessment risk classification criteria
The comprehensive risk value calculated by Equation 24 is used as the safety value of the tunnel dynamic assessment. The safety value reflects the risk level of tunnel collapse. The smaller the safety value is, the higher the risk level is. In the calculation process, it is found that when the measured deformation data are within the early warning value and dangerous value, the comprehensive risk value is 60 points and 40 points, respectively. Therefore, 60 points and 40 points are used as the thresholds to judge the safety state of the collapse risk during tunnel construction. Then, combined with the results of the dynamic risk classification of collapse and the large deformation of mountain tunnels as the reference [45], the dynamic risk classification criteria are determined, shown in Table 6. When the safety value is less than 60 points, the stability of the surrounding rock is poor, and protective measures such as support are needed. When the safety value is less than 40 points, the surrounding rock is unstable, excavation must be stopped, and engineering measures must be taken.
Dynamic assessment risk classification criteria
Dynamic assessment risk classification criteria
According to the fuzzy DEMATEL method and the VIKOR model, a static and dynamic evaluation model for construction collapse of mountain tunnels is built through static risk assessment, dynamic risk assessment and risk control. Figure 7 is the flow chart of the collapse risk assessment of mountain tunnel construction.
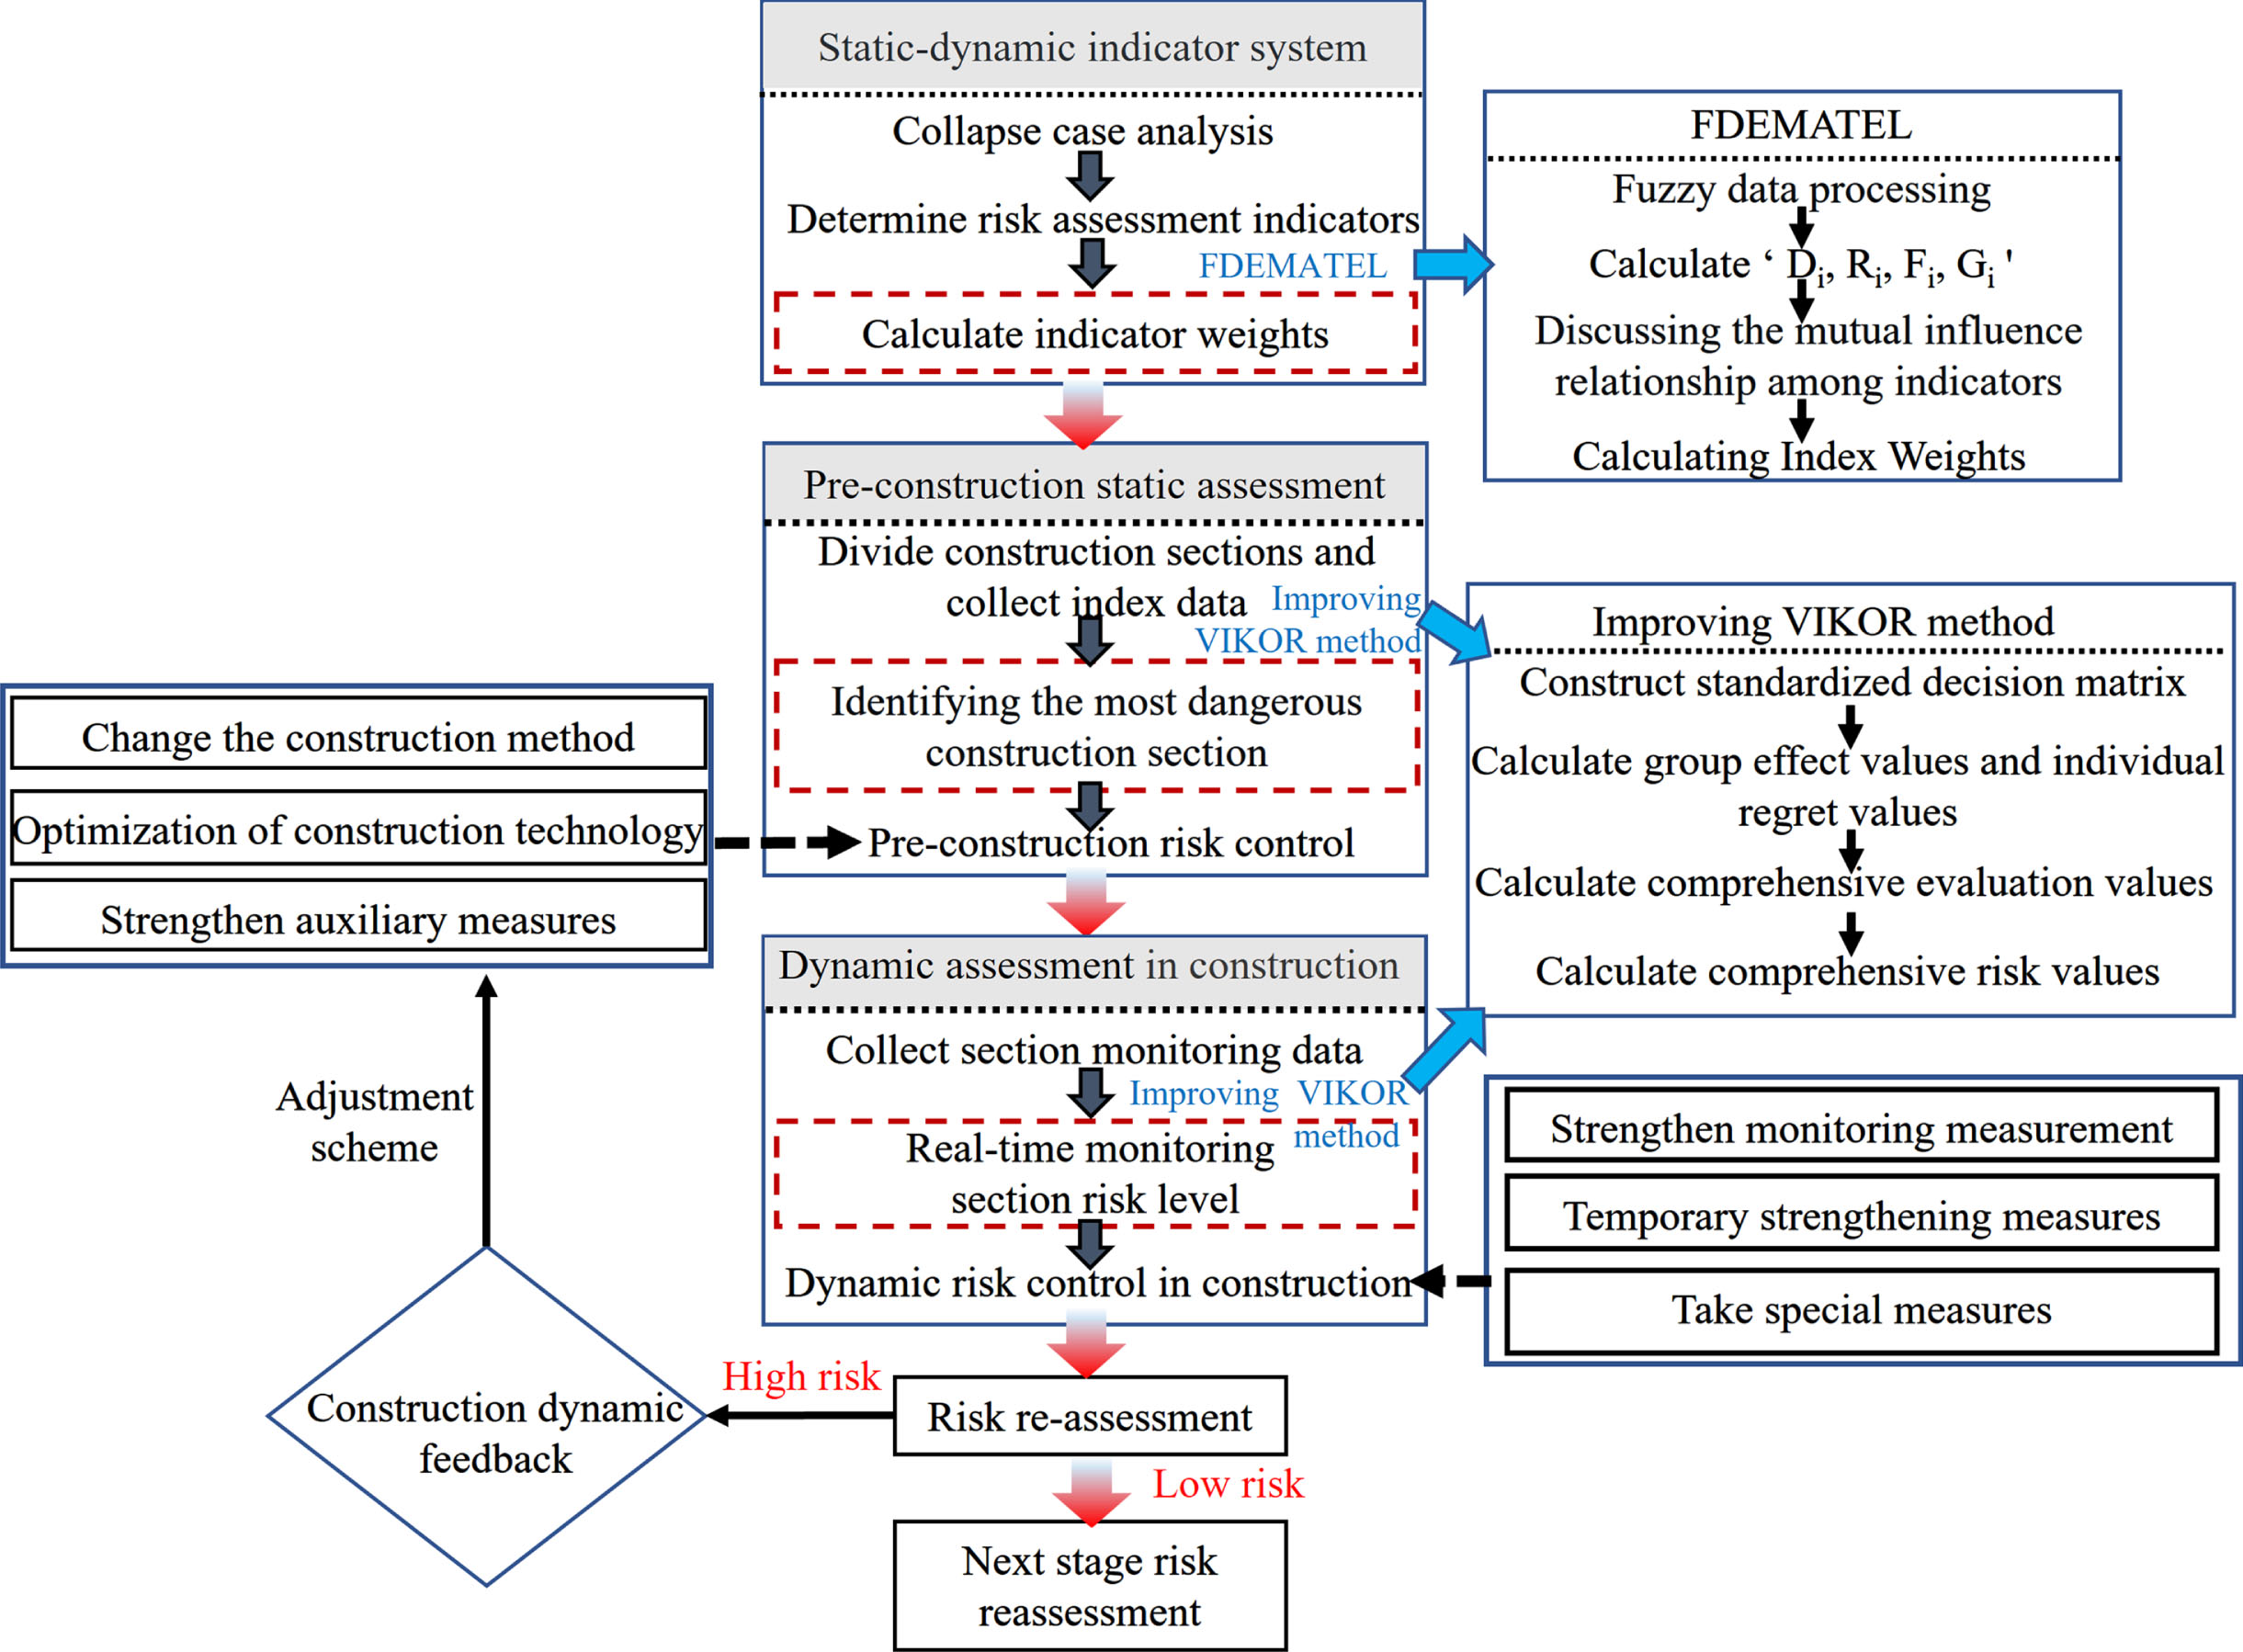
Collapse risk assessment process.
Project overview
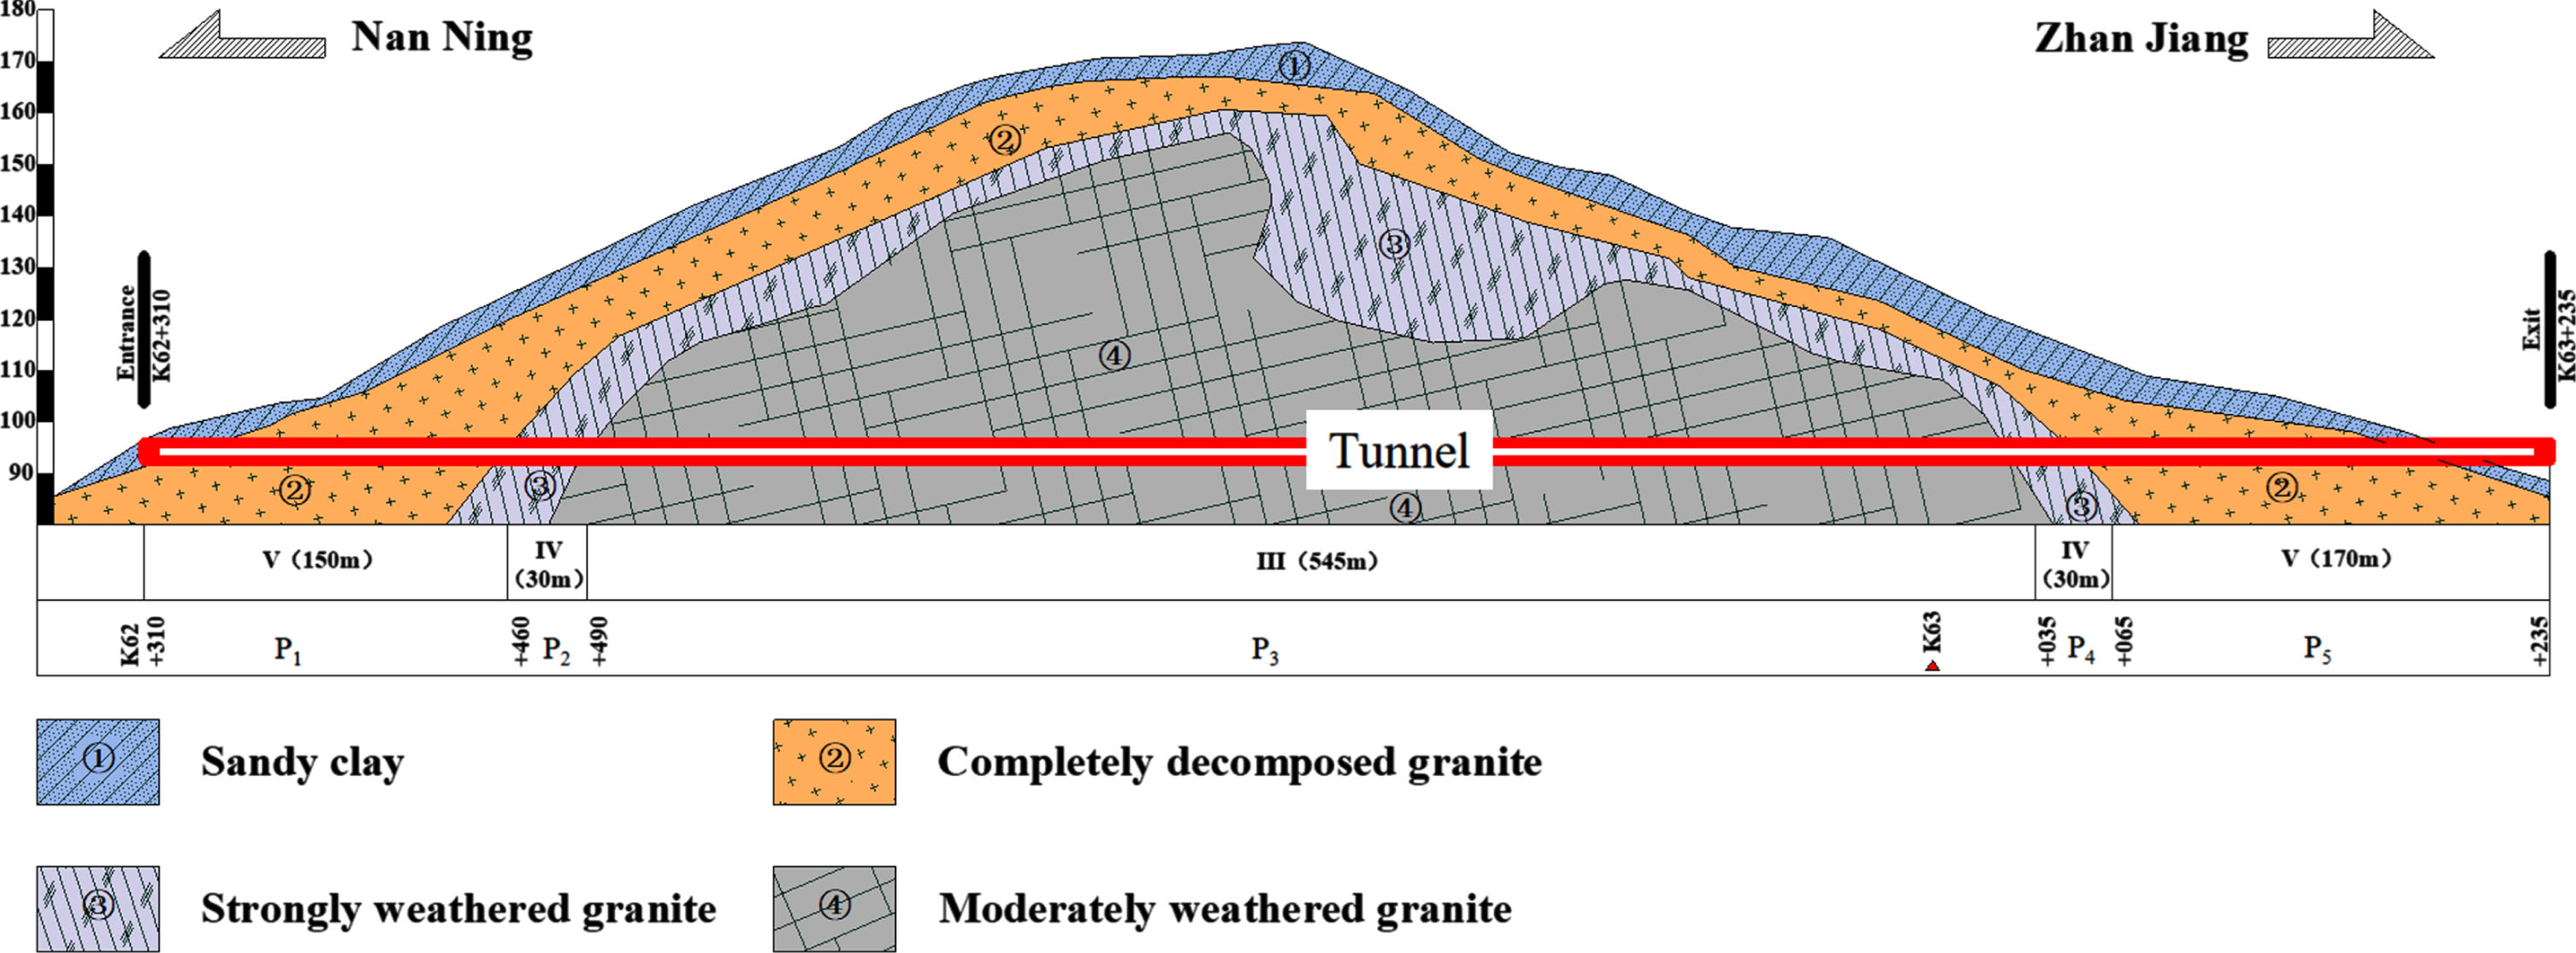
To verify the effectiveness of this method, the Tongluoling Tunnel of the Nanzhan Expressway in Guangxi is taken as an example for analysis, as shown in Fig. 8. The Tongluoling Tunnel is a separated middle tunnel with a maximum buried depth of approximately 165.86 m. The geological longitudinal section is shown in Fig. 9. In this study, the right section of the tunnel is taken as the research object. The starting and ending pile numbers are K62 + 310 ∼ K63 + 235, and the design length is 925 m. The geological condition division method is used to divide the right tunnel of the Tongluoling Tunnel, shown in Table 7.
Geological division of the right section of the Tongluoling Tunnel
Geological division of the right section of the Tongluoling Tunnel
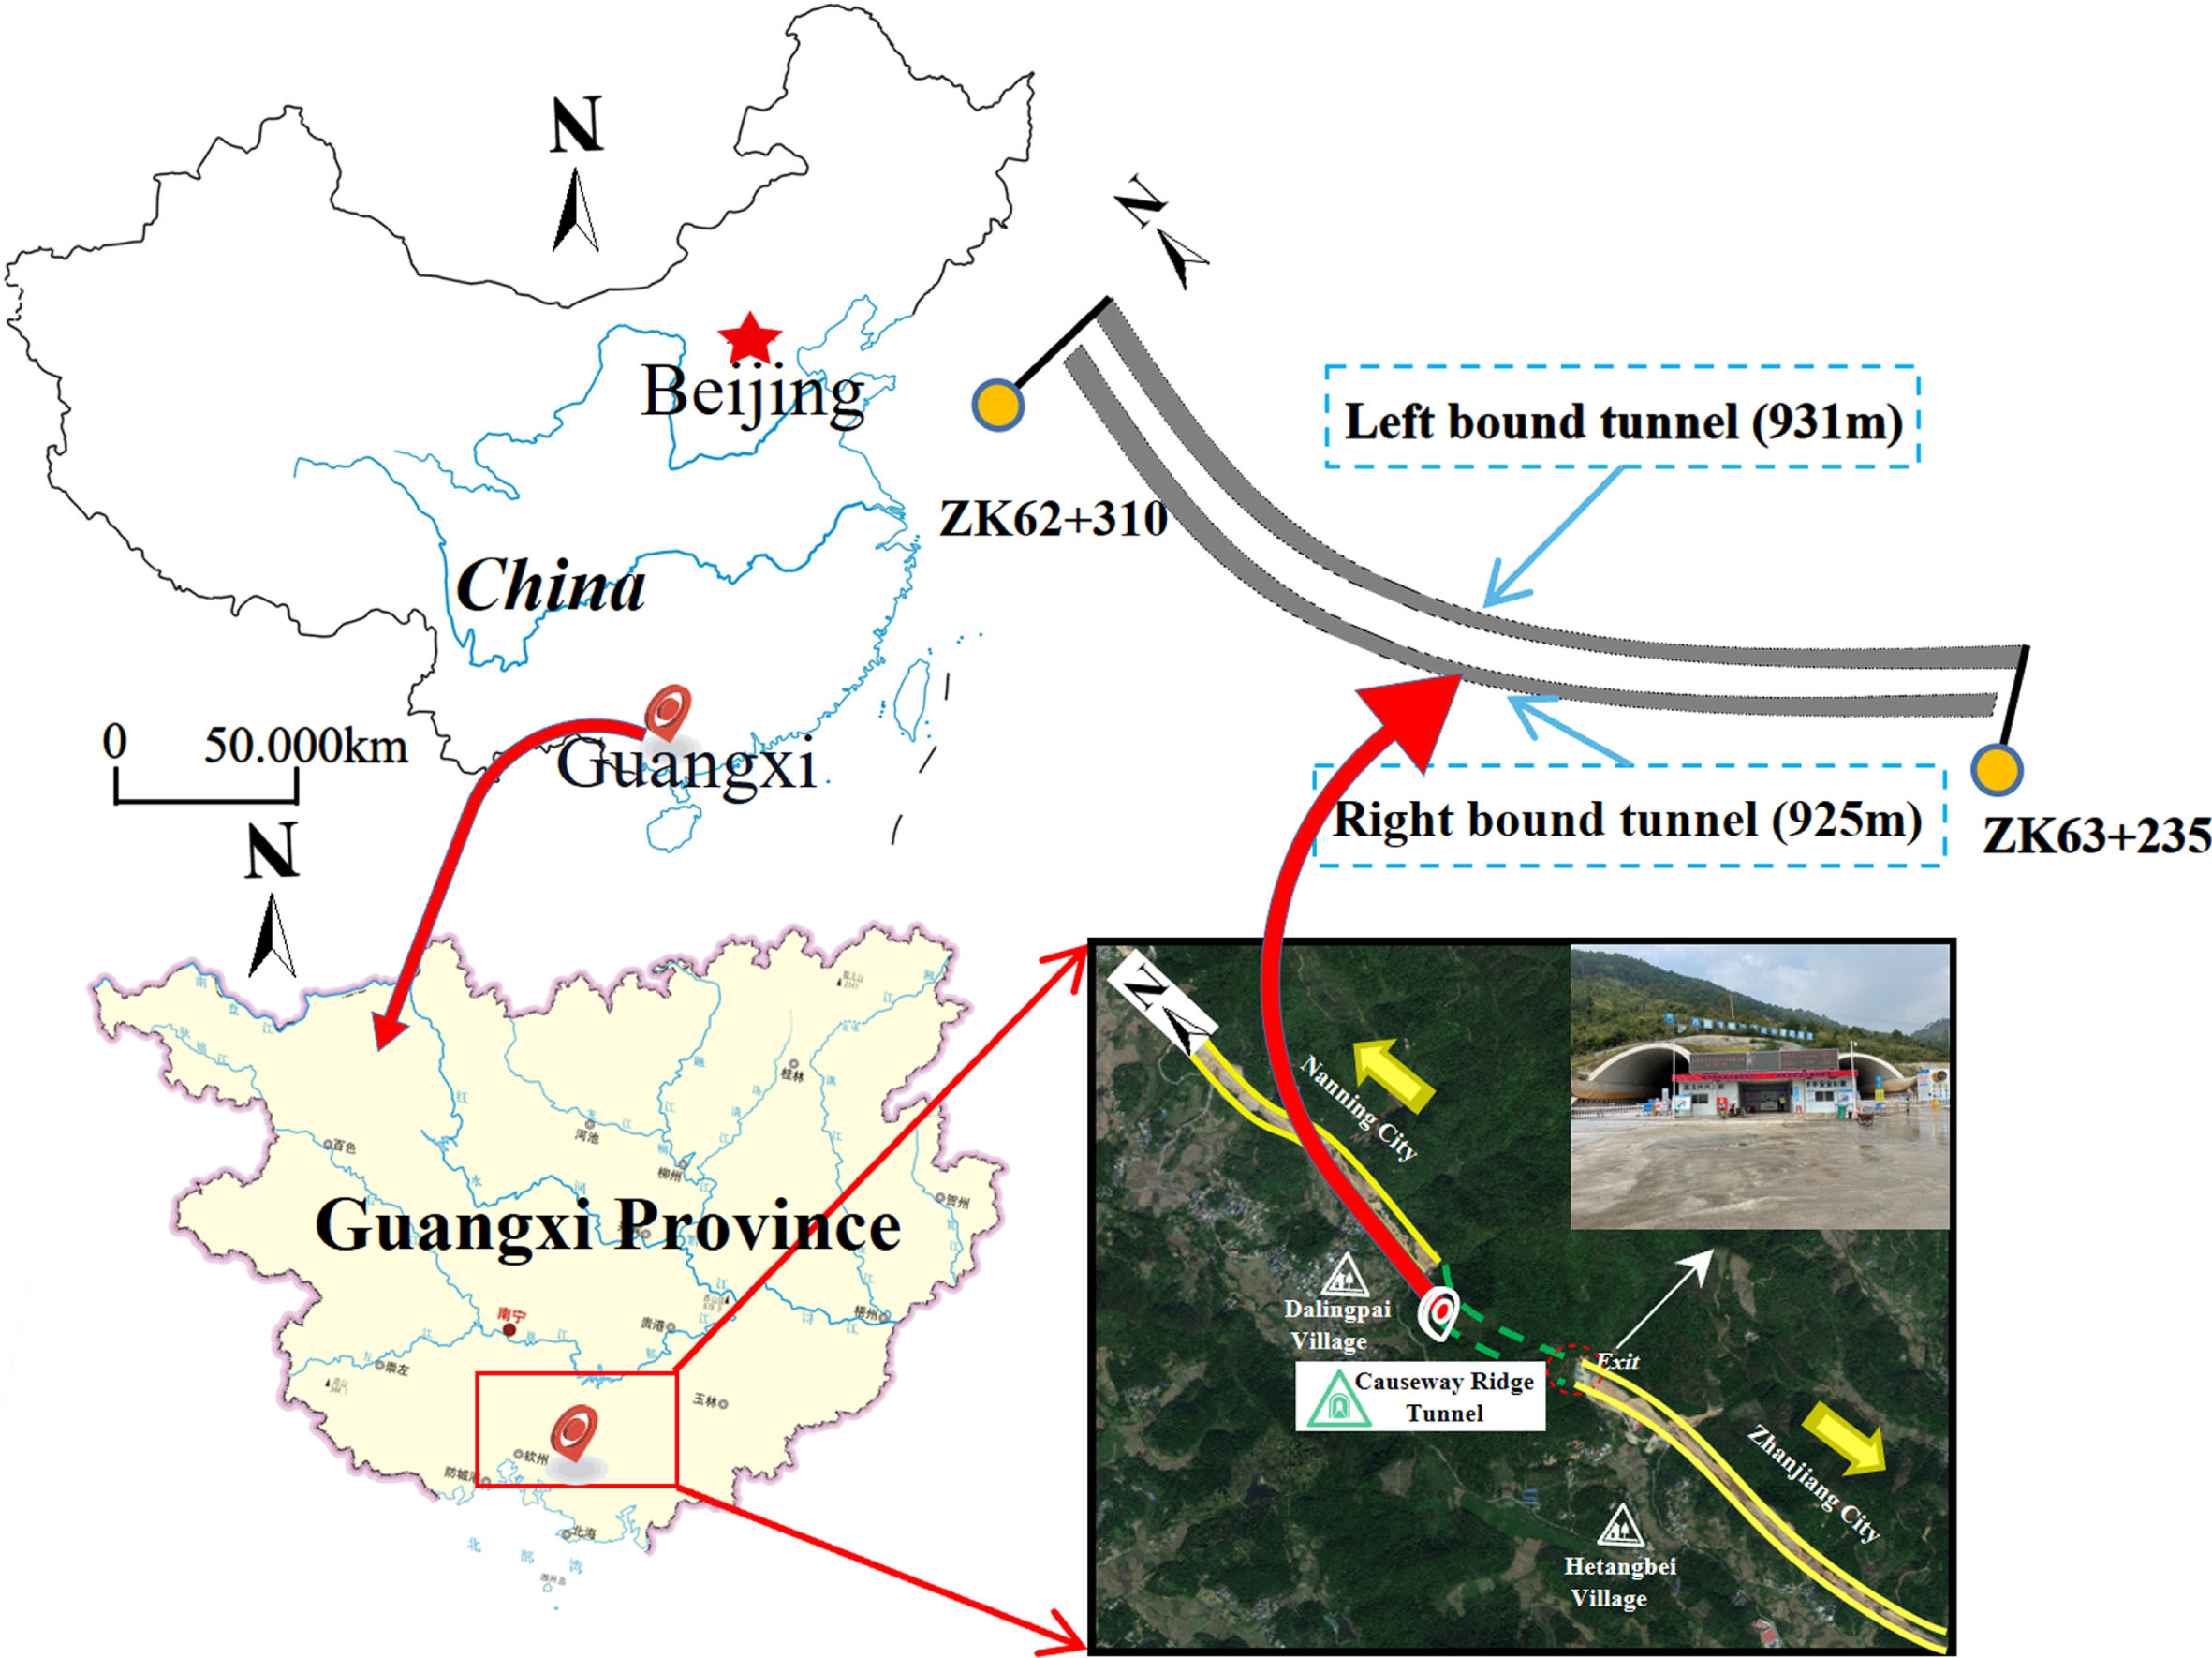
Plane location diagram of the Tongluoling tunnel.
According to the tunnel geological conditions, combined with advanced geological prediction and on-site construction organization design, a static construction collapse risk assessment of five construction sections of the Tongluoling tunnel was carried out. First, from the values in Table 1 (standard reference value of risk assessment index), the expert scoring situation and field survey data of different construction sections are transformed into 0-1; the scheme set is composed of different construction sections, dangerous schemes and safety schemes, and the attribute set is composed of each risk index. The standardized decision matrix
Calculation and sorting results of the comparison and selection schemes for each construction section
Calculation and sorting results of the comparison and selection schemes for each construction section
Risk levels of each construction section
From the values displayed in Table 8, it can be seen that regardless of whether the VIKOR model takes different decision coefficients, the ranking results are P5 > P1 > P2 > P4 > P3, indicating that the P5 construction section is more dangerous than the other construction sections regardless of the overall project risk or poor individual indicators. From the Table 9 data, the risk level of the P5 construction section and P1 construction section is at Level III, which belongs to a high risk state and the construction design needs to change. The excavation should focus on the P5 and P1 construction sections and increase the number of daily monitoring events to prevent large deformation of the surrounding rock and vault collapse.
Through static assessment, it can be seen that the construction risk of the P5 construction section of the tunnel is the highest, which belongs to the high-risk category. For this reason, this study collected the cumulative deformation value and deformation rate of daily vault subsidence and surrounding displacement of 160 monitoring points in 23 monitoring sections for the P5 construction section.
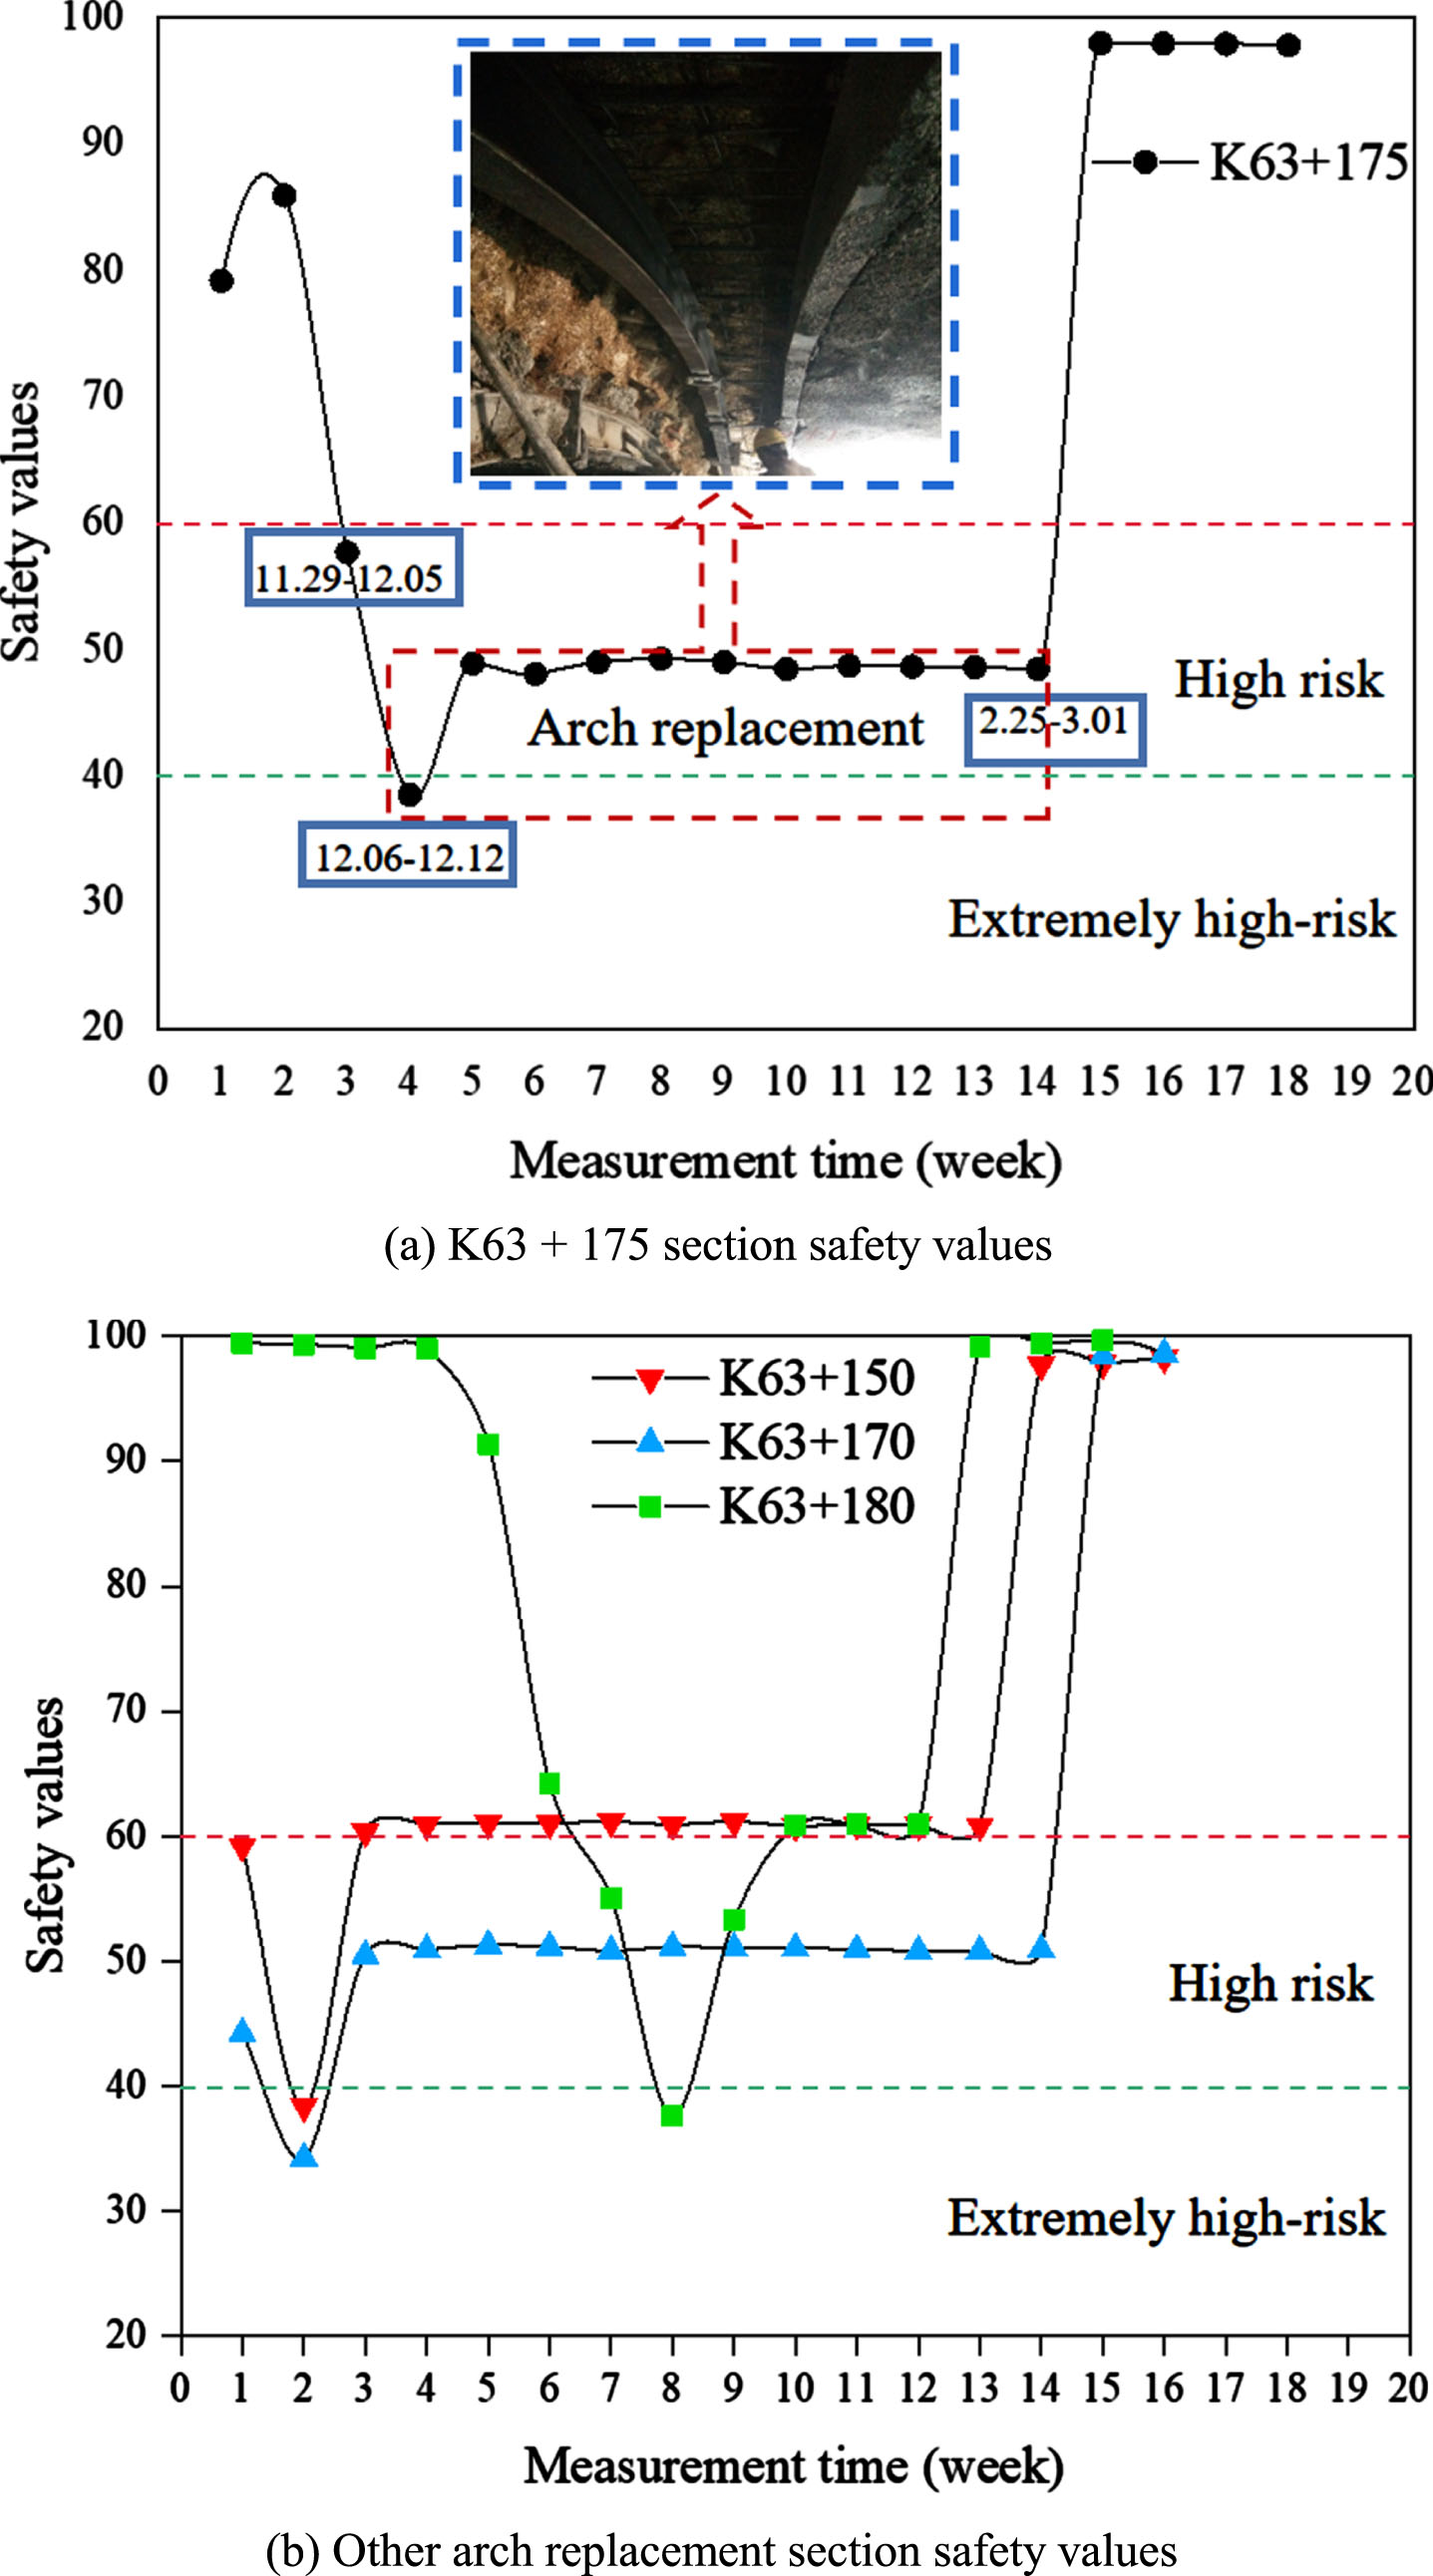
The K63 + 175 section of the P5 construction section is selected as the research object for performing the dynamic risk assessment, and the risk value, safety value and early warning value of the K63 + 175 section are given, as shown in Table 10. First, according to step 1, the measured data of each index are collected, and the standardized construction decision matrix is constructed, which is detailed in Appendix Table B2. Then, from Equations (19)–(22), the group effect value, individual regret value, comprehensive assessment value and comprehensive risk value of different periods are calculated. The calculation results are shown in Table 11. Finally, the comprehensive risk values of different periods are calculated according to Equation (24), and the results are shown in Fig. 9.
Risk value, safety value and early warning value of the K63 + 175 section
Risk value, safety value and early warning value of the K63 + 175 section
S, R, Q, and T value results of different periods
The results shown in Fig. 9 (a) reveal that the comprehensive risk value of the K63 + 175 section decreases rapidly from week 2 to week 4, and the safety value is less than 40 points in week 4, which is in a very high-risk state. At this time, the construction unit urgently suspended the excavation of the tunnel face, consulted with industry experts, and took reinforcement measures. First, grouting reinforcement of the loose surrounding rock is carried out by using an advanced grouting small duct. Among them, the grouting material is a double slurry of cement and water glass, the initial grouting pressure pressure is 0.5∼1.0 MPa, and the final pressure is 2.0 Second, after the grouting attains a specified strength value, the primary support is replaced by arches in succession, and the secondary lining is applied when the assessment results remain stable.
Geological profile of the Tongluoling Tunnel.
During this period, due to grouting reinforcement, the safety value increased to 48.9 points from week 5 to week 14 and remained stable. Arch replacement was completed in week 15, and the risk safety value rose to 98 points, remained stable until week 18, and remained in a safe state therafter. At this time, the surrounding rock is stable, the subsidence deformation rate of the section vault continuously decreases, and the monitoring stops. This study also conducted a dynamic assessment of the remaining 19 sections of P5. The assessment results of K63 + 180, K63 + 170 and K63 + 150 were lower than 40 points in weeks 2 and 8, and reinforcement measures were taken to avoid the risk of collapse. The assessment results are shown in Fig. 9 (b). Figure 10 shows the field diagram of the arch replacement and the local reinforcement of the arch section.
Changes in risk safety values of different sections.
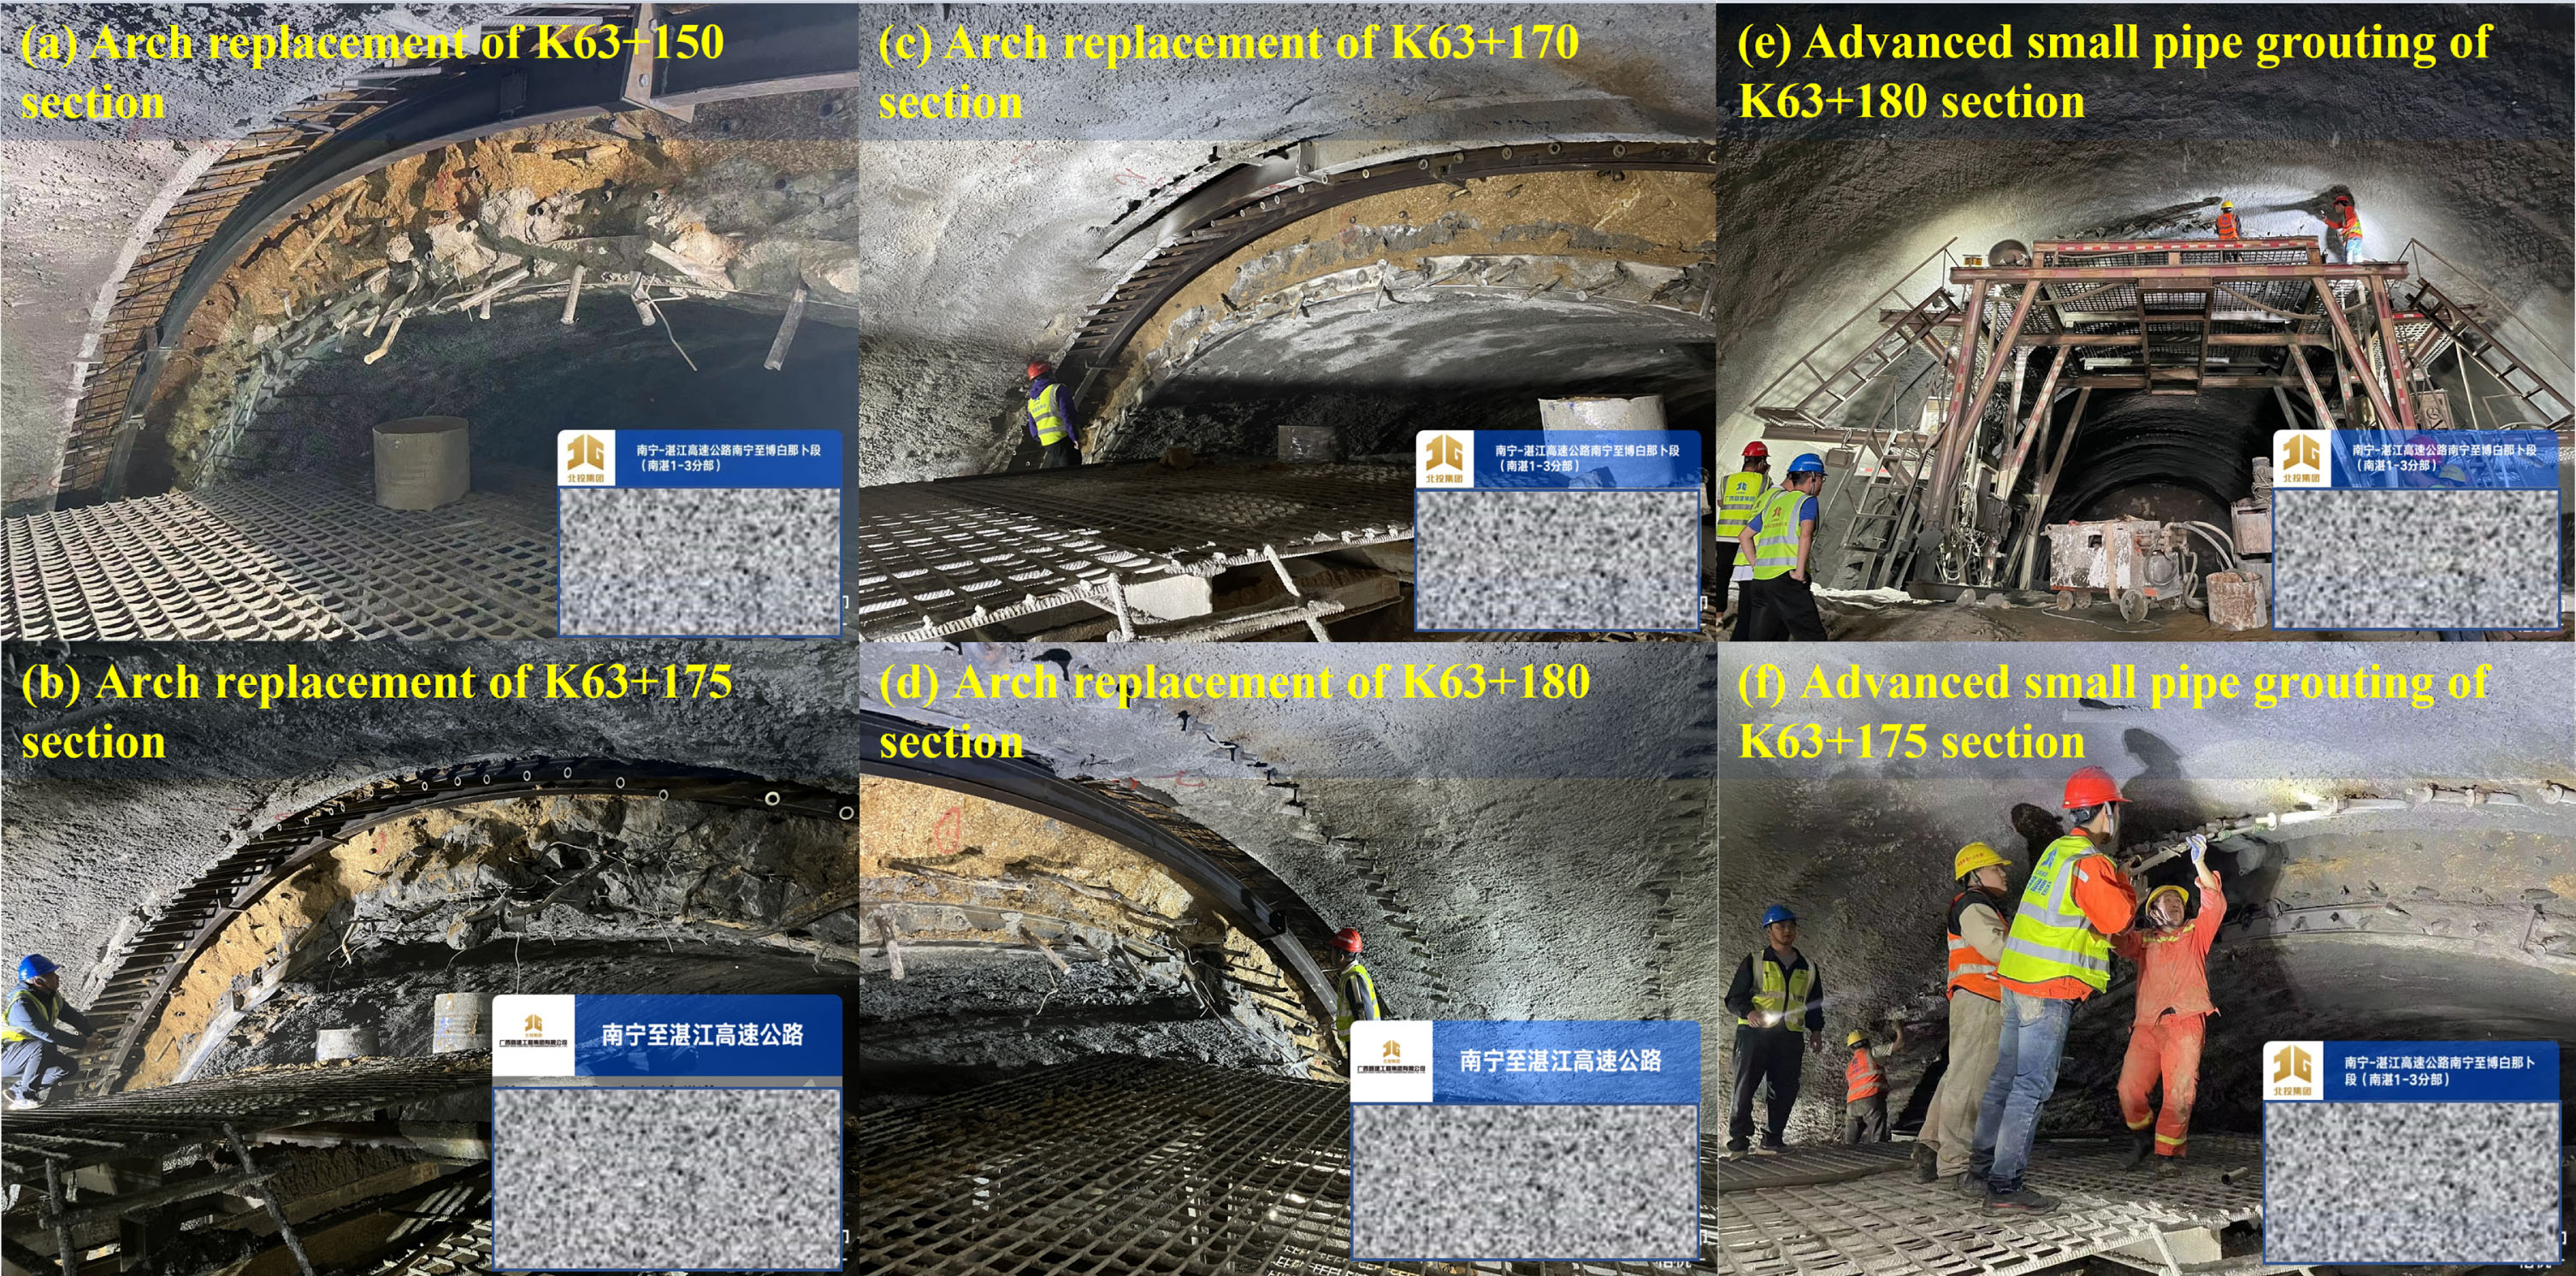
Arch replacement and local reinforcement.
Comparison of the evaluation methods
Fuzzy comprehensive evaluation method is one of the commonly used risk assessment methods in engineering [3, 20]. In order to verify the correctness of the method in this paper, the fuzzy comprehensive evaluation method is used to evaluate the collapse risk of Tongluoling tunnel, and the weight is selected from the calculation results of Fuzzy DEMATEL in the third section of the paper. Firstly, the fuzzy relation matrix
where r ij refers to the probability that the value of the ith index is rated as level j, that is, the degree of membership.
Table 12 shows the results of fuzzy comprehensive evaluation. It can be seen from Table 12 that the results obtained by the fuzzy comprehensive evaluation method are consistent with the method proposed in this paper, which proves that the proposed method is accurate.
Compared with the results of fuzzy comprehensive evaluation method
The fuzzy comprehensive evaluation method has the following defects in determining the project risk level:
(1) To determine the project risk level, the fuzzy comprehensive evaluation method quantifies fuzzy concepts by membership functions. The level boundary of the membership function is clear, and the fuzzy uncertainty of the project risk and evaluation index is not fully considered. When the index set is large, under the constraint that the sum of the weight vectors is 1, the weight coefficient is small, easily generating super fuzzy appearance. Then, the value of the membership degree cannot be judged, resulting in evaluation failure.
(2) The calculation process is complex. When considering the collapse risk of different construction sections, it is necessary to calculate in batches. For the construction section with similar evaluation results and unable to distinguish the degree of safety, the comparison of internal risk degree is often ignored, resulting in the evaluation results are not intuitive enough.
(3) In the existing research, most of the evaluation methods, including the fuzzy comprehensive evaluation method, are mostly applied to the static construction risk assessment, and it only qualitatively analyzed the risk.
Compared with the fuzzy comprehensive evaluation method, the improved VIKOR method has the following advantages:
(1) The algorithm takes into account the overall project risk and the risk of the most unfavorable indicators, and combines the fuzzy DEMATEL method to determine the weight, which solves the problem of fuzzy and random uncertainty of risk.
(2) The algorithm has a simple process and a quick evaluation process, achieving simultaneous assessment of multiple construction stages and cross-sections. The evaluation have variability, effectively highlighting the advantages of Multi-Criteria Decision Making (MCDM) theory.
(3) The improved VIKOR method not only achieves static assessment before construction but also quantitatively analyzes dynamic risks during the construction process.
The proposed evaluation model uses the fuzzy DEMATEL method to determine weights, which belongs to the static weight method. Although causal relationships between various indicators are taken into consideration, once an indicator with a small weight deviates significantly from its normal value, its potential danger in specific situations may be masked by other indicators, resulting in a decrease in the accuracy of the evaluation results. According to the change of the risk level of each indicator, the dynamic calculation of the variable weight of the safety index is realized during the dynamic evaluation process [41]. This is also a limitation of the research method in the dynamic evaluation process and a problem that needs to be addressed in order to obtain more accurate risk assessment methods in the future.
Conclusion
(1) Based on the DEMATEL method and the concept of fuzzy mathematics, a static and dynamic evaluation index system suitable for assessing the risk of mountain tunnel collapse is constructed. Using the fuzzy DEMATEL method to calculate the index weight can better address the uncertainty between the indicators of the mountain tunnel. By calculating the influential degree D, influenced degree R, centrality F and cause degree G of each index, the causal relationship between indexes is analysed.
(2) The concepts of “direction ” and “ safety factor” are introduced to solve the problem that the traditional VIKOR method can only determine the degree of advantage and disadvantage between each alternative and cannot quantify the specific risk level and loss degree of the holistic scheme. The improved VIKOR method is used to construct the static and dynamic collapse risk assessment model of mountain tunnels. The model effectively solves the problem of relying only on the risk level of the largest index as the overall tunnel risk level during the performance of the risk assessment of mountain tunnel collapse and realizes the dynamic risk assessment.
(3) The static and dynamic mountain tunnel collapse risk assessment model is applied to the right K62 + 310 ∼ K63 + 235 section of the Tongluoling tunnel. The results show that the P5 construction section is more dangerous than the other construction sections, with a risk level of III, which is a high-risk state. The dynamic assessment recorded the transition process of each monitoring section from low risk to extremely high risk, to high risk and to a safe state. Different safety measures are taken throughout the different risk states to ensure the safety of construction. The evaluation results of the model are in good agreement with the actual situation, which provides a new idea for performing the risk assessment of mountain tunnel collapse.
Footnotes
Acknowledgments
This work was supported by the Natural Science Foundation of Guangxi (2022GXNSFBA035580).
CRediT authorship contribution statement
Zhen Huang: conception and design of the study, funding acquisition, acquisition of data, analysis and/or interpretation of data, writing – review & editing. Feng Gao: model test, acquisition of data, analysis and/or interpretation of data, writing – original draft. Min Jiang: project administration, formal analysis, analysis and/or interpretation of data,. Xuesong Li: project administration, interpretation of data, writing – review & editing.
Declaration of conflicting interests
The author(s) declare no potential conflicts of interest with respect to the research, authorship, and/or publication of this article.
Appendix
Standardized decision matrix (dynamic assessment)
| S11 | S12 | S21 | S22 | S31 | S32 | S41– S51 | S42– S52 | S61– S71 | S62– S72 | |
| Dangerous value | 1.00 | 1.00 | 1.00 | 1.00 | 1.00 | 1.00 | 1.00 | 1.00 | 1.00 | 1.00 |
| Safety value | 0.00 | 0.00 | 0.00 | 0.00 | 0.00 | 0.00 | 0.00 | 0.00 | 0.00 | 0.00 |
| Early warning value | 0.667 | 0.667 | 0.667 | 0.667 | 0.667 | 0.667 | 0.667 | 0.667 | 0.667 | 0.667 |
| 11.15–11.21 | 0.366 | 1.439 | 0.318 | 1.250 | 0.278 | 1.091 | 0.000 | 0.000 | 0.000 | 0.000 |
| 11.22–11.28 | 0.388 | 0.020 | 0.320 | 0.009 | 0.281 | 0.014 | 0.000 | 0.000 | 0.000 | 0.000 |
| 11.29–12.05 | 0.935 | 2.155 | 0.851 | 2.082 | 0.877 | 2.334 | 0.000 | 0.000 | 0.000 | 0.000 |
| 12.06–12.12 | 1.654 | 1.945 | 1.773 | 2.773 | 1.834 | 3.227 | 0.311 | 1.221 | 0.000 | 0.000 |
| 12.13–12.19 | 1.810 | 0.559 | 1.903 | 0.471 | 1.998 | 0.546 | 0.333 | 0.087 | 0.000 | 0.000 |
| 12.20–12.26 | 1.883 | 0.275 | 1.935 | 0.127 | 2.111 | 0.421 | 0.370 | 0.141 | 0.040 | 0.159 |
| 12.27–1.02 | 1.918 | 0.105 | 1.953 | 0.054 | 2.145 | 0.089 | 0.373 | 0.000 | 0.038 | 0.000 |
| 1.03–1.09 | 1.928 | 0.029 | 1.955 | 0.023 | 2.151 | 0.007 | 0.369 | 0.000 | 0.036 | 0.000 |
| 1.10–1.16 | 1.930 | 0.000 | 1.960 | 0.020 | 2.155 | 0.000 | 0.373 | 0.012 | 0.050 | 0.009 |
| 1.17–1.23 | 1.935 | 0.030 | 1.973 | 0.052 | 2.169 | 0.052 | 0.381 | 0.041 | 0.055 | 0.025 |
| 1.24–1.30 | 1.945 | 0.011 | 1.973 | 0.000 | 2.169 | 0.000 | 0.381 | 0.000 | 0.055 | 0.000 |
| 1.31–2.06 | 1.950 | 0.009 | 1.973 | 0.000 | 2.169 | 0.000 | 0.381 | 0.000 | 0.055 | 0.000 |
| 2.07–2.13 | 1.959 | 0.027 | 1.973 | 0.000 | 2.169 | 0.000 | 0.381 | 0.000 | 0.055 | 0.000 |
| 2.14–2.20 | 1.978 | 0.041 | 1.973 | 0.000 | 2.169 | 0.000 | 0.381 | 0.000 | 0.055 | 0.000 |
| 2.25–3.03 | 0.035 | 0.138 | 0.020 | 0.077 | 0.049 | 0.191 | 0.015 | 0.059 | 0.000 | 0.000 |
| 3.04–3.10 | 0.052 | 0.048 | 0.030 | 0.032 | 0.066 | 0.052 | 0.017 | 0.007 | 0.000 | 0.000 |
| 3.11–3.17 | 0.058 | 0.014 | 0.033 | 0.016 | 0.072 | 0.020 | 0.018 | 0.004 | 0.003 | 0.025 |
| 3.18–3.20 | 0.058 | 0.004 | 0.036 | 0.029 | 0.073 | 0.008 | 0.017 | 0.000 | 0.006 | 0.029 |