
Abstract
Kiwifruit has a high decay rate, in part because quality changes during storage cannot be easily monitored in real time. In order to better monitor the shelf life of kiwifruit and understand the quality changing process during storage, internal quality indexes such as hardness, respiratory intensity and TSS(Total Soluble Solid) were considered into the prediction models. The prediction models were constructed based on BPNN (Back Propagation Neural Network), Random Forest (RF) and XGBoost (eXtreme Gradient Boosting) respectively. And transfer learning algorithm was used to construct the quality prediction models with BPNN, RF, and XGBoost algorithms as the base learner. In the experiments, sample data were augmented by adding Gaussian noise, which effectively prevented the model from over-fitting. The experimental results showed that the prediction accuracy of each index based on transfer learning was better than that of individual BPNN, RF and XGBoost. Moreover, the average prediction accuracy of the models based on transfer learning was 96.2%, and that of respiratory intensity was as high as 99.4%. Therefore transfer learning can be used to effectively analyze and predict changes of kiwifruit quality indexes during storage.
Introduction
Kiwifruit has a soft texture and a sweet and sour taste. It is loved by consumers because of its rich nutritional value, and is also favored by more and more growers [1]. With the rapid growth of kiwifruit planting area and yield in China, the requirements for kiwifruit postharvest storage and storage quality are becoming more stringent [2]. Kiwifruit is a climacteric fruit that is sensitive to ethylene as a ripening hormone. When the climacteric occurs, respiration, ripening, and softening of fruit rapidly accelerate, resulting in short shelf-life of kiwifruit [3]. Storage temperature is the primary factor affecting the quality of kiwifruit [4, 5]. When kiwifruit stored at room temperature, respiratory intensity and nutrients consumed will rapidly accelerate, along with water loss, softening and decomposition, lead to poor quality and short shelf-life [6], and affect the further sale of the fruit. Therefore, it is critical to understand the changing processes of kiwifruit quality during storage, as well as to analyze and predict these processes, in order to better monitor and improve shelf life.
A large number of scholars at home and abroad have carried out relevant research on the quality prediction of kiwifruit. Most scholars carry out related research based on dynamic analysis and Arrhenius equation. There are relatively few studies on the prediction of kiwifruit quality based on machine learning algorithms.
The innovations are as follows:
The machine learning models were introduced into the field of quality prediction of kiwifruit. Constructed the quality prediction models based BPNN, Random Forest and XGBoost respectively. Transfer learning was introduced into the field of quality prediction of kiwifruit. Constructed the quality prediction model with BPNN, RF, and XGBoost algorithms as the base learner. According to the data sparsity problem, in the experiments, sample data were augmented by adding Gaussian noise, which effectively prevented the model from over-fitting. The results showed that the prediction accuracy of each index based on transfer learning was better than that of individual BPNN, RF and XGBoost model. Moreover, the average prediction accuracy of the models based on transfer learning was 96.2%, and the prediction accuracy of respiratory intensity was as high as 99.4%. Transfer learning can be used to effectively analyze and predict changes in kiwifruit quality indexes during storage.
Literature review
The quality prediction studies recently performed in kiwifruit mainly focuses on the following. Li et al. studied the change characteristics of soluble solids, hardness, Vc and other indexes in Hongyang kiwifruit during refrigeration at 4°C [7]. Gu et al. used dynamic analysis and an Arrhenius equation to establish a prediction model of kiwifruit shelf life decline in storage [8]. Liu et al. subsequently established the dynamic model of relevant quality indexes by using the Arrhenius equation [9]. They proposed an identical deformation corresponding to the quality dynamic model, and established a prediction weighted model based on the dynamic quality index value determined by a sensory end point. Sun et al. predicted the shelf-life of Hayward kiwifruit by building a dynamic model of shelf-life quality changes [10]. Ma et al. established a quality change model by infrared spectroscopy, and established a prediction model of the lossless storage period [11].
There are few quality prediction studies of kiwifruit based on machine learning models, compared with other fruits. Frank Efe Erukainure et al. proposed a non-destructive tactile sensing approach for estimating the stiffness of fruits based on the combination of instantaneous sensor outputs with 63 regression-based machine learning models, using kiwifruit as a case study [12]. Xin studied the quality prediction method of kiwifruit based on hyperspectral technology and machine learning [13]. Xiong studied the quality prediction of Kiwifruit based on storage and transportation microenvironment parameters and BPNN [14]. Zhang et al. studied the relationship between temperature, gas volume ratio and physical and chemical indexes of apples in storage [15]. Liu established a quantitative prediction model of internal quality indexes in the netted melon variety ‘Network’ using RF algorithm [16]. Xu et al. applied transfer learning by using Convolutional Neural Network (CNN) for training, and then fine-tuned and transferred the model to achieve non-destructive testing for sugar content and hardness in apple [17].
To our knowledge there have been no studies to date which have used deep learning and other machine learning algorithms combined with transfer learning to predict the storage quality of kiwifruit. Previous studies have shown relatively poor prediction accuracy using models without machine learning. Considering that the BPNN has strong adaptive ability, learning ability, anti-interference ability, and can avoid the traditional tedious conventional modeling process. The RF model has high prediction accuracy, good tolerance to outliers and noise, and is not easy to overfit. The XGboost integrates multiple weak learners to form a powerful learner, and usually has a high accuracy.Transfer learning can effectively use the knowledge obtained in the source domain to predict the data in the target domain, so as to achieve better learning results. It is especially suitable for the case of sparse data. So we introduce the transfer learning into the field of quality prediction of kiwifruit. More importantly, these methods do not require any prior knowledge and can be easily modeled. Therefore, this paper focuses on the quality prediction of kiwifruit based on transfer learning. The study uses Jinyan kiwifruit in the development of the transfer learning models to predict changes in several quality indexes based on BPNN, RF, and XGBoost.
In summary, there are only a few studies on the quality prediction of other fruits and vegetables, food and so on, and the prediction accuracy is relatively low. The research on predicting the storage quality of kiwifruit by using machine learning algorithms and conducting transfer learning has not been found. Therefore, the paper focuses on the prediction of kiwifruit quality based on transfer learning to improve the efficiency and accuracy of its prediction.
Basic Theory
BPNN
Neural network with strong adaptability, learning ability and anti-interference can avoid the traditional tedious conventional modeling process. It breaks the limitations of traditional prediction methods and has been widely used in many practical problems.
The basic idea of BPNN algorithm is to estimate the error of the directed leading layer through the output error of BPNN, and then correct the error of the leading layer, so as to obtain the error estimation of other layers in the case of back-propagation layer by layer. The learning process can be divided into signal forward propagation and error back propagation. During the forward propagation process, the sample data are input from the input layer, and then transmitted to the output layer after inter-layer processing. If the output fails to reach the expected result, it enters the back propagation. Error back propagation is to transmit the output error layer by layer from the hidden layer to the input layer in a certain form, and then distribute it evenly to each unit of each layer, and finally get the error signal of each unit of each layer, so as to correct the weight of each unit [19]. BPNN will make the actual output close to the expected output before its output error is reduced to an acceptable range or learning times reach the predetermined value [18].
RF
RF is an ensemble learning algorithm based on decision tree [20]. This kind of algorithm model has high prediction accuracy, good tolerance to outliers and noise. It is not easy to overfit, can deal with a large number of sample data quickly, and estimate a characteristic variable qualitatively or quantitatively [18].
XGBoost
XGBoost is a Boosting algorithm based on Classification And Regression Tree (CART) [21]. It can be used for both classification tasks and regression tasks. The algorithm integrates multiple weak learners to form a powerful learner. The decision tree of the algorithm has sequential correlation. Based on the previous round of prediction error of the current prediction, each round of prediction error iteration is used to build the model to improve the prediction accuracy [18].
The basic idea of XGboost is as follows: (1) A strong learner is composed of many weak learners, and its final prediction result is the weighted sum of the prediction results of all learners. (2) Keep learning the errors and use heuristic algorithm to reduce the errors through iteration, so as to improve the accuracy [22].
Transfer learning
Introduction of transfer learning
Transfer learning is the influence of one kind of learning on another. Transfer and learning are complementary and inseparable [23]. Transfer learning can make use of the knowledge obtained in the source task, so as to achieve better learning results [24].
Transfer learning provides efficient learning methods to learn target domain knowledge through source domain knowledge by studying which knowledge should be transferred, how and when to transfer [25]. According to the differences between source domain and target domain and between source task and target task, transfer learning is divided into four kinds: instance-based transfer learning, feature-based transfer learning, parameter-based transfer learning, and relationship-based transfer learning [26].
TrAdaboost (Boosting for Transfer Learning)
Dai et al. proposed a lifting algorithm to solve the problem of inductive transfer [27]. TrAdaBoost is an improvement of AdaBoost algorithm, and is an important instance migration algorithm. The core idea of the algorithm is to use two sets of weight adjustment mechanism between the source domain and the target domain [23]. It increases the weight of valuable instances in the source domain and reduces the weight of invalid instances in the iteration, so as to select valuable samples and match the training data of the target domain. Among the four types of transfer learning, instance transfer is relatively easier to implement, which has the widest range of knowledge and wider scope of application, and is a popular research field in transfer learning. The algorithm steps of TrAdaBoost are as follows [27]:
(1) Input
The input includes two training sets T a and T b , the combined training data set T, an unlabeled test data set S, a basic classification algorithm Learner and iteration times N.
(2) Initialization
•Initial the weight vector
•Set the weight adjustment rate βon T
a
. It is a constant. The definition is as formula (2):
(3) For t = 1, . . . , N
•Set the weight distribution P
t
on T satisfy β. The definition is as formula (3):
•Invoke Learner. According to the combined training data T and the weight distribution P t on T and unlabeled data S, get a classifier h t : X → Y on S.
•Calculate the error rate of classifier h
t
on T
b
. The definition is as formula (4):
•Set the new weight adjustment rate βt on T
b
. The definition is as formula (5):
•Set the new weight vector as formula (6):
(4) Output the final classifier, as the following formula (7).
The TrAdaBoost algorithm can achieve good results when the source data and target data have a large similarity, but it also has disadvantages. That is, if the sample noise in the source data is large at the beginning, or the number of iterations is not well controlled, it will increase the difficulty of the classifier training.
After the new model is constructed, its performance must be evaluated. The Mean Square Error (MSE), Mean Absolute Error (MAE) and R2 are the three ones which are most commonly used. MSE measures the deviation between the observed value and the real value. MAE reflects the error caused by the predicted value. R2 is used to compare the performance of models in different dimensions. Here, MSE and R2 are selected to comprehensively evaluate and compare the models.
MSE is obtained by dividing the sum of the squares of error by the number of samples. MSE is the average of the sum of the square error between the predicted value and the actual value generated during the fitting of the linear regression model. The smaller the value is, the higher the fitting degree of the model is, and the closer the predicted value is to the actual value. Calculation formula of MSE is as formula (8):
R2 is the determination coefficient which is used to represent the fitting effect of the model. The larger its value is, the better the fitting effect is. The smaller the value is, the worse the fitting effect is or even the inappropriate model is judged. Calculation formula is as formula (9):
Where, i represents the ith sample, y(i) represents the actual value of the ith sample,
Small sample data expansion
kiwifruit (‘Jinyan’) with good quality were purchased from a local Tianjin produce market, in China and scanned for uniform in size, maturity and without mechanical damage, then transferred to the laboratory within two hours. Kiwifruit were randomly selected and placed into PE packages (32 cm×29 cm×0.02 mm) with holes, then were tightly sealed. The packaged samples were stored at 1°C, 5°C, 10°C, 16°C and 35°C respectively, relative humidity (RH) 90–95%. 210 kiwifruit (70 kiwifruit ×3 replicates) were randomly selected from the package for respiration rate, hardness and TSS, and the indexes were measured at regular intervals (5 d).
A total of 78 records were collected, including five index parameters— — temperature, storage time, respiratory intensity, hardness and TSS. The changes of respiratory strength, hardness and TSS at 1°C, 5°C, 10°C, 16°C and 35°C were recorded with the increase of storage time.
Data augmentation is a technique that increases the diversity of the data set without collecting more real data, and still helps improve the accuracy and prevents over-fitting of the model [27]. Due to the small dataset size, this paper augmented the data by adding Gaussian noise to the small sample data set. Then get 390 new samples added Gaussian noise, which is regarded as the augmented data set, called as Gaussian noise data set. Data augmentation improved the accuracy of the training model, helped to reduce the risk of over-fitting, and overcame the limitation of small data set to some extent [28].
Normalized processing
For the kiwifruit data, the units between variables of storage time(days), temperature(°C), hardness (kg/cm2 or N), respiratory intensity (CO2mg/kg\bulleth) and TSS(%) are different. Therefore, in order to treat each component equally at the beginning of training, and cancel the data magnitude difference between different types of data, data normalization which is the most common method of data prediction is used. All initial data are converted to data between [0,1] or [–1,1], which can be determined by normalization formula (10) [29]:
Where, X a is the normalized input value, X i is the actual value of the input value, Xmax and Xmin are the maximum and minimum value of the input value respectively.
Generally, the data set can be divided into training set and testing set. When the model parameters are difficult to determine, the training data can be further divided into two parts: training set and verification set. The established model is trained through the training set, and verified through the verification set. To a great extent, verification set can assist in the establishment of the model. Finally, the testing set is used to test the model whose performance is evaluated by accuracy and error. Here the original and argument data all are randomly divided into two parts: 80% of the data are divided as the training set and 20% as the testing set. In addition, the training set and the testing set have the same distribution with the original data set.
Quality prediction of kiwi fruit based on transfer learning
Quality prediction of kiwifruit based on BPNN
A BPNN model was implemented and the results on a small sample data set with 78 samples and on a Gaussian noise data set with 390 samples were compared. The BPNN was then combined with TrAdaboost, taking the small sample data set as the target domain, and the Gaussian noise data set as the source domain to realize transfer learning.
Hardness prediction
The indexes of storage time, temperature, hardness and initial hardness were taken as the inputting parameters of the pre-training model. The results showed that when the number of hidden layer nodes was 14, the activation function was tanh, the regularization parameter alpha was 0.2, and the learning rate was 0.01, the current optimal hardness index prediction model was obtained (Table 1). The prediction accuracy of the transfer learning was 96%, and the MSE was 0.059, which was significantly improved compared with the prediction accuracy of the hardness models built on the small sample data set and the augmented data set.
Parameters and results of hardness prediction based on BPNN-TrAdaboost
Parameters and results of hardness prediction based on BPNN-TrAdaboost
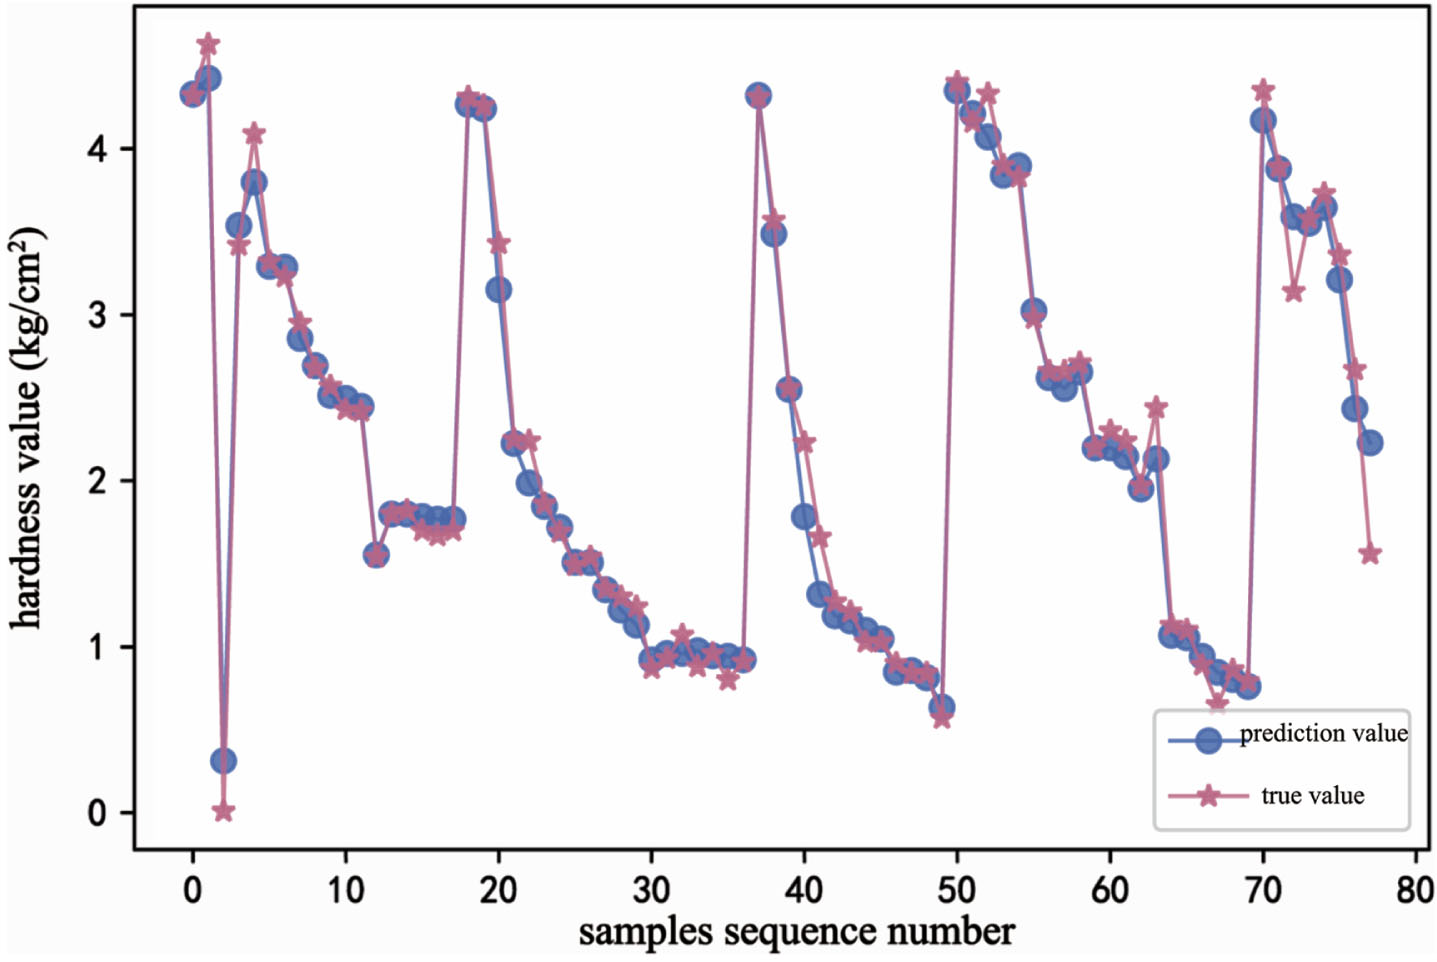
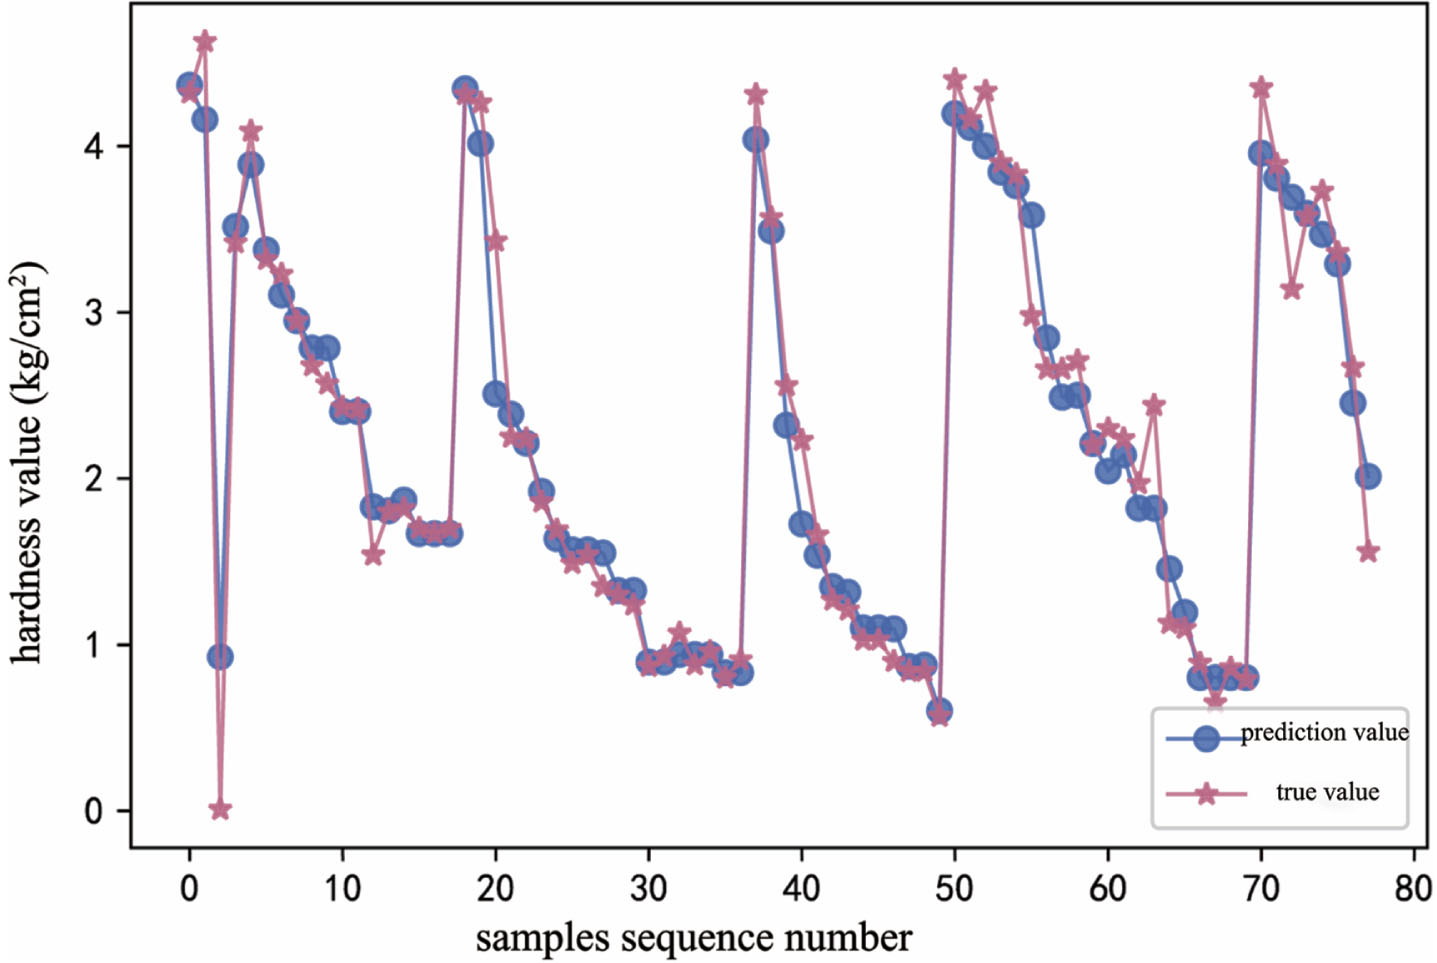
The iterative process curve of the hardness error in the transfer learning process showed that as the number of epochs increased, the model loss rate gradually decreased (Fig. 1). When the epochs was about 10, the loss decreased quickly (Fig. 1). The fitting curve of the actual value(star curve) and the predicted value(dot curve) of hardness (Fig. 2) showed that the error between the predicted value and the actual value was small.
Hardness error curve based on BPNN-TrAdaboost.

Hardness prediction fitting curve based on BPNN-TrAdaboost.
The indexes of storage time, temperature, respiratory intensity and initial respiratory intensity were taken as the inputting parameters of the pre-training model. The parameters of the current optimal prediction model of respiratory intensity index were that the number of hidden layer nodes was 15, the activation function was tanh, the regularization parameter alpha was 0.01, and the learning rate was 0.001 (Table 2). The MSE and R2 of the model were 0.97 and 2.749 respectively (Table 2). Compared with the prediction accuracy of the models built on small sample data set and augmented data set, the prediction accuracy reached 97% after transfer learning, which could well predict the respiratory intensity of kiwifruit quality index, and verified the effectiveness of transfer learning.
Optimal parameters of respiratory intensity based on BPNN-TrAdaboost
Optimal parameters of respiratory intensity based on BPNN-TrAdaboost
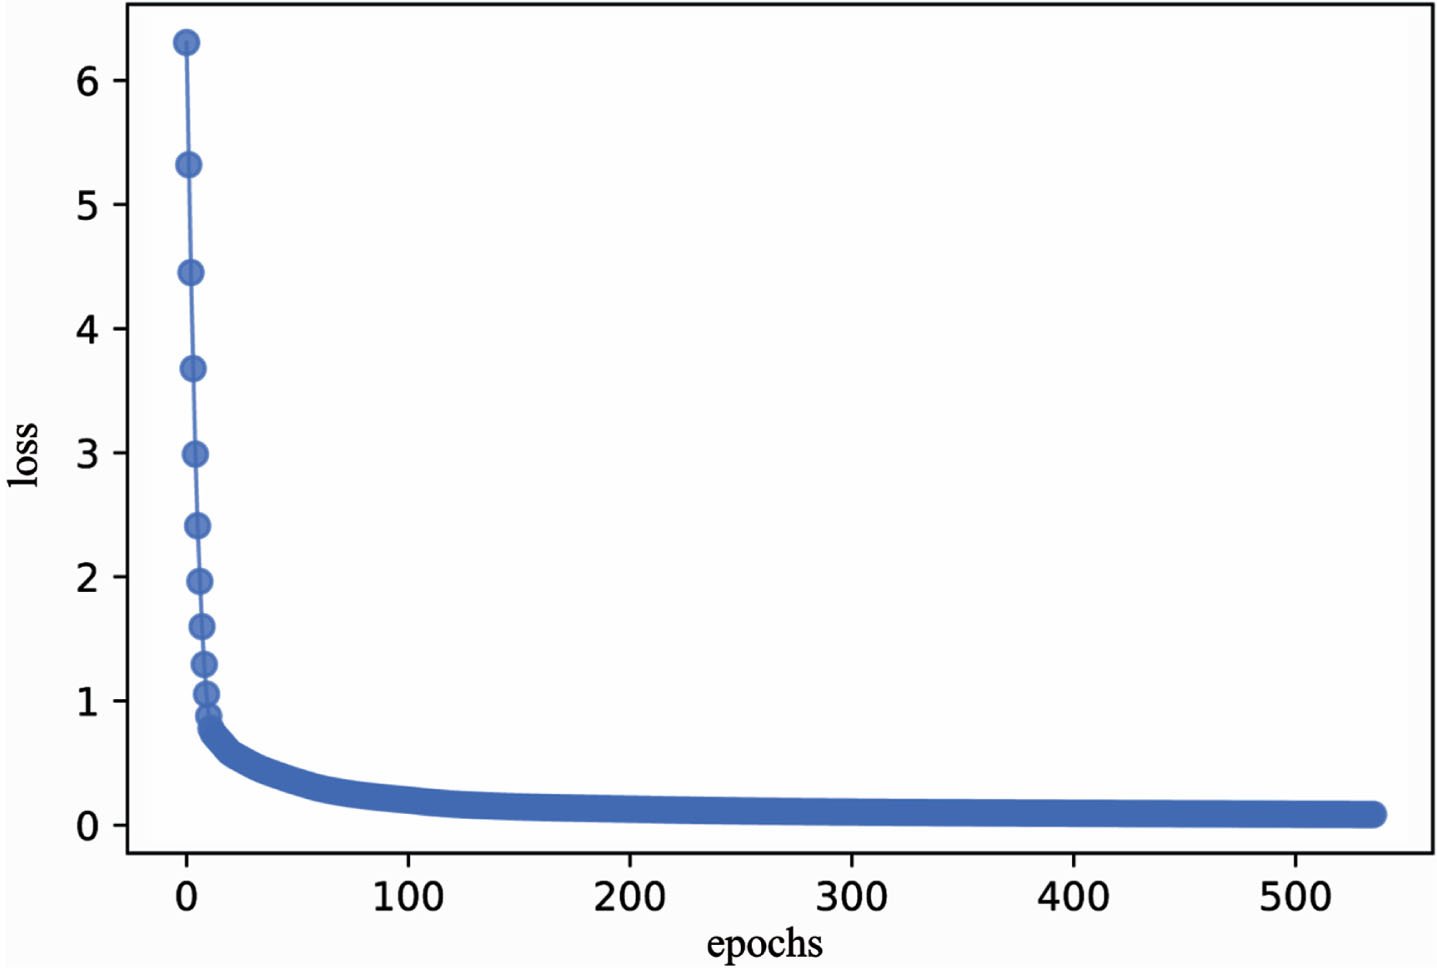
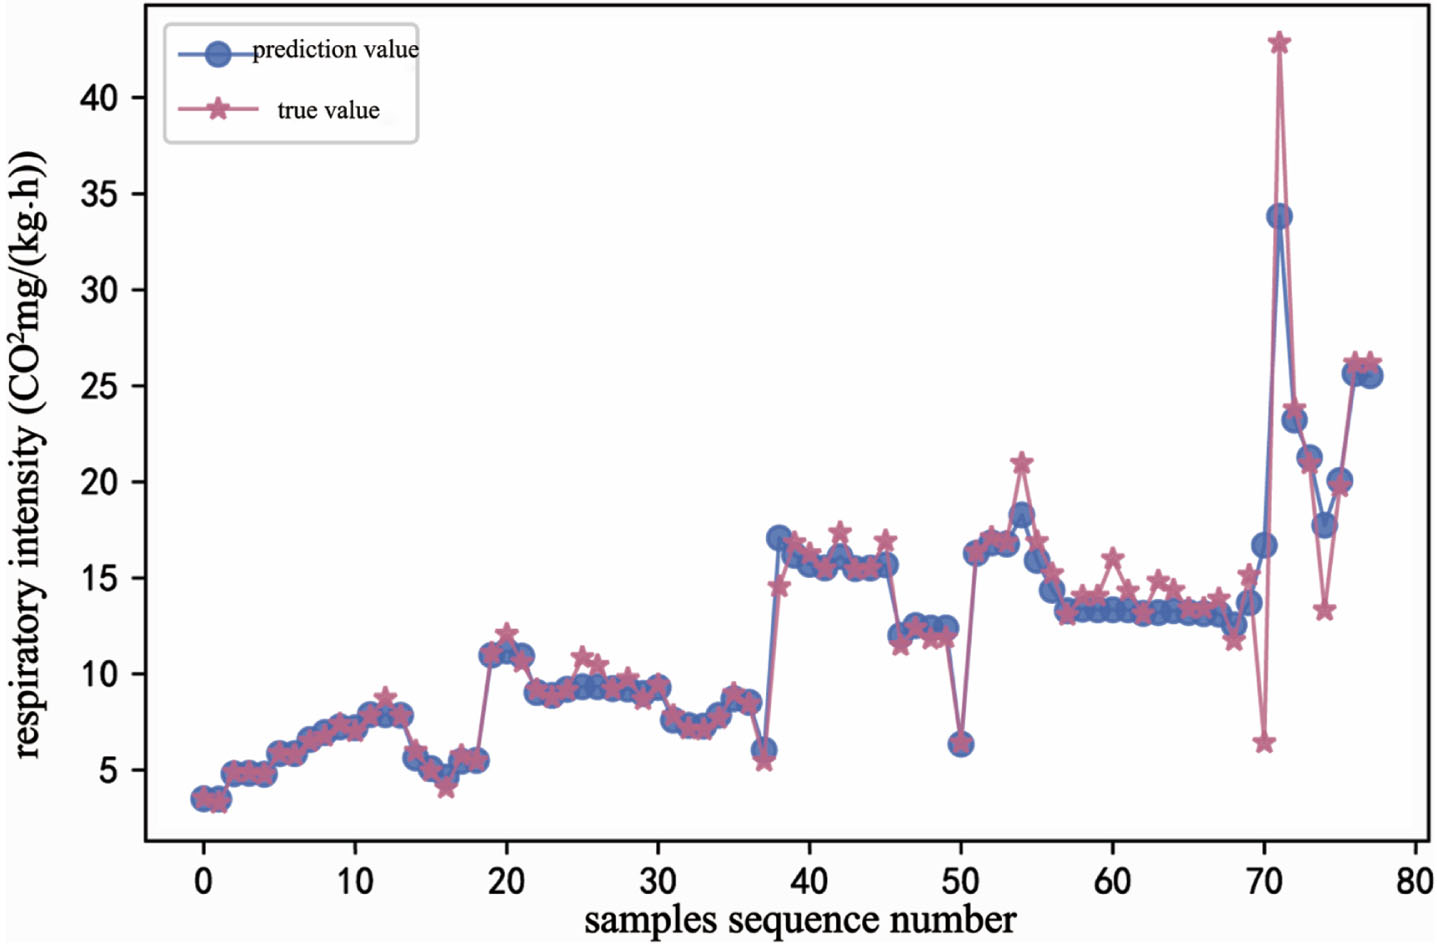
The error iteration process curve of respiratory intensity in the process of transfer learning showed that as the number of epochs increased, the model loss rate gradually decreased (Fig. 3). When the epochs was about 100, the loss decreased quickly (Fig. 3). The fitting curve between the actual value(star curve) and the predicted value(dot curve) of respiratory intensity showed the error between the predicted value and the actual value was small (Fig. 4).
Respiratory intensity error curve based on BPNN-TrAdaboost.
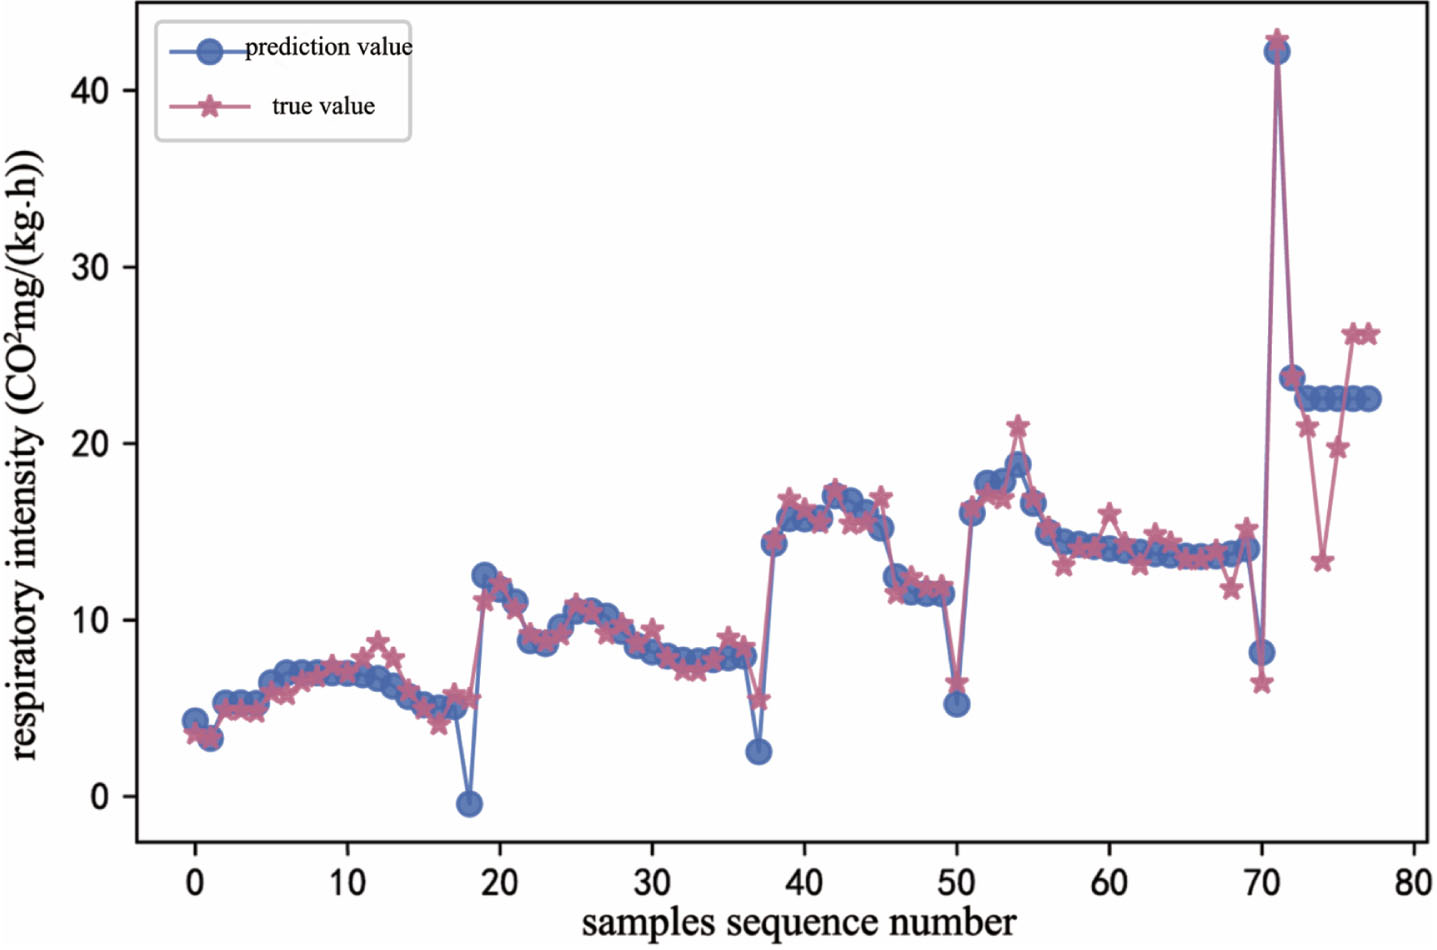
Fitting curve of respiratory intensity prediction based on BPNN-TrAdaboost.
The augmented TSS data of kiwifruit was used as the source domain of transfer learning to pre-training model, and the original small sample TSS data was used as the target domain to achieve prediction. The results showed that the parameters of the optimal TSS index prediction model was that the number of hidden layer nodes was 13, the activation function was logistic, the regularization parameter alpha was 0.001, and the learning rate was 0.01 (Table 3). The MSE and R2 of the model were 0.94 and 0.199 respectively (Table 3).
Optimal parameters of respiratory intensity based on BPNN-TrAdaboost
Optimal parameters of respiratory intensity based on BPNN-TrAdaboost
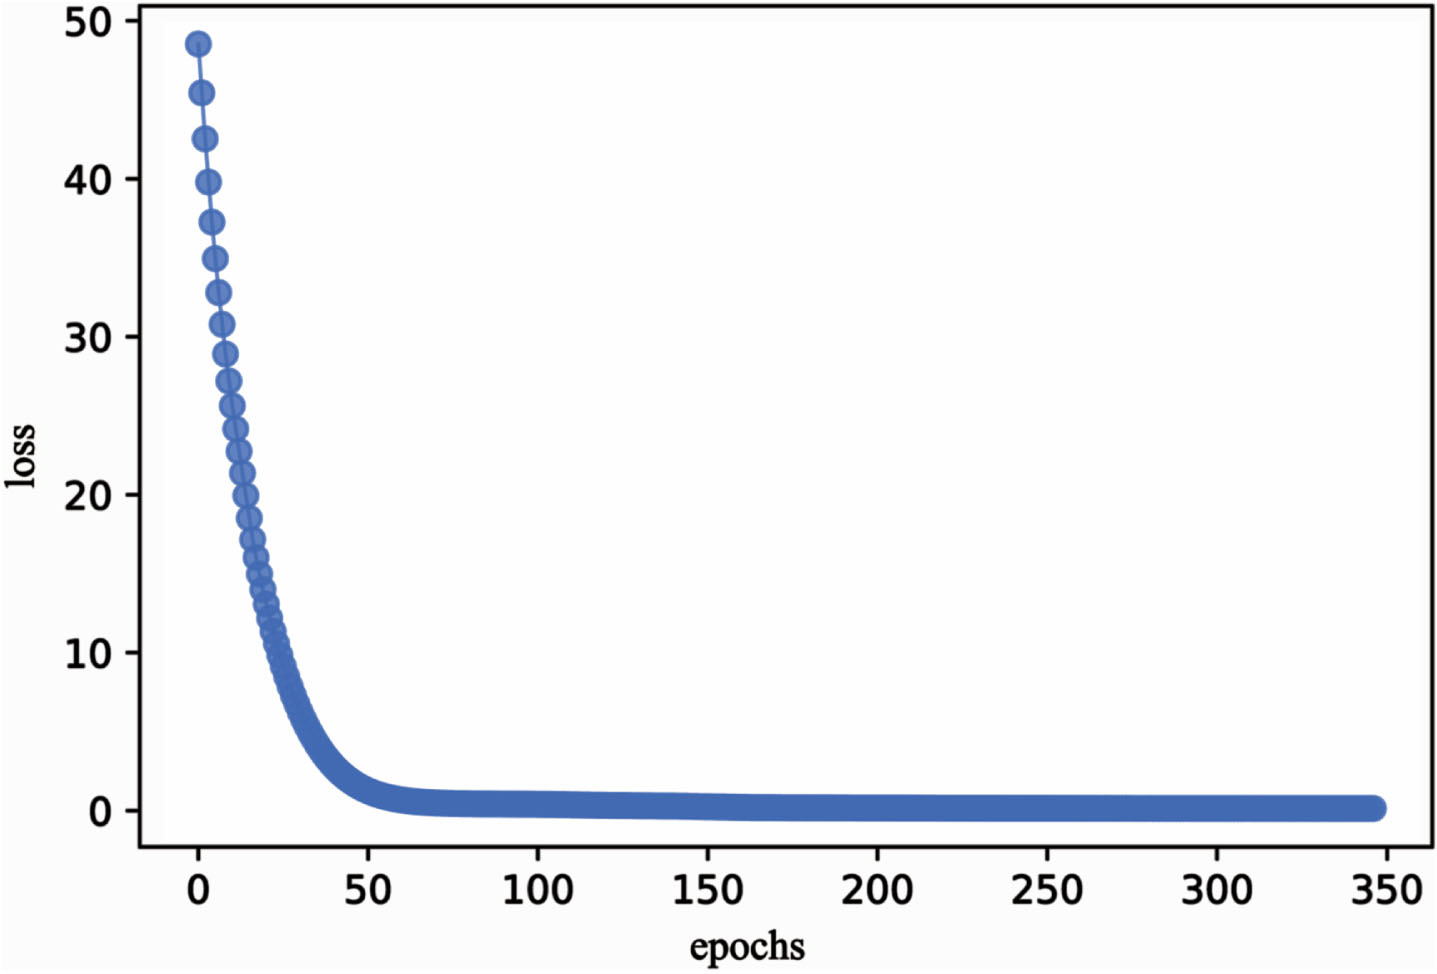
The error iteration process curve of TSS in the transfer learning process showed that as the number of epochs increased, the model loss rate gradually decreased (Fig. 5). When the epochs was about 50, the loss decreased quickly (Fig. 5). The fitting curve between the actual value(star curve) and the predicted value(dot curve) of TSS showed the error between the predicted value and the actual value was small (Fig. 6). It was proved that transfer learning was effective and implementable in predicting kiwifruit TSS.
TSS error curve based on BPNN-TrAdaboost.
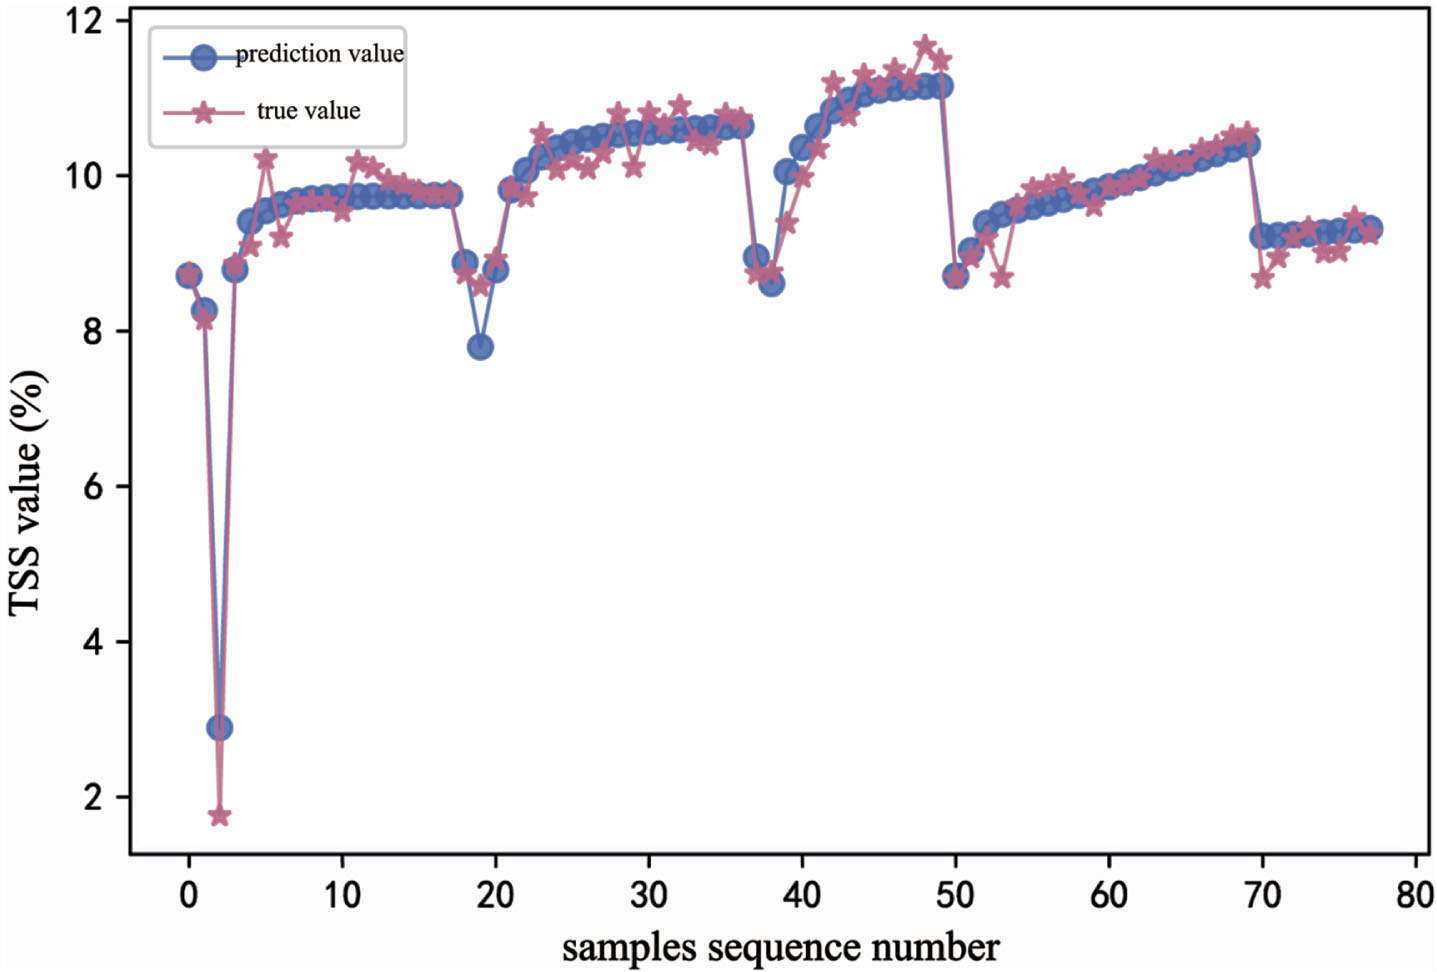
TSS prediction fitting curve based on BPNN-TrAdaboost.
In this part, firstly, the RF regression algorithm was used to establish the corresponding prediction model for the quality indexes of kiwifruit based on the original small sample data set and the augmented data set. Secondly, establish the RF-TrAdaboost and the model was pre-trained on the augmented data set. The optimal parameters of the training were recorded and transfered to the network model of the target domain in a certain way, so as to accelerate the network training speed and improve the prediction ability. The small sample data set of kiwifruit was the target domain of transfer learning
The prediction accuracy of the three quality indexes has been improved. The prediction accuracy of hardness was up to 98.4% with MSE of 0.024, the prediction accuracy of respiratory intensity was 91.8% with MSE of 3.214, and the prediction accuracy of TSS was 96.3% with MSE of 0.054 (Table 4). The fitting curve of the actual value(star curve) and the predicted value(dot curve) of hardness (Fig. 7), respiratory intensity (Fig. 8) and TSS (Fig. 9) in the process of transfer learning showed the error between the predicted value and the actual value was very small, and the fitting curve was basically consistent. The fitting effect was good, that proved the effectiveness of transfer learning. It could meet the requirements of kiwifruit monitoring.
Evaluation of quality indexes based on RF- TrAdaboost
Evaluation of quality indexes based on RF- TrAdaboost
Hardness prediction fitting curve based on RF- TrAdaboost.
Fitting curve of respiratory intensity prediction based on RF- TrAdaboost.
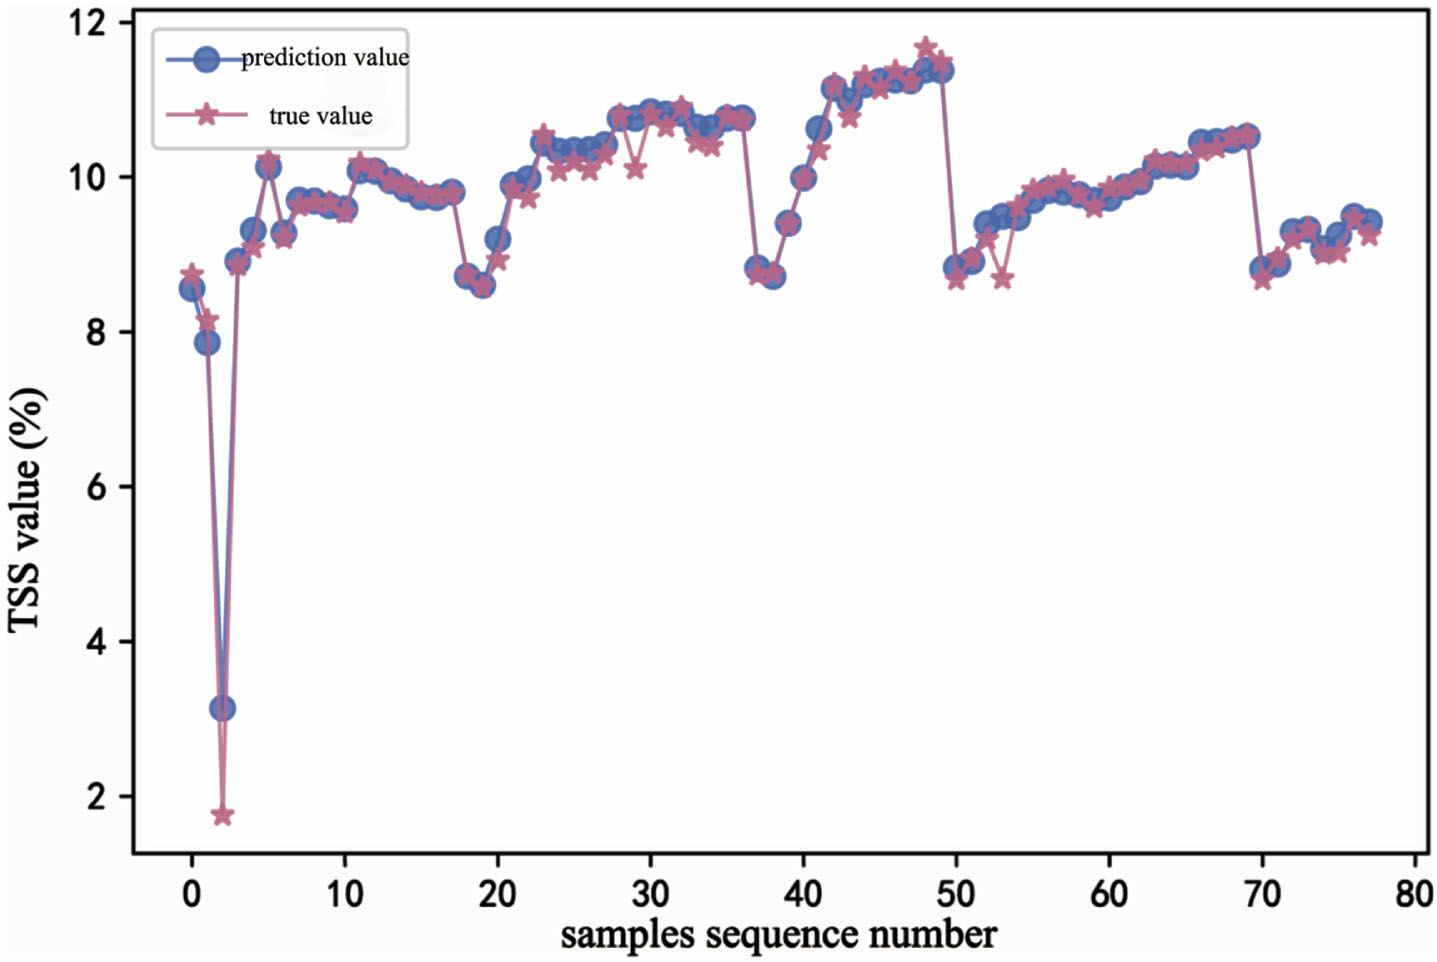
TSS prediction fitting curve based on RF- TrAdaboost.
In this part, firstly, XGBoost algorithm was used to establish the corresponding quality indexes prediction model of kiwifruit on the original small sample data set and the augmented data set respectively. Secondly, the hybrid model of XGBoost and TrAdaBoost was pre-trained on the augmented data set called source domain and the optimal parameters were recorded. Then, the model was transferred to the target small sample data set called target domain for prediction. The parameters of the model were transferred to the model of the target domain in a certain way, so as to accelerate the training speed and improve the prediction accuracy of the model.
The prediction accuracy of the three quality indexes had been improved. The prediction accuracy of hardness was as high as 95.8% with MSE of 0.062, the prediction accuracy of respiratory intensity was 99.6% with MSE of 0.153, and the prediction accuracy of TSS was 97.3% with MSE of 0.039 (Table 5). The prediction accuracy was significantly improved after transfer learning compared with that of the original small sample data set and the augmented data set. The fitting curves of the predicted(dot curve) and actual values(star curve) of hardness (Fig. 10), respiratory intensity (Fig. 11) and TSS (Fig. 12) in the process of transfer learning showed the error between the predicted and actual values was small, and the fitting curve between the predicted and actual values was nearly consistent. Compared with that of the kiwi small sample data set and the augmented kiwi data set, the overall prediction accuracy was significantly improved. The prediction accuracy of the three quality index prediction models had reached more than 95%, which proved the effectiveness of the transfer learning (Table 6).
Evaluation of quality indexes based on XGBoost-TrAdaboost
Evaluation of quality indexes based on XGBoost-TrAdaboost
Hardness prediction fitting curve based on XGBoost-TrAdaboost.

Fitting curve of respiratory intensity prediction based on XGBoost-TrAdaboost.

TSS prediction fitting curve based on XGBoost-TrAdaboost.
We had done three groups of experiments. In the first group, BPNN was used to model and predict the quality indexes of kiwifruit on small sample data set and extended data set respectively. Then, TrAdaboost algorithm model which BPNN was used as the base learner was built, the extended data set was the source domain to pre-training model, and the original small sample data set was the target domain for transfer learning. In the second group, RF regression algorithm was selected to model and predict the quality indexes of kiwifruit and the TrAdabost algorithm took RF as the base learner. In the third group XGboost algorithm was used to model and predict the quality indexes of kiwifruit on small sample data set and extended data set respectively, and then TrAdaboost algorithm with XGboost as the base learner began the transfer learning. The experimental results of the three groups were analyzed as follows:
(1) Models were built respectively based BPNN, RF and XGBoost algorithms to predict the three quality indexes of kiwifruit on small sample data set. It can be seen that the hardness prediction accuracy of BPNN, RF and XGBoost was 66.7%, 84.6% and 82.2% respectively (Table 6). RF algorithm had better performance. For the prediction accuracy of respiration intensity, the accuracy of BPNN, RF and XGBoost was 94.9%, 67.2% and 72.3% respectively, and the accuracy of BPNN was the highest (Table 6). For the accuracy of TSS prediction model, the prediction results of the three models were not very ideal, but the overall comparison of XGBoost was better than BPNN and RF.
(2) The three models based on BPNN, RF and XGBoost were used to predict the quality indexes on the augmented sample dataset. For hardness, the accuracy of BPNN, RF and XGBoost was 75%, 94% and 95.5%, respectively (Table 6). For respiratory intensity, the prediction accuracy of BPNN, RF and XGBoost was 95.1%, 89.7% and 99.6%, respectively (Table 6). For TSS, the prediction accuracy of BPNN, RF and XGBoost was 89.7%, 92.2% and 96%, respectively (Table 6). The three algorithms had good accuracy for the three quality indexes. In general, the prediction performance of different models was: XGBoost > RF > BPNN. Compared with the small sample data without data expansion, the prediction accuracy of each index was further improved after data expansion, which verified the necessity of data expansion and.
List of R2 of our models
List of R2 of our models
(3) Based on the TrAdaboost algorithm, BPNN, RF and XGBoost were respectively taken as the base learner, the extended data set was taken as the source domain, and the original small sample data set was used as the target domain for transfer learning. The prediction accuracy of BPNN-TrAdaboost, RF-TrAdaboost and XGboost-TrAdaboost model was 96%, 98.4% and 95.8%, respectively (Table 6). For respiratory intensity, the prediction accuracy was 97%, 91.8% and 99.6%, respectively (Table 6). For TSS quality index, the prediction accuracy of BPNN-TrAdaboost, RF-TrAdaboost and XGboost-TrAdaboost models was 94%, 96.3% and 97.3%, respectively (Table 6). The results showed that after transfer learning, the accuracy of each model reached more than 94%, even as high as 99.6%. The predicted value was in good agreement with the actual value, and the prediction performance was good, which proved the effectiveness of transfer learning in kiwifruit quality prediction. According to the analysis of (1) and (2), the prediction effect of transfer learning on each index of kiwifruit was better than that of BPNN, RF and XGBoost on small sample data set and extended sample data set respectively. It proved the accuracy and effectiveness of transfer learning in kiwifruit quality prediction again, and provided a powerful help for the future study of kiwifruit quality changes during storage.
(4) Compared with the other familiar research, the experimental result was also better. Xin studied the quality prediction method of kiwifruit based on hyperspectral technology and machine learning [13]. His model’s MSE is 0.2829, and R2is 0.9556. Liu et al. used the Arrhenius equation to establish the dynamic model of the corresponding quality index. The relative error of the shelf life prediction weighting model was within±10% [9]. Our models based on transfer learning had the average R2 96.2% and the highest is 99.6%. The Comparison of R2 of ours and others is as Table 7. The List of MSE of our models is as Table 8
R2 comparison of different methods of ours and others
List of MSE of our models
The key of using machine learning models to predict kiwifruit quality is the experimental data and the model parameters. Due to the difficulty of obtaining a large amount of experimental data, the paper used the machine learning model combining transfer learning idea to improve the model accuracy by augmenting the data set, thereby improving the prediction accuracy. Compared with the references, both the prediction accuracy and MSE had been improved. Of course, any model has its preferences and is closely related to specific applications. Although the experimental data sets of references are not exactly the same, they all predict the quality of kiwifruit, and the comparison of model results has certain reference value.
There is a nonlinear relationship between temperature, storage time and quality indexes of kiwifruit, so it is very difficult and costly to monitor kiwifruit quality in real time. And the current accuracy of quality prediction is often not high enough. In order to solve these problems, kiwifruit quality prediction models were established and implemented to verify the feasibility and effectiveness of BPNN, RF, AdaBoost models and transfer learning models based on these three models respectively. In this paper, the models’ construction, training and parameters’ selection were deeply discussed and analyzed. In the process, grid search method was used to optimize the parameters to obtain the optimal combination of model parameters. To improve the training speed and reduce the error in the process of modeling, the effective filling and normalized processing were done on input data. The experimental results showed that the accuracy of the models could meet the prediction requirements, the prediction performance was good, and the predicted value and the actual value were in good agreement. After transfer learning, the accuracy of the models reached more than 94%, and respiratory intensity index was even as high as 99.6%, which proved the efficiency of transfer learning. Therefore, transfer learning can be used to predict the quality of kiwifruit and provide help for future research on the quality changes of kiwifruit during storage.
About the work we have to mention: (1) Any model has its preferences and is closely related to specific applications. (2) Due to the small number of sample set, although data augmentation techniques have been adopted, the model still had the risk of over-fitting. Therefore, in the training process, it was necessary to repeatedly adjust the models’ parameters, not only to prevent over-fitting, but also to ensure that the model had better prediction results. The workload of parameter selection was large, although the grid search method was adopted, the workload could not be ignored. (3) In this paper, we only selected Jinyan as the representative of the kiwifruit for research. How to obtain more experimental data of other varieties of kiwifruit, consider the quality prediction problem under the influence of more factors, and establish a more accurate and more universal quality prediction model is still the main work of our next step.
Footnotes
Acknowledgments
The data were collected by the members of the college students’ innovation and entrepreneurship project team, and Jinliang Xiong reviewed them. Professor Wenqiang Guan gave us a lot of guidance. Here we expressed our gratitude.