
Abstract
In the application of deep learning-based fault diagnosis, more often than not, the network model could perform better with a balanced dataset input, whereby the number of fault data is equivalent to that of normal data. However, in the context of real-world applications, the number of fault data is generally insufficient compared to the normal data. In this study, a new approach for fault diagnosis in unbalanced data sets is proposed using the Gramian angular field (GAF) method. Firstly, the GAF method is employed to convert one-dimensional data into two-dimensional data, which enhances the feature extraction process. Secondly, to balance the sample distribution, fault data is generated using Generative Adversarial Networks (GANs). Finally, the Residual neural network (ResNet) with an attention mechanism is utilized to improve the accuracy of fault diagnosis. The proposed method is experimentally validated using open-source bearing datasets that are published by Case Western Reserve University and the University of Ottawa. The experimental results show that the proposed method has greatly improved fault diagnosis performance in cases of data distribution imbalance, surpassing that of the compared methods.
Keywords
Introduction
Rolling bearings are commonly used components in rotating machinery. However, the harsh working environments cause them to be vulnerable to damage. If the damages are undetected, they may result in significant loss. As a result, bearing fault diagnosis has been a major area of research focus for scholars worldwide.
Traditional fault diagnosis methods rely on signal processing techniques and expert knowledge, while deep learning can extract data features automatically, making it gain widespread attention and surpass inherent limitations [1–15]. Xu [16] proposed a Time-Frequency Domain Tacholess Order Tracking (TOT) method combining inverse short-time Fourier transform and singular value decomposition for fault diagnosis. Islam [17] used discrete wavelet transform to convert bearing data format, improving diagnostic accuracy. Ma [18] proposed a Transfer Learning-Convolutional Neural Network (TLCNN) based on the Alex Krizhevsky Network (AlexNet) for bearing fault diagnosis, they first converted vibration signals into two-dimensional time-frequency images and then utilized the proposed TLCNN model for feature extraction, which achieving faster training speed and higher accuracy. It has been shown that two-dimensional data is more conducive to feature extraction of the model compared to one-dimensional data, which can improve the diagnostic performance of the model [19–30]. However, neural network diagnostic accuracy depends not only on input data format but also including the sample distribution.
Typically, the normal data is significantly larger than the abnormal data because the bearings are in normal operation most of the time. However, this can lead to a problem that the model focuses too much on normal data, which can adversely affect the diagnostic accuracy of the model [31–39].
Despite the effectiveness of the above methods, each has inherent limitations. In the absence of an increase in fault data, the extraction of unidimensional data features becomes challenging, thus hindering the model’s ability to learn fault features.
In short, the main contributions of this paper are as follows: Feature extraction difficulty is resolved by converting the vibration signal of the bearing into two-dimensional data through the GAF method. Such conversion is preferred for neural network feature extraction. Missing fault data is addressed by training GANs to learn features of fault data and generate more data to expand the data set. Such data expansion is instrumental to fault feature extraction. The addition of a Convolutional Block Attention Module (CBAM) to CBAM-ResNet, can bring more effective data feature extraction and improve network diagnostic accuracy.
Diagnostic model for unbalanced data sets
Step 1 comprises converting the bearing vibration signal into a two-dimensional image using GAF, which is divided into training and testing sets for the follow-up train and test work of the diagnosis model.
Step 2 involves employing a Robust Seasonal Multivariate Generative Adversarial Network (RSM-GAN) to train the training set with fault data inputs and to generate additional fault data for balancing the data set.
Step 3 involves training CBAM-ResNet with the balanced training set and saving the completed training model for fault diagnosis.
Data processing module
The primary function of the data processing module is converting data types, accomplished through the implementation of GAF [40]. Specifically, this module converts bearing vibration data into two-dimensional image data.
Let M = {m1, m2, …, m n } represent the vibration signal of the bearing. The horizontal coordinates are determined by the n moments, while the vertical coordinates are represented by m1,m2, …, m n and so on. Thus, the vibration signal of the bearing can be graphed in a Cartesian coordinate system.
The bearing vibration signal is normalized to fit the range of [-1, 1] via the cosine function. The normalization process is fully achieved through Equation (1).
Since arccos is a bijective function, the one-to-many problem of M corresponding to multiple Ns in the Cartesian system can be resolved by transforming it into a polar coordinate system using Equation (2). In the polar coordinate system, M represents the value, and n denotes the radius.
The transformation can be accomplished through the GAF matrix calculation using Equation (3).
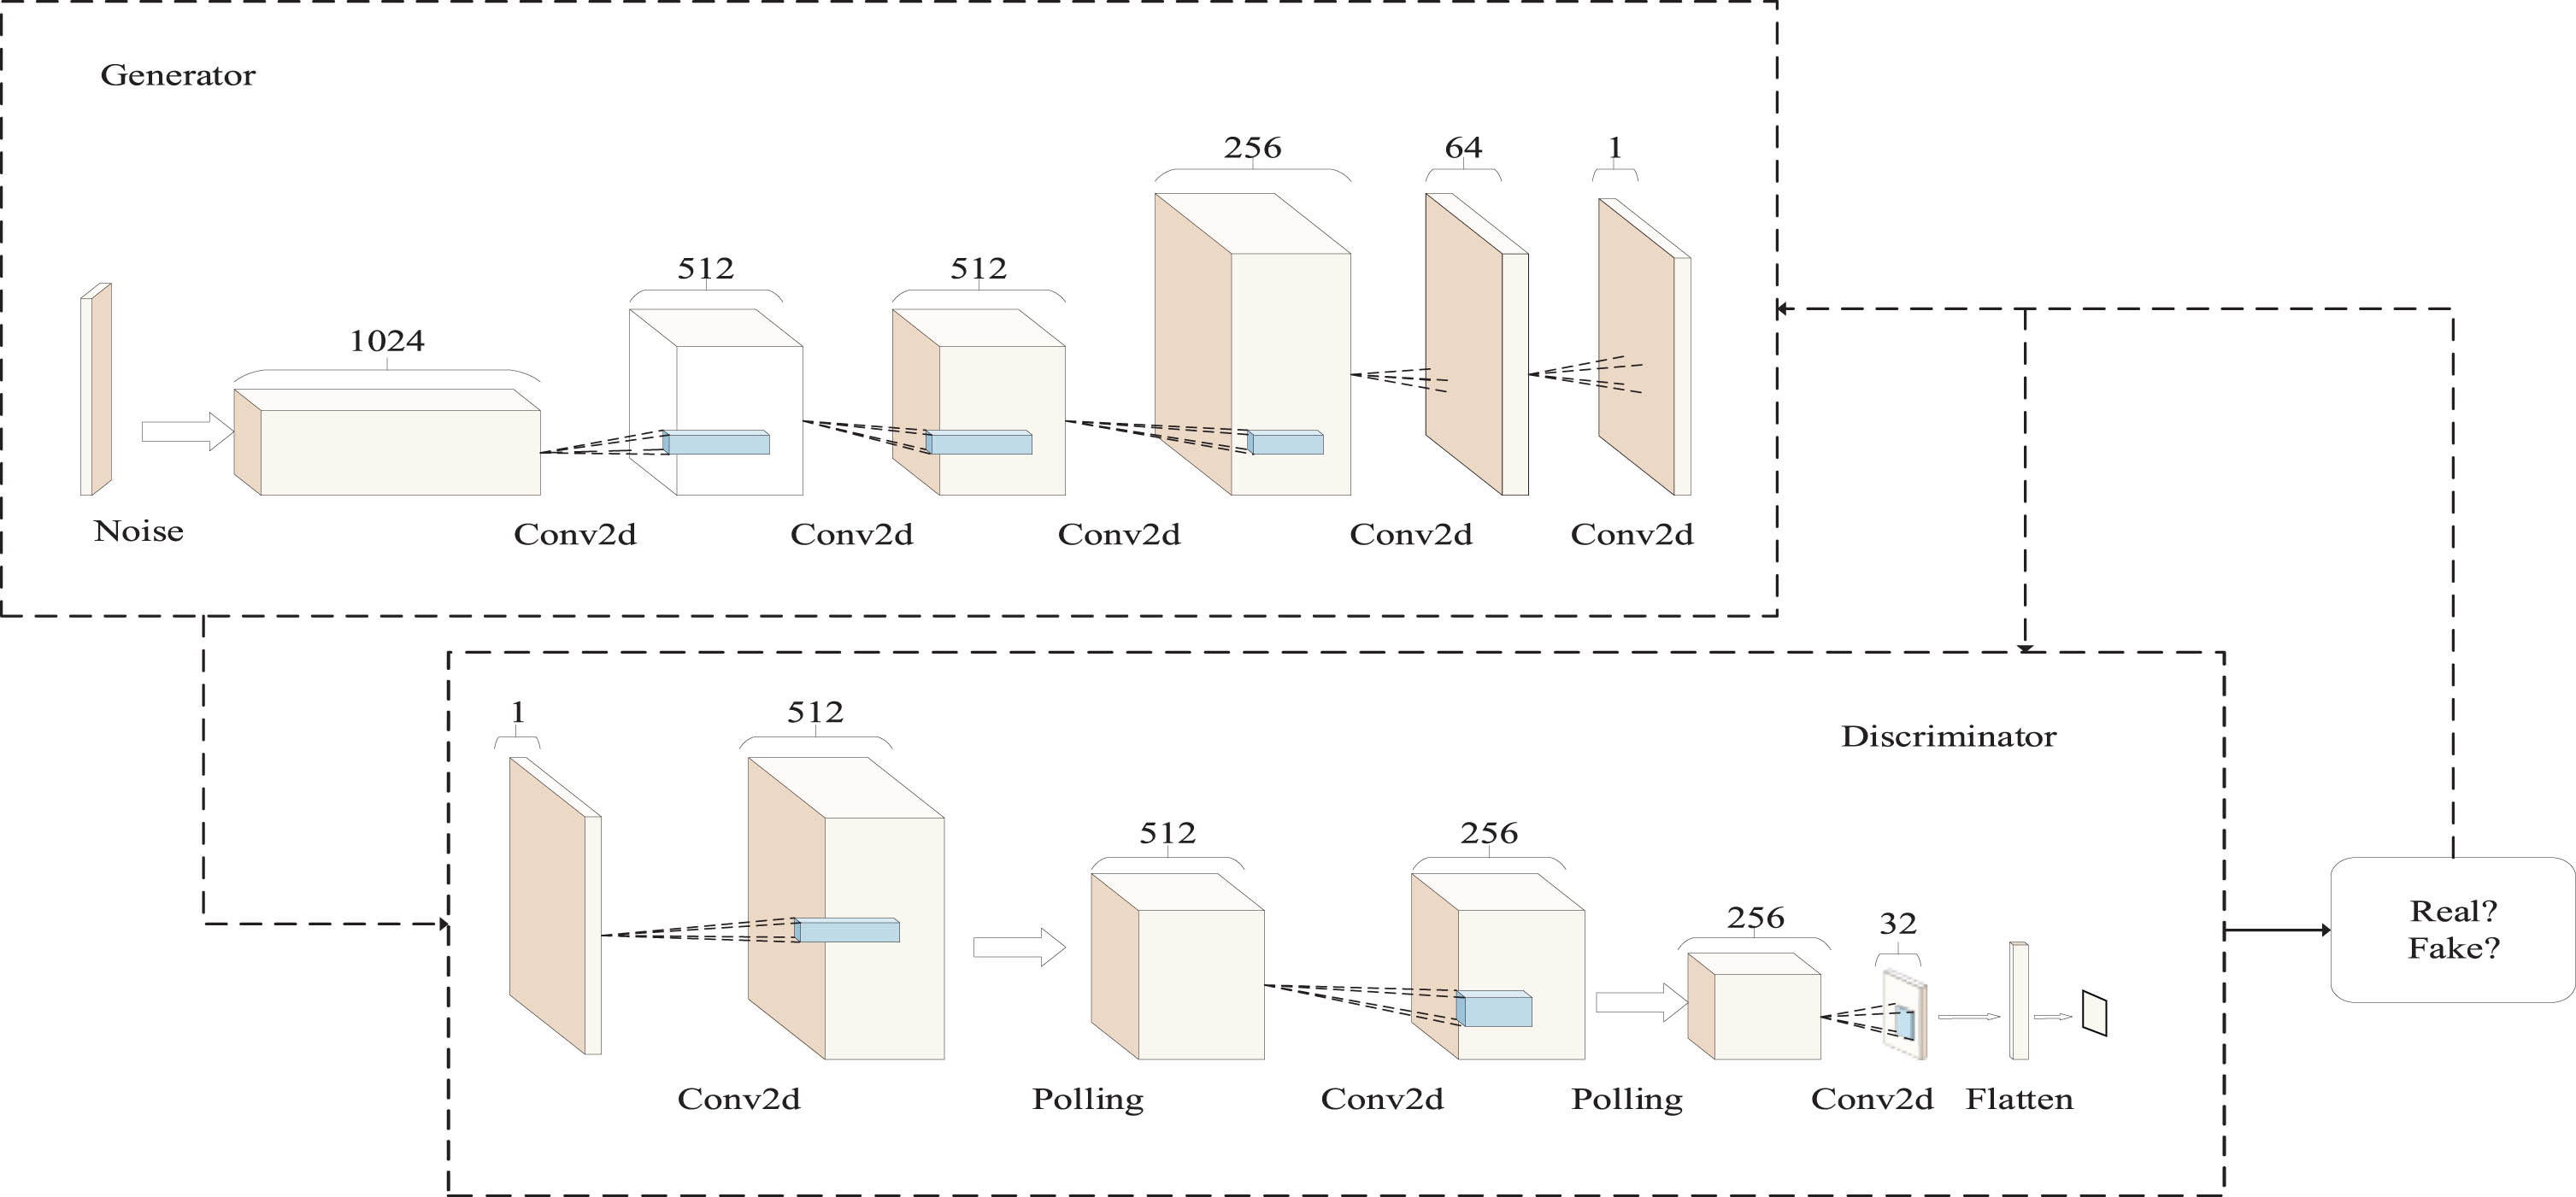
GANs [41] is composed of two neural networks: a generator G and a discriminator D. The generator G uses noisy signals as input to produce images, while the discriminator D assesses the authenticity of the produced images. However, the balance of G and D is difficult to achieve in traditional GANs, thus resulting in training difficulty, weak G or D will lead to training failures. To address the above problem, the Gradient Penalty (GP) [42] loss function shown in Equation (4) is applied to GANs to allow for more controlled training.
The addition of a Dropout layer discards random networks to prevent overfitting of the model. In the data enhancement module, the input value of the D function is a constant of 1. Meanwhile, the addition of a GP constraint ensures that D is a continuous function, which can promise training stability. Figure 1 shows the specific network architecture.
Data enhancement module.
The data enhancement module significantly enriches the quality of the generated images after a similar number of training sessions, as shown in Fig. 2.

Comparison of the data enhancement module with the GAN generated pictures.
Theoretically, deeper neural networks can extract more refined and complex features. However, when the number of layers in the network is continuously increased, the accuracy rate abruptly declines, a phenomenon known as degradation. To enable deeper networks and improve their overall performance, He [43] proposed ResNet, which links networks with jumper connections to allow for continuous deeper connections. This method resolves the challenge of training deep neural networks by enhancing the gradient flow. ResNet is composed of residual units, where Fig. 3 depicts a single residual unit.
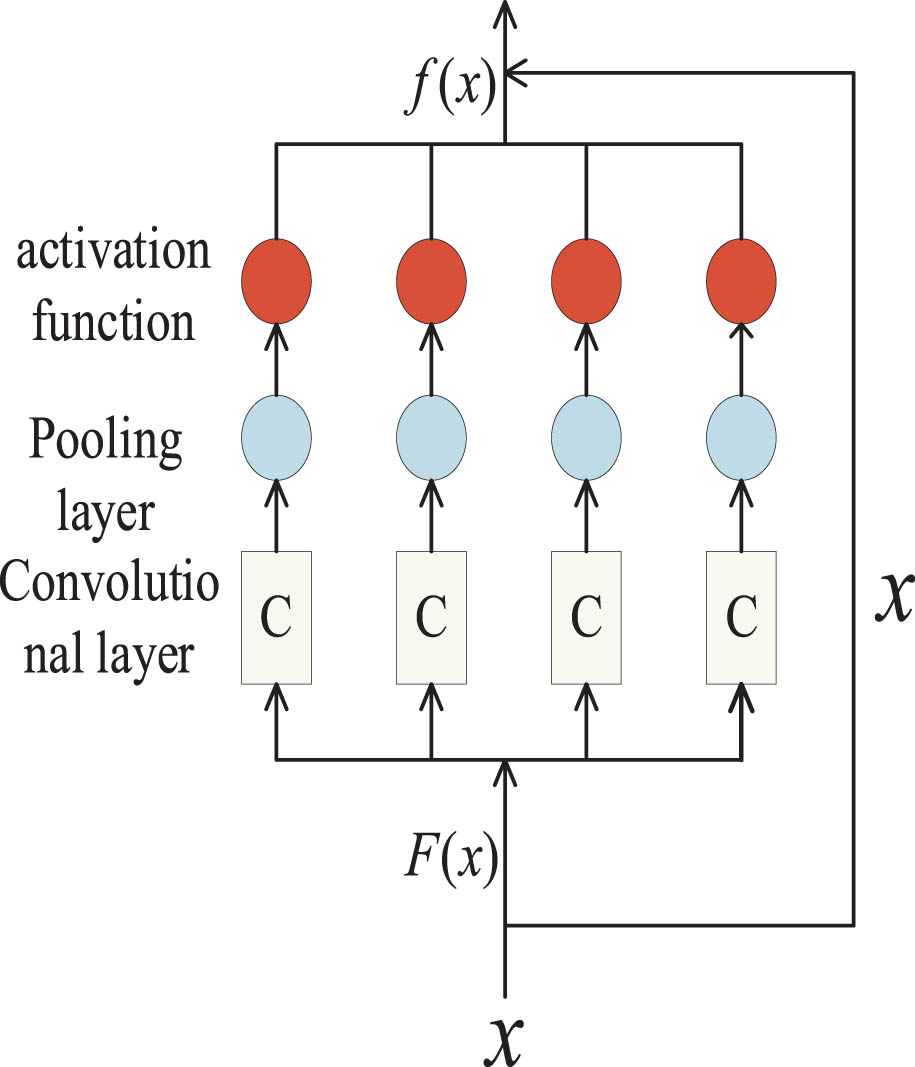
Residual unit.
The use of skip connections ensures the conservation of information in the layer when x is input into the network. Even when the layer is not utilized, the output also is x. The equation describing the output is given by Equation (5), where relu is the activation function.
The fault diagnosis module’s base network uses ResNet18. Each image feature channel represents a feature detector, and only significant features are considered. Therefore, the base network implements the channel attention mechanism [44] to reasonably extract significant features. Additionally, the model implements the spatial attention mechanism after the channel attention module to focus on relevant spatial features and omit irrelevant ones. Compared to the Squeeze-and-Excitation Networks (SENet) attention mechanism, the introduced spatial attention mechanism comprehensively and effectively extracts fault feature information. Equations (6) and (7) describe the channel attention mechanism and spatial attention mechanism, respectively.
The network implements channel and spatial attention mechanisms after the first and the last convolutional layers, which is shown in Fig. 4.
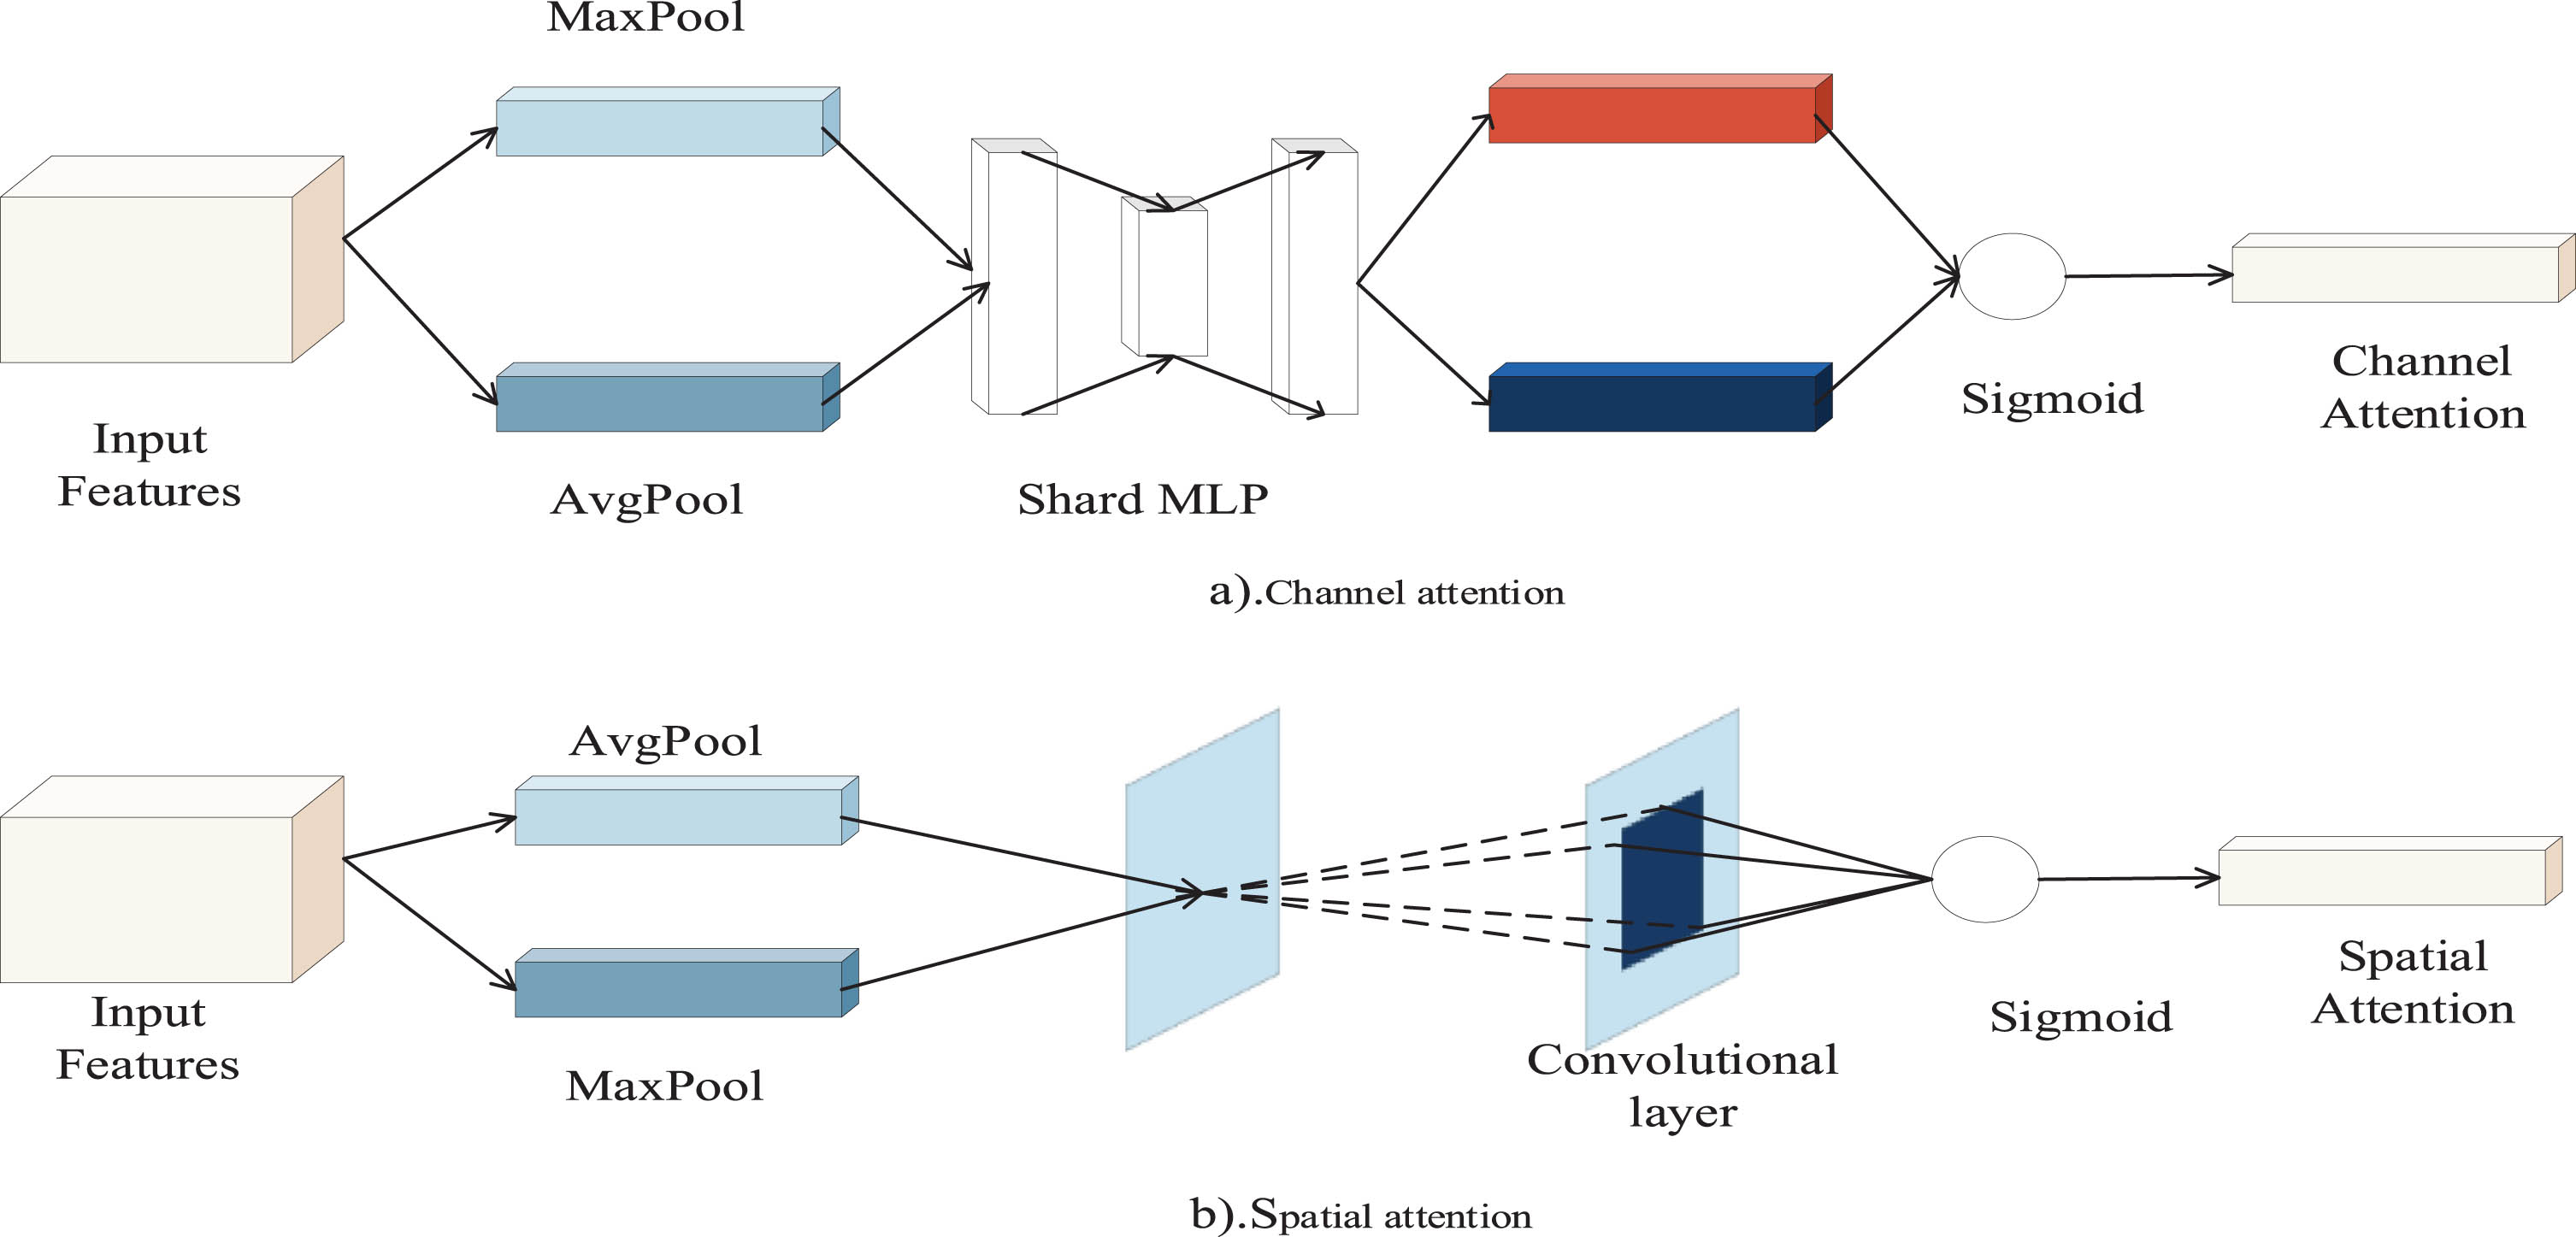
Connections of the attention module.
The channel attention mechanism consists of feeding the input features into the maximum and average pooling layers, connecting them through a fully connected layer, and outputting them by the activation function. On the other hand, the spatial attention mechanism feeds the input features into the maximum and average pooling layers and convolves them before outputting via the activation function.
Data acquisition and processing
The experimental data is obtained from the public bearing dataset of Case Western Reserve University. The dataset is divided into three types according to bearing failure diameter: 0.007 inches, 0.014 inches, and 0.028 inches, with the different sizes subdivided into inner race fault, outer race fault, and ball fault. The experimental equipment for this dataset includes motors, transmissions, bearing supports, and transducers, and the experimental conditions involve different operating conditions, loads, and speeds. During the experiment, for each type of fault, the vibration signals of the bearings are recorded.
The time domain waveform of the characteristic signal corresponding to each state of the raw bearing data is shown in Fig. 5.

Bearing vibration data.
The time-domain waveform is collected using 1000 sequences, sequenced according to normal, inner race fault, outer race fault, and ball fault. As shown in Fig. 5, the fluctuations in the normal state time-domain signal are small and relatively uniform. Conversely, in a faulty state, the waveform exhibits a more erratic behavior compared to normal signal fluctuations.
The vibration data was obtained from bearings in 1000 sequences and processed using the data processing module, as shown in Fig. 6.
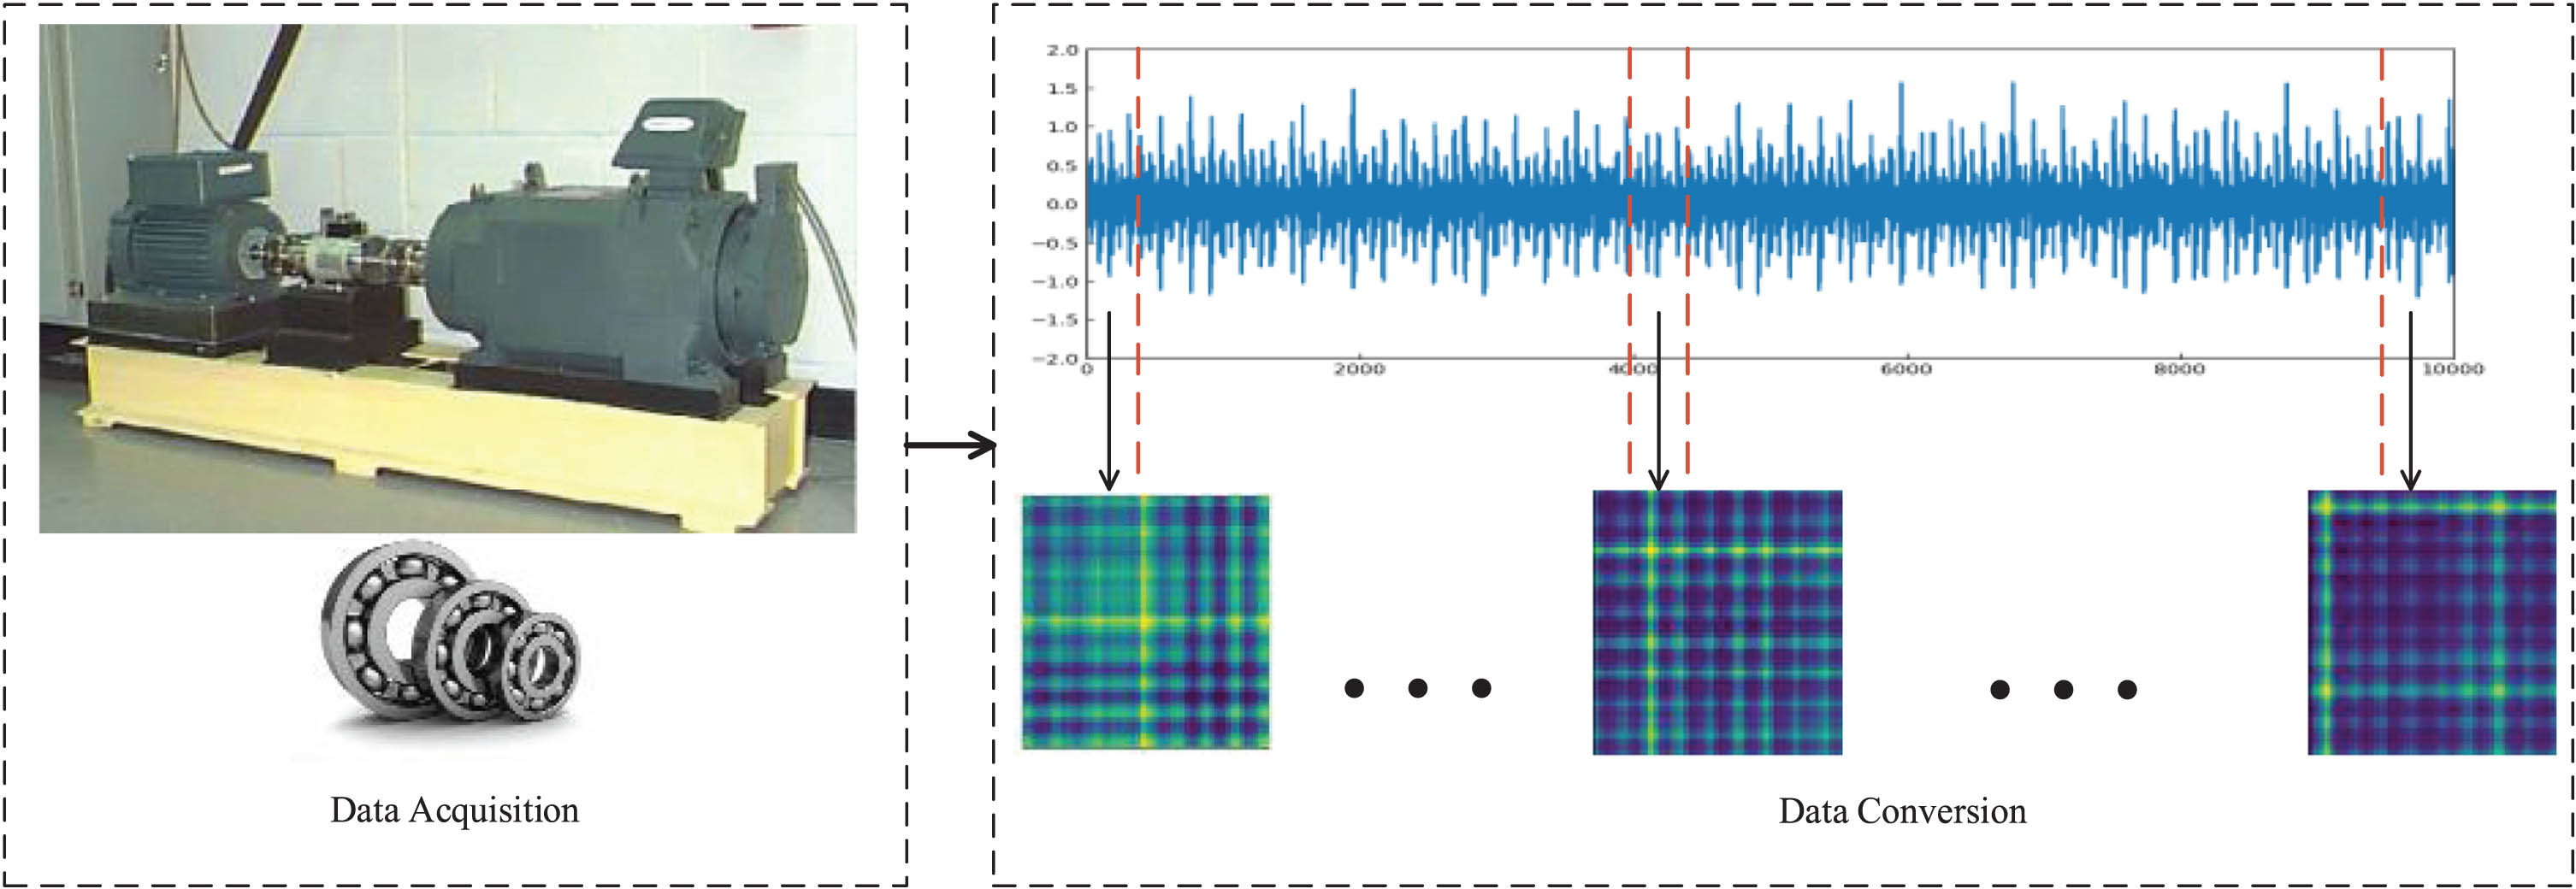
Data acquisition and conversion.
The acquisition and conversion of data for normal bearings and faulty bearings followed the same process. The data for both are processed in the same way.
The experimental parameters are as follows: the framework used is Pytorch, where the initial learning rate is 0.001 and the learning rate is dynamically adjusted with the training process, the batch size is 32, and the epochs are 20. The model is divided into five convolutional layers, the first convolutional layer has a convolutional kernel of 7 × 7 and passes through a 3 × 3 max pooling layer, the rest of the convolutional kernels are sized in 3 × 3.
This work used balanced sample distribution to evaluate the diagnostic performance of one-dimensional Convolutional Neural Networks (1dCNN) compared to one-dimensional ResNet for selecting the underlying network. The results are shown in Fig. 7.
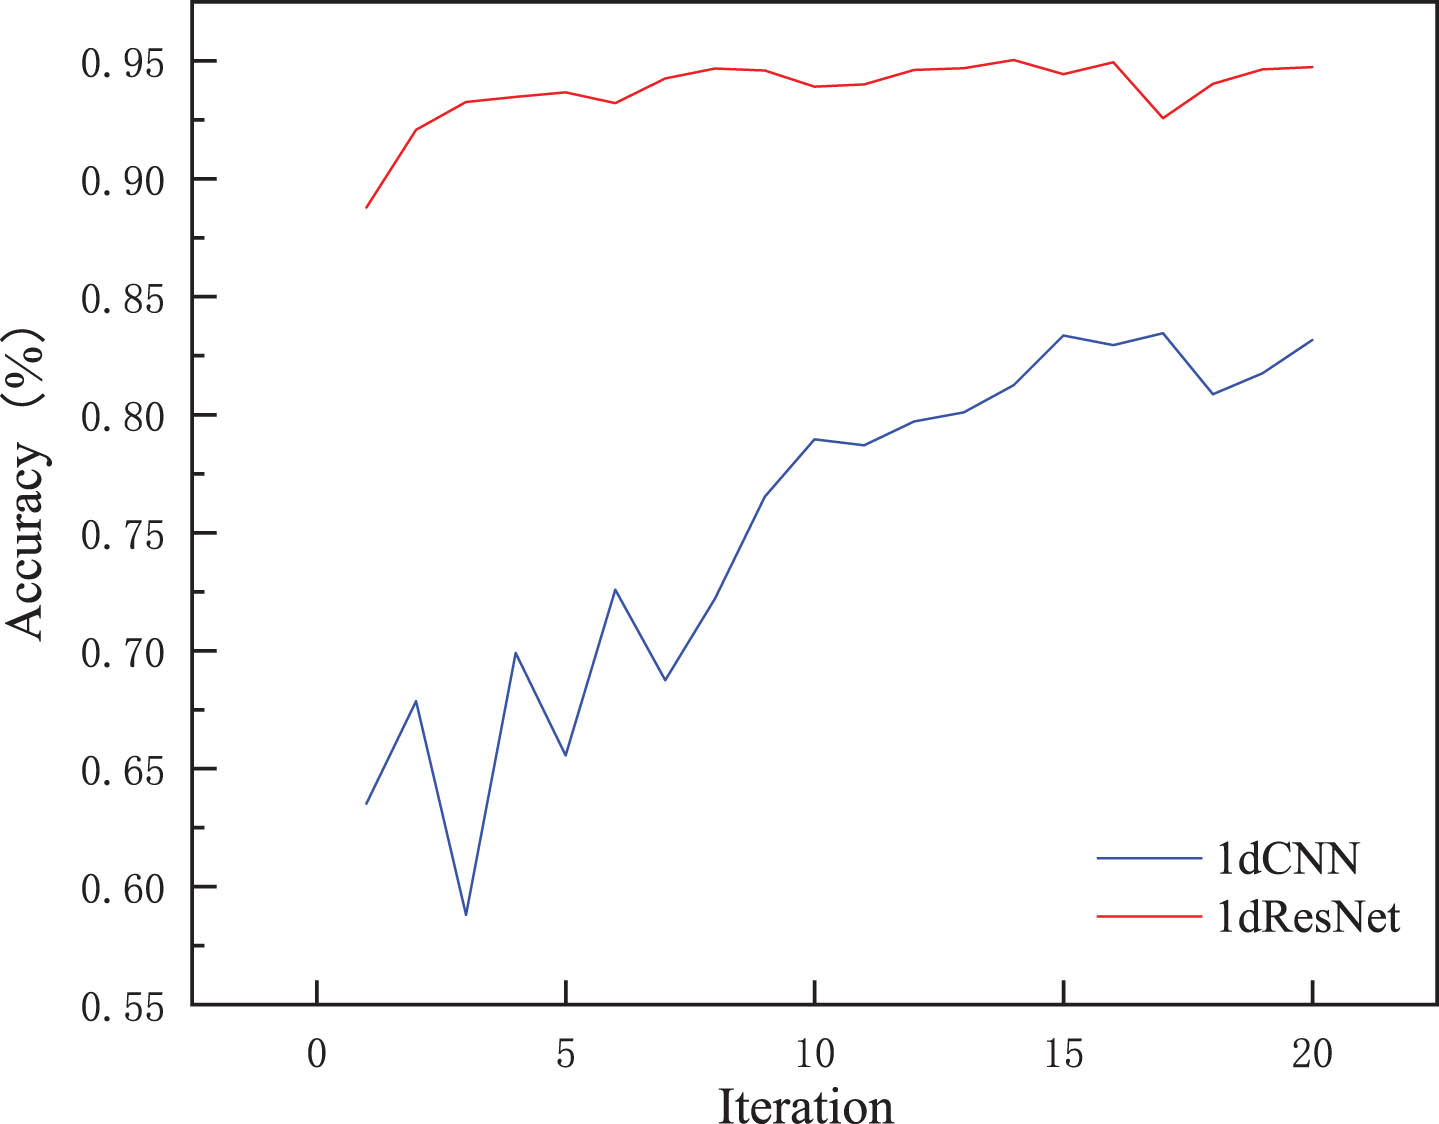
Comparison of 1dCNN and 1dResNet accuracy.
As seen from Fig. 7, the accuracy rates of CNN and ResNet can reach 83.1% and 94.7% after 20 iterations, respectively, in which ResNet performs significantly better than CNN, and ResNet is more stable under the same data dimensions. Therefore, this work chooses ResNet as the base network.
This paper selected a balanced sample distribution for the experimental data set, which contained the original faulty data after conversion. To verify the effect of data type on diagnosis results, the processed data are compared and the results are presented in Fig. 8.
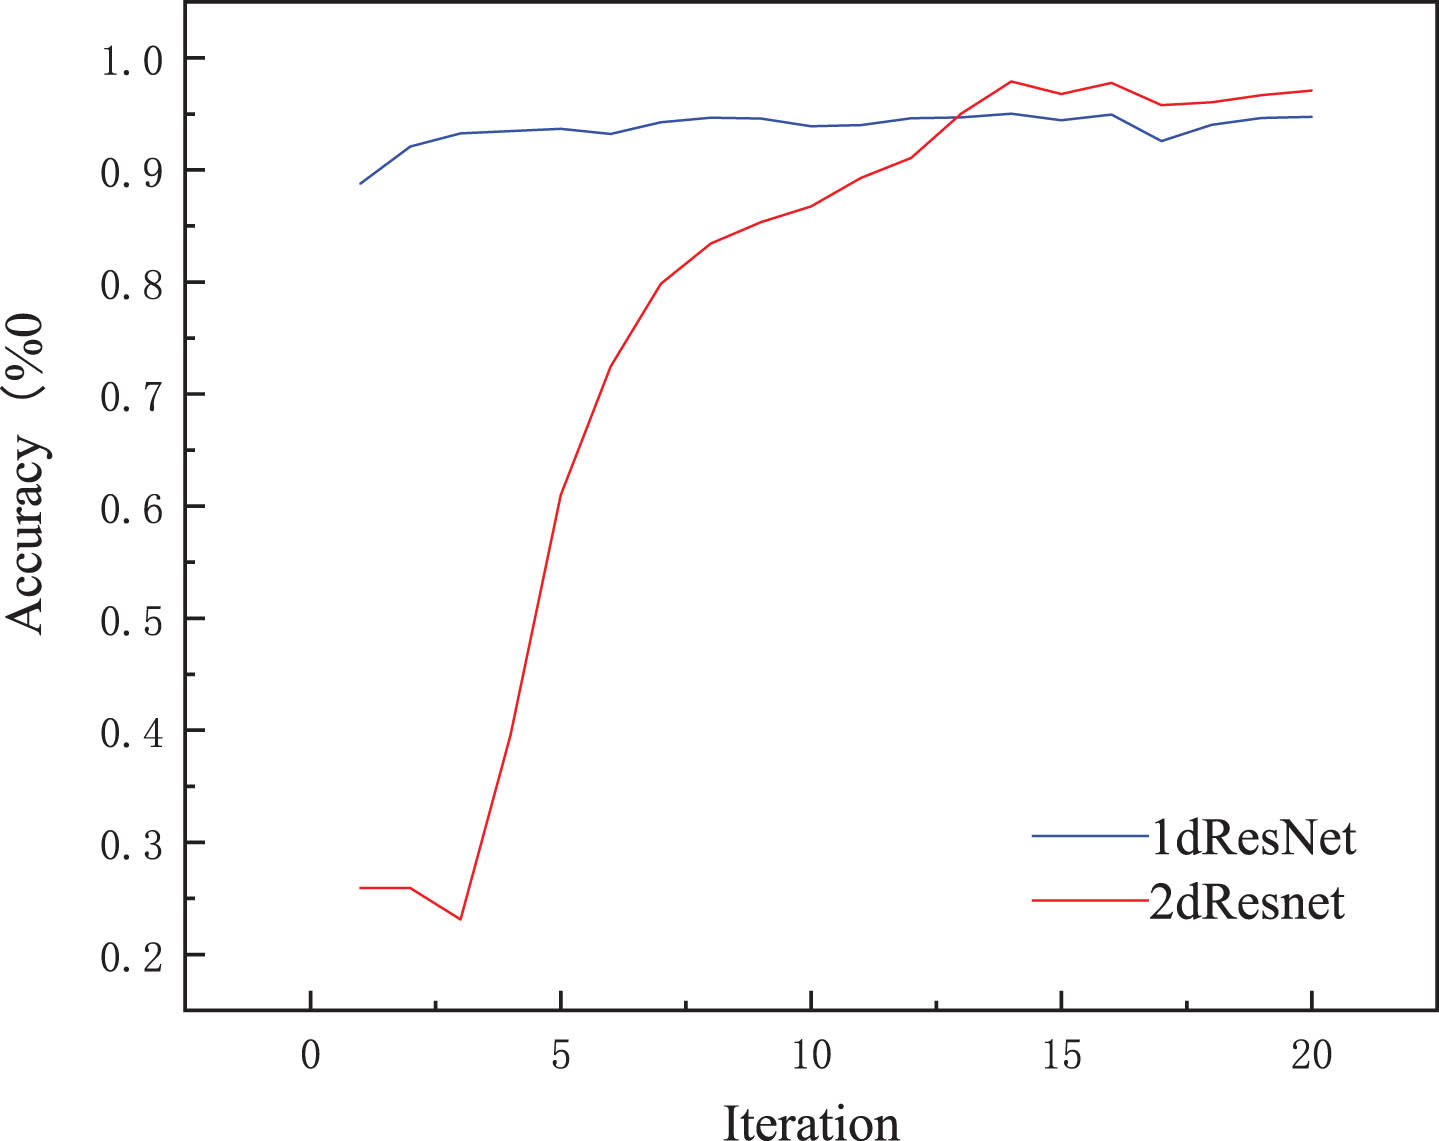
Comparison of 1dResNet and 2dResNet accuracy.
It can be seen in Fig. 8, that the accuracy rates of 1dResNet and 2dResNet reach 94.7% and 97.0% after 20 iterations, respectively. Compared with 1dResNet, 2dResNet has a higher accuracy rate, which indicates that the converted data has a higher fault indication than one-dimensional data, although the initial diagnostic rate of the converted data is lower.
To verify the effect on the diagnostic accuracy of the model when the data sample distribution is unbalanced, the Case Western Reserve University bearing dataset is divided into a training set and test set with a 7:3 ratio.
Table 1 shows the distribution of the training set data for five categories. The data is divided into these categories to evaluate the impact of varying sample proportions on the diagnostic accuracy of the model.
Composition of the training set
Sequence No.1 is the original data, which is used to compare with other data. Sequence No.2 is composed of normal data and fault data with a ratio of 75% :25%. The data distribution is slightly unbalanced in this sequence, which is used to verify the impact on the model diagnosis results when the sample distribution is unbalanced. Sequence No.3 is completely unbalanced at this moment. The fault data of sequence No.4 has original fault data and generated fault data, which is used to verify whether the generated data is valid for the model. The fault data of sequence No.5 consists entirely of generated data, which is used to verify the difference between the generated fault data and the original fault data.
As shown in Fig. 9, the diagnostic accuracy of the proposed model is approximately 99.5% when the data set is solely composed of normal data, signifying its high accuracy in this scenario. However, if the amount of fault data decreases, the diagnostic accuracy of the model also decreases, which demonstrates that the diagnostic precision of the model is closely related to the composition of the data set. Alternatively, when the data set is augmented with generated fault data, the diagnostic accuracy of the model increases. For instance, the accuracy of Sequence No.4 is 99.3%, almost identical to the diagnostic accuracy achieved with the entirely normal data set. The accuracy drops to 94.7% when the fault dataset exclusively contains generated data, confirming the positive impact of generated data on improving the model’s diagnostic performance. More detailed results are shown in Table 2.
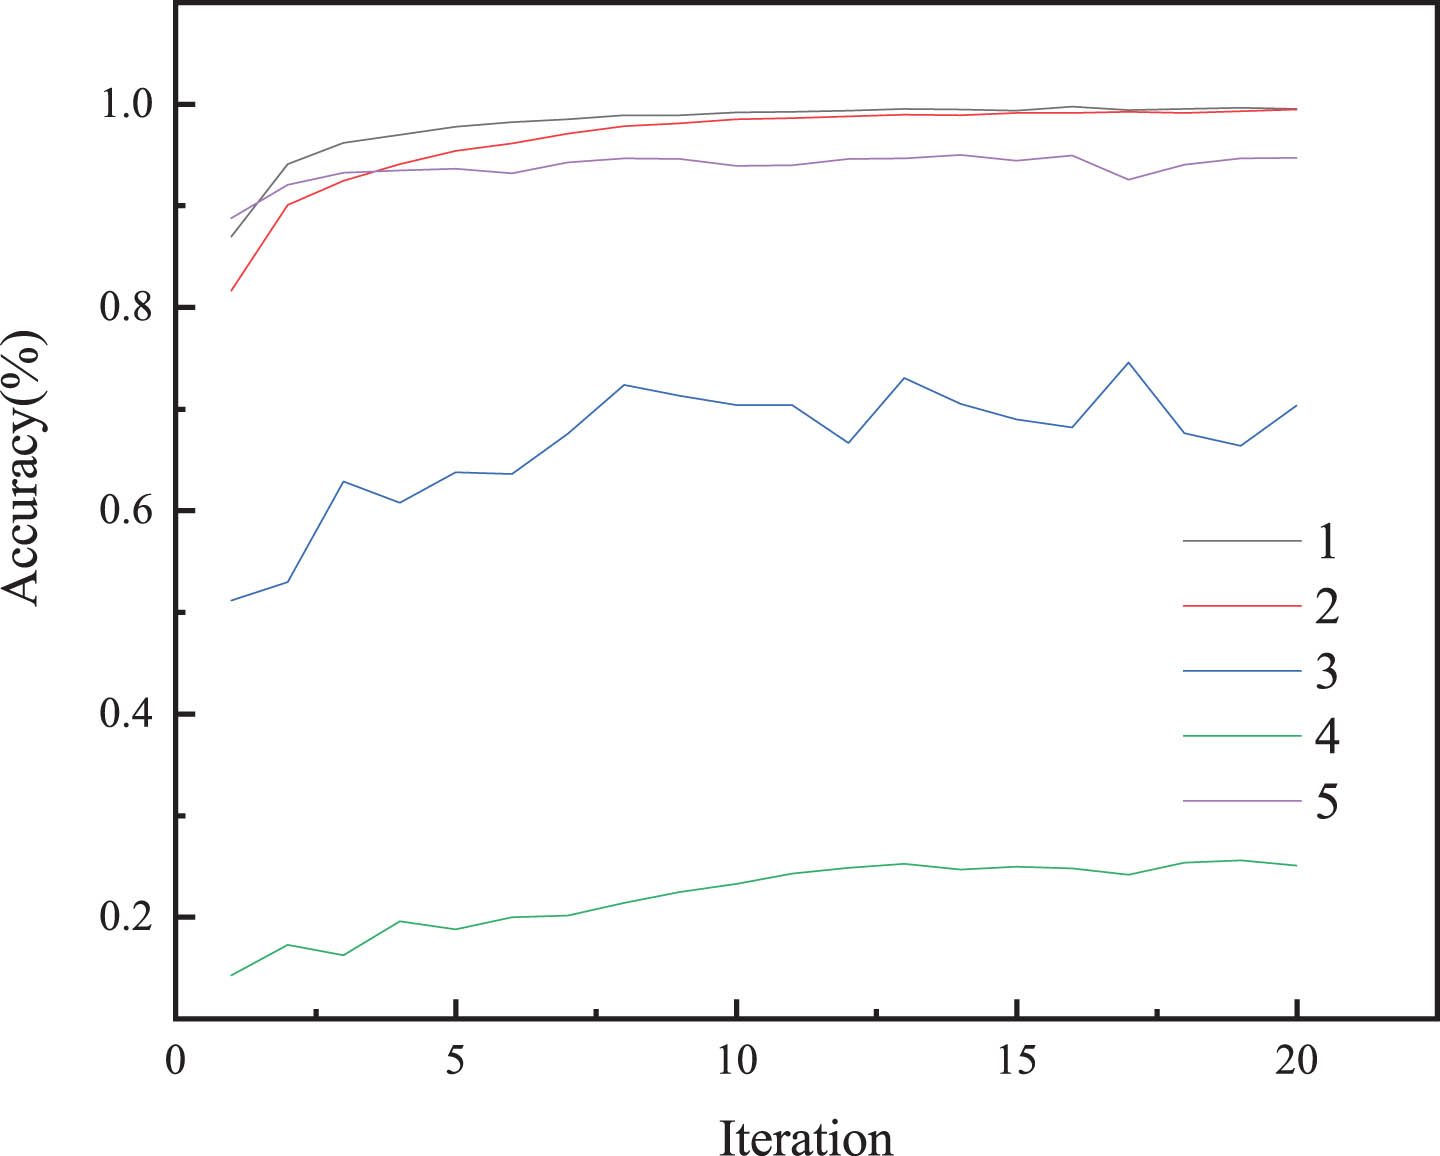
Effect of sample distribution on model diagnostic results.
Effect of sample distribution on model diagnostic results
To verify the effectiveness of introducing the channel attention mechanism and the spatial attention mechanism, validation results on dataset No.4 are presented in Fig. 10.
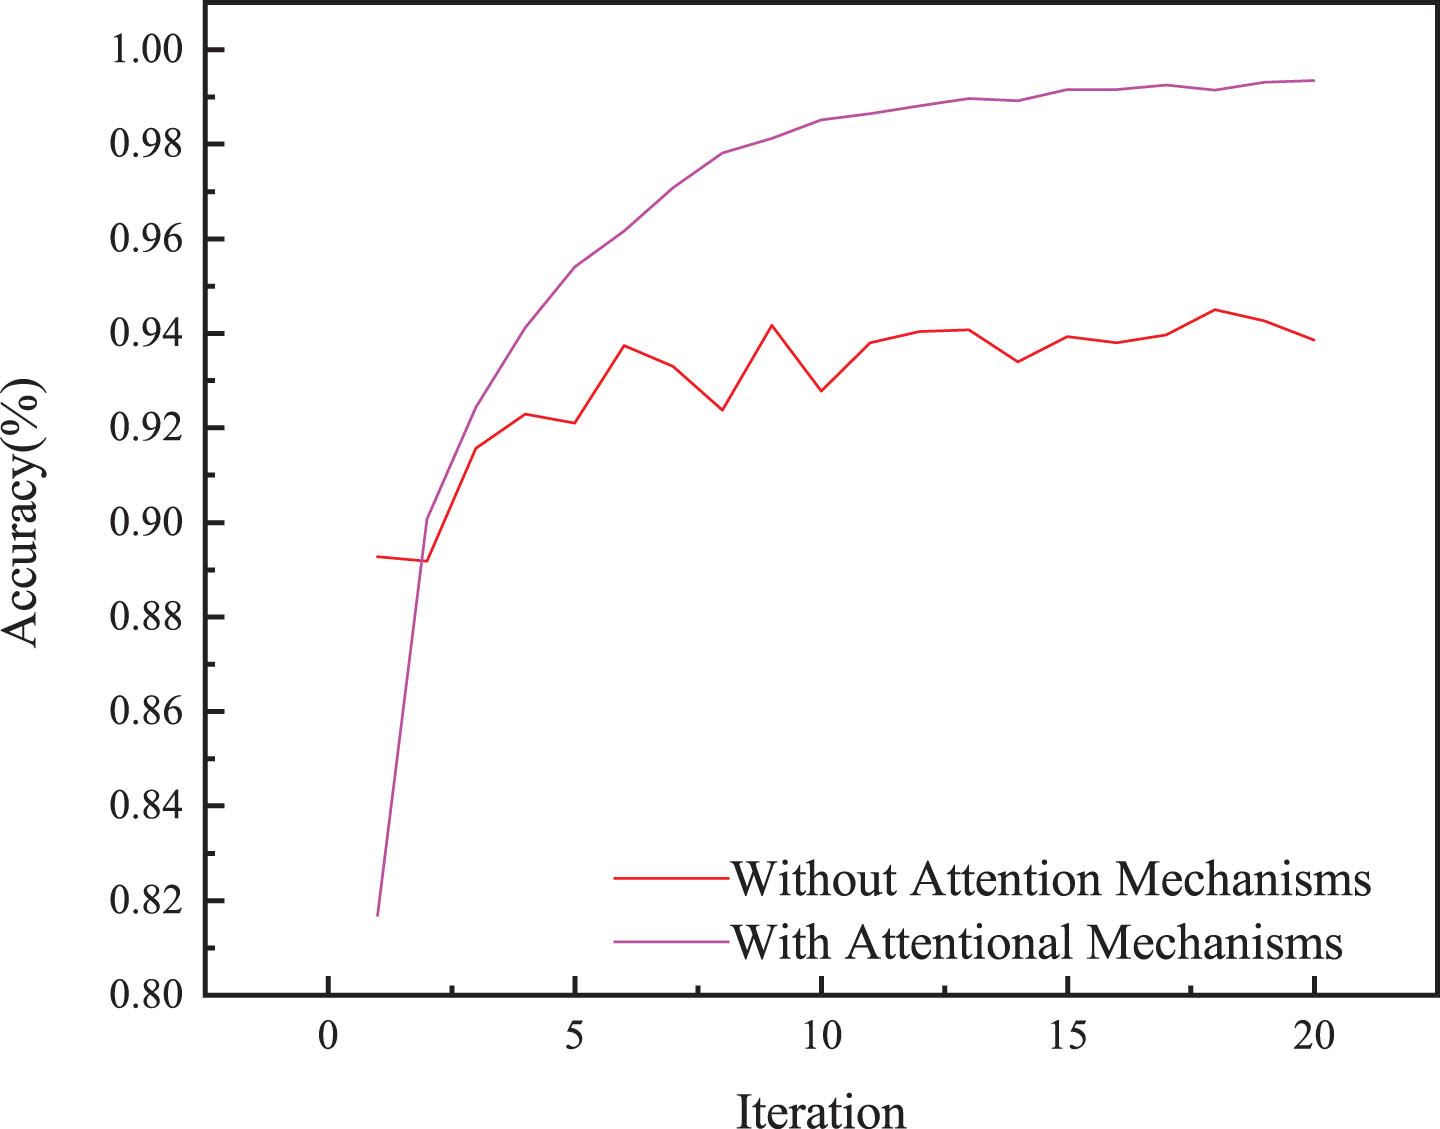
Ablation experiments of attention mechanisms.
The diagnostic accuracy improves by approximately 6% after implementing the attention mechanism, demonstrating a noticeable enhancement in the model’s effectiveness. This implies that the attention mechanism is capable of improving the diagnostic accuracy of the fault diagnosis model.
More comparison with some commonly used attention mechanisms for fault diagnosis models to verify the validity and superiority, including Squeeze and Stimulate (SE), Self-Attention Network (SA), and Coordinated Attention (CA), and the results are shown in Table 3.
The average accuracy of multiple models for fault diagnosis
As seen from Table 3, after balancing the dataset using the proposed data enhancement module, the average accuracy of CBAM-ResNet is 99.3% using only the fault diagnosis module. Although SE-ResNet, SA-ResNet, and CA-ResNet continue to exhibit higher diagnosis accuracy than ResNet, they are still lower than CBAM-ResNet. These results reinforce the effectiveness and superiority of the proposed fault diagnosis model in this paper. Conversely, the diagnosis accuracy of CNN, SE-CNN, SA-CNN, and CBAM-CNN are 83.3%, 84.7%, 85.6%, and 86.3%, which are lower than CBAM-ResNet. Despite the introduction of the attention module leading to an improvement, the BP neural network and Random Forest have slightly higher diagnostic error rates. Thus, these findings demonstrate that CBAM-ResNet is superior in improving the diagnosis rate and efficient in fault diagnosis.
To further validate the performance of the proposed model, the bearing dataset from the University of Ottawa, Canada is utilized. The dataset comprises three states - normal, inner race fault, and outer race fault. The results of the experiments are displayed in Fig. 11.

Diagnostic results of the dataset from the University of Ottawa, Canada.
In the experiments of the bearing dataset of the University of Ottawa, Canada, the experimental parameters are set as follows: the ratio of normal data to faulty data of sequence No.1 is 1:1, and this experimental setup is to verify the diagnostic accuracy when the data ratio is normal and to compare with other experiments, the highest accuracy rate at this time is about 98.2%. The ratio of normal data to faulty data for sequence No.2 is 3:1, at this time the data is out of balance, and the diagnostic accuracy is about 72.3%, it can be concluded that the lack of distribution of the dataset would affect the diagnostic results. Sequence No.3 is composed entirely of normal data, at this time the diagnostic accuracy of the model is about 22.4%, and the diagnostic results of the model have no credibility. The ratio of normal data, fault data, and generated fault data of sequence No.4 is 2:1:1, and the data rely on the generated fault data to be balanced, at this time, the diagnostic accuracy is 96.32%, and it can be concluded that the generated faults have improved the diagnostic accuracy of the model. The ratio of normal data to generated fault data for sequence No.5 is 1:1, this experiment is to verify the difference between generated fault data and fault data, the diagnostic accuracy is roughly 92.4%, it can be concluded that although there is a certain difference between generated fault data and fault data, it can still be a solution to the problem. These observations imply that the proposed model is effective and possesses a certain level of generalization ability as it can be applied to different datasets.
To verify the superiority of the method in this paper, other published methods are compared and the results are shown in Table 4.
Average diagnosis accuracy of the other published models for fault diagnosis
A GAN and GAF-based fault diagnosis model for imbalanced data is proposed in this work. The key findings are as follows. (1) The data samples are transformed using GAF to enhance the feature extraction capability of the model. (2) Introducing RMSprop to generative adversarial network to improve the stability of training and enhance the quality of expanding data. (3) The CBAM mechanism combined with the SE, CA, and SA attention mechanisms enables ResNet to extract fault information more comprehensively and efficiently. (4) The proposed method effectively improves the fault diagnosis capability, as evidenced by the little difference in diagnosis accuracy between the generated and original data after balancing the dataset.
Additionally, the proposed CBAM-ResNet substantially improves the extraction and learning capabilities, leading to superior diagnostic performance, which is more suitable for diagnosing imbalanced datasets with high diagnostic accuracy across different data sets. These findings show the model’s generalization ability, making it an innovative approach in the field of fault diagnosis.
Footnotes
Acknowledgments
The authors greatly appreciate the financial support from the National Natural Science Foundation of China (62241307), the Scientific and Technological Project of Gansu Province (22YF7FA166), the Scientific and Technological Project of Lanzhou City (2022-RC-60, 2023-RC-26).
Conflict of interest
The authors declared no potential conflicts of interest concerning the research, authorship, and publication of this work.