
Abstract
The reliability level of general aviation fleet system directly affects the economic benefits and safe operation of general aviation fleet. In order to effectively evaluate the reliability level of general aviation fleet, using the entropy weight variable fuzzy recognition and 1D-CNN depth learning reliability evaluation method. Firstly, taking the Cessna 172 general aviation fleet as the research object, refers to the maintenance statistical analysis of general aviation fleet reliability data, and classifies the fleet reliability evaluation indexes according to the ATA100 chapter standard. Combined with index importance analysis and Delphi expert investigation, 14 key items are extracted as reliability evaluation indexes of general aviation fleet. Secondly, using entropy weight method to obtain indexes weight objectively, and the evaluation level membership function is constructed based on variable fuzzy recognition method. Finally, a reliability evaluation model based on 1D-CNN deep learning method was established. Through training and testing the reliability data evaluation model of general aviation fleet, and comparing with the results of evaluation methods such as support vector machines. The results show that the recognition rate of the 1D-CNN deep learning method based on entropy weight variable fuzzy recognition can reach 91.95%, verifying the objective effectiveness of the evaluation method.
Introduction
As a major global public health emergency, the COVID-19 epidemic has had a significant impact on the development of global port operations [1]. At the same time, it has had a huge impact on the general aviation field. With the opening of international flights in various countries, the general aviation field has also begun to recover. The civil aviation industry has witnessed rapid growth and expansion, resulting in unprecedentedly large airline fleets. Ensuring the high reliability of civil aviation aircraft is crucial for the long-term prosperity and development of this industry [2]. However, when it comes to the reliability management of general aviation fleets, practices have largely been adapted from transport aviation, and a dedicated “reliability-centered” maintenance data management system tailored to the unique characteristics of general aviation is yet to be established, and the failure to effectively evaluate general aviation reliability data. Therefore, the need arises to develop a comprehensive model for evaluating the reliability status of general aviation fleet equipment. Such a model can significantly enhance the analysis process within the “reliability-centered” management framework, continually improving economic benefits and elevating safety standards.
At present, Scholars have developed many research methods on equipment and equipment reliability in the study of reliability issues. Mahapatra et al proposed interval nonlinear programming to evaluate the system reliability of optimal networks with interval-valued cost constraints [3]. Xiong Shenghua et al proposed an airline fleet reliability recognition model and verified the feasibility and rationality [4]. Feng Xin et al proposed the reliability evaluation of gantry crane based on fault tree analysis and Bayesian network [5]. Cheng Yansong et al proposed a reliability prediction method based on Fault Tree Analysis (FTA) and Failure Mode and Effects Analysis (FMEA) [6]. Makrygianni et al provide an approach based on a combination of reliability analysis and TQM tools for improving maintenance operations on modern fighter jets [7]. Hashemi et al proposed a new, fast and efficient aircraft battery reliability control scheme based on the working mechanism of lithium-ion batteries [8]. Sohn et al proposed a random effect regression model based on the Weibull distribution in order to predict the mean time between failures and the mean repair time of aircraft [9]. Kossi et al proposed an aircraft reliability state evaluation method based on Meta-Model [10]. Mallikarjuna et al proposed a deep learning model based on long-term short-term memory and two-way long-term short-term memory to study the reliability control technology of aircraft gearbox system, but did not carry out reliability state evaluation research [11]. Emmanouil used the system evaluation method to construct the reliability and safety evaluation model of avionics equipment, and proved the feasibility of the evaluation model based on the failure data of electronic equipment in turbofan engines [12]. Al-Garni and others used artificial neural network and Weibull regression analysis methods to build the aircraft tire failure rate prediction model [13].
Despite these extensive research efforts, certain challenges remain unaddressed. (1) The overall equipment reliability of general aviation aircraft has not yet been evaluated and analyzed. (2) Unable to overcome the random uncertainty of sample indicators. (3) The evaluation results are subjective, the evaluation accuracy is not high, and the reliability and validity are not ideal. (4) Unpredictable and difficult to operate. (5) It has hysteresis and cannot achieve dynamic evaluation.
This study uses the general aviation fleet failure data of a certain unit of an airline company, which is representative. The use of the entropy weight variable fuzzy recognition model is practical and operable. Taking into account the characteristics of the data itself, the weight can be determined according to the status of the equipment reliability data itself, and the general aviation fleet reliability data can be evaluated. The reliability indexes of fleet equipment are highly random and volatile, and the factors are highly nonlinear. One-dimensional convolutional neural network (1D-CNN) has extremely strong nonlinear approximation, large-scale parallel processing, self-training learning, fault tolerance and adaptability to the external environment. It can better solve complex problems of randomness, volatility, nonlinearity and multi-index, and realize dynamic reliability assessment. and the feasibility of the method is verified through case analysis.
In conclusion, this study highlights the need for a systematic assessment of the reliability of general aviation fleet equipment. It identifies the existing scientific gaps in the field and justifies the necessity of developing a novel model that can address these challenges effectively. The proposed approach incorporates advanced techniques to enhance objectivity and precision in reliability evaluation, ultimately contributing to the safety and efficiency of general aviation operations.
General aviation fleet reliability evaluation index system
Fleet reliability index selection
The premise of general aviation fleet reliability evaluation is to select the reliability index, which directly affects the evaluation result. The key to selecting indexes is to select indexes that can directly reflect the specific status of the daily operation and maintenance of fleet equipment, and at the same time need to be accessible, measurable and monitorable. The selection should include the parameters determined in the design process of the equipment and the reliability parameters in the maintenance and use process. In short, the general aviation fleet equipment reliability index should include the inherent nature, usability and maintainability of the aircraft, etc. Therefore, this paper determines the airline fleet reliability evaluation index system based on the ATA100 specification.
Index selection norms and principles
Collecting data according to the contents of the ATA chapter to evaluate the reliability status of the general aviation fleet, which can convert to the reliability analysis of each subsystem and component. According to the contents of the ATA chapter collect data for general aviation fleet reliability status evaluation.
This paper uses the ATA100 chapter name as the index source classification based on fault data statistical analysis, selecting the Cessna172 fleet as the investigation object, U i is combined with the actual maintenance status of general aviation and maintenance experts’ recommendations to select 14 indexes, and finally obtains the general aviation fleet equipment reliability indexes as follows: fight control U1, power supply U2, communication U3, fuel U4, landing gear U5, lighting U6, navigation U7, power unit U8, engine fuel control U9, ignition U10, engine indication U11, vacuum U12, lubrication U13 and equipment decoration U14.
Recognition model of general aviation fleet reliability level
After determining the general aviation fleet reliability index system, select the appropriate evaluation method for the fleet reliability data to carry out the evaluation and analysis of the general aviation fleet reliability status, so as to obtain the aviation fleet reliability level scientifically and reasonably, so as to make a reasonable evaluation of the reliability of the general aviation fleet. Many factors are closely related and have multiple characteristics such as ambiguity, randomness, and volatility [14]. The variable fuzzy recognition method is a method of comprehensively evaluating objects affected by multiple factors or indexes by means of fuzzy mathematics. This method converts fuzzy and difficult-to-quantify problems into quantitative evaluation, can better solve complex problems such as randomness, volatility and multiple factors. In order to reasonably determine the index weights and ensure the objectivity, authenticity and originality of the general aviation fleet reliability data index weights, the entropy weight method is used to calculate the weights of 14 indexes. The reliability evaluation analysis of the general aviation fleet is carried out through the variable fuzzy recognition method, so as to obtain the training and testing samples of the general aviation fleet reliability evaluation model.
Variable fuzzy recognition model
Engineering variable fuzzy set theory has been widely used in many fields [15, 16]. Let the index eigenvalue matrix composed of recognition samples be A, which is composed of indexes and sample indexes, the index standard value matrix is B, which represents the standard value matrix obtained by recognizing levels of each index. Due to the different data units, ranges, meanings, trends, and magnitudes of each index, A and B must be dimensioned during fuzzy recognition, and then the dimensionless matrices Q and G are obtained. The equation for dimension-less processing is [17]:
In the equation:@@ x ij is the sample value of the i-th index of the j-th sample, yi1, y ih and y ic are the standard values of the first level, the h-th level, and the h-th level of the index i respectively, q ij is the normalization of the index i corresponding to the sample j value, g ih is the normalized value of index i corresponding to level h.
Let the weight vector of the fuzzy recognition index be w = wij, i = 1,2⋯,n, j = 1,2,⋯,m, satisfy:
Recognize samples according to the established standard value matrix, and establish a variable fuzzy pattern recognition model p as:
In the equation: a j is the lower limit standard value of the j-th sample level, b j is the upper limit standard value of the j-th sample level [18], w i is the entropy weight of each index i, q ij is the relative membership degree of the i eigenvalue of the reliability data evaluation sample j index to the evaluation level, u hj is the relative membership degree matrix of the characteristic value of the evaluation object index i to the index of each level h.
a is the optimization standard parameter, a = 1 is the least square criterion, a = 2 is the least square criterion; is the distance parameter, p = 1 is the Hamming distance, and p = 2 is the Euclidean distance. a and p are called variable fuzzy model parameters, considering the combination of Equation (5) and existing reliability data, there are four performance situations:
When a = 1, p = 1, Equation (5) shows a linear correlation, a = 1, p = 2. a = 2, p = 1. a = 2, p = 2. respectively, Equation (5) shows is a nonlinear correlation, where a = 2, p = 2. Make Equation (5) a quadratic function, so the convergence or exaggeration effect is more severe, showing a strong nonlinear correlation. In actual work, combined with reliability data It has strong nonlinear correlation, so this experimental model uses a = 2, p = 2. to obtain the optimal relative membership fuzzy recognition theoretical model u hj .
Application level eigenvalue model:
Level judgment on fuzzy recognition model results, combined with the judgment criteria:
The methods for determining the weight include expert review method, questionnaire method, and analytic hierarchy process, etc. The defect of these methods is that human subjective judgment cannot be avoided. In order to make the weight calculation objective, this paper chooses the entropy weight method to weight the indexes. The steps are as follows:
(1) Dimensionless processing of data with extreme value method:
In the equation, xjmin is the minimum value of the j-th index in x ij , xjmax is the maximum value of the j-th index in x ij , 0p ij 1.
(2) Definition and calculation equation of entropy weight to calculate entropy:
(3) The entropy weight of the index:
In order to fully consider the reliability evaluation of the general aviation fleet, this paper uses a One-Dimensional Convolutional Neural Network (1D-CNN) to evaluate the indexes [19, 20]. While optimizing the model effect, it also improves the prediction accuracy. By establishing a 1D-CNN model to evaluate the reliability of the general aviation fleet, make a judgment on the reliability level of the general aviation fleet, and timely inspect and maintain the general aviation fleet.
One-dimensional convolutional neural network
Convolutional neural network is a feed-forward neural network that includes convolution calculation and has a deep structure. It is one of the representative algorithms of deep learning. Its structure includes an input layer, a hidden layer and an output layer. The hidden layer designed is composed of two layers of convolutional layer, pooling layer, flat layer and fully connected layer. The structure diagram of convolutional neural network is shown in Fig. 1. For the one-dimensional convolutional layer of layer l, the output result can be expressed as:

Convolutional neural network structure diagram.
In the equation:
The convolutional layer uses the ReLU activation function. For an X array consisting of elements, the ReLU value of the i-th element in the array can be expressed as:
In the equation: R represents the value of ReLU.
The output of the maximum pooling layer can be expressed as:
In the equation:
The output produced by the fully connected layer can be expressed as:
In the equation: w represents the weight, and b represents the bias.
The fully connected layer uses the Softmax function for classification. For an X array consisting of n elements, the Softmax value of the i-th element in the array can be expressed as:
In the equation: S represents the value of Softmax.
The loss function uses the mean square error as the objective function, and its calculation equation is:
In the equation.
Case analysis process
Preprocess the collected general aviation fleet reliability data, analyze according to expert opinions and actual reliability data, select and extract the evaluation characteristic index based on the reliability data parameters of the general aviation fleet. Then, based on the feature selection and extraction results, the entropy weight variable fuzzy recognition evaluation level membership function was constructed, and the 1D-CNN deep learning evaluation model was established and trained and tested. The analysis process is shown in Fig. 2.
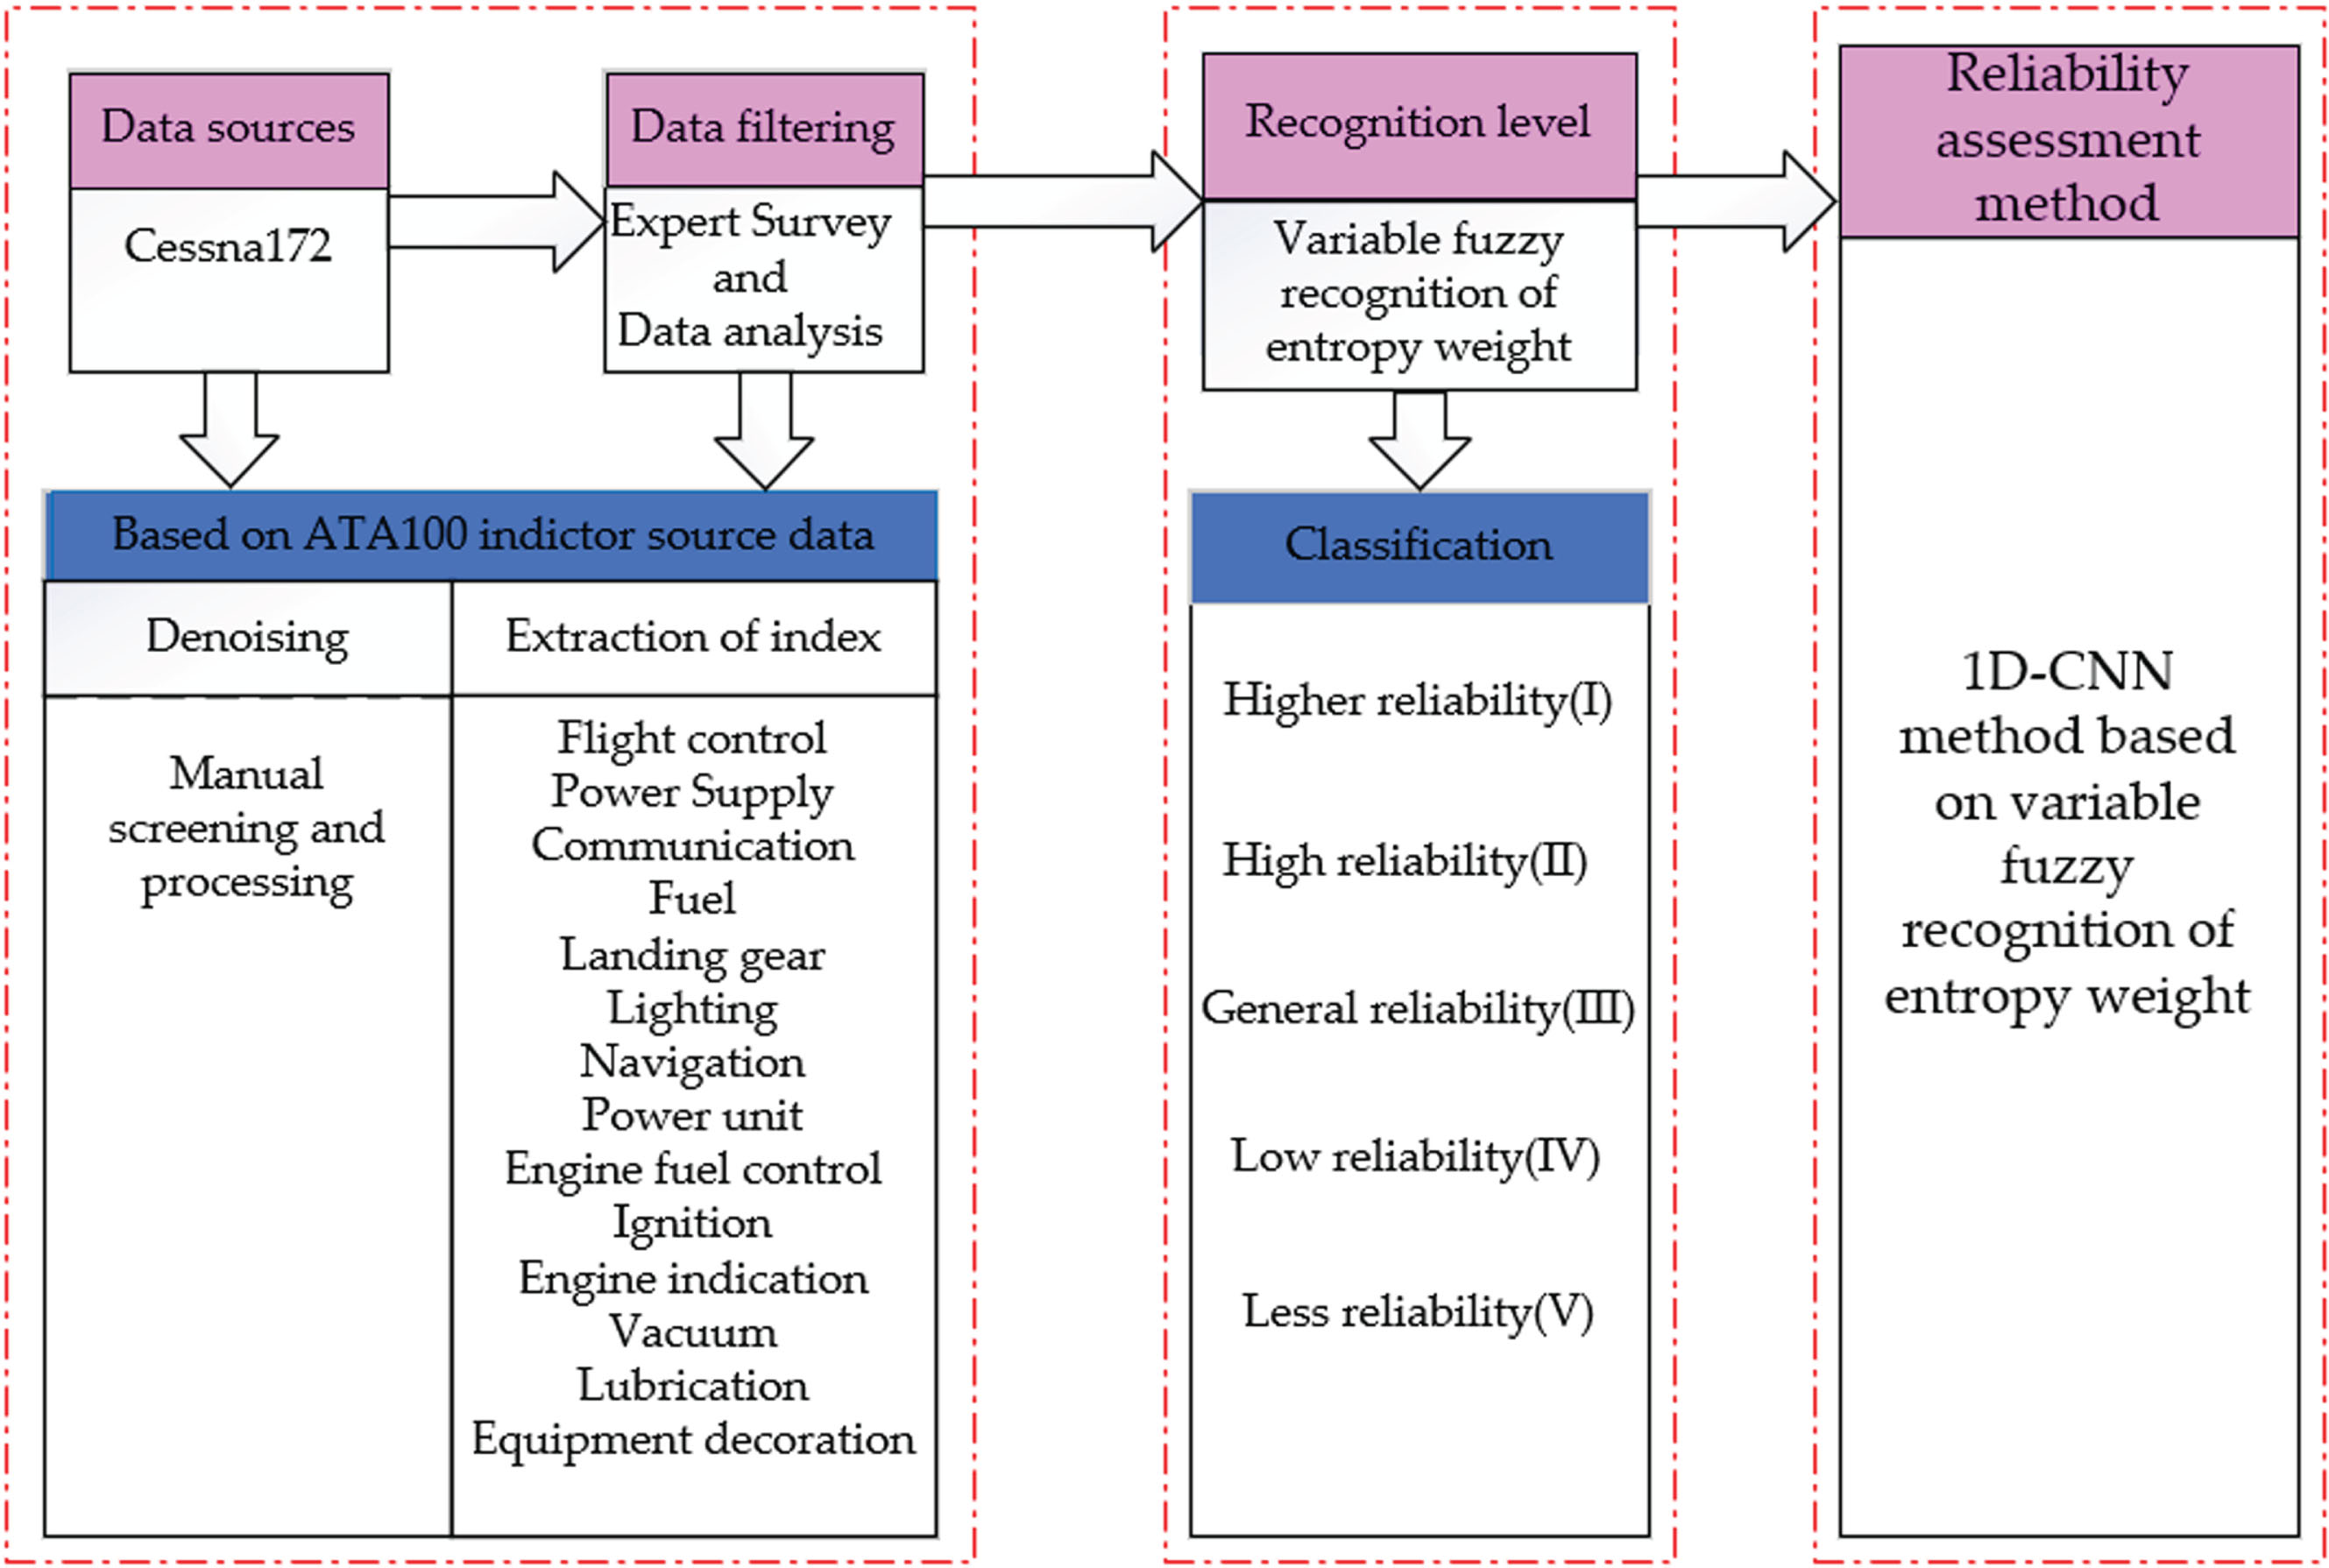
Research framework flow chart.
General aviation fleet reliability is a measurable and controllable overall index used to reflect the safety of fleet operations, including communications, power, flight control, fuel, landing gear, lighting, navigation, power plant, engine fuel control, ignition, etc. factors. The data in Table 1 is compiled from a selection of Cessna172 aircraft failure statistical maintenance reports from a certain general aviation operating unit from 2018 to 2020. First, count the number of reliability index failures reported monthly by each fleet in different locations of the airline, and then use the number of reliability index failures for each fleet in that month as the sample data for this time. Each sample contains 14 index U i (i ∈ {1 … 14}) values, U i is (Chapter 2.2 Index Selection Principles and Specifications) combined with the actual maintenance status of general aviation and maintenance experts’ recommendations to select 14 indexes: such as U1 is fight control, U2 is power supply, etc. The final general aviation fleet equipment reliability data obtained is shown in Table 1.
General aviation fleet reliability evaluation data
The reliability index classification of general aviation fleet shall meet the requirements of scientific, rationality and practicality. Therefore, based on the early warning levels of airline fleet reliability, this paper divides the fleet re-liability indexes into: level I(higher), level II(relatively low). high), level III(general), level IV(low), and level V(less). According to the 3σ principle, the airline fleet reliability early warning index classification standard is established, and the process is as follows:
Assuming X ∼ N (μ, σ), according to the 3σ principle, it can be known that the probability that the value x is distributed in the interval (μ - σ, μ + σ) is about 68.26%, the probability that the value x is distributed in the interval (μ - 2σ, μ + 2σ) is about 95.44%, and the probability that the value x is distributed in the interval (μ - 3σ, μ + 3σ) is about 99.74%. From this, it can be considered that the values of Y are almost all concentrated in the interval (μ - 3σ, μ + 3σ), and the possibility of exceeding this range is less than 0.3%.
(1) Calculate the average μ of each group of index data:
In the equation: μ represents the average value of each early warning index data, σ represents the standard deviation of each early warning index data, and N represents the number of samples.
(3) Calculate the central value of each set of index data:
(4) Adjust the data of each group:
Draw the frequency histogram and frequency distribution histogram of each data index according to Table 1, make appropriate adjustments according to the 3σ principle and combined with expert opinions, and finally obtain the grading standard of the general aviation fleet data index, that is, higher reliability (I), high reliability (II), general reliability (III), low reliability (IV) and less reliability (V). Among them, the first two levels indicate that the reliability of the fleet is qualified and will not affect the operation of the fleet, the general reliability (III) indicates that it is reliable to a certain extent under the circumstances of reasonable inspection, but attention still needs to be paid, the last two levels indicate reliability the performance is not high and needs to be overhauled again. As shown in Table 2.
General aviation fleet equipment reliability evaluation index classification standard
According to the key indexes of the general aviation fleet level evaluation extracted above, combined with the entropy weight method, the variable fuzzy theory is used to calculate and divide the reliability data level of the general aviation fleet. According to Table 1 and Table 2, this paper selects the first 240 samples as training samples, and the last 80 samples as test samples. First, the measurement values of each index (data values in Table 1) are dimensionally processed according to Equation (8). From Equation (2), the normalized matrix of the index standard can be obtained as G = [g] 5×14 (From Table 2, the h-th level standard value y
ih
of each indicator i can be obtained):
The normalized matrix Q = [q
ij
] 300×14 of general aviation fleet reliability can be similarly obtained from Equation (1). Detailed data steps are omitted in this article. Then, according to Equation (8–11), the weight of the index can be obtained. From Equation (11), it can be seen that the sum of each index is 1, and the weight assigned to each index is close to zero. the index weight is determined as:
Then, according to the relative membership degree of the sample in Equation (4), the relative membership degree matrix U is obtained.
The fuzzy recognition model is calculated according to the level eigenvalue Equation (6), and the reliability of the general aviation fleet is evaluated based on the values of each H j (j = 1, 2, …, 10) combined with the judgment criterion of Equation (7). Finally, based on the above calculations, it can be seen that the state recognition results are shown in Table 3. According to Table 1 (data) and Table 2 (evaluation index classification standard), calculate the level of the evaluation value of the training sample in Table 3 under each index. The value under “result” represents the membership level of each sample.
General aviation fleet reliability status recognition result
General aviation fleet reliability status recognition result
Select 1D-CNN as the evaluation prediction model for training and testing. In order to shorten the training time, first normalize the sample values:
In the equation: Y
i
,
Its general aviation fleet reliability sample data level recognition model evaluation training and testing loss degree is shown in the Fig. 3. The loss curves of the training set and test set show a clear downward trend in ten iterations. This shows that the model gradually reduces prediction errors during the learning process and fits the data better. There is no significant difference between the loss curves of the training and test sets, indicating that the model performs similarly on the training and test sets. This shows that the model has good generalization ability and can handle new data. The model has an excellent loss reduction trend under the 1D-CNN architecture, has good convergence, has high generalization ability, and has high accuracy of use in practical applications, and can be used for the recognition and evaluation of reliability levels.
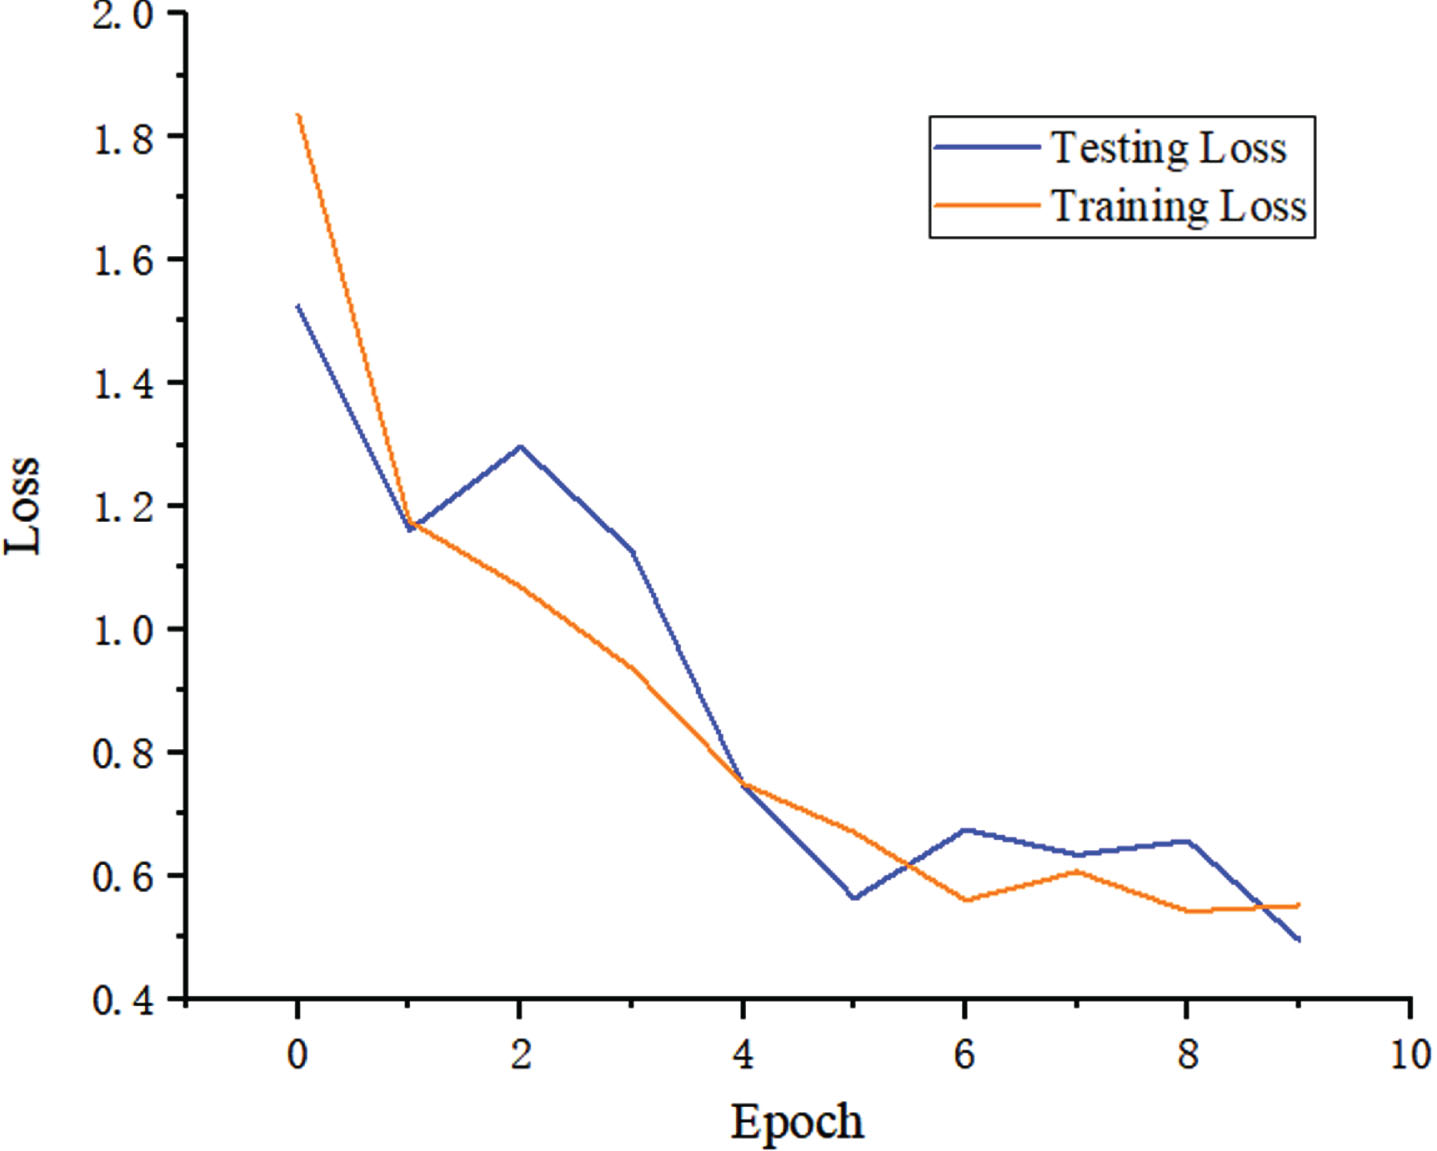
General aviation fleet reliability sample data level recognition model evaluation training and testing loss degree.
Natural language processing generally uses precision (Precision), accuracy (Accuracy), and recall (Recall) as the commonly used criteria for judging the quality of models, and accuracy is the most widely used in judging the results of multi-label pre-diction models. the accuracy rate is used to judge the effect of different prediction models. Comparing the 1D-CNN model with Support Vector Machines (SVM) and fully connected neural network models. Randomly select 80 samples as the test set, conduct 10 experiments on different models, and calculate the accuracy rate on the test set.
As shown in Fig. 4, the accuracy of the 1D-CNN model is higher than that of the fully connected neural network and SVM. the 1D-CNN model shows relatively stable accuracy during ten iterations. This shows that the model’s prediction accuracy for general aviation reliability status recognition results can maintain a relatively consistent performance level in multiple iterations.
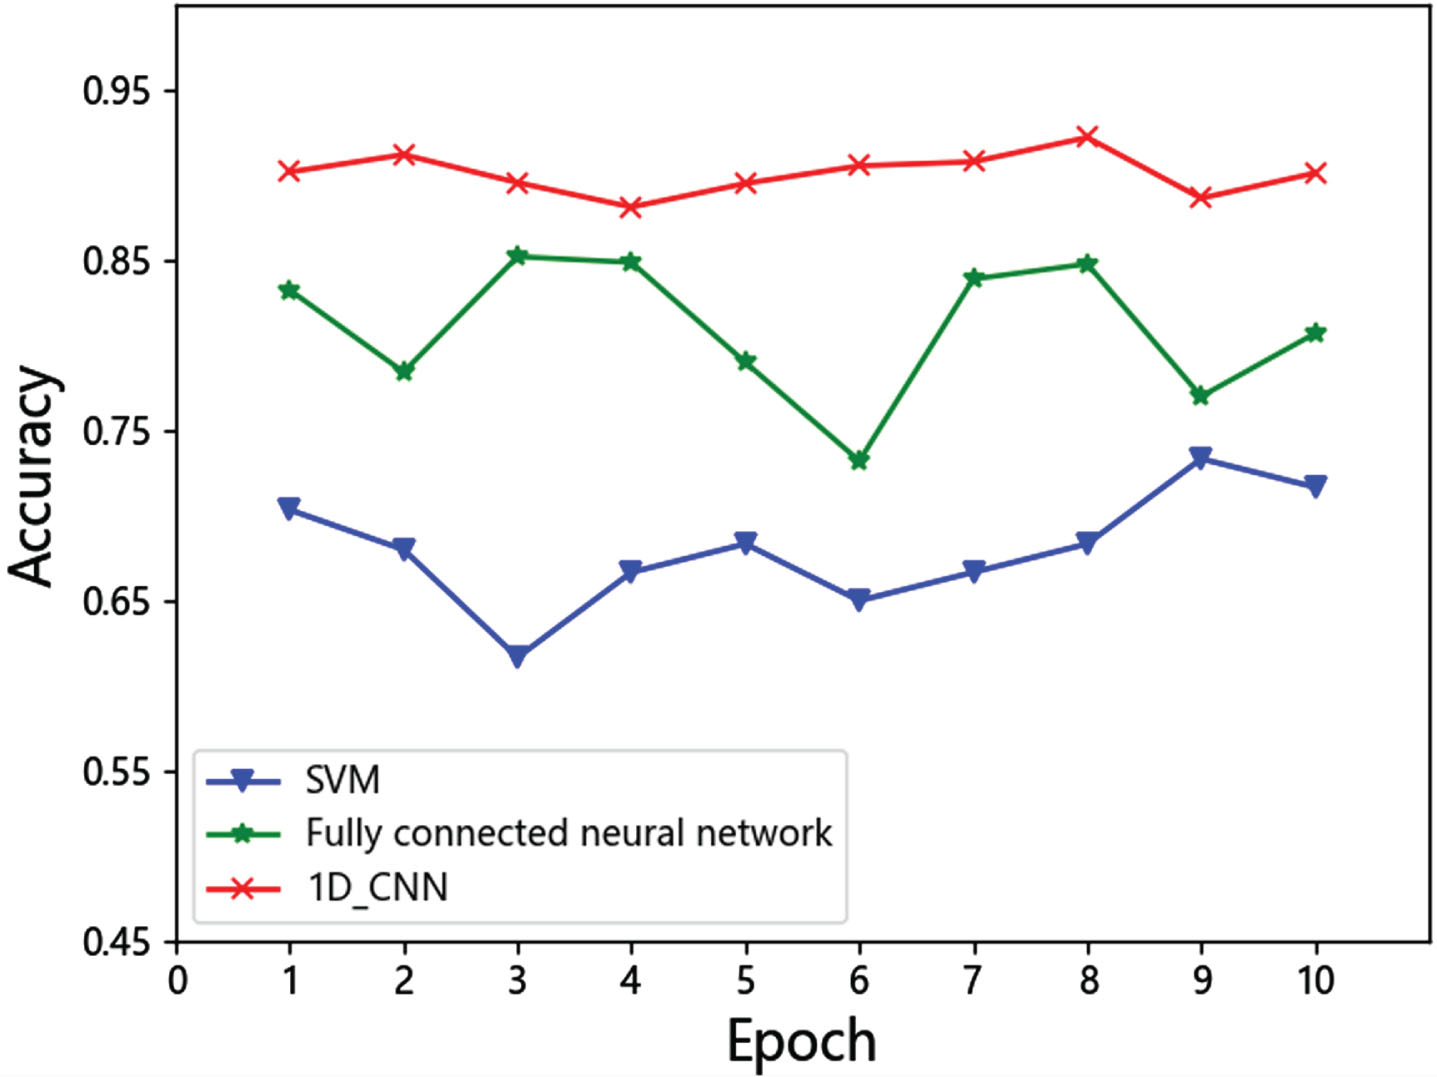
Accuracy change comparison chart.
The accuracy of the full neural network and SVM models showed large fluctuations in the process of ten iterations. This shows that these two models are more sensitive to data training and require more iterations or hyperparameters to stabilize their performance.
Combined with the 1D-CNN network structure designed in this experiment (Fig. 1). Multiple convolution kernels in the convolution layer can be used to detect different characteristics of general aviation reliability data. The pooling layer is used to reduce the dimensionality of reliability data and reduce computational complexity. Its fully connected layer handles the complex relationships between learning data. Combining these advantages of processing data, 1D-CNN performs well in sequence data processing, and it can effectively extract local and global features in the data. For general aviation data, this can help models capture key characteristics of flight reliability, such as anomalies, trends or patterns. The 1D-CNN model showed significant advantages in average accuracy, reaching an average accuracy level of ninety percent. This shows that the 1D-CNN model has high recognition accuracy when dealing with the task of general aviation reliability status recognition results. This model can better capture the characteristics and relationships in the data, has strong generalization ability, and is suitable for evaluation and prediction of general aviation reliability status recognition results. These innovations make the 1D-CNN model effective and applicable in this task.
The model is trained and tested from randomly screened samples, and compared with the results of the Support Vector Machine model and the fully connected neural network model, through the comparison and analysis of the reliability recognition of the model evaluation and the actual grade category, it can be seen that the accuracy rate of 1D-CNN is high, and the accuracy rate of the sample reaches 91.95%. The 1D-CNN has a more powerful feature learning ability. From the graph analysis and final evaluation results, it can be seen that the constructed model is accurate and efficient for general aviation fleet reliability evaluation, so 1D-CNN can be used for general aviation aircraft fleet reliability evaluation.
Conclusion
With reference to the relevant requirements of current civil aviation regulations and reliability advisory circulars, establish a general aviation fleet reliability evaluation index system, select 14 reliability indexes in fleet operation equipment maintenance, and rely on the data to establish a leveling standard for general aviation fleet equipment reliability evaluation. The entropy weight method is used to determine the weight of each reliability index, and the variable fuzzy recognition method is used to establish the status level membership function of the index, and the relative membership degree is obtained, and the corresponding state level of the sample reliability data is determined. 1D-CNN deep learning model is used to evaluate the reliability, as the number of iterations of the model increases within a certain range, the accuracy of training and testing of data samples is higher, and the loss of model training and testing is lower. It can be seen that the accuracy and application of the model are strong, which proves the feasibility of the general aviation fleet reliability evaluation model, providing reference for the general aviation fleet reliability evaluation.
Based on the establishment of the general aviation fleet reliability evaluation index system and the application of the 1D-CNN deep learning model, there are the following suggestions and areas for further research: Integrate other data sources: Consider integrating other data sources, such as sensor data, maintenance logs, and environmental factors, to enhance the model’s predictive capabilities. This provides a more comprehensive understanding of equipment reliability and enables predictive maintenance.
Regulatory Compliance: Ensure that the developed reliability assessment models comply with evolving civil aviation regulations and advisory circulars. Stay abreast of regulatory changes and adjust models accordingly to ensure compliance and safety standards.
Human Factors and Training: Examining the role of human factors in general aviation fleet reliability. Develop training programs and protocols to enhance the human element in maintenance operations as it plays a critical role in overall reliability.
Continuous Improvement: Committed to continuous improvements in reliability assessment methods, data collection techniques, and modeling methods to stay at the forefront of general aviation safety and reliability.
In conclusion, establishing a general aviation fleet reliability assessment model is an important step in improving safety and operational efficiency. Future research should focus on refining and extending the model, aligning with regulations, and addressing emerging challenges in the field to further improve the reliability and safety of general aviation operations.
Footnotes
Acknowledgments
This work was supported by the National Natural Science Foundation of China (No.U2033202), Key R&D Project of Sichuan Provincial Department of Science and Technology (2022YFG0213); Civil Aviation Administration of China Safety Capability Fund Project (ASSA2022/17);Civil Aviation Flight Technology and Flight Safety Key Laboratory Open Fund Project (FZ2022ZX09).