
Abstract
Background:
Due to rapid progress in the fields of artificial intelligence, machine learning and deep learning, the power grids are transforming into Smart Grids (SG) which are versatile, reliable, intelligent and stable. The power consumption of the energy users is varying throughout the day as well as in different days of the week. Power consumption forecasting is of vital importance for the sustainable management and operation of SG.
Methodology:
In this work, the aim is to apply clustering for dividing a smart residential community into several group of similar profile energy user, which will be effective for developing and training representative deep neural network (DNN) models for power load forecasting of users in respective groups. The DNN models is composed of convolutional neural network (CNN) followed by LSTM layers for feature extraction and sequence learning respectively. The DNN For experimentation, the Smart Grid Smart City (SGSC) project database is used and its energy users are grouped into various clusters.
Results:
The residential community is divided into four groups of customers based on the chosen criterion where Group 1, 2, 3 and 4 contains 14 percent, 22 percent, 19 percent and 45 percent users respectively. Almost half of the population (45 percent) of the considered residential community exhibits less than 23 outliers in their electricity consumption patterns. The rest of the population is divided into three groups, where specialized deep learning models developed and trained for respective groups are able to achieve higher forecasting accuracy. The results of our proposed approach will assist researchers and utility companies by requiring fewer specialized deep-learning models for accurate forecasting of users who belong to various groups of similar-profile energy consumption.
Keywords
Introduction
The advancements in different fields such as artificial intelligence, machine learning, deep learning, distributed energy resources (DER), data analytic, advance metering infrastructure (AMI), and information and communication technologies (ICT), the traditional power grids consisting of dumb poles and transmission wires are evolving towards intelligent, smart, sustainable and reliable smart grids (SG).
With the fast penetration of DER into existing power systems, the electricity generation as well as consumption are changing based on variations from time to time, week days to week end days, weather variation, seasonality and user’s lifestyle. The prediction of electricity generation from the installed DERS and the short-term power load forecasting of energy customers is of vital importance for sustainable management and operation of SG [1].
The short-term power load forecasting of individual energy users is challenging as compared to that of the aggregate power load of a smart community due to high unpredictability/uncertainty based on varying social demands and lifestyles. With the recent developments in machine/deep learning, data collection through AMI, and the availability of high computing platforms, the short-term power load consumption of individual households can be predicted accurately.
This is helpful in reducing the mist-match between power generation and the demand of a smart community, which is essential for an advanced and sustainable society/community [2].
The proposed clustering-based forecasting scheme along with the conventional centralized and distributed forecasting schemes are graphically shown in Fig. 1. Part (a) in Fig. 1 presents the centralized forecasting approach, which has been the subject in numerous recent studies such as [1, 5]. The part (b) in Fig. 1 presents the forecasting at the edge i.e. at the customer level, where every customer have its own forecasting model, which is targeted in various recent studies including [21, 22]. The part (c) in Fig. 1 presents the proposed clustering-based forecasting scheme, which has also been targeted in numerous recent studies [5, 14]. The information from energy users to cluster head is depicted in Fig. 2.
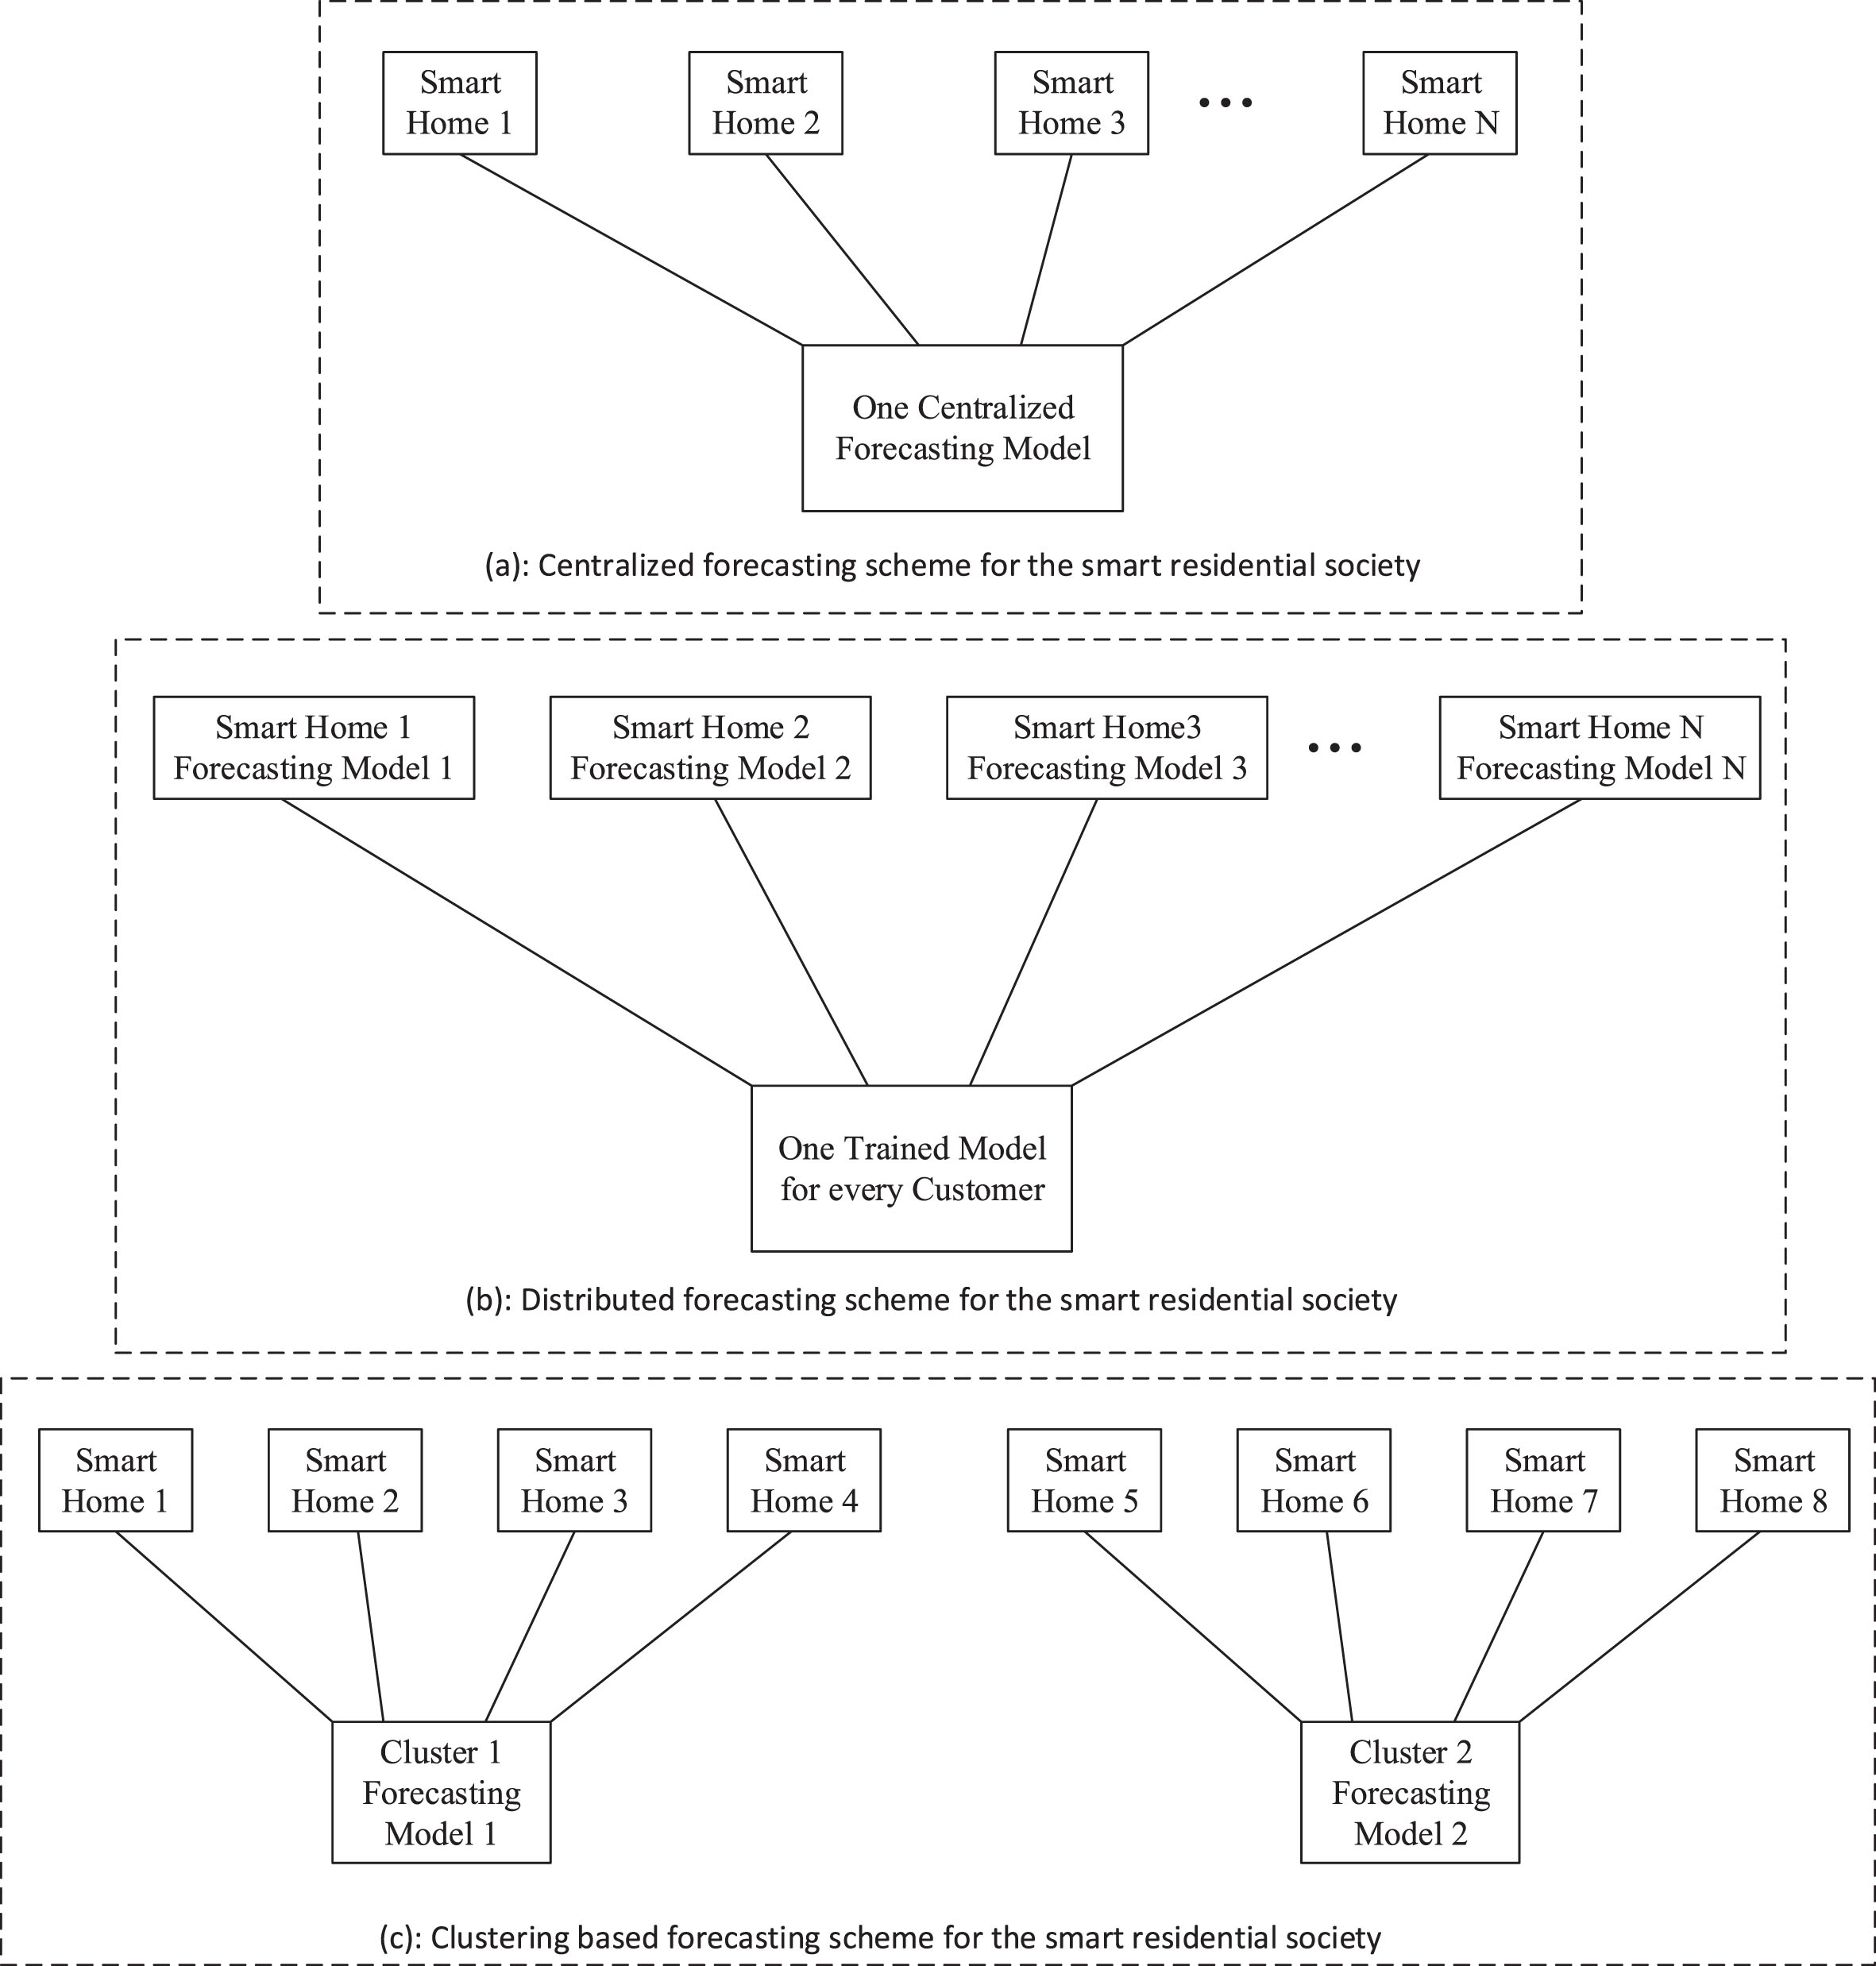
The block diagram of conventional and proposed forecasting schemes.
Information flow from users to cluster heads.
Short-term power load forecasting is highly important and is helpful for the maintenance, administration, sustainability, and daily operations of smart grids. We know the limitations of the storage capacity of all the various forms of energy generation, which are difficult to push further. It requires us to ensure a fair balance between electricity demand and generation [3].
The energy utilization can be enhanced/optimized by developing an opportunity for a two-way communication paradigm between consumers and utilities as well as using advanced forecasting models, which in turns will assist in enhancing the operation and managements of the power system [4–6].
For efficient and effective scheduling of power activities, we need to develop efficient and reliable machine learning models for accurate prediction of the power load and generation. The development of efficient strategies for power consumption in a large community are vital for the planning, management and operation of the power grid. Furthermore, the evaluation metrics in terms of error metrics have significant impact on dynamic state estimation, safety checks and power grid’s load transmission [7]. To assist in running and planning the power system, the utility company rely on the performance of the machine/deep learning based forecasting models for power generation from DERs and power load of the end energy users.
It is worth mentioning here that after a thorough literature review, it was observed that in all the group-based forecasting studies including [5, 14], the aim has been on improving the forecasting accuracy by aggregating the individual forecast of the group/cluster. The aggregation filters the outliers in the consumption behavior of the users in any residential community, which is worsening the situation for grid sustainability. Nonetheless, to the best of my knowledge, there is no attempt where the energy customers are grouped based on their consumption behavior (outliers) and then deep learning models are trained on the combined historical data of the group members.
It is to mention that this approach will further enhance the forecasting accuracy of each group member (energy customer). Additionally, compared to [21, 22], and other similar fully distributed forecasting approaches (forecasting at the edge), fewer deep learning models are required for the whole residential community.
Initially, based on the power load data, the users are grouped into clusters using the DBSCAN algorithm. The power load data of the users within a cluster have high similarity (follow similar pattern), but it is highly dissimilar to load data of users of any other cluster. In each cluster, there is a server, where a deep learning model is trained on historic power load data of user of this cluster. For grouping the energy users into clusters based on their energy consumption patterns (behavior), first the DBSCAN algorithm is applied on historically collected data of a pool of sixty nine customers (user having water heating system installed).
Initially, clustering was performed on power load data collected over a period of three months (92 days) to find similar consumption patterns. Then, deep learning was developed and trained based on data of each group. This was followed by an analysis on the actual data and the predicted data based on the specific trained model of each cluster.
In a centralized approach, all the energy users are connected to a server and transfer their data to it, which is depicted in Fig. 1(a). On the other hand, in distributed approach, one DL model is trained and available for forecasting each users power consumption, which is depicted in Fig. 1(b).
The contributions of the paper are given below
The pool of electricity consumers are separated into various clusters based on a criterion of having similar appliances in the used data set of Australian government project named as Smart Grid Smart City (SGSC). The DBSCAN clustering technique is used for finding the major and minor clusters as well as the outliers in historical electricity consumption data (daywise for 92 days) of the used subset of SGSC dataset. The major clusters and the outliers are most important, which are analyzed systematically. Then, a strategy for grouping the customers into various groups based on their consumption value as well as the consumption behavior (outliers) is proposed and evaluated. The historical power load data of the separated groups is used for training respective deep learning models and for forecasting the power consumption of users from each group.
Based on the achieved results, it can easily be concluded that the proposed approach not only aids in reducing the requirement of the number of trained models but also achieved competitive forecasting results.
The remaining article is planned in the following way. The literature review is provided in section 2. The material and methods are presented in Section 3 which include description and formation of the feature vector and the details of the proposed approach for clustering the energy users into various groups. The experimental results are presented in Section 4. Section 5 presents detailed discussions about the different obtained results. Lastly, Section 6 provides the conclusion of the work.
The power load forecasting of the energy users and power generation forecasting from distributed energy resources (DERs) are hot research areas, which have attracted substantial attention of funding organizations and researchers. Usually, the traditional data mining and analysis approaches are used for forecasting purposes, which include statistical methods and time-series-based methods. With the significant development in artificial intelligence (AI), machine learning, deep learning, data analytic, big data, advance metering infrastructure (AMI) and Graphical Processing Units (GPUs), researchers started to explore these approaches for the advancement in energy sector, which assisted in transforming the traditional grids into advanced, intelligent and stable smart grids (SG).
Accurate power load forecasting enables the energy users to gauge their consumption and reduced energy-cost by shifting usage of various daily appliances to suitable timing across the 24 hours period. The development of efficient deep learning models for power load forecasting of individual energy users provides them with an opportunity for adjusting their current and future energy costs based on appliance usage shifting to off-peak hours. This result in an environment where the energy user can apply the developed models for keeping track of their energy usage and adjust it accordingly, which help them manage their energy costs.
The energy users have a key role in responding to the requests from utility companies for ensuring the reliability, management, sustainability, and nicking of the SGs. The energy users can be grouped into; residential, industrial, and commercial groups. A significant portion of the produced energy is consumed in the residential sector, where the smart meters installed are highly helpful in the projection and monitoring of the short-term power load of energy users [8–10].
The aggregate (combined) load forecasting of a residential community is relatively easier, which has been explored in numerous studies [8–12]. The researchers in these studies adopted different approaches for aggregate load forecasting. The aggregate load forecasting at the community level is effective for long-term planning but is not useful for the short-term analysis, planning, and management of the SGs (daily or weekly basis). For numerous reasons such as bill reduction, user comfort, avoiding power outages as well as planning and management of the SGs, load forecasting at a fine-granular level i.e. short term power load forecasting of individual energy users in a smart community is essential.
We have reviewed the literature thoroughly and found that numerous models have been developed by various researchers for forecasting the short-term power load of the end user [11]. Unfortunately, most studies and explorations by different researchers mostly deal with the forecasting of aggregated load at the community level and very few researchers addressed the forecasting of individual households [12, 15].
In our recent work in [5] and also the work by the authors of [14], we have grouped the energy customers into various clusters based on similarities in their power consumption patterns. But the scope of that exploration was limited to an analysis of grouping the energy customers based on the historical values of their power consumption only.
In principle, there could be customers who’s daily power requirement is significantly varying compared to other members of the society based on their social status, affordability and lifestyle. This means that the outliers in the historical power consumption data must be given equal consideration, which will help us in grouping customers with similar consumption behavior and not just consumption value. So, consumption behavior in addition to historical consumption values should be given equal importance. In return, it will assist the residential society to have a reliable and stable electricity system.
There are many machine learning models, that can be selected for the implementation of the DNN, where each has numerous advantages and disadvantages. Various researchers have adopted different approaches and configurations for the exploration and implementation of deep neural networks (DNN) for the tasks of power load forecasting of individual users and power generation forecasting of the DERs.
The short-term power load forecasting of individual household energy users in a residential community is challenging as compared to that of the aggregate power load forecasting of the whole residential community. This is due to the high unpredictability and uncertainty in the power consumption behavior of end energy users based on their varying social demands, priorities, affordability and lifestyles.
The authors of the work in [10] explored the individual household forecasting based on the expediency of a time-series, where the evaluation is based on the root mean square error (RMSE). The authors [11] proposed a short term power load forecasting method, which is mainly based on an early classification technique and a stochastic method to pre-determine the consumption pattern for forecasting day. Furthermore, they developed a hybrid multistep method by adding the strengths of both recursive multistep and single step forecasting. They validated the effectiveness of their developed framework through a case-study by applying it on real world data collected from smart meters.
The researchers in [12] investigated the use of neural networks and ARIMA for power load forecasting with a time-horizon of fifteen-minute to twenty four hours. They trained and tested their developed approach based on two data sets containing historical power load data six and one household from USA and Germany respectively. They obtained average MAPE of 85 percent and 30 percent for the data sets from USA and Germany respectively.
The prediction of household level power load was also explored by authors in [13], which is based on applied Kalman filter technique. Their developed approach is valid for forecasting over multiple sampling-intervals and time-horizons. They achieved a balance between execution time and accuracy by varying the sampling-rate.
The ANN and SVM based approaches were adopted by the authors in [15], for power load forecasting based on historical high-resolution data collected over a period of thirty days from three smart homes. They explored the impact of data collected from smart meter in the AMI infrastructure for forecasting short term power load of the end energy user. They verified that the large data collected through smart meter in AMI infrastructure substantially assisted in enhancing the power load forecasting accuracy. But, they mentioned that the achieved better forecasting accuracy is at the expense of better computational resources. For predicting the peak user demand, the authors investigated various combinations of the models. They explored that for individual user level prediction, the historic-peak power load and occupancy are more important features than external temperature and season.
The authors in [16] developed Neural network model ensembles for building-level electricity load forecasts while the authors [17] applied long-short-term-memory based recurrent neural network for Electric load forecasting in smart grids. The authors [18] performed a rigorous data analysis of data obtained from smart meter for identifying the source of variations in the consumption behavior of end user. They used this analysis of behavioral characteristics for selecting appropriate clustering method and for setting its parameters. They extracted these behavioral features from time-series consumption data and applied it for clustering based on a Gaussian mixture modelling technique. They executed their developed clustering method on a real-world power consumption database from Slovenia with a pool of 5038 end energy users.
The authors of [19] developed an efficient energy management approach using fog-as-a-service for sharing economy in a smart grid. The authors of [20] developed jaya-long short term memory (jlstm) model for electricity load and price forecasting in smart grids, The authors in [21] proposed and evaluated an LSTM-based neural network model for forecasting power load of individual customer by considering the appliance consumption sequences. They demonstrated that the forecasting accuracy can be enhanced when the appliance-level consumption data is included in the training of the developed model. in their latest study in [22], they extended their experiments of individual customer-level forecasting, by considering more machine learning models for comparison. In this new study, they achieved comparatively better forecasting accuracy with LSTM-based model compared to all the other machine learning models.
Among all the above studies for individual customer level short term power load forecasting, the results obtained by [22] are most prominent and are comparable with ours ones, as they have used the same database i.e. SGSC project [13], which we have also used in current study. But their adopted approach for load forecasting of individual household is practically not feasible due to the requirement for a trained model for every single power user in a smart community. At the other extreme is the other approach where one model is trained and used for all the users in a residential community. Such an approach is not effective due to the large variations in power consumption patterns of different users attributing different social status and lifestyles.
The authors in [24] developed and evaluated quantile regression averaging (QRA) for a set of sister point i.e. individual-level forecasts for determining probabilistic load forecasts. They stated two advantages of their approach: First is leveraging the point-load forecasting literature for PLF and the second is that it does not rely on high quality expert forecasts. They achieved significantly better results both in terms of the Winkler score and the pinball loss function as compared to several benchmark methods. They also mentioned in their article that the PLF literature is very limited and very few state-of-the-art studies exist for comparison purposes. Furthermore, probability load forecasting is applied for long-term planning and operation of the SG, which is not the focus of the current study.
The authors in [25] explored a day ahead power load forecasting method based on characteristic load decomposition for a complex, which contains both residential and non-residential buildings. In their developed method, the complicated power usage patterns are clustered based on their characteristic load profiles and aggregated load of the complex is decomposed into various clusters. They developed a hybrid forecasting model for predicting cluster level sub-load, which are combined for predicting the aggregated load of the complex. Their developed approach is significantly different then the work in current exploration, as their aim is for aggregate power load forecasting using a hybrid approach, by first predicting cluster level load, which is then combined for predicting the aggregate load.
The authors in [26] targeted their efforts for enhancing the daily basis system level power load forecasting, where they applied clustering for identifying groups of end users having similar power load consumption behavior. They used the data collected from smart meters for clustering analysis and for system-level power load forecasting. They applied the strategy of ”clustering to group customers having similarity in consumption behavior” for enhancing the system-level power load forecasting. They demonstrated that how the clustering of individual-level power consumption data can be used for enhancing the system-level power load forecasting of the entire system. There is a big similarity between their approach and ours, which is clustering the energy customers into similar-consumption groups. The only and big difference is that their focus has been improving the system level power load forecasting. While the aim of the current work is on clustering the similar-energy customers into groups, as an attempt to reduce the overall complexity of the system.
The authors [27] developed a systematic approach for customer load classification based on characteristic attributes in frequency domain (CAFD. The CAFDs are achieved by applying a data mining algorithm known as classification and regression tree (CART). The CAFDs represents the signatures for customer classes and subclasses. They provided detailed analysis and testing, through which they proved improved performance for their developed approach for the case power load profile classification.
The authors in [28] explored a novel Probabilistic load forecasting (PLF) method for leveraging the point-forecasts by modeling conditional forecast residual. They developed a method, where the point forecasts are determined based on historical power load data, which is then used as a feature for describing conditional distribution of residual on point-forecast. In the last stage of their developed method, they used the conditional distribution of residual along with the point-forecast for determining the output probabilistic forecast. Through various experimental analysis, they successfully proved/revealed the relation between the accuracies of the probabilistic forecast and the point-forecast. Unfortunately, the focus of the whole study has been on power load forecasting of the eight zones and their aggregate load.
The authors in [29] developed a comprehensive mechanism for long term individual-level (termed as retailer) power load forecasting for feeding it into the conservative trading strategy. They divided the individual level load forecasting into two sub-problems, which is the forecasting for load per customer and tenured customer. The regression and survival analysis are applied for both the load per customer and tenured customer forecasting. Their developed solution is applied at a retailer in the USA, which achieved significantly better performance in terms of MAPE of hourly, daily and monthly energy demand. The author claimed individual customer level forecasting, but in their experiments, they performed forecasting the aggregate load of a zone and then divided it into the number of active customers, which is in contradiction to the scope of the current study.
The focus of the study in [30] has been on variable selection as a measure for enhancing the forecasting of the PLF. They adapted a holistic approach, a seemingly more accurate technique for variables selection based on probabilistic error measures. Although, the adapted holistic strategy for variable selection is computationally more complex compared to its counterpart but it is not an issue due to the fact that higher computing power are cheaply available. The performed an empirical study on data from seven states of USA, where they suggested that the variables selected using holistic approach are different from those selected through heuristics approach. The work is concentrated on variable selection for enhancing PLF, which is not the focus of the current exploration.
The authors of [31, 32] developed different deep-learning based models to enhance the prediction of piRNAs and their function using. They used numerous feature extraction algorithms to deliberate both structure and physicochemical information of the biological structures. The authors of [33] developed deep neural network based classifier for accurate prediction of diabetes in an early stage.
The authors [9] developed a clustering method for segmenting consumers into groups and obtained their typical load patterns using diurnal load profiles. Initially, they applied discrete wavelet transform (DWT) for extracting characteristic load features from the daily power load data. Then, the extracted features were reconstructed by applying a combination of statistical approach along with correlation coefficient and principal component analysis (PCA) for dimensionality reduction. Finally, they evaluated three clustering methods for selecting the suitable method to be applied for segmenting daily power load profiles. Through extensive experimentation on the power load dataset (Manhattan), they concluded that DWT along with the selected clustering method resulted in enhanced clustering performance.
From all these recent studies and investigation, it is evident that a lot of focus has been given to developing effective strategies and models for customers power load forecasting, in order to provide benefits to all the involved stake holders. Furthermore, all these previous investigations can be grouped into three categories i.e. centralized with forecasting model at server, fully distributed with forecasting model at the edge (one model per node) and cluster-based approach. It must be observed that very little work has been done on the cluster based approach, where mostly models are developed for segmenting the power load profiles rather than the electricity customers. Nonetheless, to the best of my knowledge, there is no attempt where the energy customers are grouped based on their consumption behavior (outliers) and then deep learning models are developed and trained on the combined historical data of the group-members. I believe that this approach will further enhance the forecasting accuracy of each group member (energy customer). Furthermore, compared to [1, 22] as well as other similar forecasting approaches, fewer deep learning models are required for the whole residential community. These fewer model (one model per cluster) will be more expert at forecasting power load of individual customer of their cluster, as they are trained on the historical data of all these customers in the group.
The current analysis is such an attempt and will assist the researchers to apply a more wider strategy and make few groups of customers in a residential society based on their consumption behavior (using outlier analysis) in addition to absolute consumption value. This is a more practical and feasible approach for ensuring the interest of utility company and stability of the smart grid and at the same time provide benefits of cost reduction and comfort to the end energy user. The insights of such studies can improve our understanding, which in turn will assist in providing awareness to the residential energy users. The overall impact will be a stable, intelligent and reliable power system, which is essential for today’s society.
Materials and method
The database used and the proposed methods are elaborated in this section.
Dataset used and Feature Vector Formation
For exploring the impact of proposed strategy of clustering on the stability and reliability of power system of a smart community, we have used the real world historical power consumption data, which has been collected in an Australian Government project termed as Smart Grid Smart City (SGSC) [13]. For electricity usage analysis of end energy user in smart community, the data collected in this project (SGSC) is a good and reliable source as it has historical energy consumption data for 10,000 energy users in a smart community in Australia.
Pre-Training
For our proposed analysis, from whole database of 10,000 energy users of SGSC project, we have separated the users who own hot water system. We applied this selection criterion for separating a reasonable number of similar status energy users and extracting their consumption data, which can be efficiently used for training and testing of the developed deep learning model. Based on the selected criterion for separating our intended energy users and their historical consumption data from the whole set of 10,000 customers, we obtained the data of 69 individual energy users who own hot water system. The process of separating the pool of 69 energy users is shown graphically in Fig. 3.
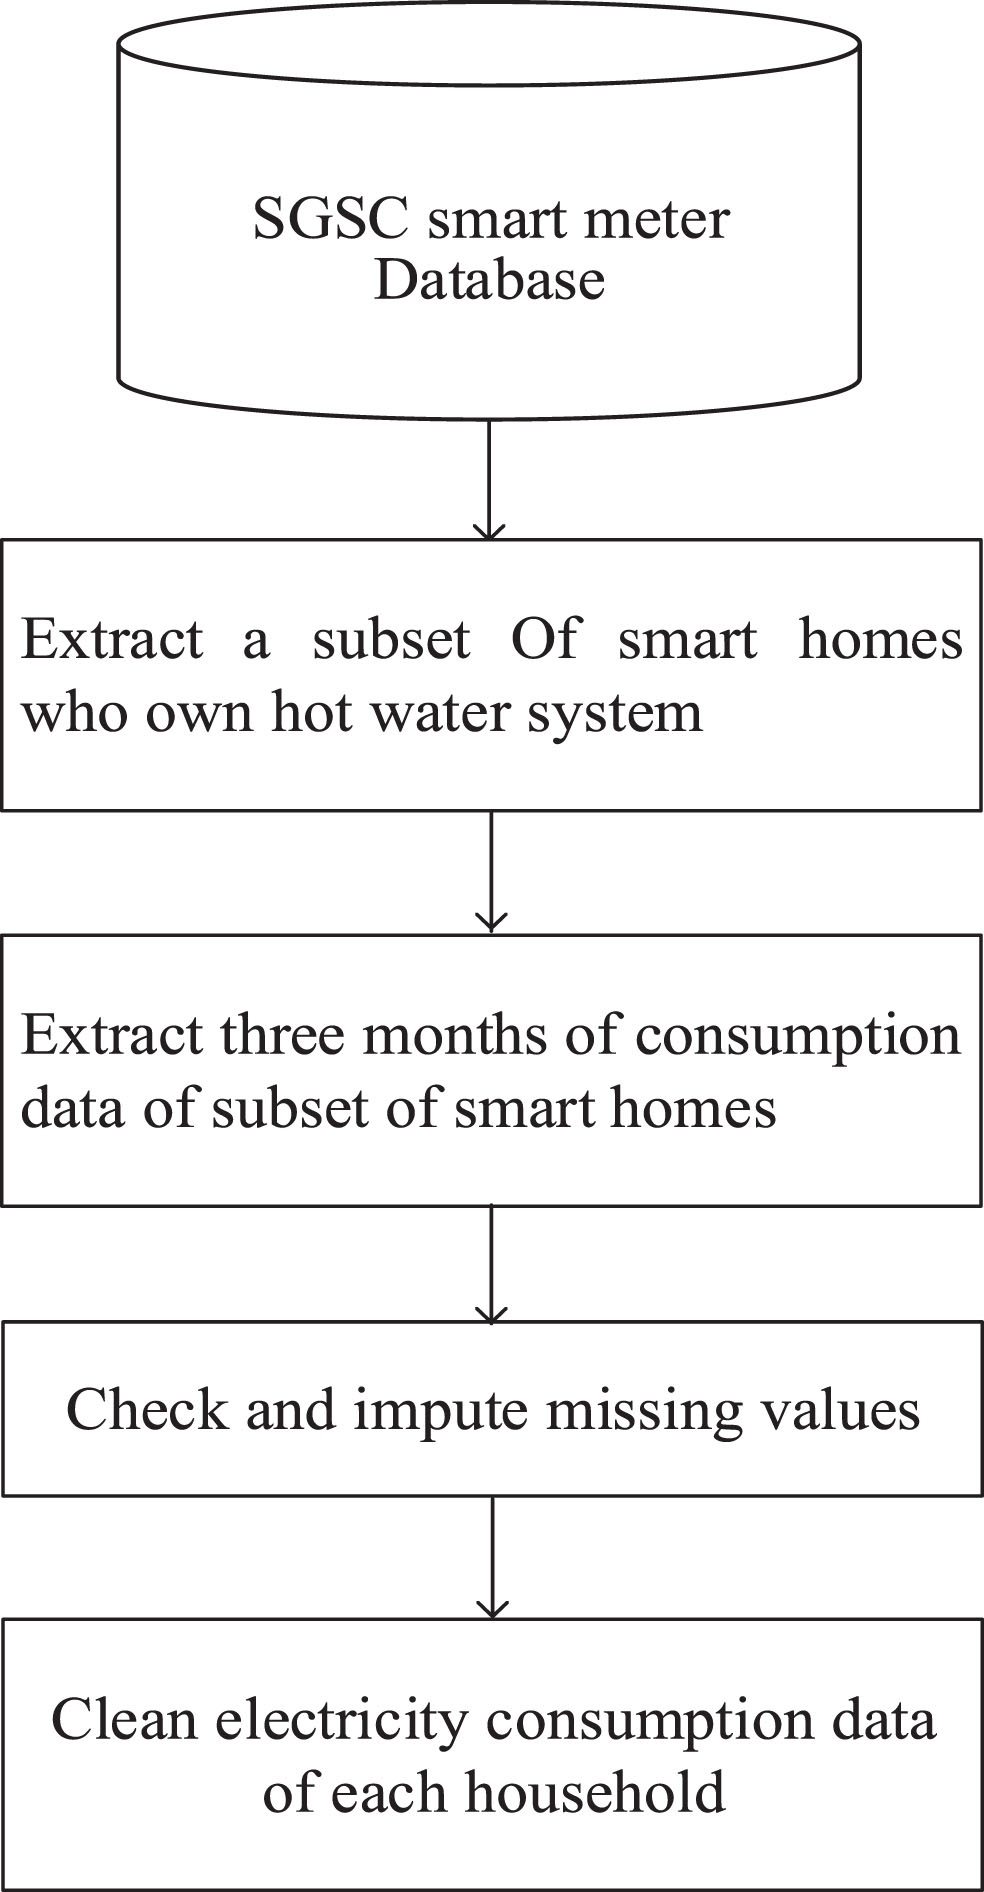
The separation process of sixty-nine energy users who own hot water system.
Generally, the variations in electricity usage in a smart community at aggregate level are low and hence easier to forecast. But at individual energy user level, the power consumption varies a lot and lacks the obvious consumption patterns due to which it is difficult to forecast. There are many reasons/variables which impacts the power consumption behavior of the individual energy user that include variations in the weather condition, variation in time, week, months, season, user-lifestyle and affordability. These different attributes have different impact on consumption behavior of energy user. We have combined the available features in the historical data for making the feature vector, which is shown in Fig. 4. The feature vector formed in Fig. 4 will be applied in the proposed method for clustering energy user into various groups based on their energy consumption value (intensity) and behavior (using outlier information).
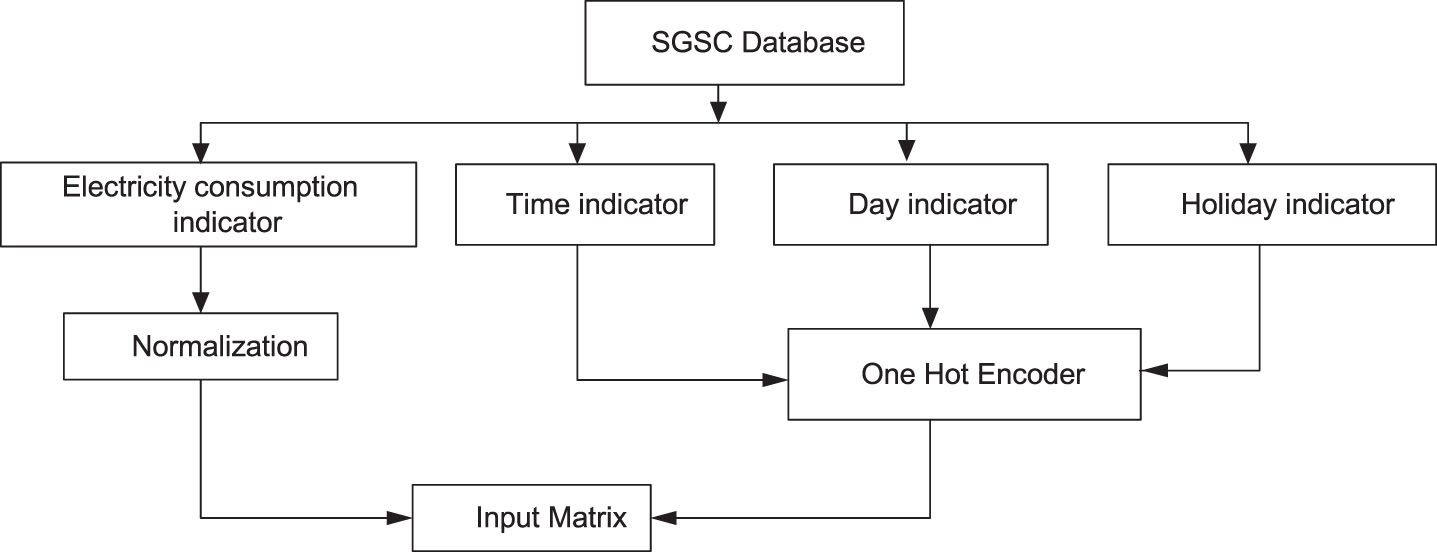
The feature vector formation for training and testing the models.
Such an analysis will be usefull for the researchers and for utility companies for evaluating the stability and reliability of the power system of the smart community.
The dimension of the mini-batch is 128. The various attributes of the time series data (power load), including the energy consumption sequence, the other indicators such as time of the day, day of the week or holiday, are organized column wise and depicted in Table 1.
Attributes of the data set used for training/testing of the developed model based on our old work [1]
The data is collected half hourly (unobservable window is changes less than 30 minutes), where the power load data is recorded after every half hour. Since, we are using a full three months power load data, further decrease in window size will generate extremely large set of data due to the 58 features in every sample (Table 1).
There are various methods for outliers detection and analysis such as numeric, Z-score, isolation forest and DBSCAN. We have selected the DBSCAN for our analysis, which is a density based approach. We have used it for outliers detection and identifying consistency in consumption behavior of individual user in the entire considered period. One major advantage of this clustering approach is that cluster information is not required a priori. Additionally, the outliers in the dataset are also determined, which is an indicator of how consistent an energy user is regarding the consumption patterns. The lower value for outliers means that consistency is high for a specific energy user. This clustering is for identifying the consumption pattern of individual user for entire duration of the analyzed dataset and detecting the outliers in consumption pattern.
Copy the historical data of the user
Discard historical data of the user
In [1], we developed a hybrid deep learning model for forecasting power load of individual user in a smart community. For visualizing the problem, which we aim to solve in current work, we used our model [1] for forecasting power load of individual users, which we plotted against the outliers in the consumption behavior of the energy users in Fig. 5. It is evident from this figure that customers exhibiting less than 23 outliers in their consumption pattern of the 92 considered days, have quite consisting electricity usage behavior. For customers with outliers in range of 23–46, still have somewhat predictable behavior. But for customer exhibiting more than 46 outliers, the consumption pattern is very difficult to predict. This proves out hyphotsis that it is a better idea to include the outliers in the analysis for grouping the energy customers in residential society.
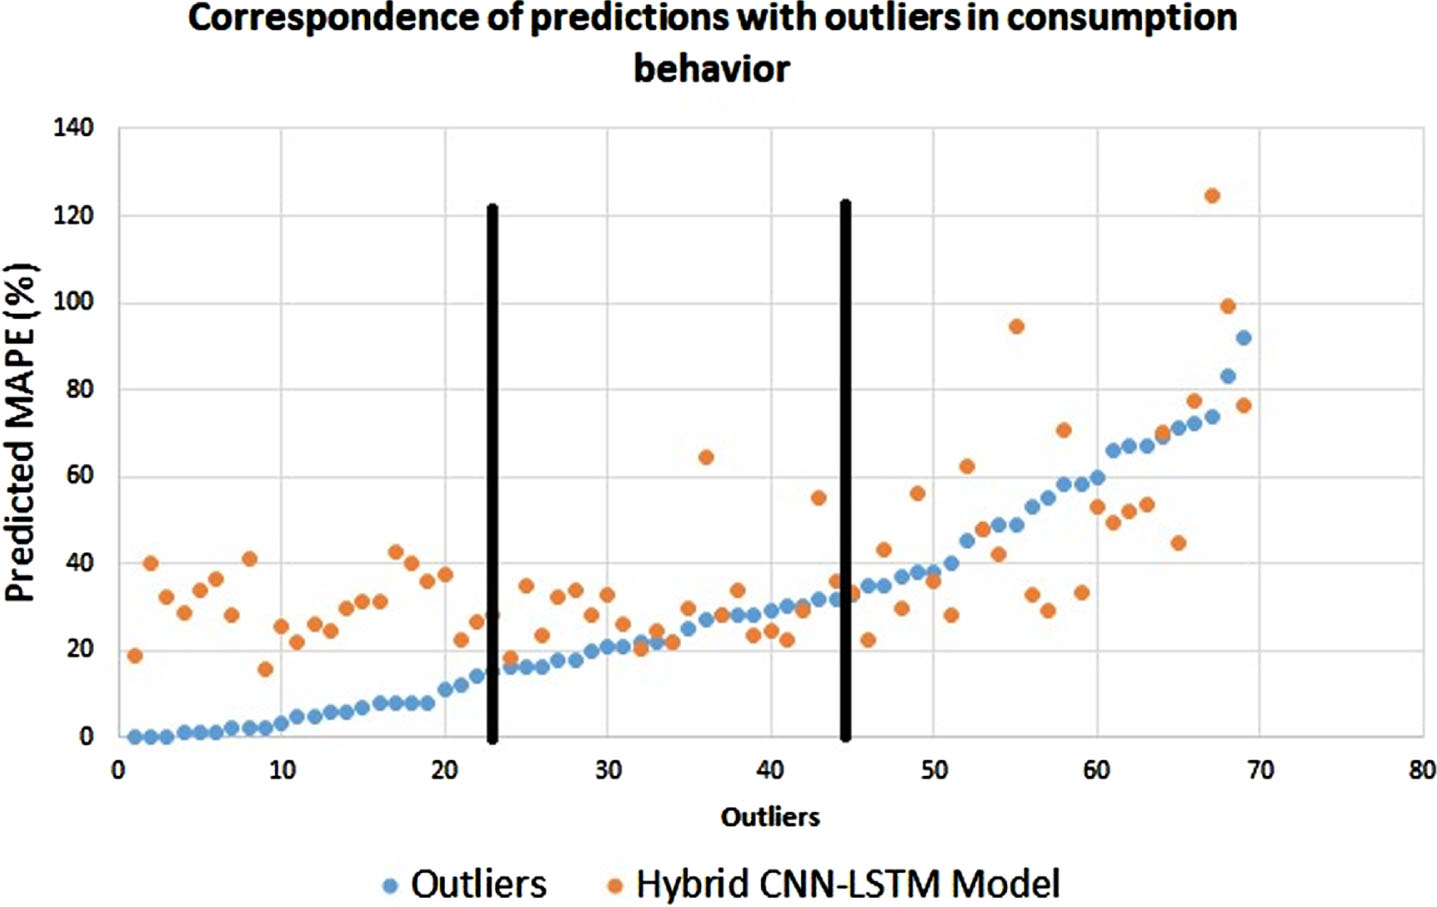
Outliers based clustering of energy users into three groups.
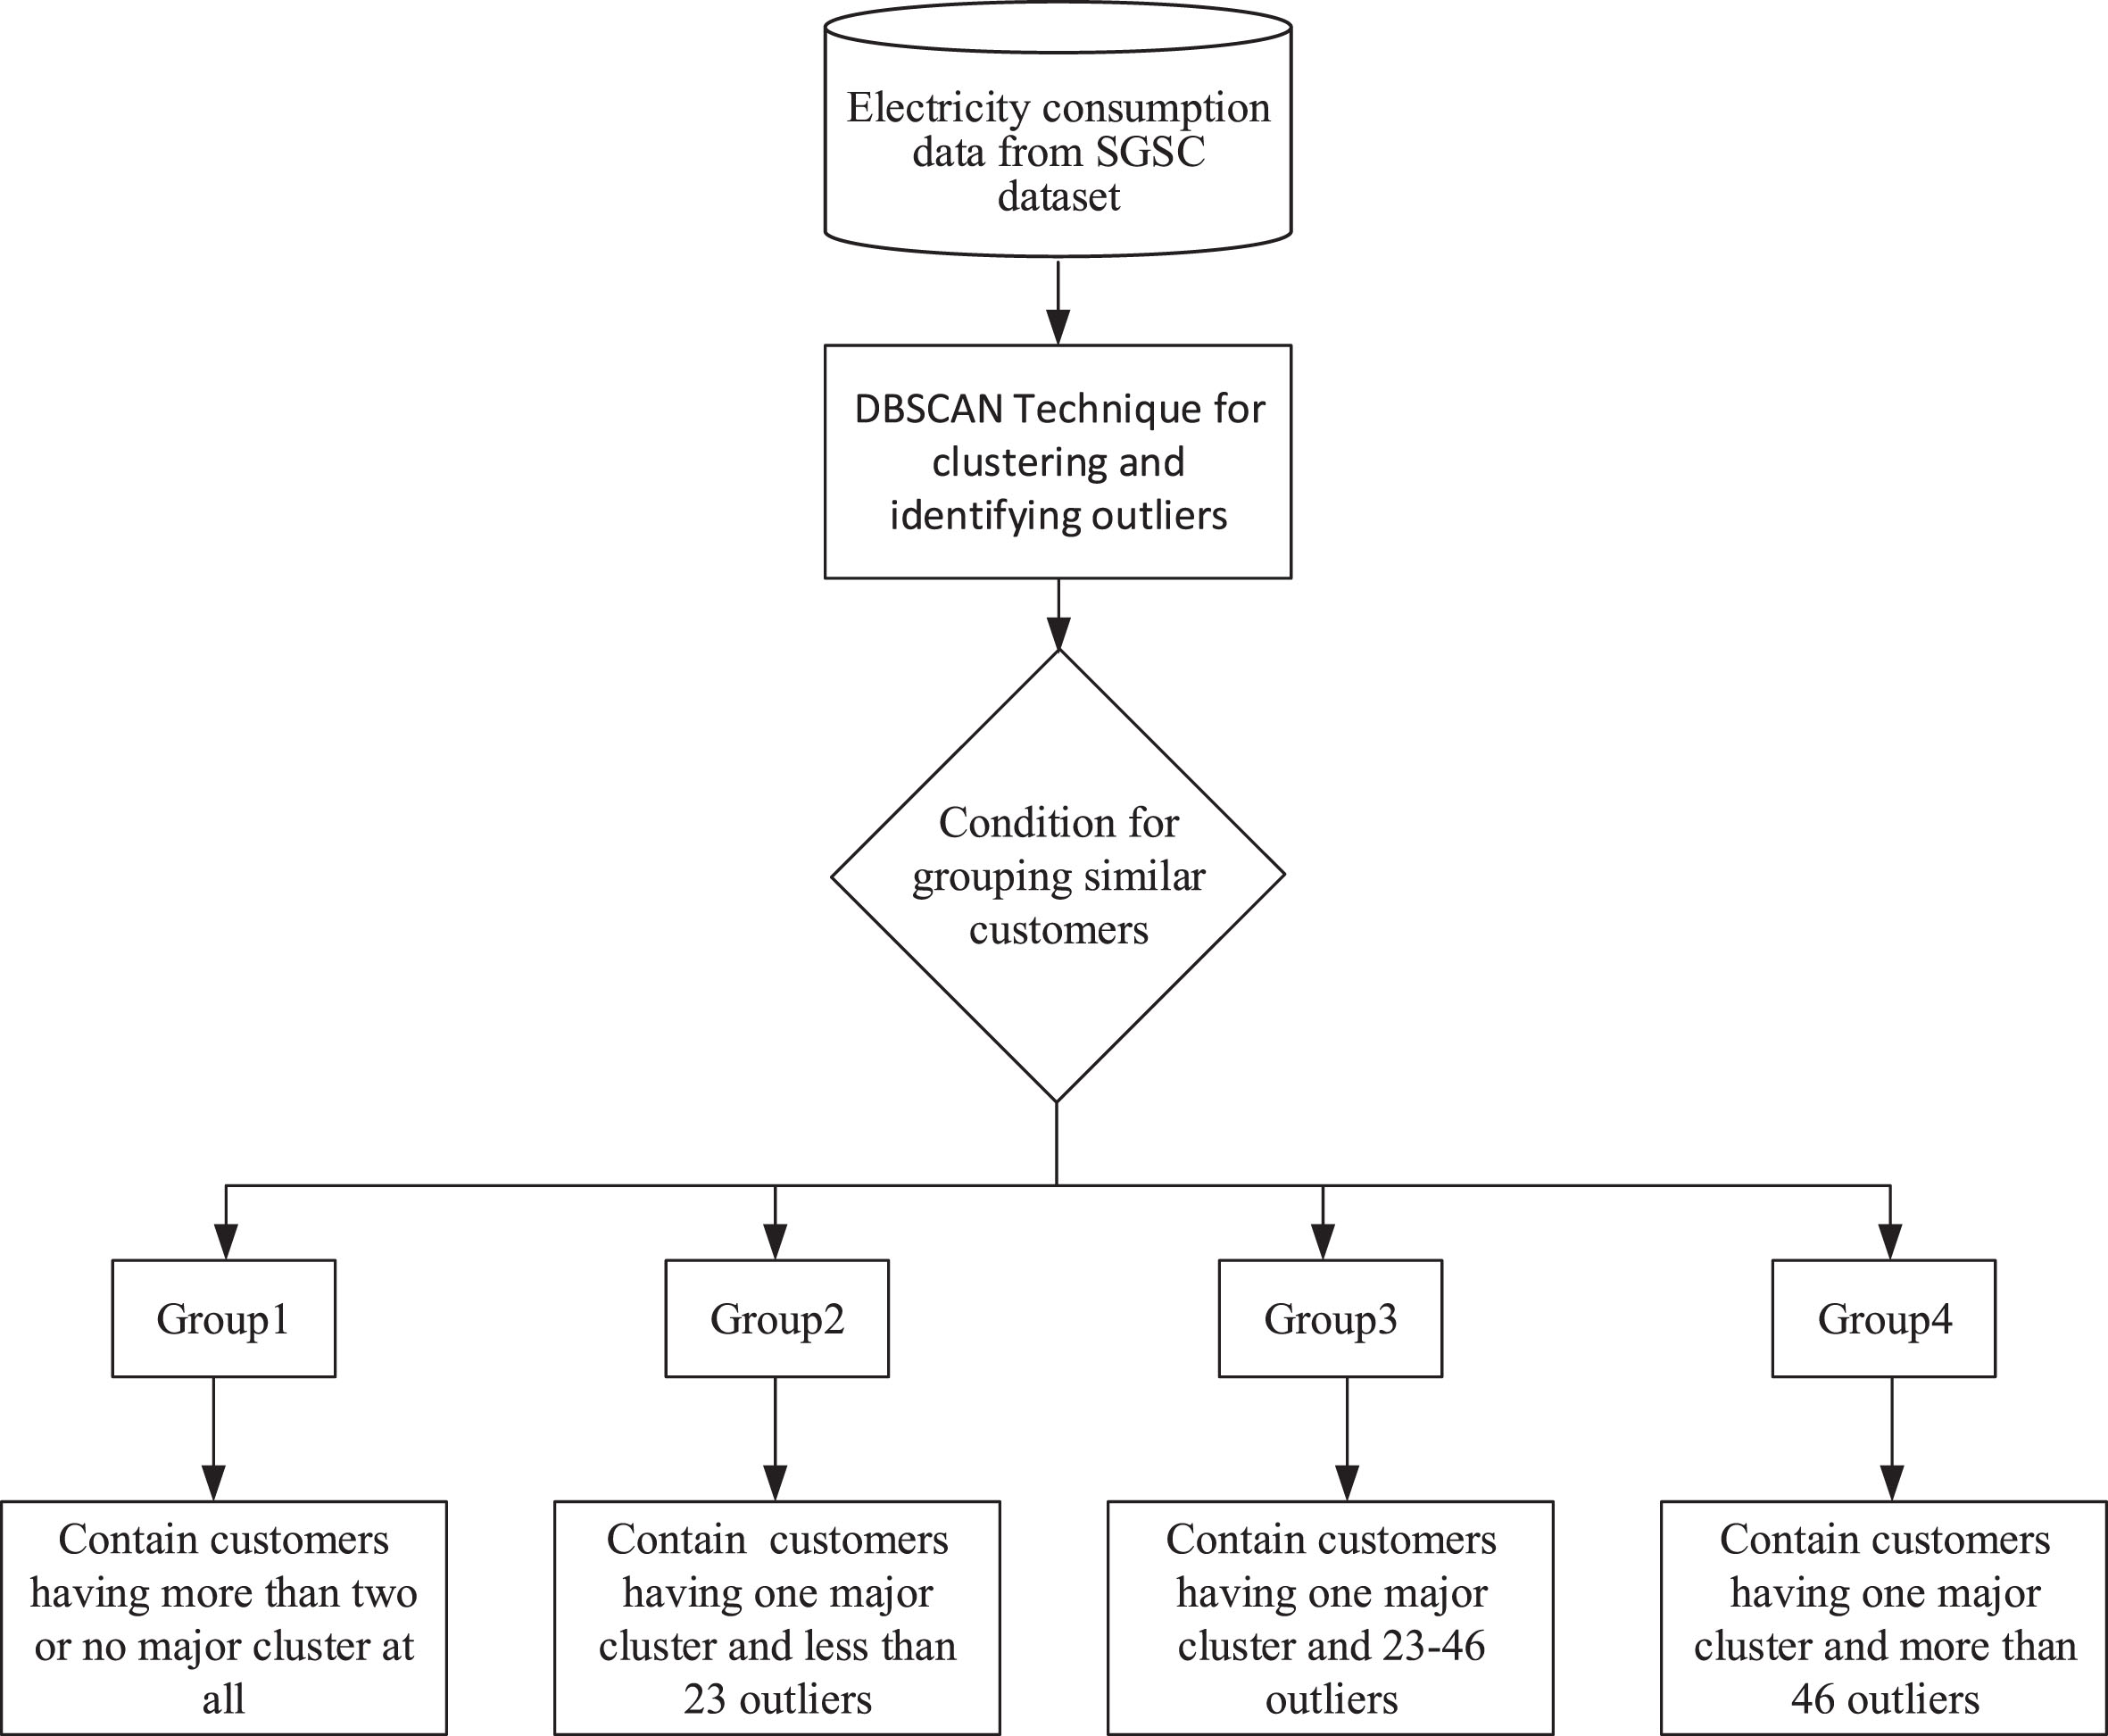
The DBSCAN technique is used for clustering energy users into various groups based on consumption patterns and outliers, which is depicted in the flow graph of Fig. 6. Based on a well-thought idea of separating the energy customers into various groups using DBSCAN technique, the aim is to come up with sub-sets of data for training representative models for achieving high prediction accuracy. Initially, the electricity consumption data of various customers of each group will be picked and combined to form a subset, which can effectively be used for training the developed deep learning model. Such a model will be specialized for the specific group of customers and hence will be trained significantly better compared to the case of having one model for the whole residential society. Furthermore, this approach is more practical, requiring to develop and train few representative deep learning models for the customers of each group rather than having one model for each customer, which was the case in [22].
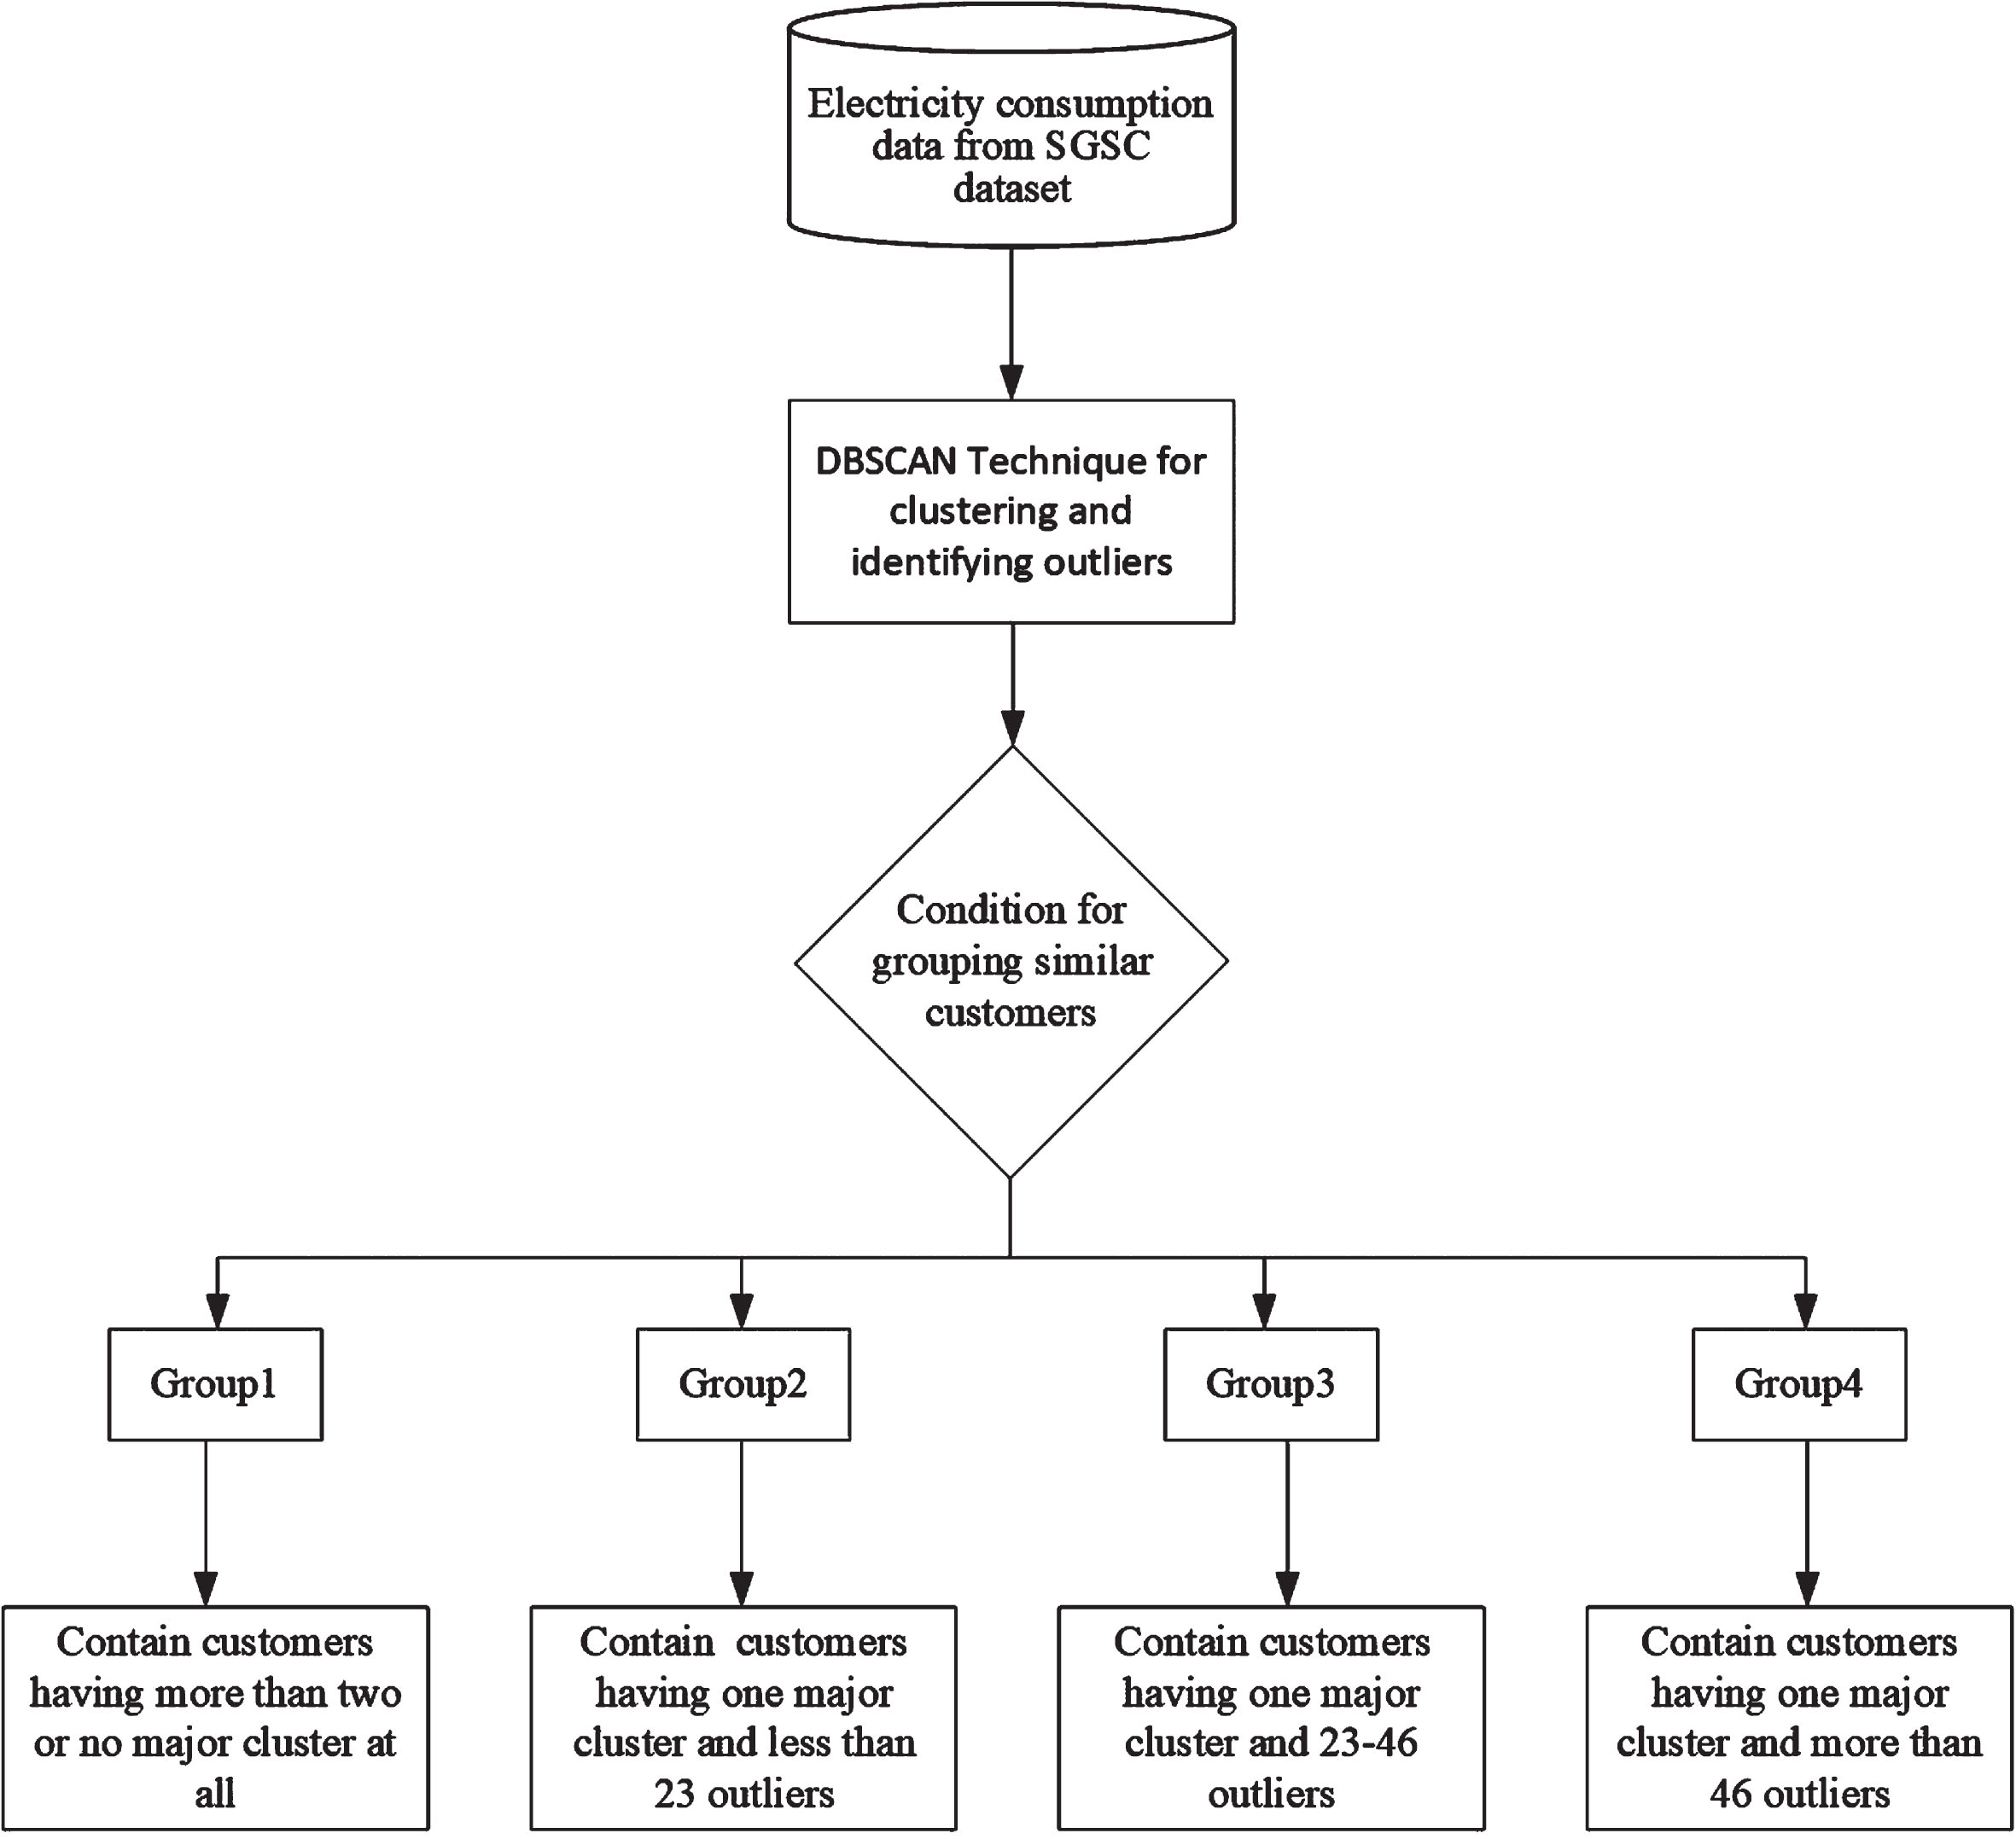
DBSCAN based approach for clustering energy users into various groups.
The proposed approach is practically feasible, in which the smart community is divided into various groups of energy consumers with varying requirements based on intensity and behavior of their energy consumption. According to this solution, the smart community is divided into four groups based on the absolute energy consumption of the energy users and outliers. It will be help the researchers who are interested in power load forecasting of individual customer based on clustering. Then, such trained models can be effectively used for forecasting the power load of the energy users of the respective groups.
The MAE is used as a loss function for monitoring validation loss. At the beginning, validation data and training data were loaded for initiating the training process of the developed model. After successful completion of every epoch, the validation loss is calculated and compared whether it is decreasing or not. If decreasing, the trained model at this stage is saved along with its updated weights and next epochs is started. Nevertheless, if validation loss keeps increasing for ten successive epochs, the learning rate is then decreased for the next epoch. The training of the model is halted after 150 epoch. The final saved best deep learning model along with its weights is used for forecasting the power load of the end users.
The power consumption data of the individual household from Australia collected during SGSC project is used for analysis and experimentation. This dataset is comprised of energy customers data of thousands of individual households in a smart residential community. In a single time step of the dataset, fifty-seven features are available that represent information including time, day and holiday mark etc., which is recorded half hourly. So, in every hour of the day, two samples are recorded, which means forty eight different values for a day are recorded.
The daily power consumption behavior of the customers is assessed by applying the density-based clustering algorithm known as DBSCAN) (density-based spatial clustering of application with noise). The positive side of applying DBSCAN algorithm for analyzing power consumption history of end users is that it does not require the cluster information in advance. Furthermore, DBSCAN also provides analysis of outliers in historical power consumption data. It must be mentioned that usually, the power consumption pattern of end users is repeated in all the weekdays due to same schedule, which makes DBSCAN algorithm the best choice for determining outliers in daily consumption patterns.
The half-hourly power consumption pattern of the arbitrarily chosen end user with ID 8523058 is analyzed using DBSCAN based on historical data of three months and the result is shown in Fig. 7. It can be observed that the power consumption pattern of the user has some variations in numerous days, but overall, it makes one single cluster without any outliers.
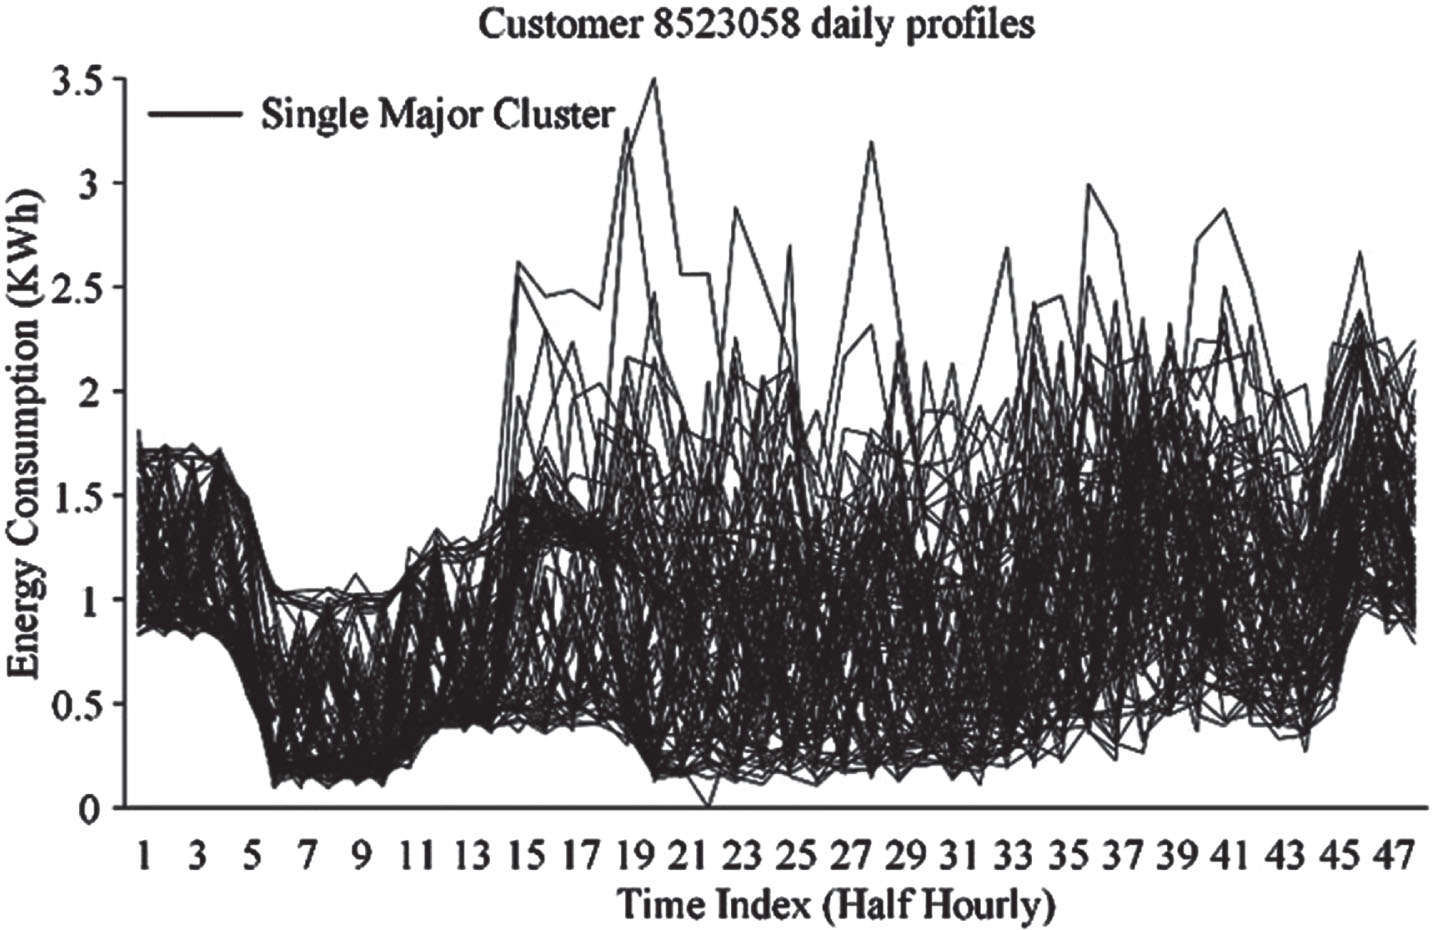
Case (Customer 8523058) with no outliers and only one major cluster.
Based on the number of outliers in consumption behavior, the customers are grouped into various clusters. The stopping criterion is based on the number of outliers in consumption behavior. The customers with occasional outliers are grouped into one cluster. Similarly, customers with highly unpredictable behavior (higher outliers) are grouped into a second cluster. All the remaining customers are grouped into a third clusters. In this way, the 69 customers are grouped into three clusters, where only three trained model are enough for forecasting the power consumption of end user in the residential community.
The proposed model is evaluated for different time-horizons, i.e., multi-step load forecasting and the results are presented in Table 2. This table shows the MAPE (average) of power load for the energy user with different look-forward and look-back time steps. In Table 2, the look-back of 2 and 6 means the data from preceding one hour and preceding three hours respectively. Similarly, the look-forward is the forecast (the output) for the coming one, two up to six hours, which is also depicted in Table 2. It can be observed that the MAPE achieved by the developed model is slightly higher than those in [1, 22], as they developed specialized model for each user, which is practically not feasible and applicable.
Comparison with previous models for various lookback and look-forward configurations
In the analysis and experimentation, both MAE and MAPE metrics were used. The MAE is used as a loss function for monitoring validation loss. At the beginning, validation data and training data were loaded for initiating the training process of the developed model. After successful completion of every epoch, the validation loss is calculated and compared for making a decision to decrease or not the learning rate. The MAPE metric is used mainly for making a one-to-one comparison with previous best models from the literature in [1, 23], as they have used it for their analysis on the load data from the same database.
In this section, initially, an analysis is provided of cluster formation based on outliers in electricity consumption behavior. Then, based on the combined training data of the energy users of respective clusters, the deep pyramid CNN model from our previous work [5] is trained, which is presented in the second sub section.
Analysis for clusters formation based on outliers
The number of major and minor clusters in the pool of considered sixty nine energy users are presented in Fig. 8. It is evident from this figure that few customers (left extreme) have major clusters only while some others have minor clusters only(right extreme). In between the two extremes, many customers have both major and minor clusters.
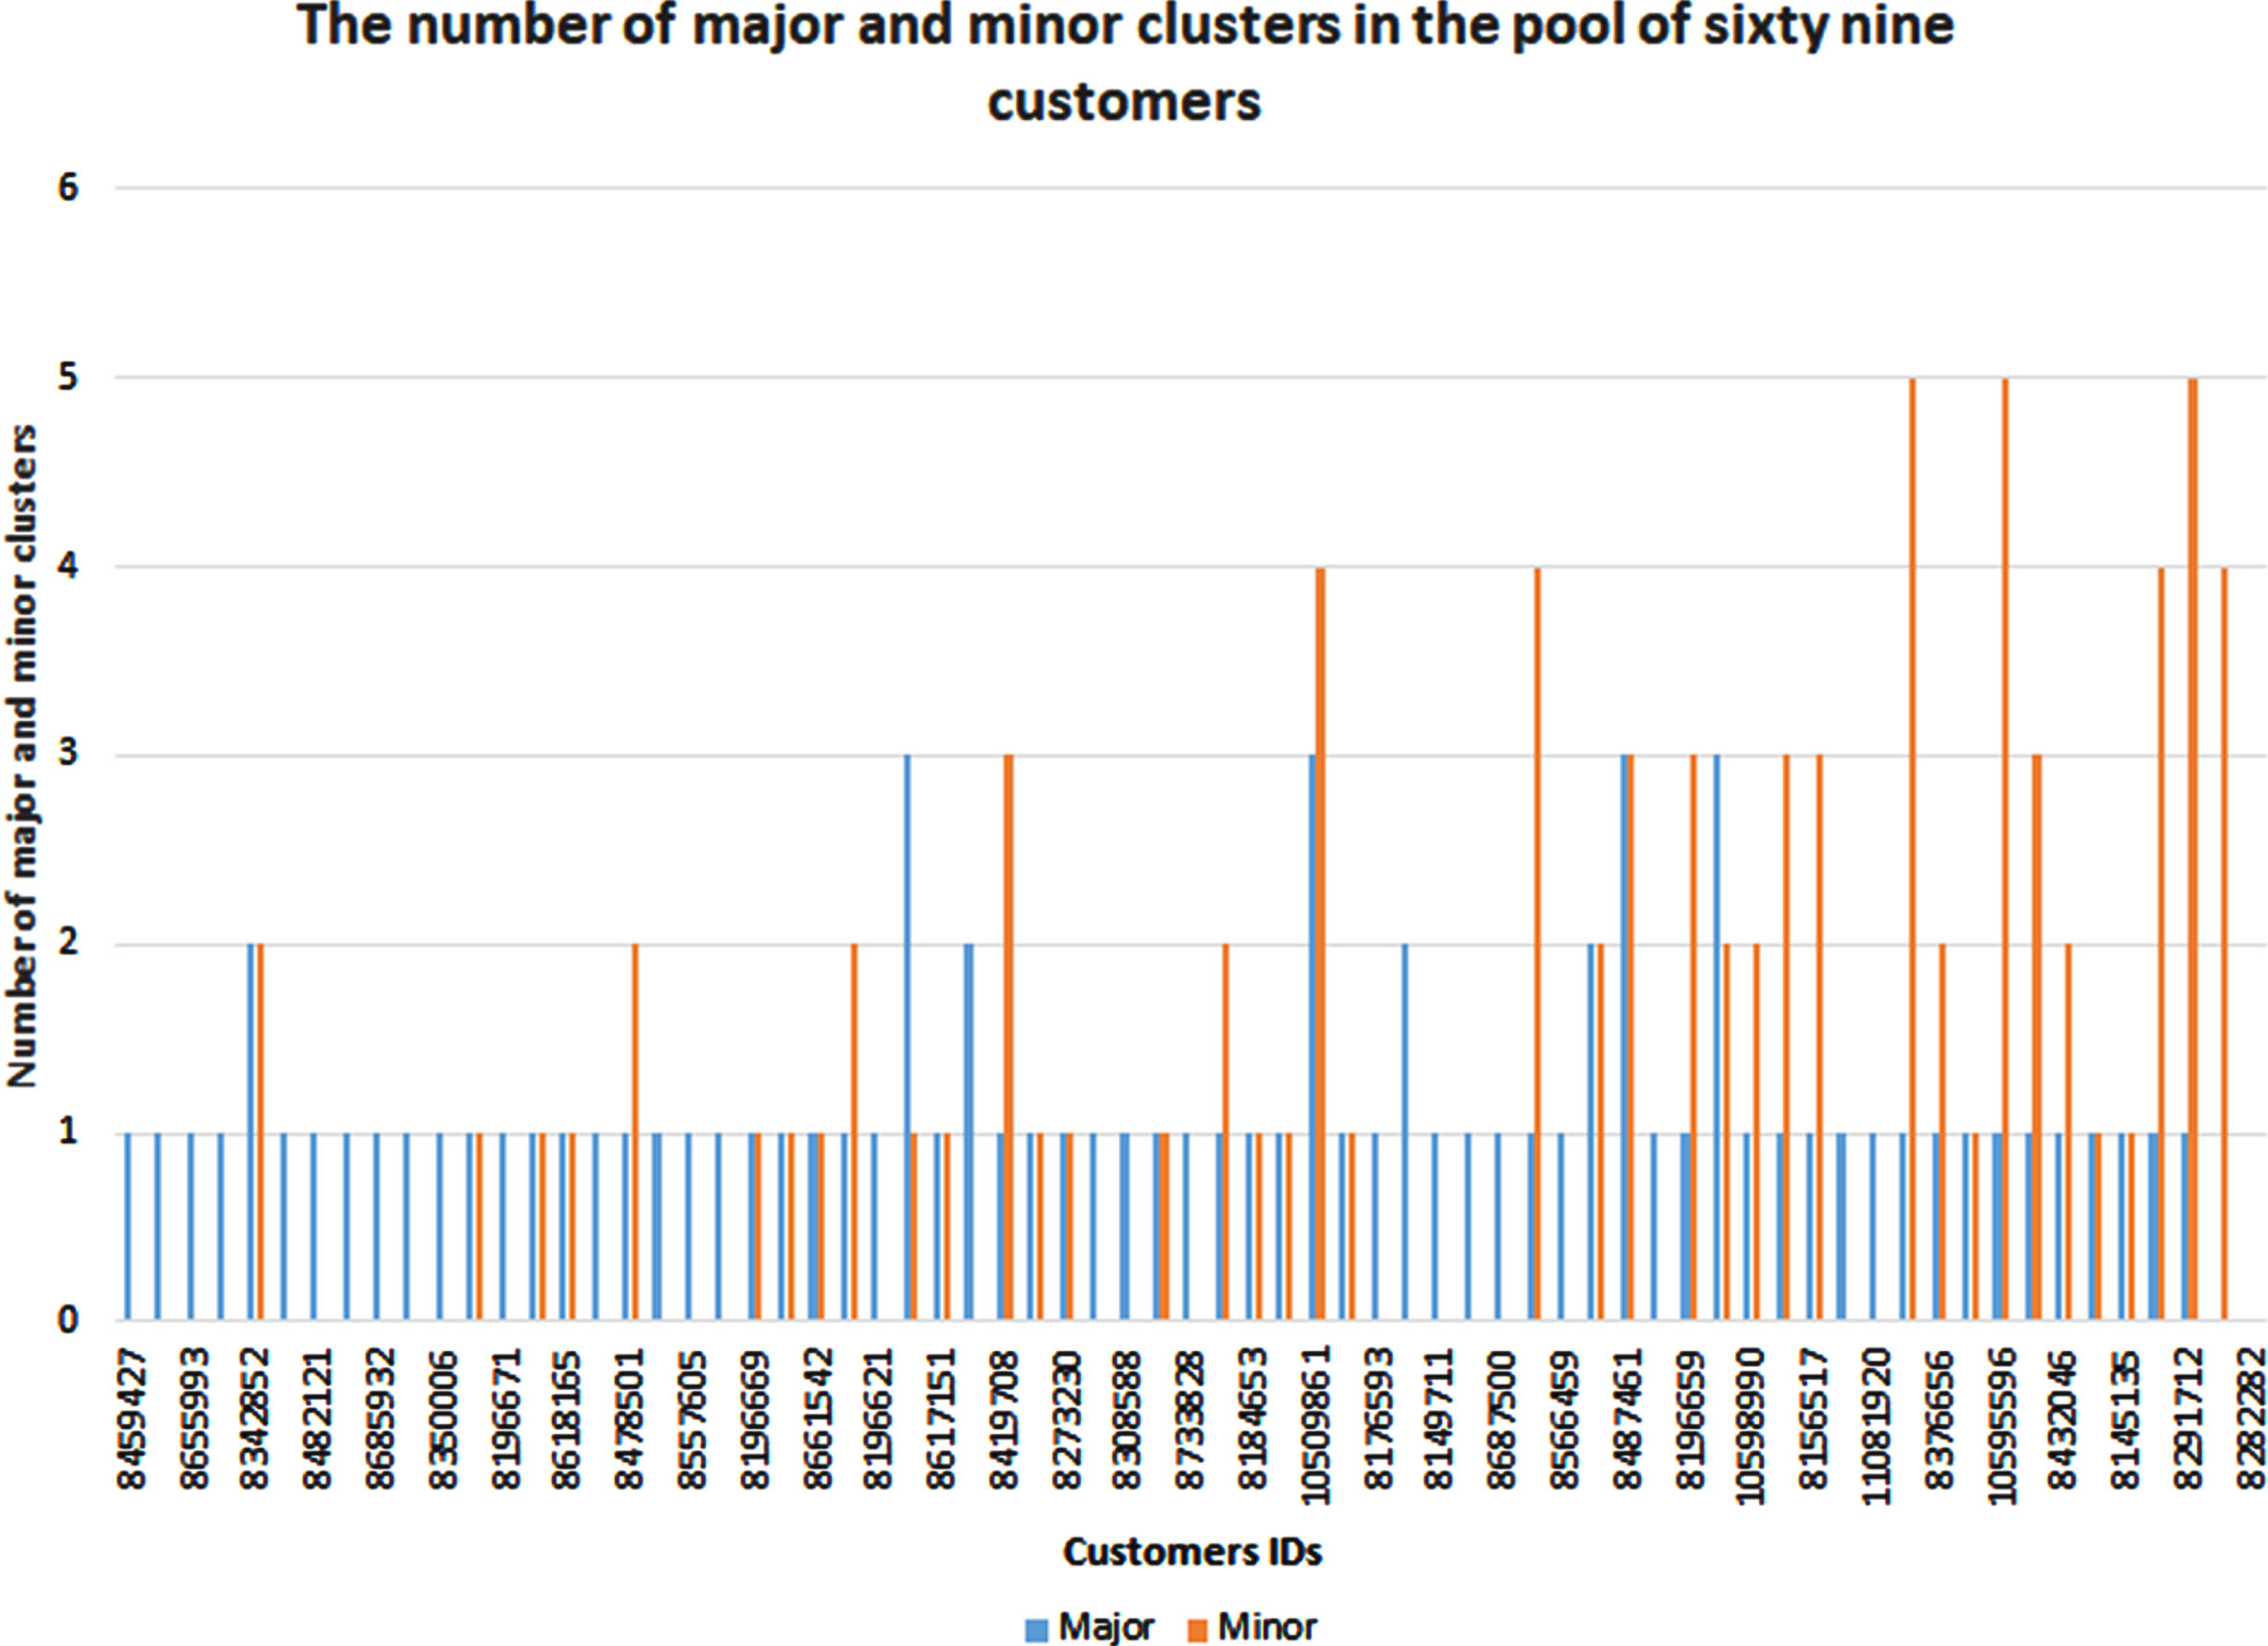
The number of major and minor clusters in the pool of considered sixty nine energy users.
The customer grouping based on only outliers in consumption behavior is presented in Fig. 9. It is evident from this figure that more customers have fewer outliers (left side) and fewer customers have higher outliers (right side). More customers having both major and minor clusters and outliers means that there is higher variability in the consumption behavior of the individual customers. The major and minor clusters does not mean low and high energy users, but just means higher degree of variability in their consumption behavior. Hence, for such a mixture of energy customers, an appropriate solution will be to group them into various clusters. So, based on the observation in Figs. 8 and 9, the intelligent strategy shown in Fig. 6 is proposed for clustering the customers into four groups. This will lead us to the strategy where few representative models will be developed and trained for the group of customers.
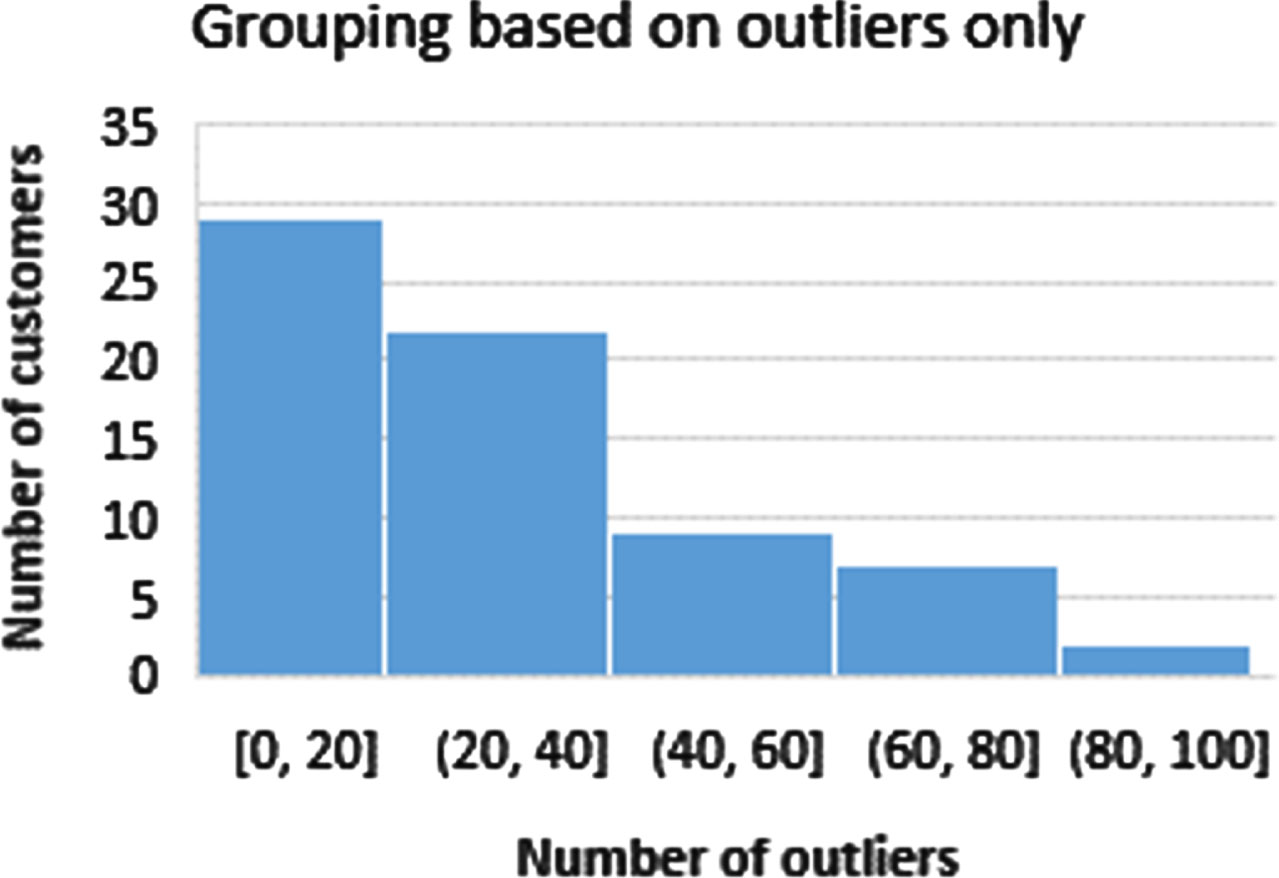
The customer grouping based on only outliers in consumption behavior.
The number of major clusters are shown in Fig. 10, where the red ellipses indicate that some customer do not have any major cluster at all. It is also evident from the same figure that some customers have more than one major clusters. These observations translates into the fact that the power consumption behavior of these energy customers is varying from time to time and from days to days. So, a more thorough investigation is needed for exploring the number of outliers and the variations in power consumption behavior of the considered pool of energy customers.
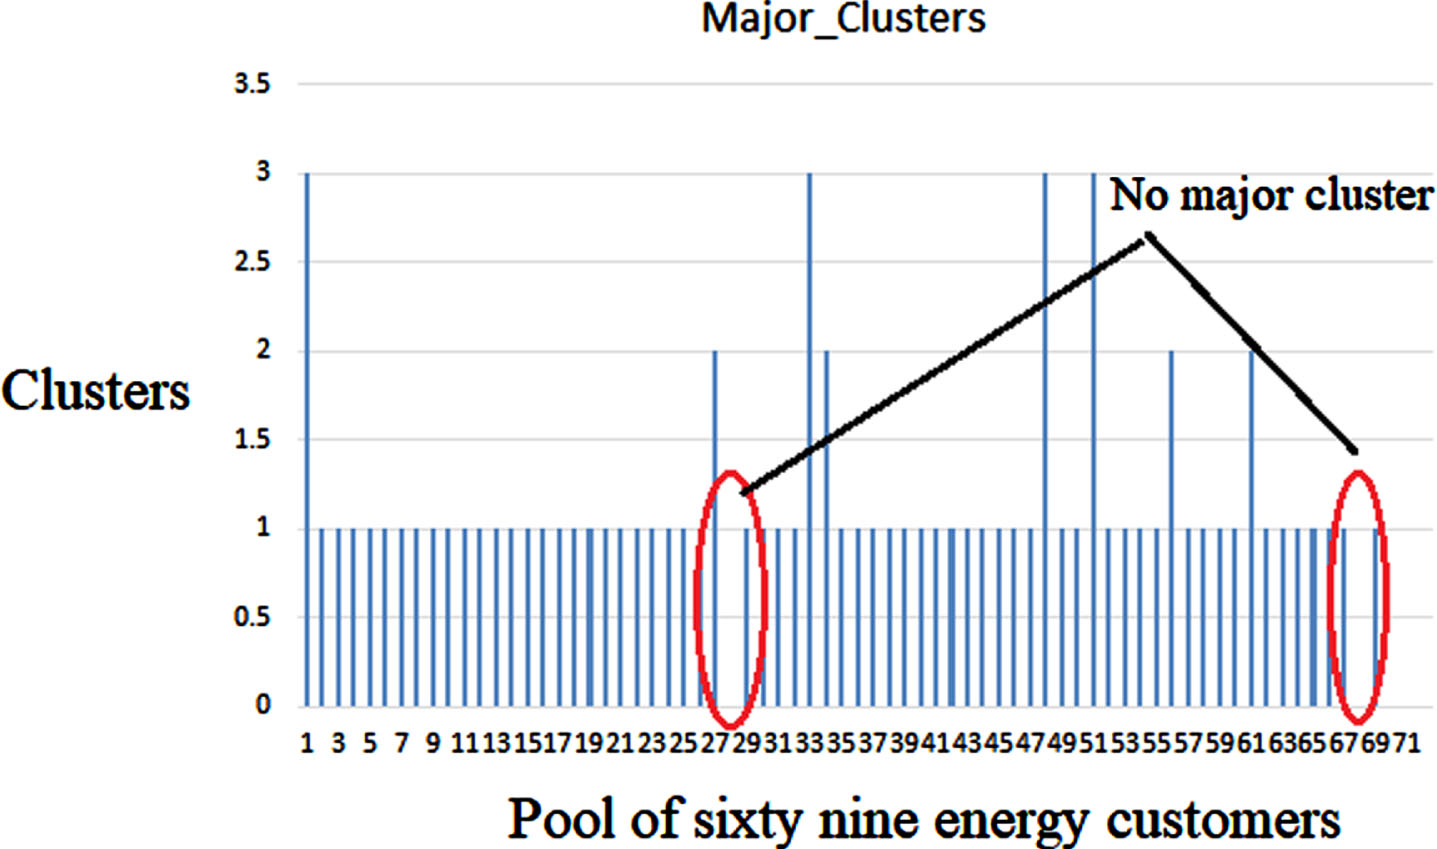
The number of major clusters for the pool of 69 energy customers.
The frequency of outliers in energy consumption behavior of energy users over a period of 92 days is shown in Fig. 11. This figure is very important and is a bit tricky to understand. For the period of 92 days, various energy customers exhibit different energy consumption pattern and possibly have different number of outliers. The number of customers exhibiting different outliers in their consumption is observed and is depicted in this figure. So, effectively it shows the proportion of outlier in consumption behavior for every consecutive five days.

The frequency of outliers in energy consumption behavior over a period of 92 days.
The customer-wise outliers in energy consumption behavior of sixty nine energy users for the selected period of 92 days is shown in Fig. 12. It is evident from this figure that for some customers, the number of outliers are negligible while for others it is higher and reach up to more than 60. More than 60 outliers effectively means that such customer exhibit extremely irregular energy consumption behavior in two out of three months. This means that the consumption behavior of such customers is highly difficult to predict accurately. It is also clear from this graph that almost one-third of the total customers lie in this category.

The customer-wise outliers in energy consumption behavior of sixty nine energy users.
The number of major and minor clusters as well as the number of outliers in the consumption behavior of nine randomly selected customers in the dataset containing historical consumption data over a period of 92 days is shown in Fig. 13. It is evident that the number of minor/major clusters and outliers are varying from customers to customers, which confirms our hypothesis of higher degree of difficulty for predicting energy consumption of individual household. This figure highlights that some customers have only major clusters, some have only outliers and the other have major clusters, minor clusters and outliers. This effectively means that three to four kinds of customers are present in the society and a systematic procedure should be adopted for separating them into various groups, where the group-members exhibits similar energy consumption intensity and behavior.

The major and minor clusters as well as the number of outliers.
So, customer clustering based on consumption behavior and ourliers would be a more practical approach, which is the main aim of The number of outliers in the four groups of energy customers are presented in Fig. 14. It is evident from the figure that the intensity of outliers (quantity) in the power consumption behavior of energy customer belonging to Group2 is in the range of 0 to 23. This means that these are the customers who uses the electricity in a predictable manner. While the customers in group3 have outliers in the range from 23 to 46, which can be predicted with some advanced deep learning models. But the electricity consumption behavior of the customer belonging to Group4 are highly unpredictable and are using electricity in a volatile manner. It is worthy to mention that group1 have energy customers with more than one major clusters, which means higher chances of variability in power consumption behavior and are hence difficult to forecast.

The number of outliers in the four groups of energy customers.
Based on the proposed strategy, the energy customers are divided into four groups, where the number of energy customers in each group of customers is shown in Fig. 15. It shows that the group representing customers with less than 23 outliers in their consumption behavior over a period of 92 days are higher than any of the other three groups. It can also be seen that the other three groups have relatively similar proportions of number of customers. These observations translates into the fact that every group have enough customers, whose power consumption-data for the period of 92 days is enough for the effective training of the respective deep learning models. A deep learning model trained on the separated electricity consumption data of these groups will be highly expert and will be able to accurately forecast the power consumption of each customer with higher accuracy.
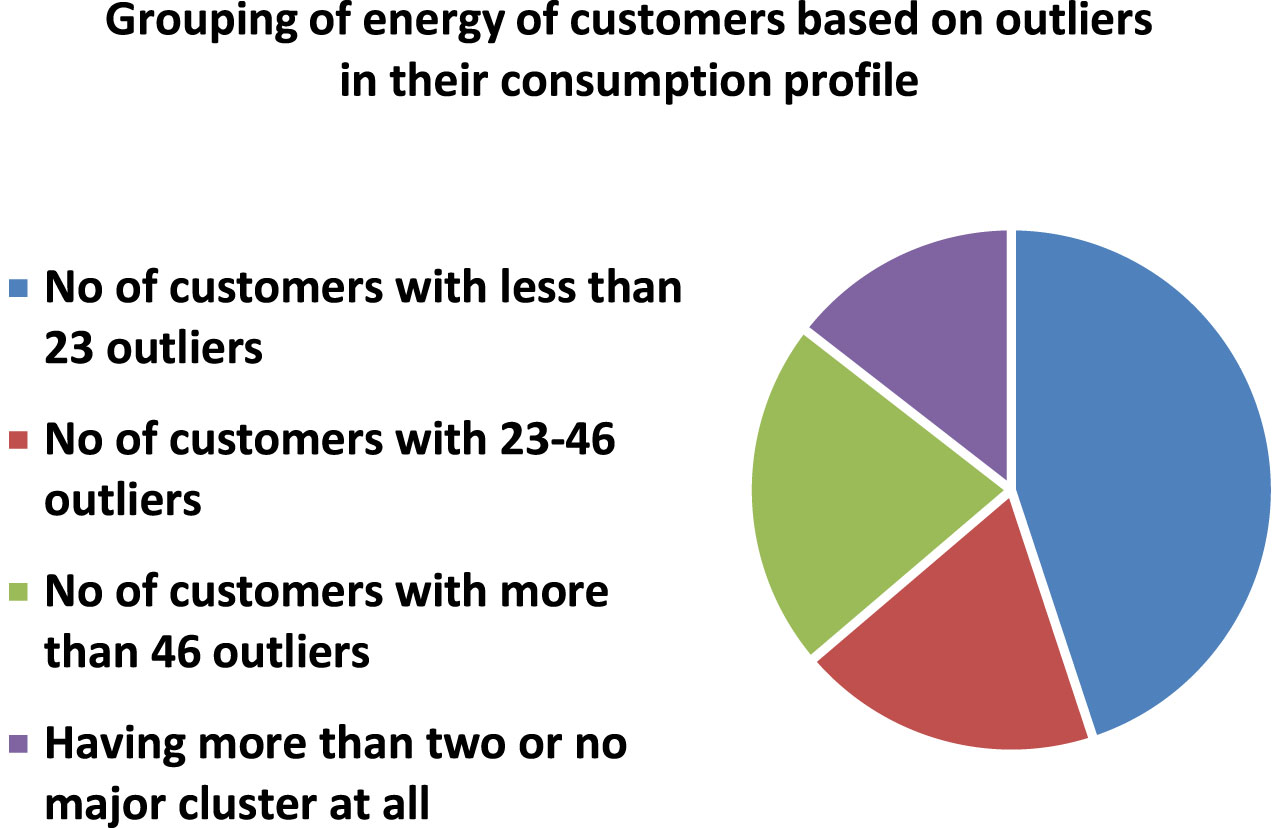
The proportion of user in the four groups of energy customers.
The parameters settings of the developed model are shown in Table 3. The well-known optimizer named ‘Adam’ along with mean absolute error (MAE as a loss function) were used.
The parameter values of the proposed model
The parameter values of the proposed model
The historical electricity consumption data of the electricity users of the various clusters is combined and used for training the pyramid-CNN model from our previous work. This deep learning model is used for comparing our currently obtained outliers based clustering results with those of clustering with consideration of outliers.
The comparison based on MAPE evaluation metric of our model with LSTM based model of [1, 22] is presented in Table 4. It can be observed that competitive forecasting results are obtained using our developed model. Furthermore, the added advantage of our framework is the requirement of significantly lower number of trained models for the whole residential society. The reason is that, using the DBSCAN based approach, the whole residential community is divided (grouped) into several representative clusters, where model were trained model for each of the clusters. These representative trained model are significantly expert at predicting the load quite accurately, as they are trained on the historically collected load data of respective users of these clusters.
The comparison based on MAPE evaluation metric of our model with LSTM based model of [22] is presented in Fig. 16. The forecasting results for four users, in which two each have fewer and higher variations in power consumption behavior (which corresponds to users with regular and irregular power consumption behavior) are analysed and presented in Fig. 17. It can be concluded that our proposed approach achieved competitive forecasting accuracy with the added advantage of requiring a significantly lower number of trained models. Compared to the requirement of 69 trained model in [1, 22], the proposed approach of clustering based on outliers and number of major cluster in consumption behavior, require only four models for the entire residential society. It can be observed in this figure that the forecasting results of the proposed approach based on considering the outliers for training the deep learning model is much better compared to the case of normal clustering.
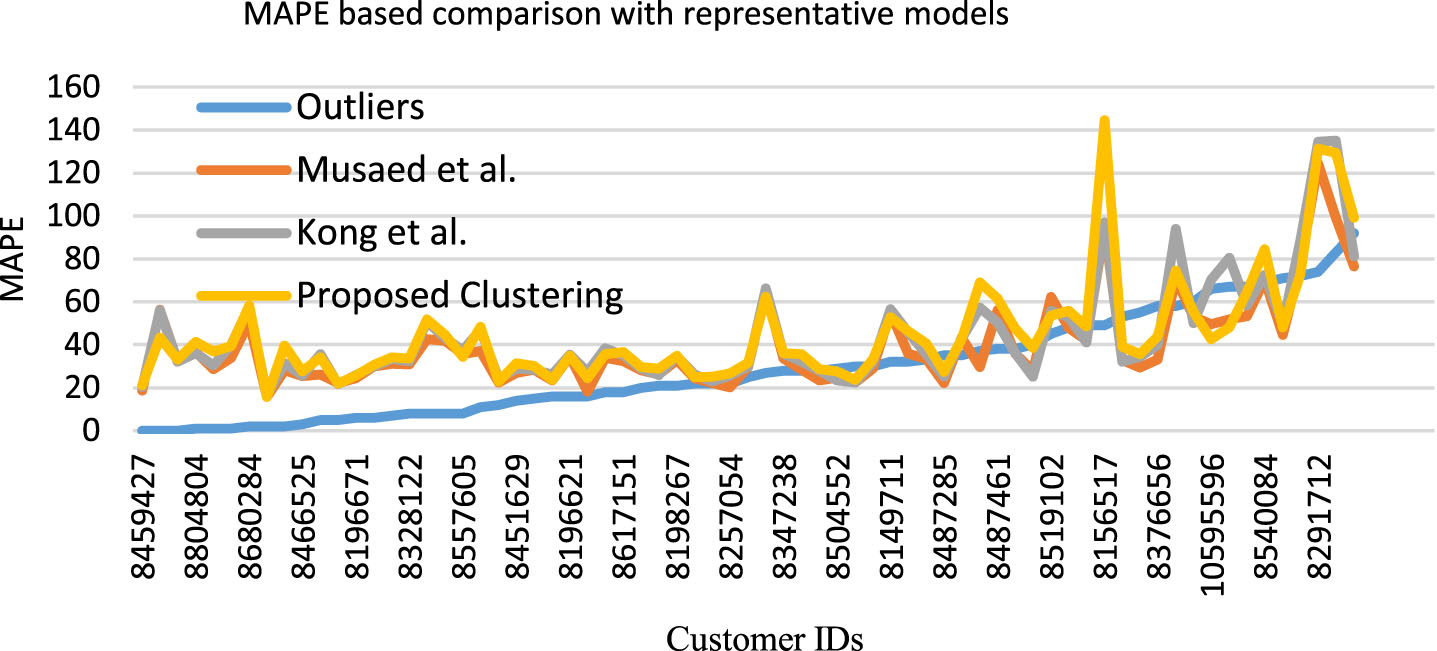
The MAPE based comparison with representative models from the literature.

The forecasting results for two users from each category of regular and irregular power consumption behavior.
The Smart Grid’s planning and management is a challenging problem because of the volatile and unpredictable power consumption of some of the end users, who want lower costs and uninterrupted power supply. One of the big challenges is the unpredictable power consumption behavior of some of the electricity users, which in turn is dependent on many variables including time of the day, day of the week, the season of the year, affordability, and lifestyle of the user. Accurate electricity demand forecasting of end electricity users is needed for the stability, smooth operation, and management of SGs. In the proposed solution, the energy users are grouped into clusters based on their power consumption intensity and the behavior (outliers) in their historical consumption data. Then, the developed deep learning models are trained based on the historical consumption data of the respective groups. Such trained models are able to forecast the power consumption of individual users of the respective groups with higher accuracy. We applied DBSCAN technique to analyze power consumption behavior of customers and to identify the outliers in the extracted subset of 69 energy users over a period of 92 days. Based on the consumption pattern and a number of outliers, the pool of customers is divided into four groups. According to our developed approach, we need to train fewer representative deep learning models for the groups, which will be able to forecast the power load of its users with higher accuracy.
Results show that the residential community is divided into four groups of customers based on the chosen criterion where Group 1, 2, 3, and 4 contains 14 percent, 22 percent, 19 percent, and 45 percent users respectively. Almost half of the population (45 percent) of the considered residential community exhibit less than 23 outliers in their electricity consumption patterns. The rest of the population is divided into three groups, where specialized deep learning models developed and trained for respective groups will be able to achieve higher forecasting accuracy. The proposed approach of clustering based on outliers and a number of major cluster in consumption behavior require only four models for the entire residential society. The proposed approach will have a much wider impact on larger residential societies, as our case study is just for the proof of concept, where we have selected very few customers (69 only). The limitation of this study consideration of a subset of energy users in a residential community. But still it provides a solid analysis and foundation for scaling the solution for a full-scale residential community, which can be divided into several groups and train respective DNN models. There will be many challenges involved in segregating users into ideal groups especially the ones at the boundary of each group.
Author contributions
K. A completed all experimental work and manuscript write-up.
Funding
This Research is funded by Researchers Supporting Project Number (RSPD2024R947), King Saud University, Riyadh, Saudi Arabia.
Data availability statement
The data used is from Smart grid, smart city project of the Australian government, Australia, available at https://www.budde.com.au/Research/Australia-Smart-Grid-Smart-Grid-Smart-City-Project.
Footnotes
Acknowledgments
This Research is funded by Researchers Supporting Project Number (RSPD2024R947), King Saud University, Riyadh, Saudi Arabia.
Conflicts of interest
The authors declare no conflict of interest to declare.
Disclaimer/publisher’s note
The statements, opinions and data contained in all publications are solely those of the individual author(s) and contributor(s) and not of MDPI and/or the editor(s). MDPI and/or the editor(s) disclaim responsibility for any injury to people or property resulting from any ideas, methods, instructions or products referred to in the content.