



Abstract
Accurate prediction of short-term electricity price is the key to obtain economic benefit and also an important index of power system planning and management. Support vector regression (SVR) based ensemble works have gained remarkable achievements in terms of high accuracy and steady performance, but they are highly dependent on data representativeness and have a high computational complexity O (k * N 3) of data samples and parameter selection. To further improve the data representativeness and reduce its computational complexity, this paper develops a new approach to forecast electricity price via optimal weighted ensemble. In the model, the cluster-based subsampling algorithm is proposed to categorize the inputs being seasonally decomposed into several groups, and representative data are drawn from each group in a certain proportion to ensure that each subset trained with SVR has the same representativeness and features. Moreover, the optimal weighted combination method is presented to assign weights to the sub-SVRs to obtain the optimal support vector regression ensemble model (OWSSVRE). The experimental results show that the improved support vector regression ensemble model with the same features and representativeness of the subset has better performance in electricity price forecasting. As a result, it is suitable to support decision making in the energy and other sectors.
Keywords
Introduction
Accurate electricity price forecasting is the common concern to all the power participants, and it can provide guidance for power suppliers, consumers, and market regulators.
Background
Affected by the global economic recovery, monetary easing and carbon-neutral commitment, global commodity prices and energy prices had continued to rise to large extent in 2021, and electricity prices in major EU economies had risen sharply. At present, the whole of Europe is in the dilemma of “electricity shortage”. Driven by this situation, the cost of electricity consumption for most market participants has increased significantly. For a long time, electricity price is not only a tool to maintain social production balance, but also the key to each market participant’s economic benefits. The rise of electricity price has caused certain fluctuations in the market balance. In order to minimize the effects of the fluctuations, market participants use the electricity price forecasting model to forecast the electricity price to expect different benefits.
Europe and the United States have always been a deeply market-oriented electricity market. The essence of electricity is a commodity, and its price is constrained by the relationship between supply and demand, which conforms to the law of market as well as the most basic requirements of forecasting. For power generation companies, electricity price forecasts help to formulate optimal bidding strategies to maximize benefits and minimize costs.
Therefore, it is very promising to steadily forecast short-term electricity price data to help market participants make cost strategies, electricity consumption plans and other decisions. However, extreme volatility makes electricity price forecasting more complex than other commodity prices, and a study of annualized volatility of commodities shows that electricity spot prices have volatility of up to 200%, far exceeding that of oil (30%), natural gas (50%) and electricity (60%) ([1]). In addition, electricity cannot be stored for a long time. These two factors lead to the high volatility and non-stationary, multi-seasonal and nonlinear characteristics of electricity prices. To cope with the multi-feature superimposed nature of electricity prices, a stable and accurate method needs to be developed to forecast electricity prices.
Discussion on electricity price forecasting
Many forecasting methods have been put into use in electricity price forecasting over the years, and there is no accurate answer as to which method is more appropriate. The forecasting methods can be broadly classified into two categories. One is the causal prediction method, such as the differential equation model, which looks for the causal relationship between the independent variable and the dependent variable, and is suitable for short, medium and long-term prediction. It can not only reflect internal laws and the internal relationship of things, but also analyze the correlation between two factors. The other is the time series forecasting method that predicts the future development trend of the market through statistical analysis using historical data according to the continuity law of objective things. As mentioned above, electricity prices are affected by many complex factors, and it is difficult to determine in real life. It is a very challenging task to establish an accurate forecasting model. Therefore, the research on electricity price forecasting is more inclined to electricity price forecasting based on time series forecasting method. There are two most commonly used time series forecasting methods: statistical models and artificial intelligence (AI) models.
In the traditional statistical model, the widely used models mainly deal with electricity price data characteristics modeling, including seasonality, strong mean regression, time variation moments and price fluctuations. Swider and Weber [2], and Bowden and Payne [3] studied the forecasting ability of the extended ARMA electricity price model and three time series models based on ARIMA electricity price forecasting separately. Their experimental results show that these models significantly improve the representation of random price processes and are more suitable for estimating seasonal and cyclical price trends in electricity markets. Inglesi-Lotz [4] used Kalman filter to estimate the price elasticity of electricity in South Africa during 1980-2005 and concluded that the higher the price of electricity, the higher the sensitivity of consumers to price fluctuations. For volatility modeling, Ioannidis et al. [5] proposed the GARCH periodic electricity price model with conditional skewness and kurtosis components, by using the empirical results of hourly wholesale prices in the German electricity market in 10 years.
In addition to modeling the structural characteristics of electricity prices, scholars believe that the higher accuracy prediction of electricity price could reduce the adverse impact of electricity crisis on the economy by fully utilizing AI modeling in recent years. Anbazhagan and Kumarappan [6] utilized a one-dimensional discrete cosine transform input feature feedforward neural network (DCT-FFNN) for electricity price forecasting and validated the effectiveness of the method by forecasting electricity prices in the New York electricity market in 2010. Yang et al. [7] combined wavelet transform, kernel-based ELM optimized by self-adaptive particle swarm optimization (SAPSO) to forecast electricity prices. Evaluated by using electricity price data for the Pennsylvania-New Jersey-Maryland, Australia and Spain markets, the hybrid model is shown to be of better versatility and practicability. By leveraging the advantages in capturing bidirectional data features, Shao et al. [8] established the BiLSTM forecasting model to predict the fluctuations of electricity price and demonstrated the superiority of the proposed model including high stability, accuracy and adaptability.
As mentioned earlier, electricity prices are affected by a series of complex factors, and it can no longer meet the requirements to improve the accuracy of electricity price prediction by relying solely on traditional model or artificial intelligence model simply. Therefore, more and more optimization strategy based forecasting models are now coming up with new ideas to reduce model forecast errors. Combining the data mining method to enhance feature selection, Ghayekhloo et al. [9] applied a recurrent neural networks model trained using variation Bayes to predict the daily price of electricity in the power market. Experimental results show that the proposed model has a better performance than other forecasting models. Gollou et al. [10] proposed a prediction model combining a two-step approach feature selection, wavelet transform and hybrid prediction based on neural networks and optimisation algorithms. An empirical study on the PJM electricity market illustrates the effectiveness of the proposed strategy. To improve the forecasting performance, Yang et al. [11] developed a framework for forecasting electricity price, which integrated the adaptive parameter-based variational mode decomposition technology, optimal kernel-based extreme learning machine models optimized by leave-one-out optimization strategy and the optimal model selection strategy, and achieved the best performance compared with the popular traditional statistical models and computational intelligence models.
Each single prediction model has certain unique advantages in characterizing local data features and hence the improvement degree of an individual model is limited. How to combine the advantages of multiple different individual models has become a widely concerned issue in time series prediction. Combining the extreme learning machine optimized by the differential evolution algorithm, Zhang et al. [12] introduced the concept of ensemble learning to reconstruct the weights of the predicted components. The approach addressed the limitation of equal-weight reconstruction prediction and demonstrated strong performance. Inspired by the ability of each individual model to characterize some local data features, Meng and Xu [13] proposed a support vector regression ensemble model based on an ant colony optimization algorithm to predict pricing mechanisms in a cloud manufacturing environment. To obtain an accurate and timely forecast of skin lesions, Kalpana et al. [14] proposed a support vector regression ensemble model with hybrid intelligent optimization. The experimental results of these studies show that the ensemble method based on support vector regression has better generalization performance, better mean square error and more reliable integrated learning stochastic results. In general, ensemble models based on support vector regression (SVR) have remarkable capabilities in terms of high accuracy and stable performance. However, the ensemble models have a high computational complexity O (k * N3) with the sample N and ensemble size k.
Subsampling [15, 16] is an efficient scheme to reduce the computational complexity of ensemble model. However, we find that the representativeness of the subsamples and the difference of prediction ability among sub-models are not taken into account in current subsampled ensemble models. Our proposed model well copes with these two issues. In this paper, we propose an optimal weight support vector regression ensemble model with cluster-based subsampling (KMC-OWSSVRE). Specifically, the feature data is first categorized into several clusters separately using K-means clustering. Secondly, to make subsampling be representative, cluster-based subsampling is adopted to produce a series of subsamples. Thirdly, based on the subsamples drawn from clusters, a series support vector regression models are derived with particle swarm optimization algorithm. Lastly, all the sub-models are combined to generate an ensemble model. Owing to the fact that different sub-models may have different prediction performances, different weights should be assigned to different sub-models in the ensemble model. We adopt an optimal weight strategy in the least squares sense to form a final ensemble model. To verify the validity of the model, we test it using the electricity price data of New South Wales and Queensland, respectively. To fully utilize the features of the data set, seasonal decomposition is performed to generate trend-cycle component, seasonal component and residual component owing to the periodicity of the electricity price. Then KMC-OWSSVRE model are applied to model the trend-cycle component and residual component. The results demonstrate that KMC-OWSSVRE model is of high accuracy and robust performance. The framework of the electricity price forecasting model is roughly shown in Fig. 1.
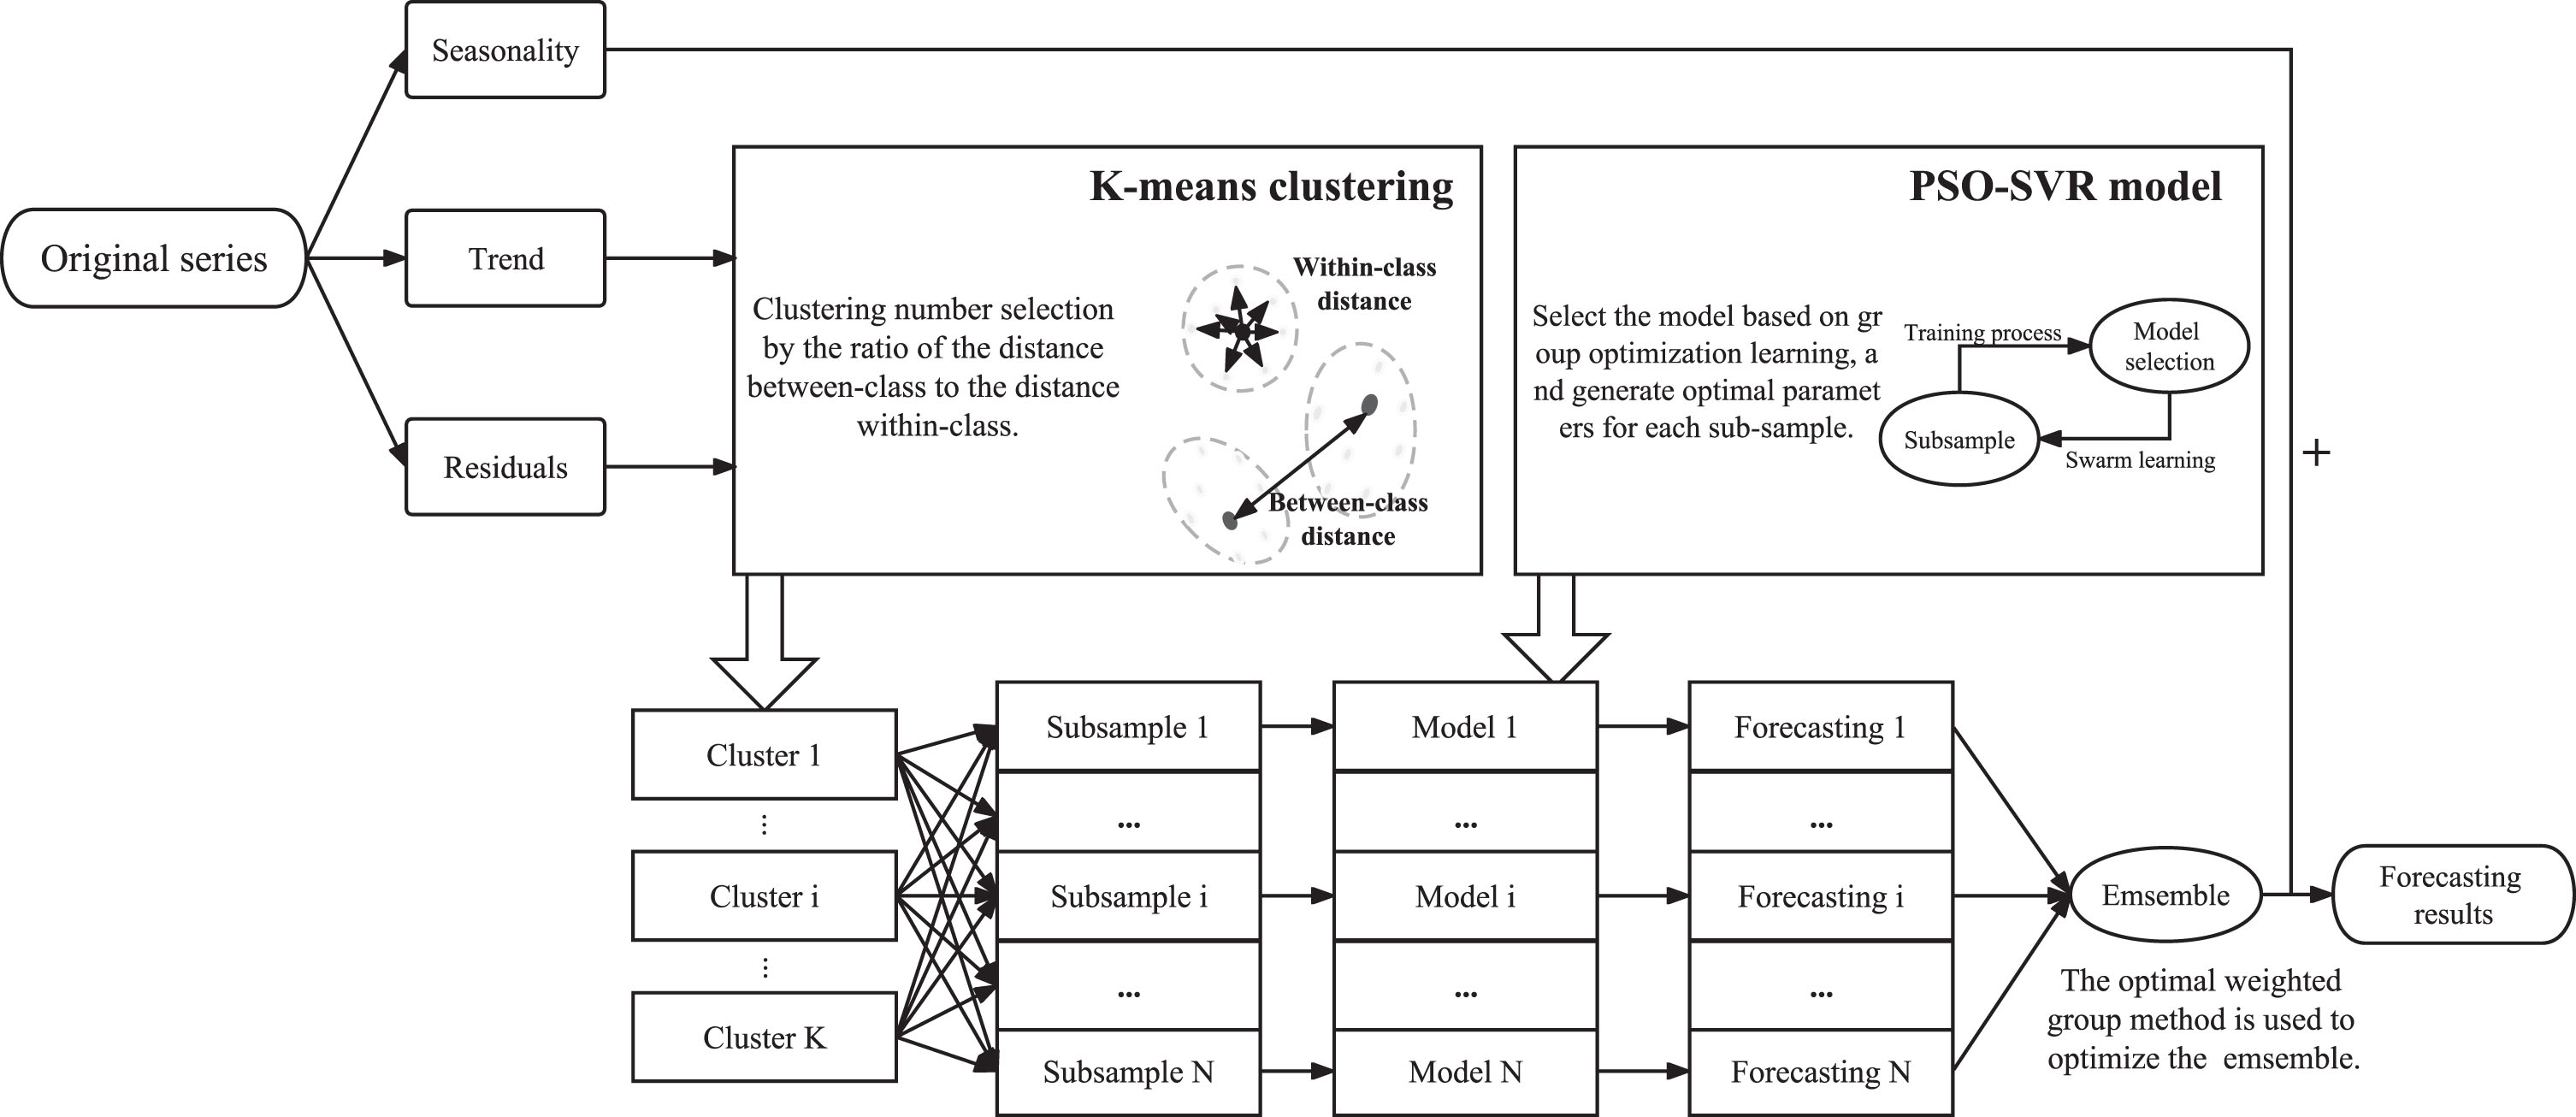
Framework flow chart.
The main contributions of the research are featured in the following aspects: This paper constructs a new approach to forecast electricity price via an optimal weight ensemble model. A novel cluster-based subsampling algorithm is proposed to categorize the inputs being seasonally decomposed into several groups, and representative data are drawn from each group in a certain proportion to ensure that each subset trained with SVR has the similar representativeness and features. The seasonal decomposition method can reduce the noise of the inputs, and the K-means clustering method categorize the feature data into clusters with elements of similar features and representativeness, which can make the experimental samples enter the comfortable working range of SVR. The weights among sub-SVR models are optimized in the least squares sense to obtain the optimal ensemble model to reduce the prediction error.
The remainder sections are structured as follows. Section 2 describes the proposed methodology, highlighting its main differences in relation to recently developed ensemble methods for forecasting. Section 3 describes the data, performs data preprocessing and summarizes the results and assesses their implications. Finally, section 4 concludes this paper.
This paper presents a framework for deep learning ensemble forecasting models with cluster-based subsampling based on seasonal decomposition and cluster sampling. In the ensemble model, K-means clustering is utilized to cluster the multi-dimensional input data. Secondly, cluster-based subsampling method is implemented to generate a series of subsamples. Thirdly, a series of support vector regression sub-models are constructed based on the subsamples extracted with K-means clustering. Finally, an optimal weight ensemble strategy is employed to form an ensemble model to improve the prediction efficiency.
Support vector regression
In the field of machine learning, there exist a large collection of forecasting algorithms. Among them, support vector regression (SVR) has received a large number of researchers’ attention due to its remarkable performance. In this paper, we only consider the ∈-insensitive support vector regression (∈-SVR). Assume a given data set

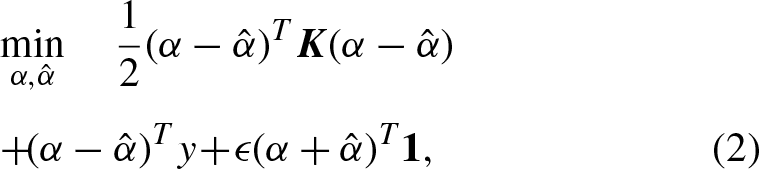
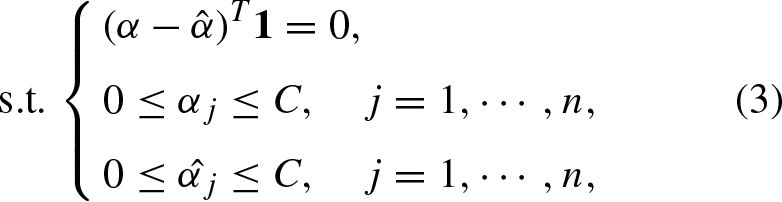

From the objective function (2) and (3) conditions, we can see that the choice of hyperparameters ∈, C and σ immediately determines the performance of the SVR model. Therefore, it is essential to optimize the hyperparameters. A main approach to seek for sufficiently good parameters for SVR is to make use of optimization techniques, such as Genetic Algorithm (GA) [17], Grey Wolf Optimizer (GWO) [18], Particle Swarm Optimization (PSO) [19], and so on. In this study, PSO algoirhtm is explored to optimize the hyperparameters of SVR.
SVR is an effective tool in real case regression tasks. However, the space and time complexity of SVR are O (N2) and O (N3), respectively, where N is the number of training samples. Therefore, the traditional SVR is not suitable for large data set since it takes too much time and space to train. Thus, subsampling techniques can be utilized for accelerating the learning processes for large-scale tasks. In this work, we consider a subsampling technique based support vector regression ensemble (SSVRE) model. Specifically, we construct the SSVRE model from the convex combination of a series of subsampled support vector regression models:


From Equation (5), we know the forecasting performance of SSVRE relies heavily on the weight distribution. If we simply employ the average weights (


Owing to the fact that the goal (7) is quadratic and the constraints (8) are linear, the optimization problem can be solved by quadratic programming algorithm. Based on the solution of the objective function with constraints, an optimal weight SSVRE model (OWSSVRE) is derived.
When the data set is highly unbalanced, random sampling may lead to some subsamples unrepresentative and hence affects the performance of the ensemble model. To make subsamples be representative, cluster-based sampling technique [20] can be adopted. There are many ways to achieve data clustering with features, such as hierarchical clustering, K-means clustering, and so on.
K-means clustering
K-means clustering algorithm proposed by MacQueen [21] is a representative of fast clustering algorithm, which automatically categorize similar samples by an iterative clustering procedure. The basic idea of K-means clustering is to assign each sample to the nearest cluster. Specifically, for given data set X = {x1, x2, . . . , x N } and cluster number k, K-means clustering is to minimize the sum of squares of errors (SSE) defined as follows:
Divide the samples into k initial clusters. Assign each sample to the nearest cluster to the center based on Euclidean distance. Recalculate each cluster center based on the following equation. Repeat steps (2) and (3) until all the samples can no longer be assigned.
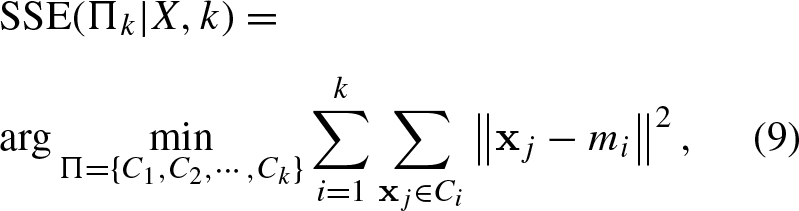

The above procedure shows how K-means clustering algorithm works with a given cluster number. However, it does not indicate how to determine the number of cluster. In essence, the number of cluster is an intrinsic nature and has nothing to do with the clustering algorithm. In clustering, Elbow method and Silhouette Coefficient are two most commonly used approaches to determine the proper cluster number for a given data set. Elbow method adopts SSE defined in Equation (9) as the criterion to choose the best cluster number. The core idea is that when the cluster number k increases, the degree of aggregation of each cluster gradually increases and hence SSE becomes progressively small. As k is less than the true value, the drop in SSE

Silhouette coefficient determines the best cluster number based on the cohesion and separation of the clustering. Specifically, for a sample


Calculating and averaging the Silhouette coefficients of all the samples, we derive the Silhouette coefficient score of the clustering results. Generally, the best cluster number is determined according to the largest Silhouette coefficient. However, an optimal clustering number resulting from Silhouette coefficient sometimes results in a clustering with large SSE. Therefore, the SSE of the clustering should be taken into account to determine the optimal number of clustering in practice.
After clustering, the rest question for cluster-based subsampling is how to allocate sample sizes among clusters for a given sampling size n. In principle, there are at least two factors needed to be considered in sample allocation. On the one hand, the larger objects the cluster contains, the more objects should be selected from the cluster. On the other hand, a cluster with larger variation should be sampled more objects so that more features of the cluster can be drawn. To minimize the variance of the subsamples sampling from clusters subject to the constraint


To sum up, to make the objects sampled more representative, we first adopt Elbow method and Silhouette coefficient method to determine the optimal number of clustering k. Then, a series of subsamples are formed by subsampling according to the optimal sample allocation scheme (17).
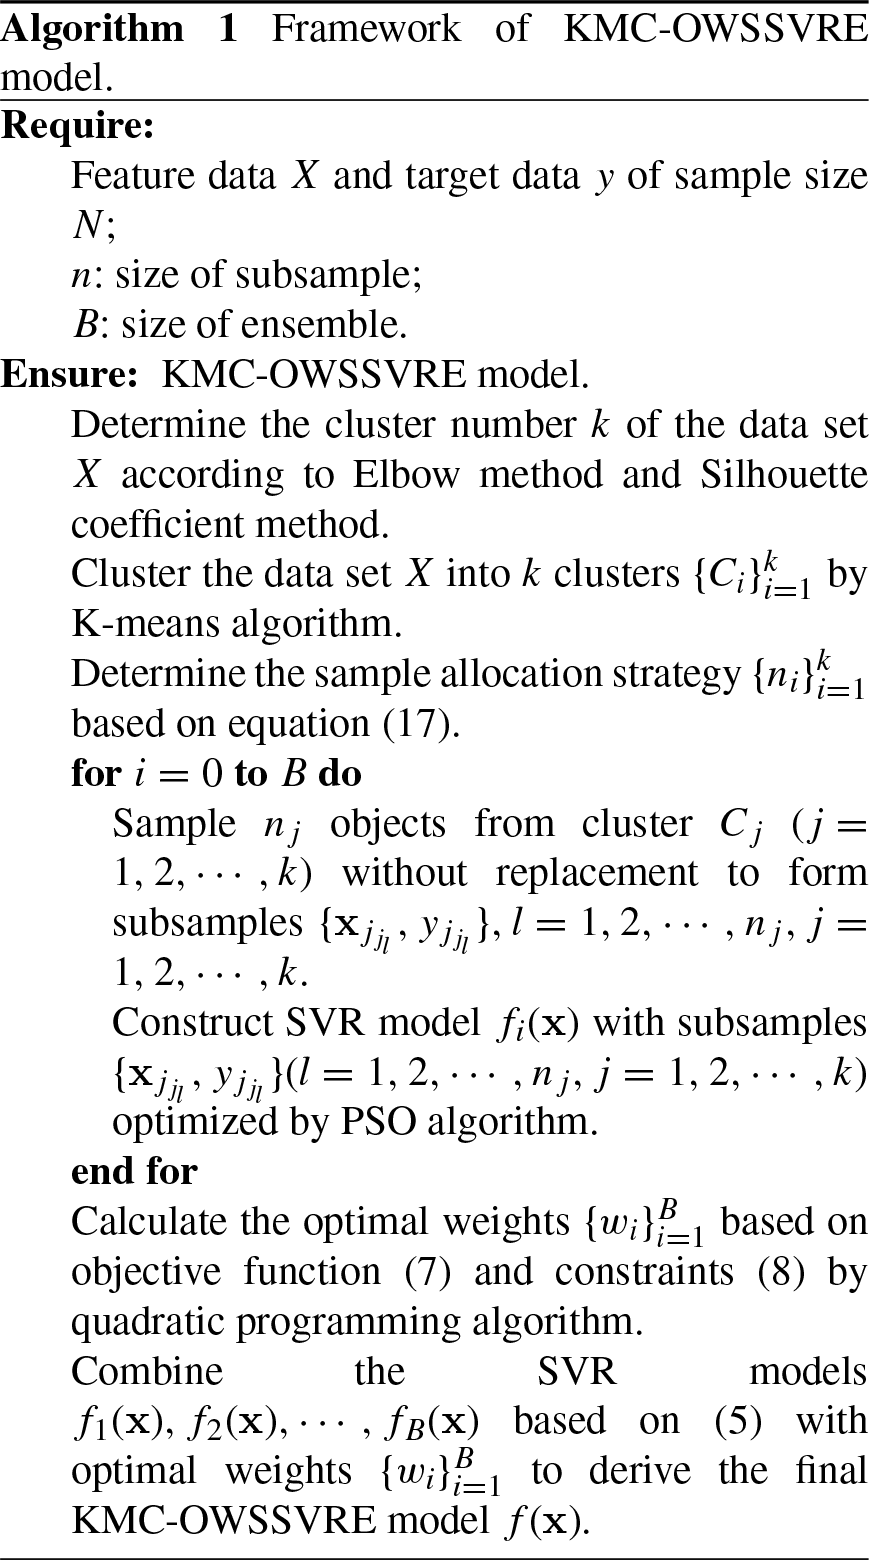
To improve the forecast accuracy as much as possible, we propose an optimal weight subsampled support vector regression ensemble model integrating K-means clustering (KMC-OWSSVRE). We first determine the cluster number according to Elbow method and use K-means clustering method to categorize the dataset into k clusters. Secondly, subsampling strategy is adopted to form a series of representative subsamples of fixed sample size. Thirdly, a series of subsampled SVR models are built optimized by PSO algorithm. Finally, all the subsampled SVR models are combined with optimal weights to form an optimal weight ensemble model. Specifically, the algorithm of KMC-OWSSVRE model is listed in Algorithm 1.
Empirical analysis
To verify the superiority of the KMC-OWSSVRE model, we use half hour electricity price and electricity load data from New South Wales and Queensland respectively for electricity price forecasting. Figure 2 shows half hour electricity prices and electricity loads in New South Wales from May 1, 2007 to June 1, 2007. Figure 3 shows half hour electricity prices and electricity loads in Queensland from August 1, 2007 to September 1, 2007. All results of this study were obtained in R4.1.2 and performed on a laptop with Intel Core(TM) i5-6300HQ CPU@2.30 GHz ×4, 8 GB of RAM.
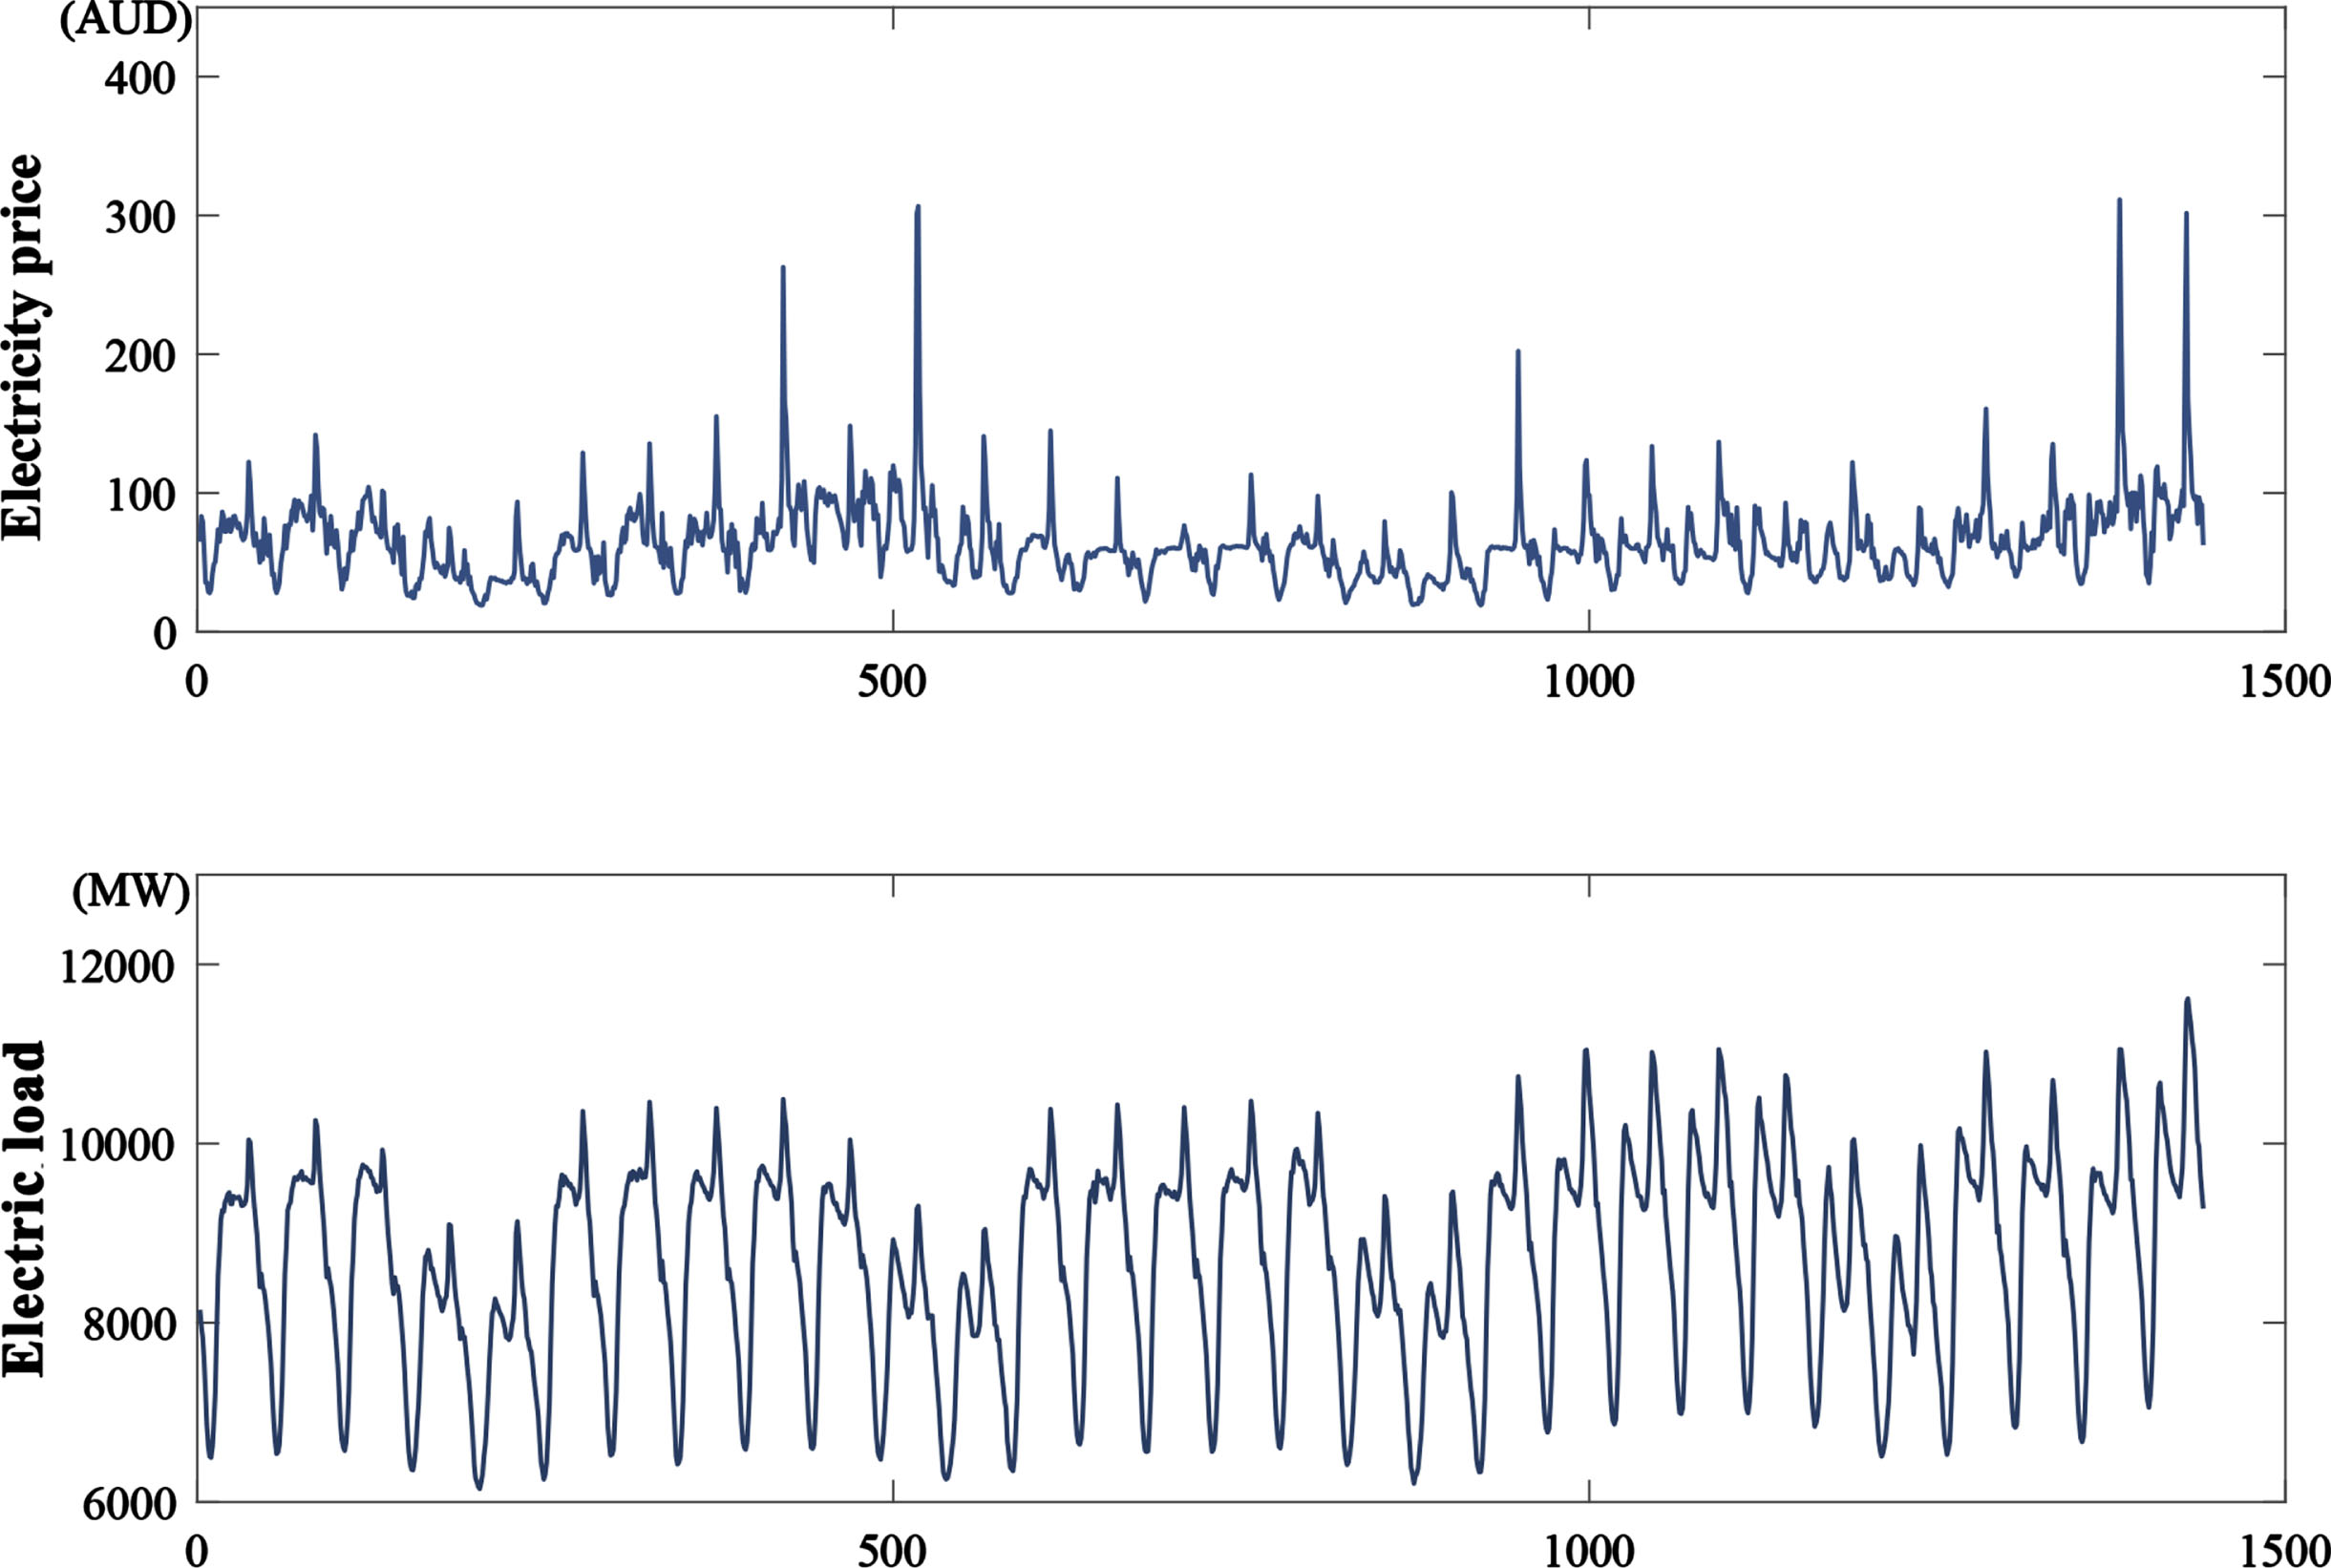
Half-hour electricity price and electric load of New South Wales in Australia from May 1, 2007 to June 1, 2007.

Half-hour electricity price and electric load of Queensland in Australia from August 1, 2007 to September 1, 2007.
We have used root mean square error (RMSE), mean absolute error (MAE) and mean absolute percentage error (MAPE) in our research experiments to evaluate the performance of the proposed algorithm. 


Before modelling with stastistical model, we need to implement data preprocessing for the data set including seasonal decomposition, phase space reconstruction and normalization.
Seasonal decomposition
From top panel of Figs. 2 and 3, we see that the data are characteristics of certain business cycle. Intuitively, the data are sampled half-hourly and hence follow certain regularity. Therefore, seasonal decomposition algorithms can be used to remove the seasonality of the data. Classical seasonal decomposition has an important place in time series analysis. However, it also has some drawbacks, such as the inability to derive moving average for the very beginning and last part of the data, the defect that the period is not allowed to change over time, and so on. Dagum and Bianconcini [23] proposed a modified X-11 decomposition to overcome some of the shortcomings of the classical seasonal decomposition by adjusting seasonally for quarterly and monthly time series data.
The additive X-11 decomposition can be expressed as:
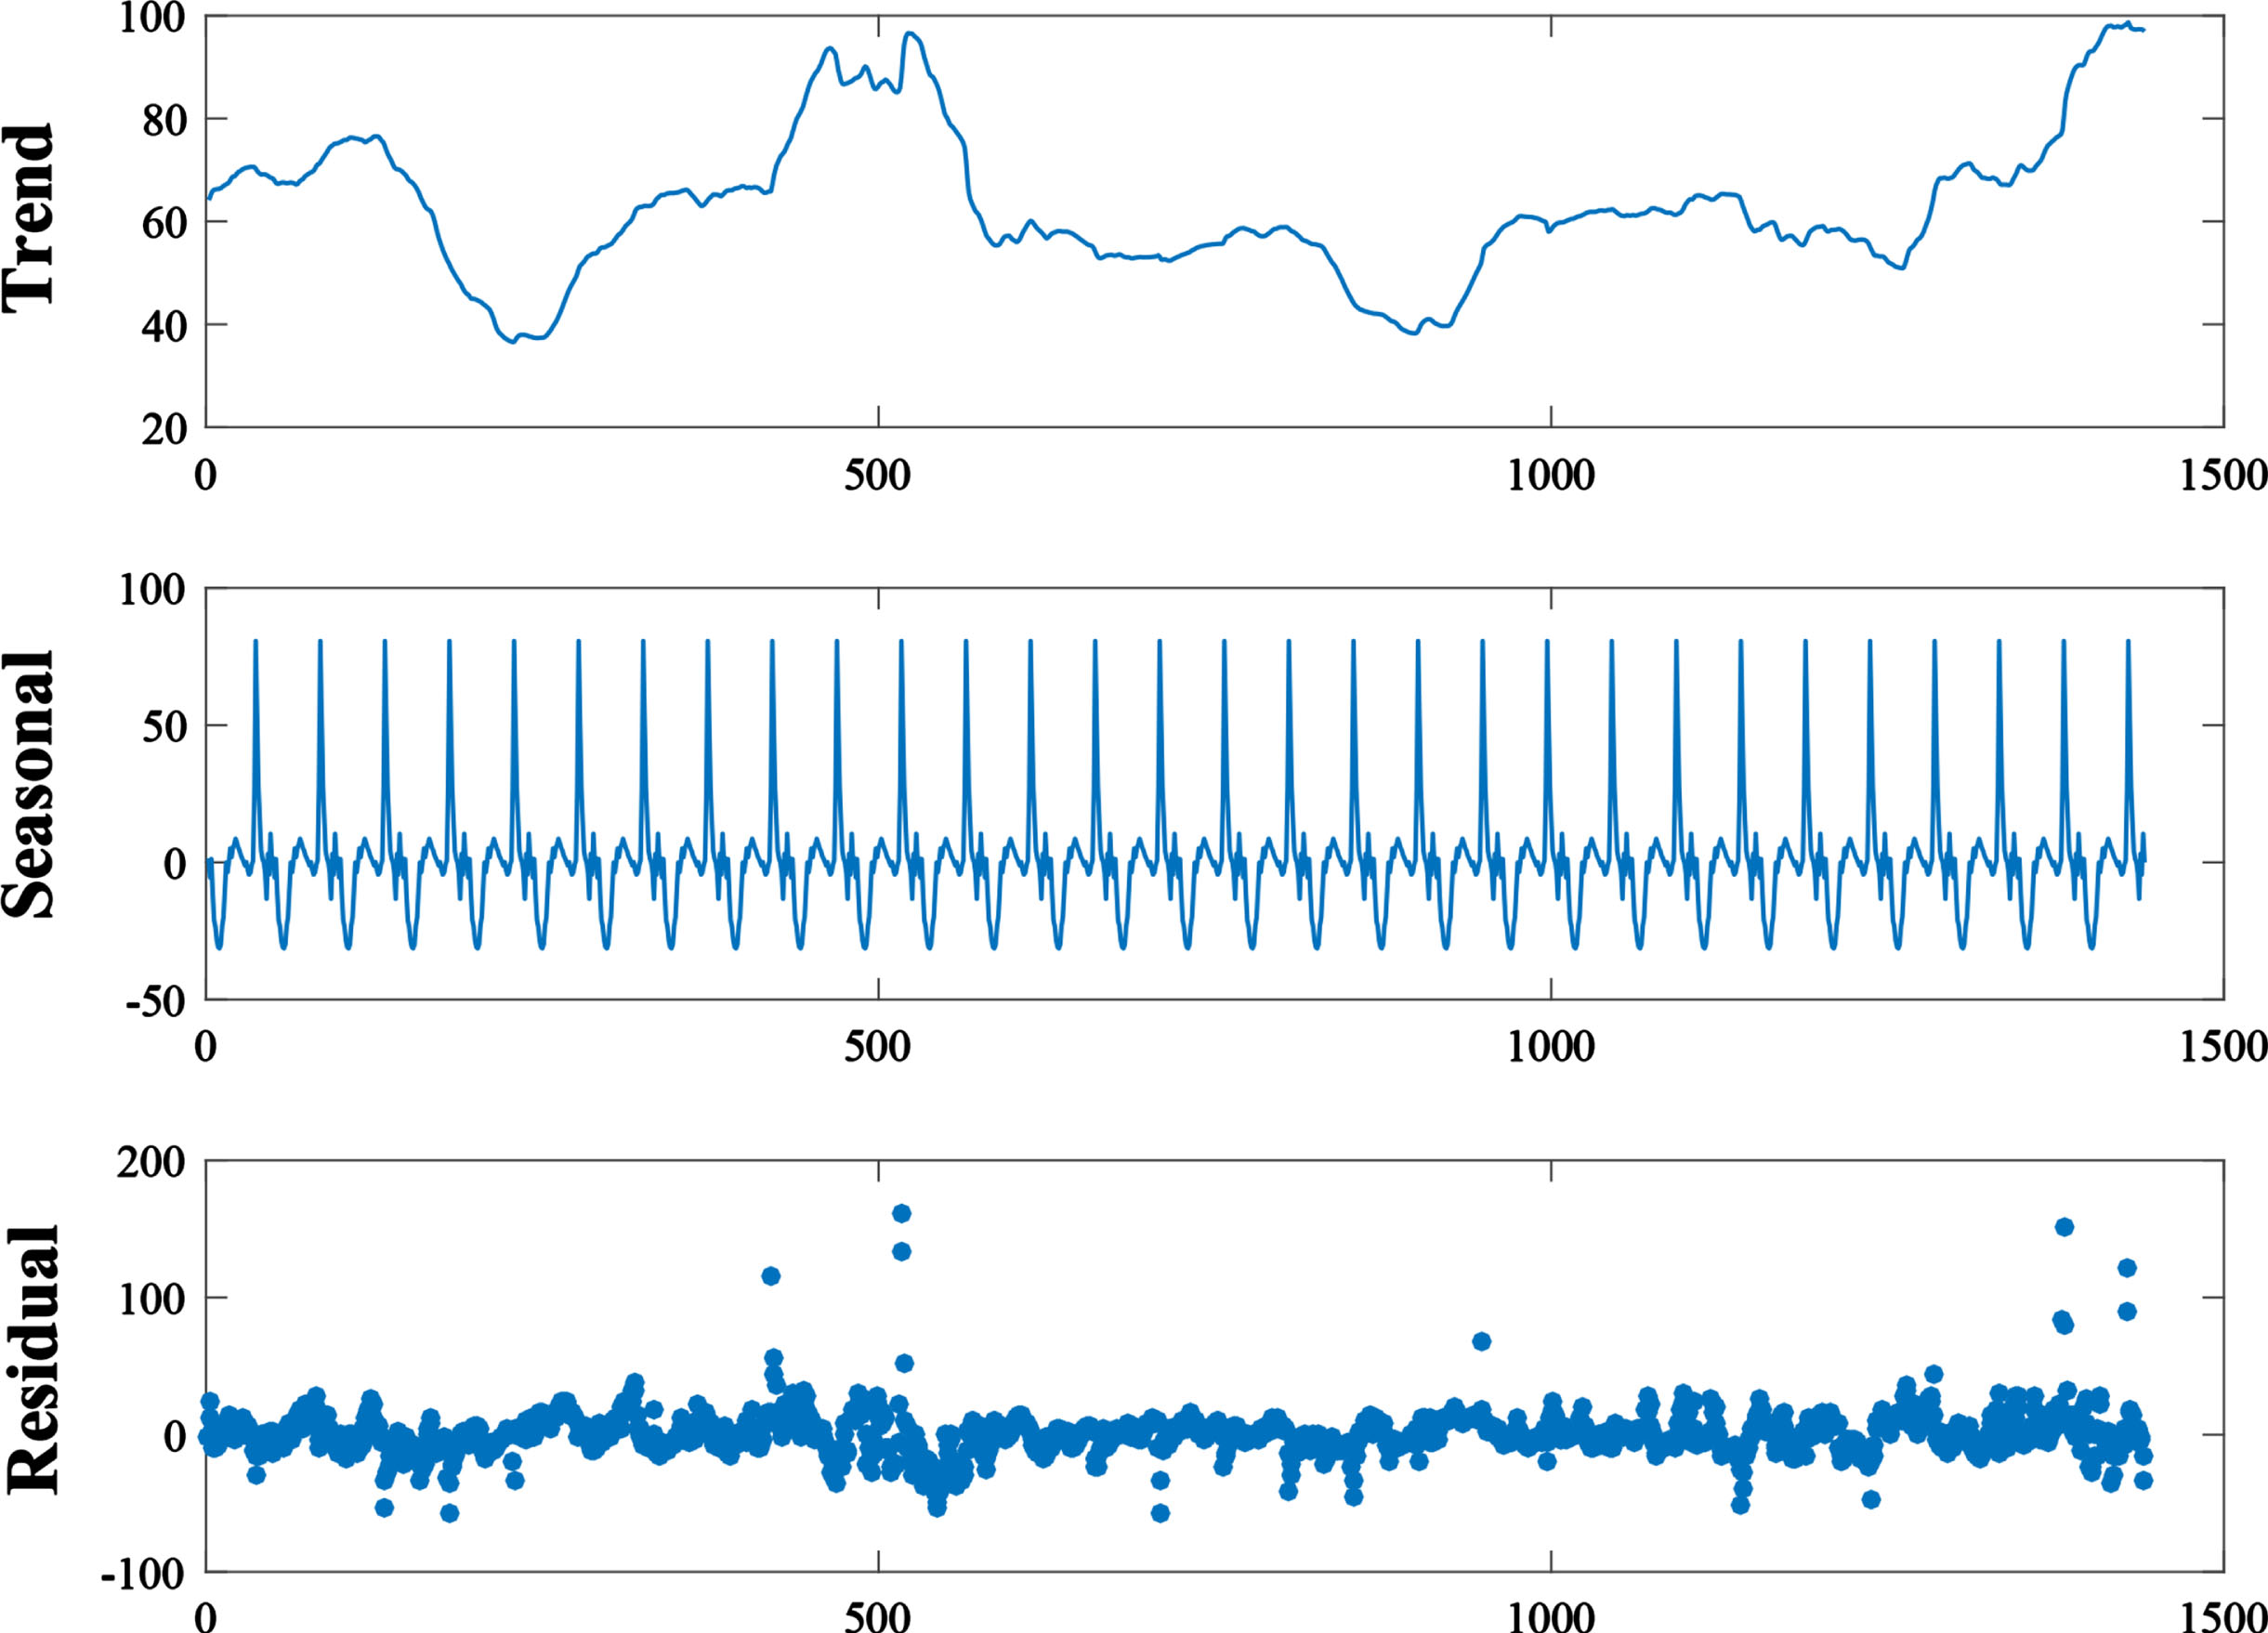
Three components based on seasonal decomposition of electricity price data of New South Wales in Australia.
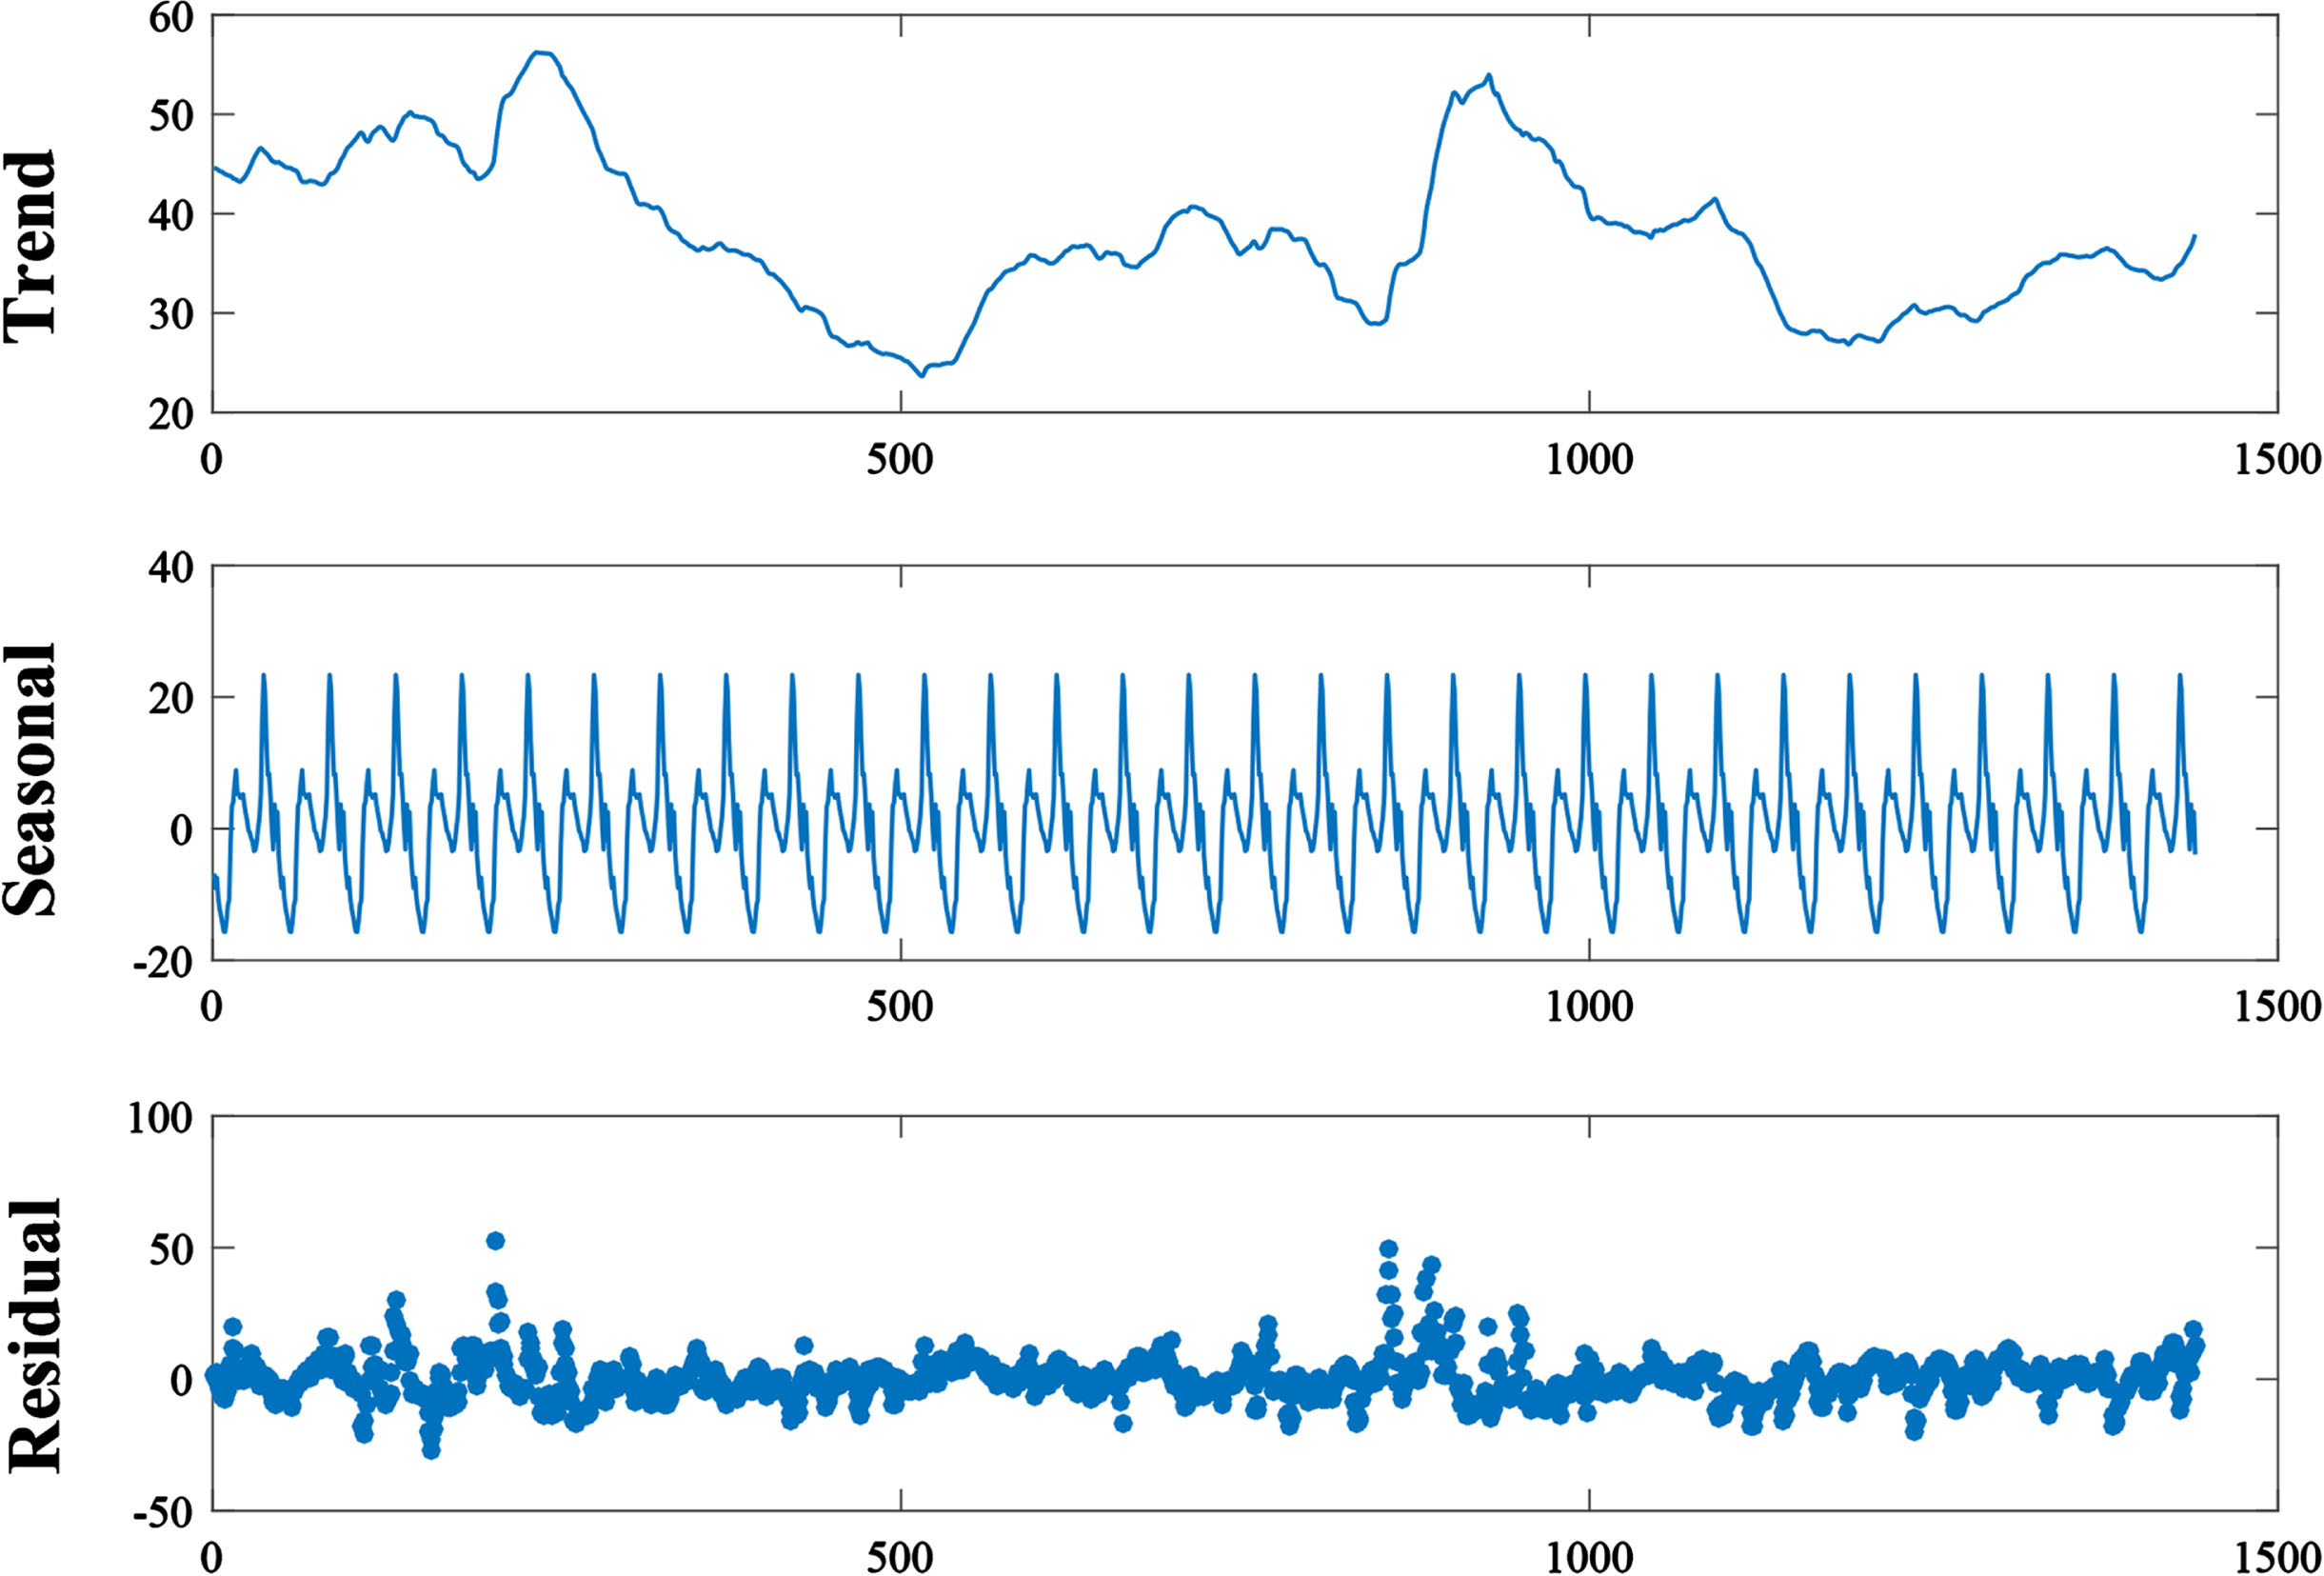
Three components based on seasonal decomposition of electricity price data of Queensland in Australia.
After seasonal decomposition, three time series, trend-cycle component
xt = (trendt , residt , loadt )

With multi-dimension
In the paper, we simply set d = 3. Hence, the input data
Before the construction of data modeling, it is crucial to perform the standardized data preprocessing. In this paper, Z-score standardization is used to make each element of the feature data calibrate to zero mean and unit variance. That is, for each x, it can be scaled as follows:


Case 1: Electricity price data of New South Wales
In the experiment, we randomly divide the dataset into a training set and a test set. The training set consists of 90% of the data, while the test set contains the remaining 10% . The training set is used to determine the parameters for our experiment. In KMC-OWSSVRE model, three parameters, the number of clusters k, the size of subsample n and the number of subsamples B, need to be determined. As can be seen from the left panel of Fig. 6, the knee point of the SSE curve indicates that the optimal cluster number k is 3. From the right panel of Fig. 6, the Silhouette coefficient maximizes at k = 2. However, the SSE at k = 2 is large and hence the secondary maximum point k = 3 is adopted.
Figure 7 illustrates the performance of our KMC-OWSSVRE model with different ensemble size B when the subsample size n = 120. We can see that RMSE declines sharply when the ensemble size B is less than 20 and then decreases slowly as B increases larger than 20. For mean absolute error (MAE), it shows a slow decline and reaches stability when B is larger than 30. Therefore, we choose B = 30 in the experiment. Figure 8 depicts the performance of the KMC-OWSSVRE model with different subsample size under the fixed ensemble number 30. The results shows that RMSE, MAE and MAPE go down slowly as the subsample size n increases and nearly reach stability at 120. Therefore, we take n = 120 in our experiment.
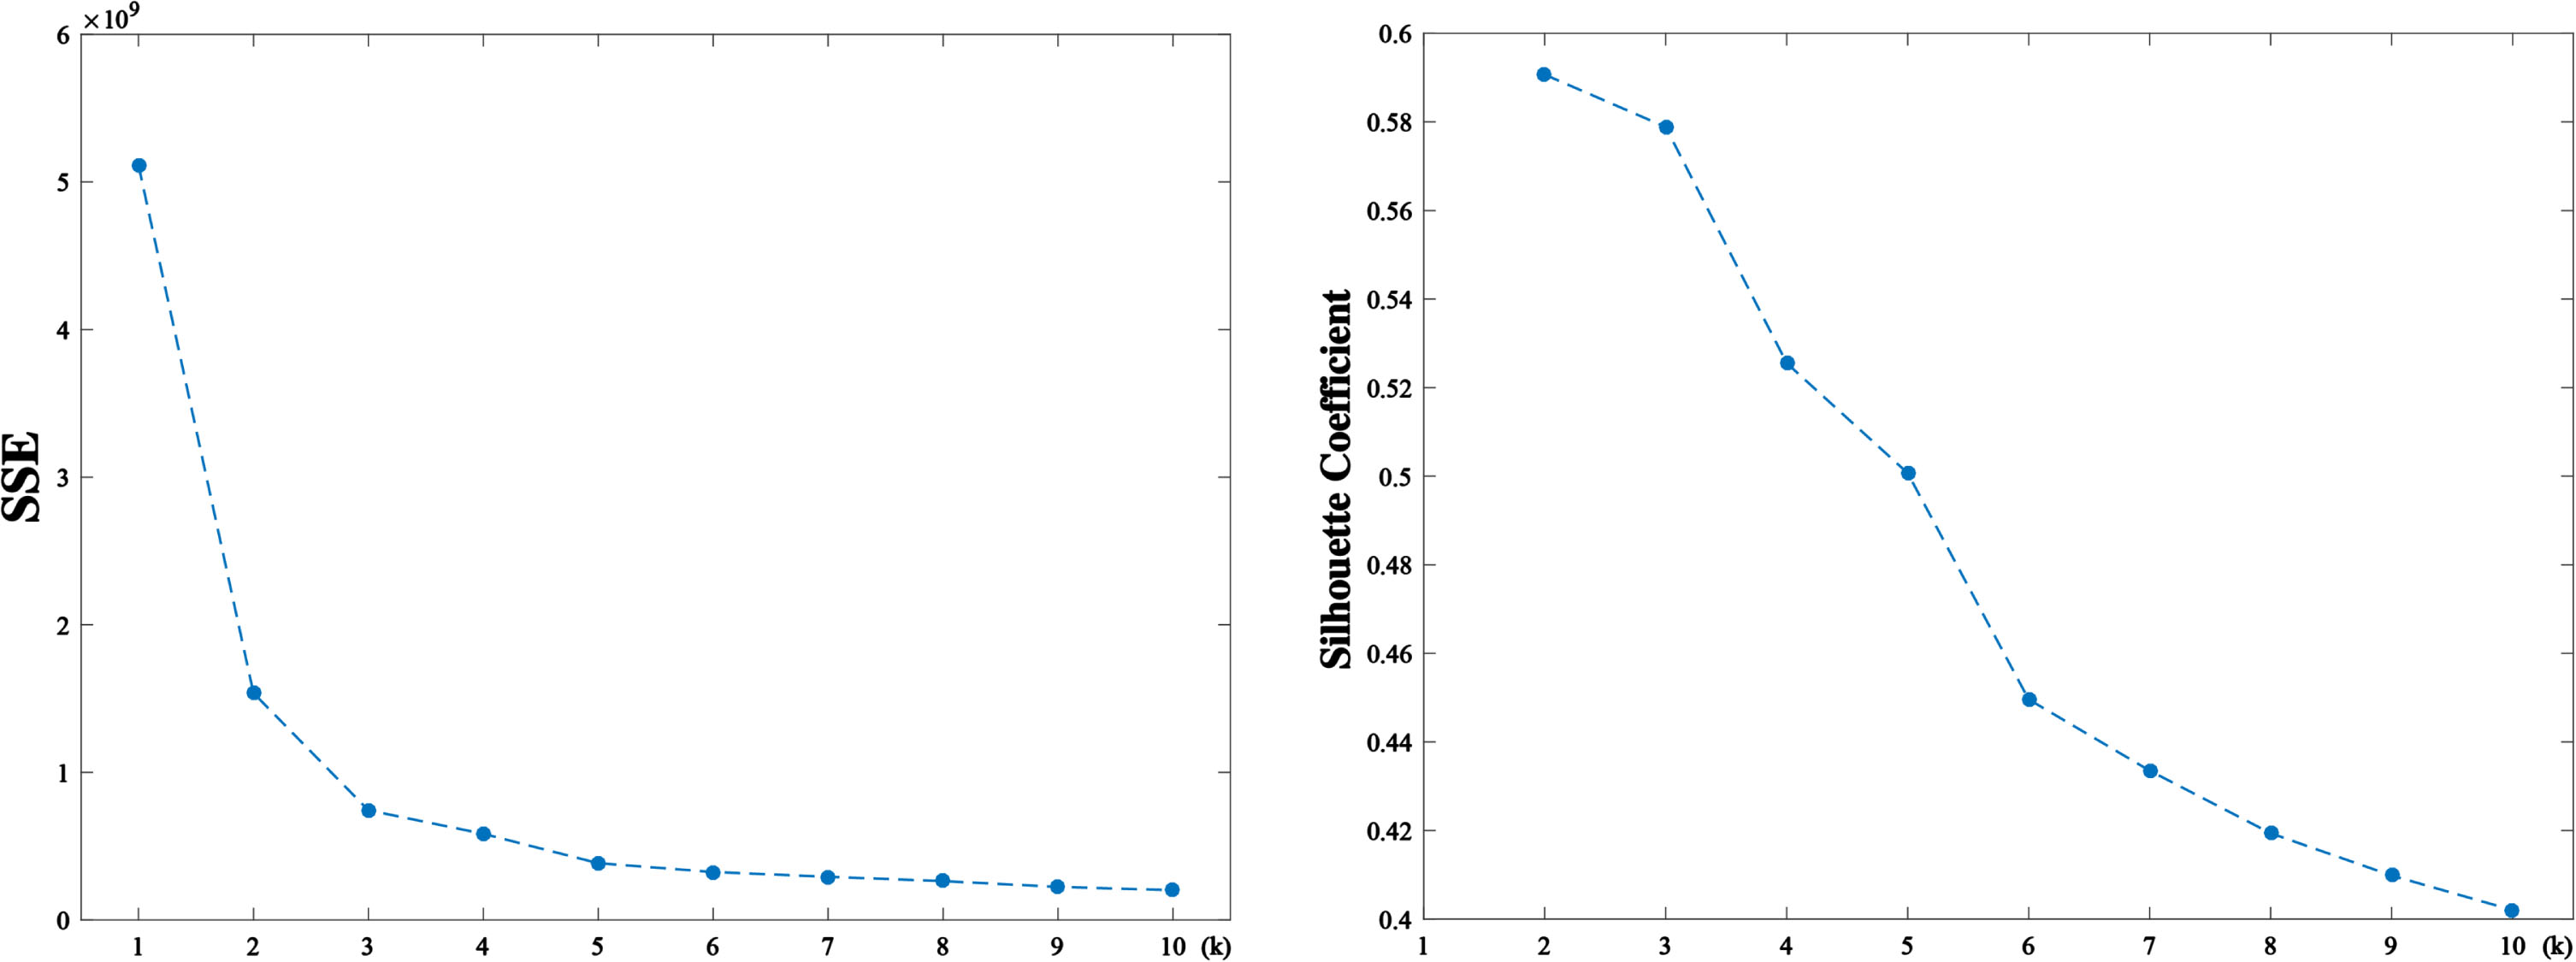
Left: The sum of squares of errors (SSE) in different cluster number k. Right: Silhouette coefficients in different cluster number k.
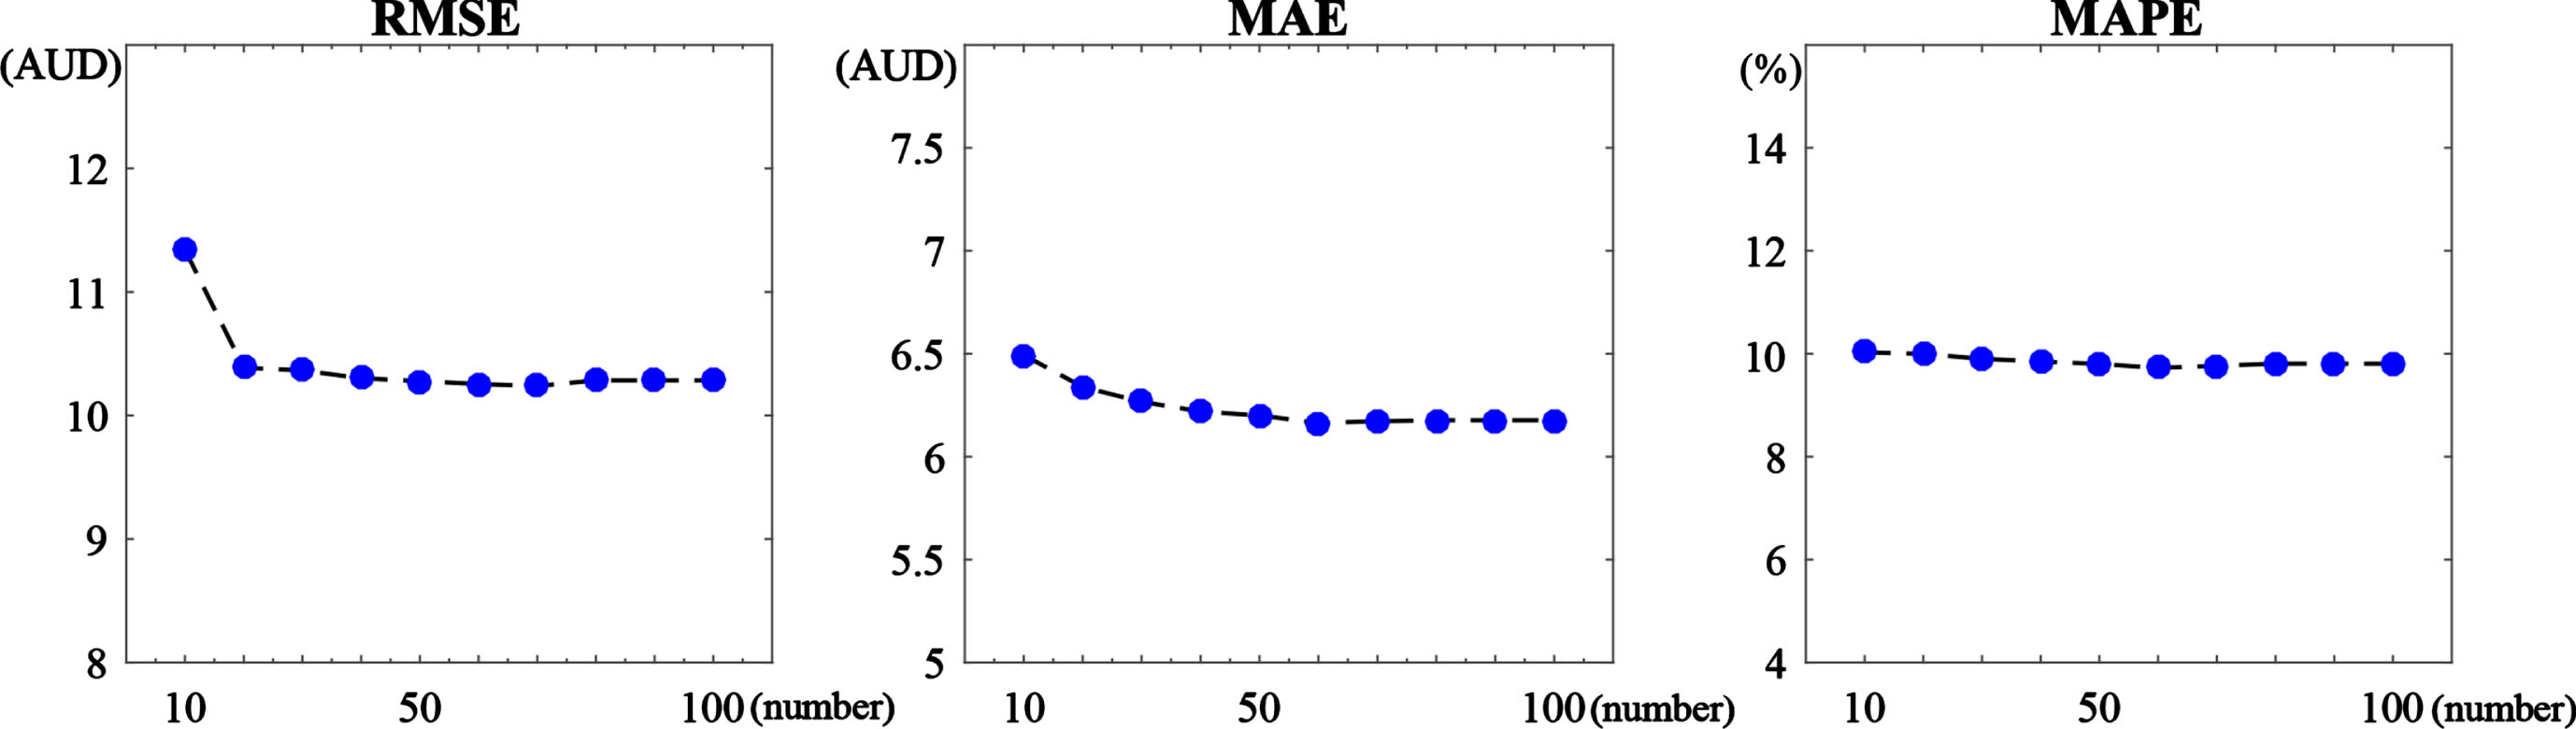
For the New South Wales electricity price dataset, RMSE, MAE and MAPE with respect to ensemble size B at fixed subsample size n = 120.
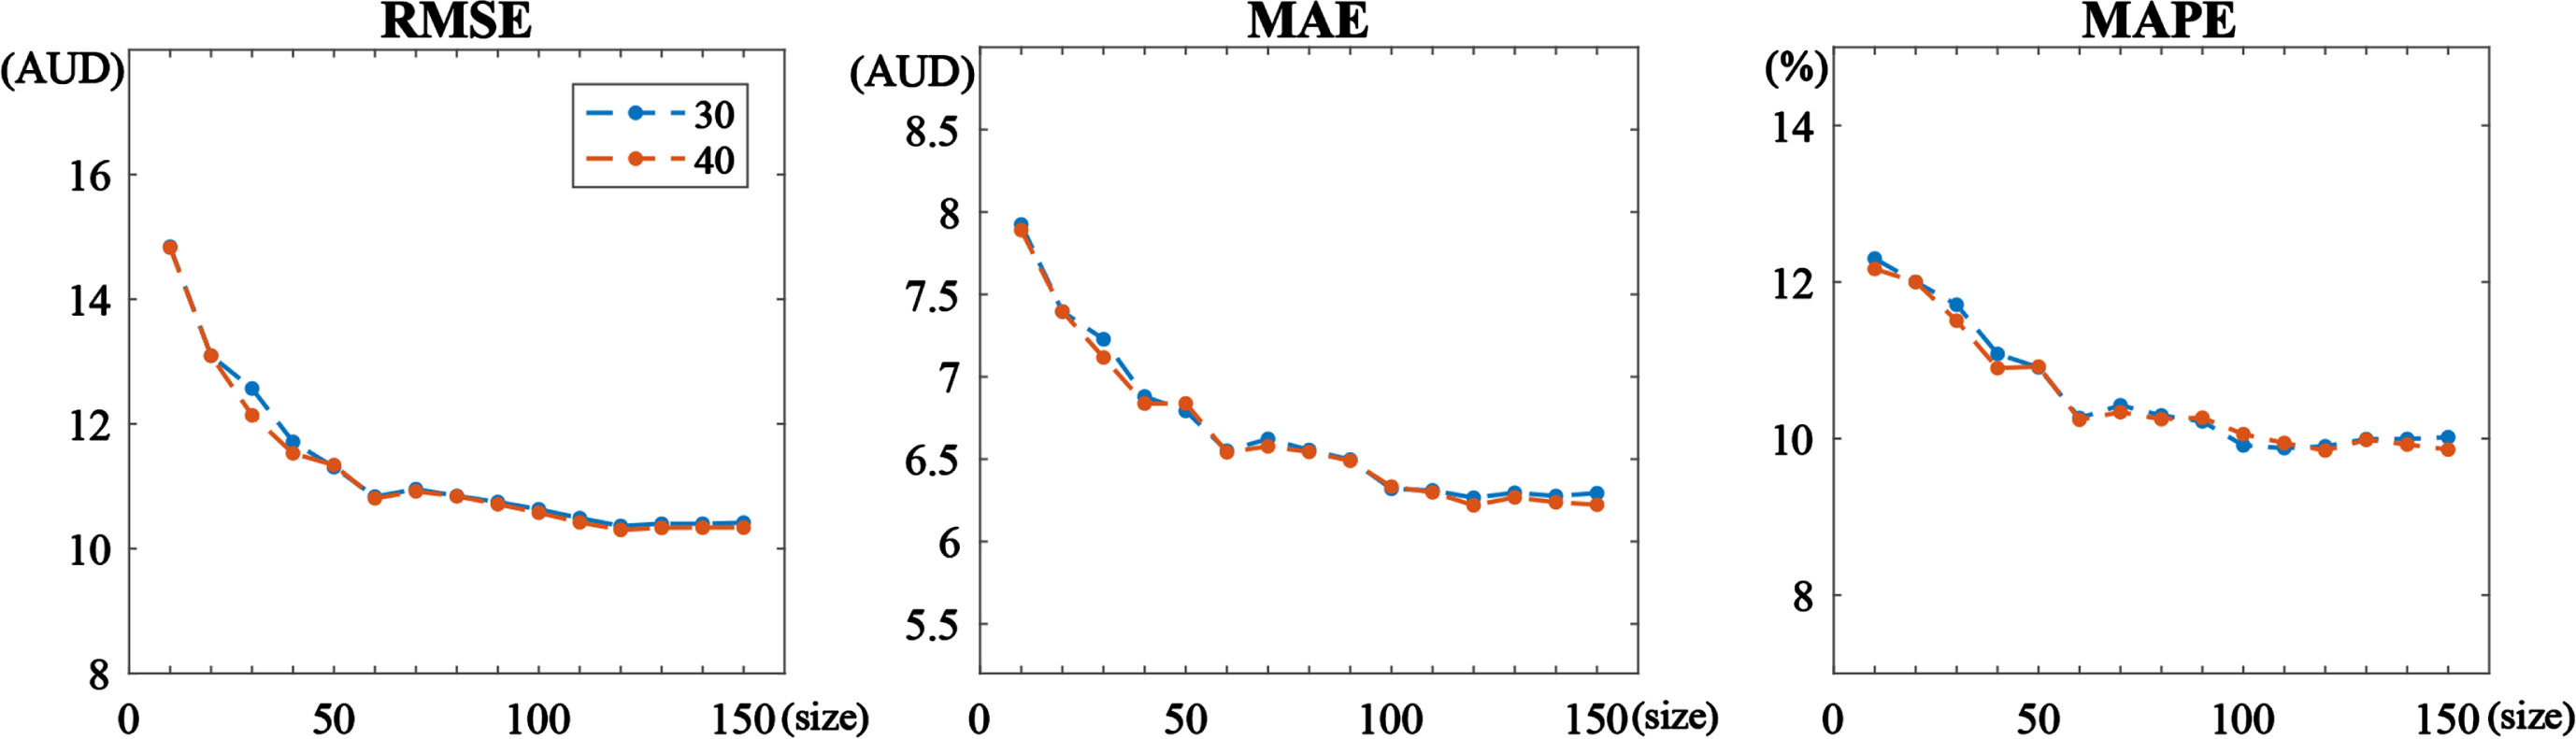
For the New South Wales electricity price dataset, RMSE, MAE and MAPE with respect to subsample size n at fixed ensemble size B = 30.
Similarly, we randomly divide 90% of the Queensland data set into the training set and the rest into the test set. From the knee point of the SSE curve and different Silhouette coefficients in Fig. 9, we can conclude that the optimal cluster number k is 3.
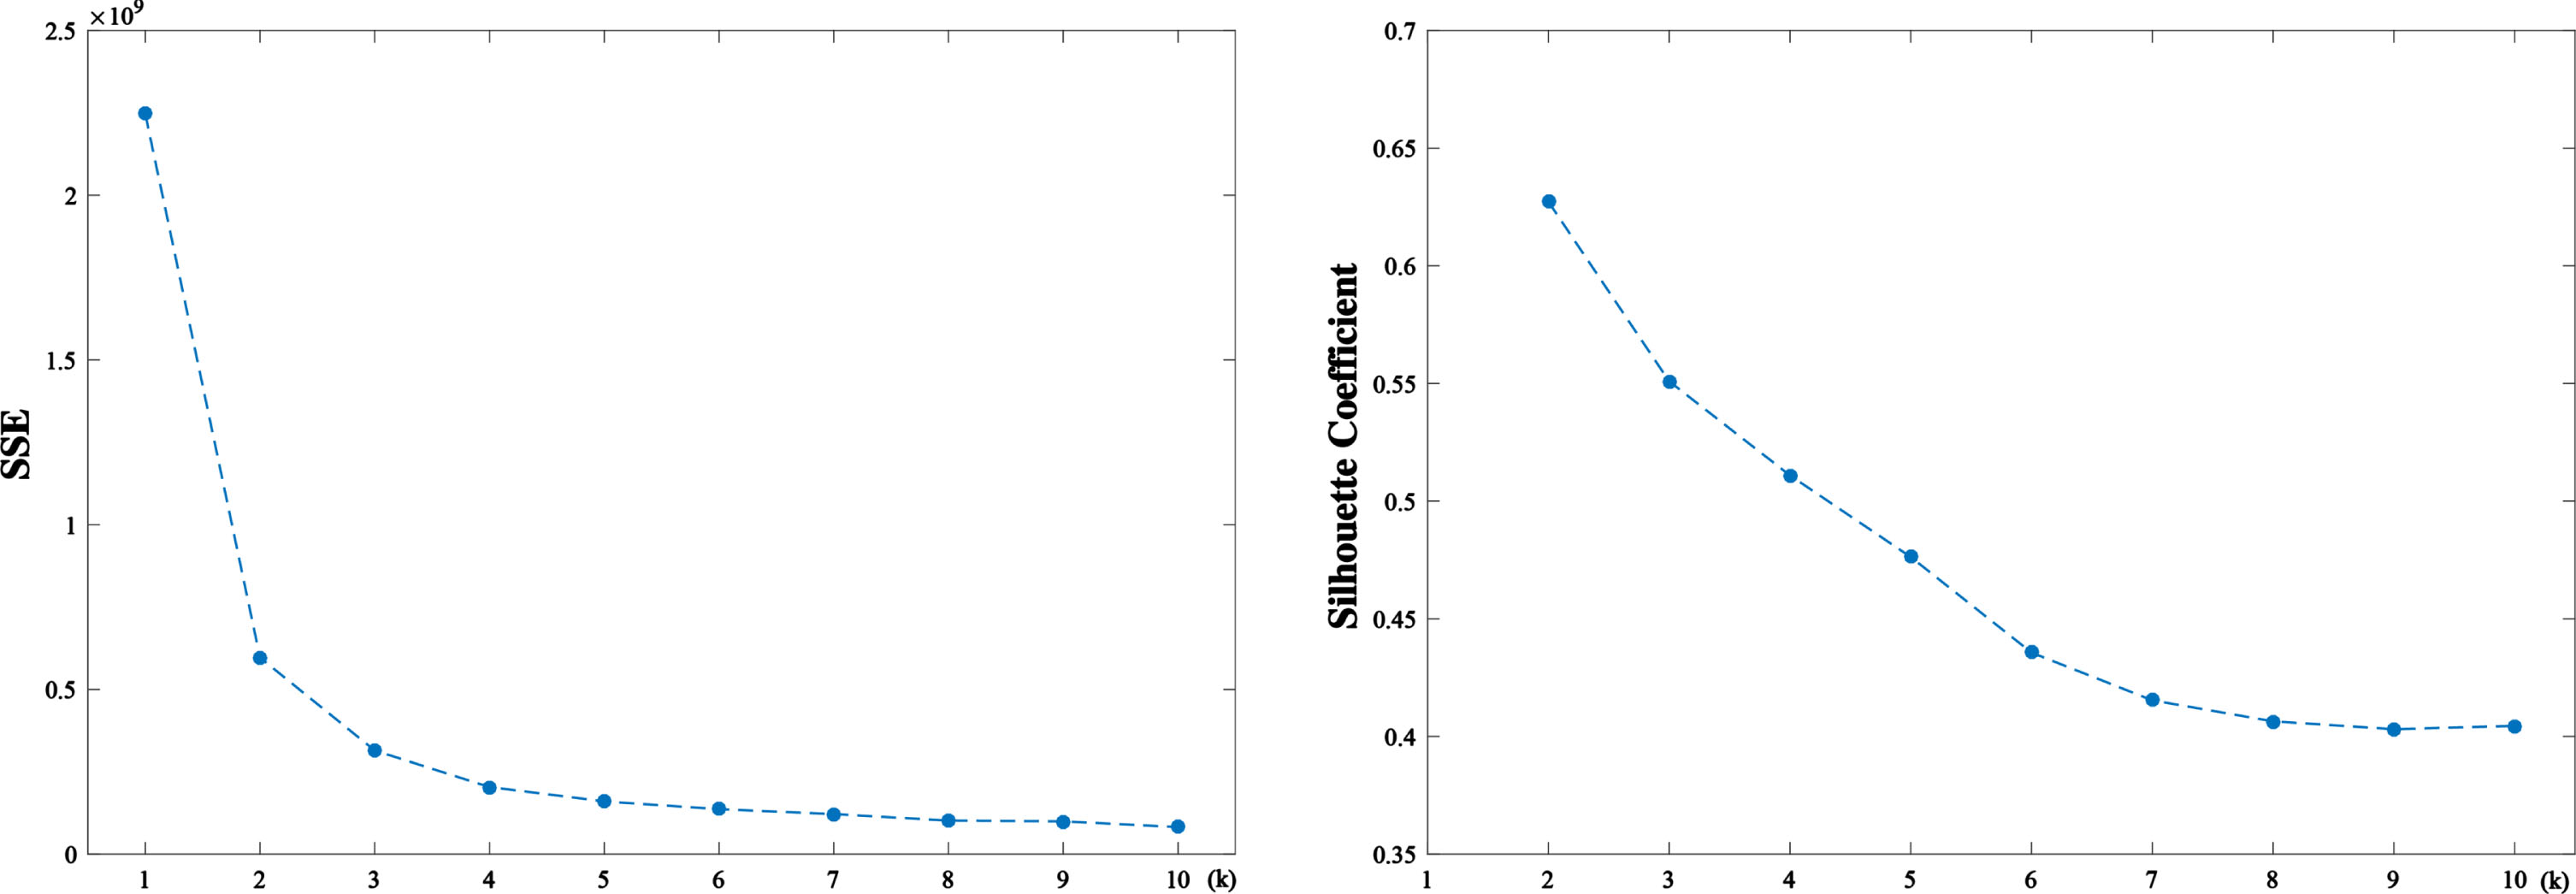
Left: The sum of squares of errors (SSE) in different cluster number k. Right: Silhouette coefficients in different cluster number k.
Fig. 10 shows the performance of our KMC-OWSSVRE model with different ensemble size B when the subsample size n takes 80. We can see that three error metrics decline speedily when the ensemble size B is less than 50 and then decreases slowly as B increases larger than 50. Therefore, B = 50 is an appropriate value for the ensemble size. Figure 11 depicts the performance of the KMC-OWSSVRE model with different subsample size at fixed ensemble number 50. The results shows that RMSE, MAE and MAPE decline as the subsample size n increases and nearly reach stability at 80. Therefore, we take n = 80 in our experiment.
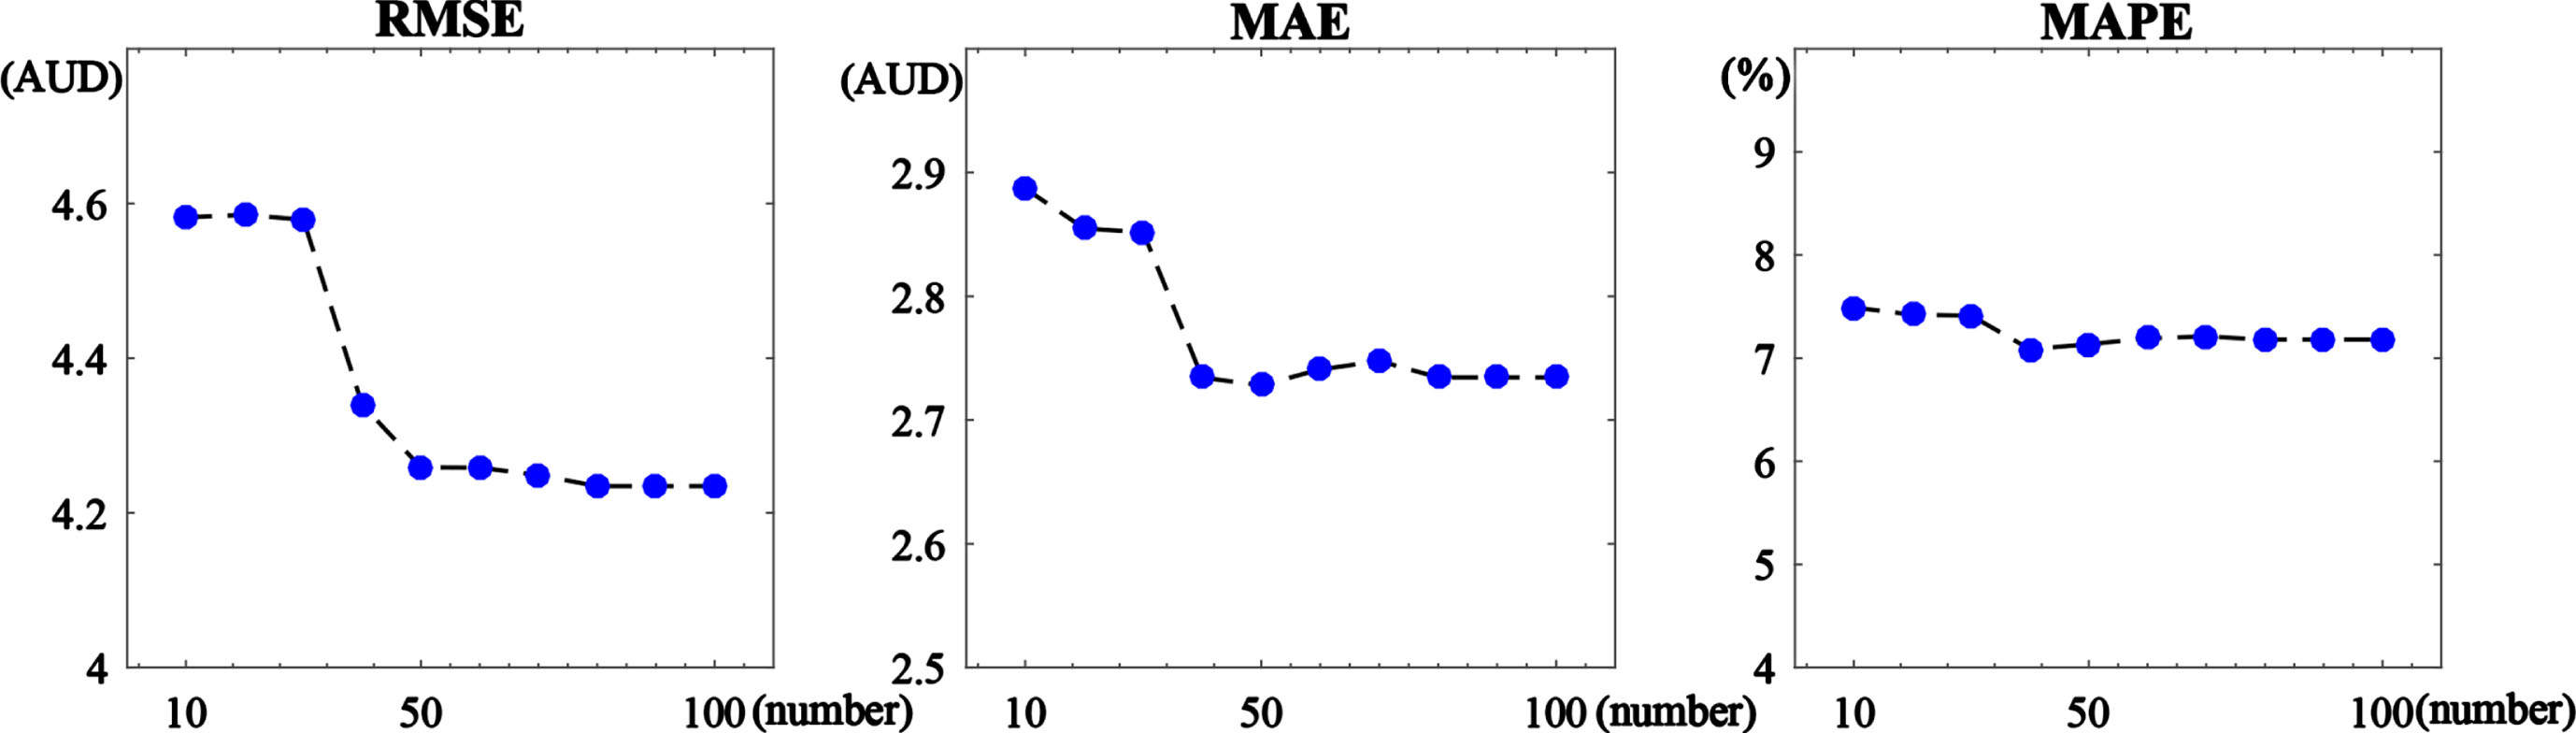
For the Queensland electricity price dataset, RMSE, MAE and MAPE with respect to ensemble size B at fixed subsample size n = 80.
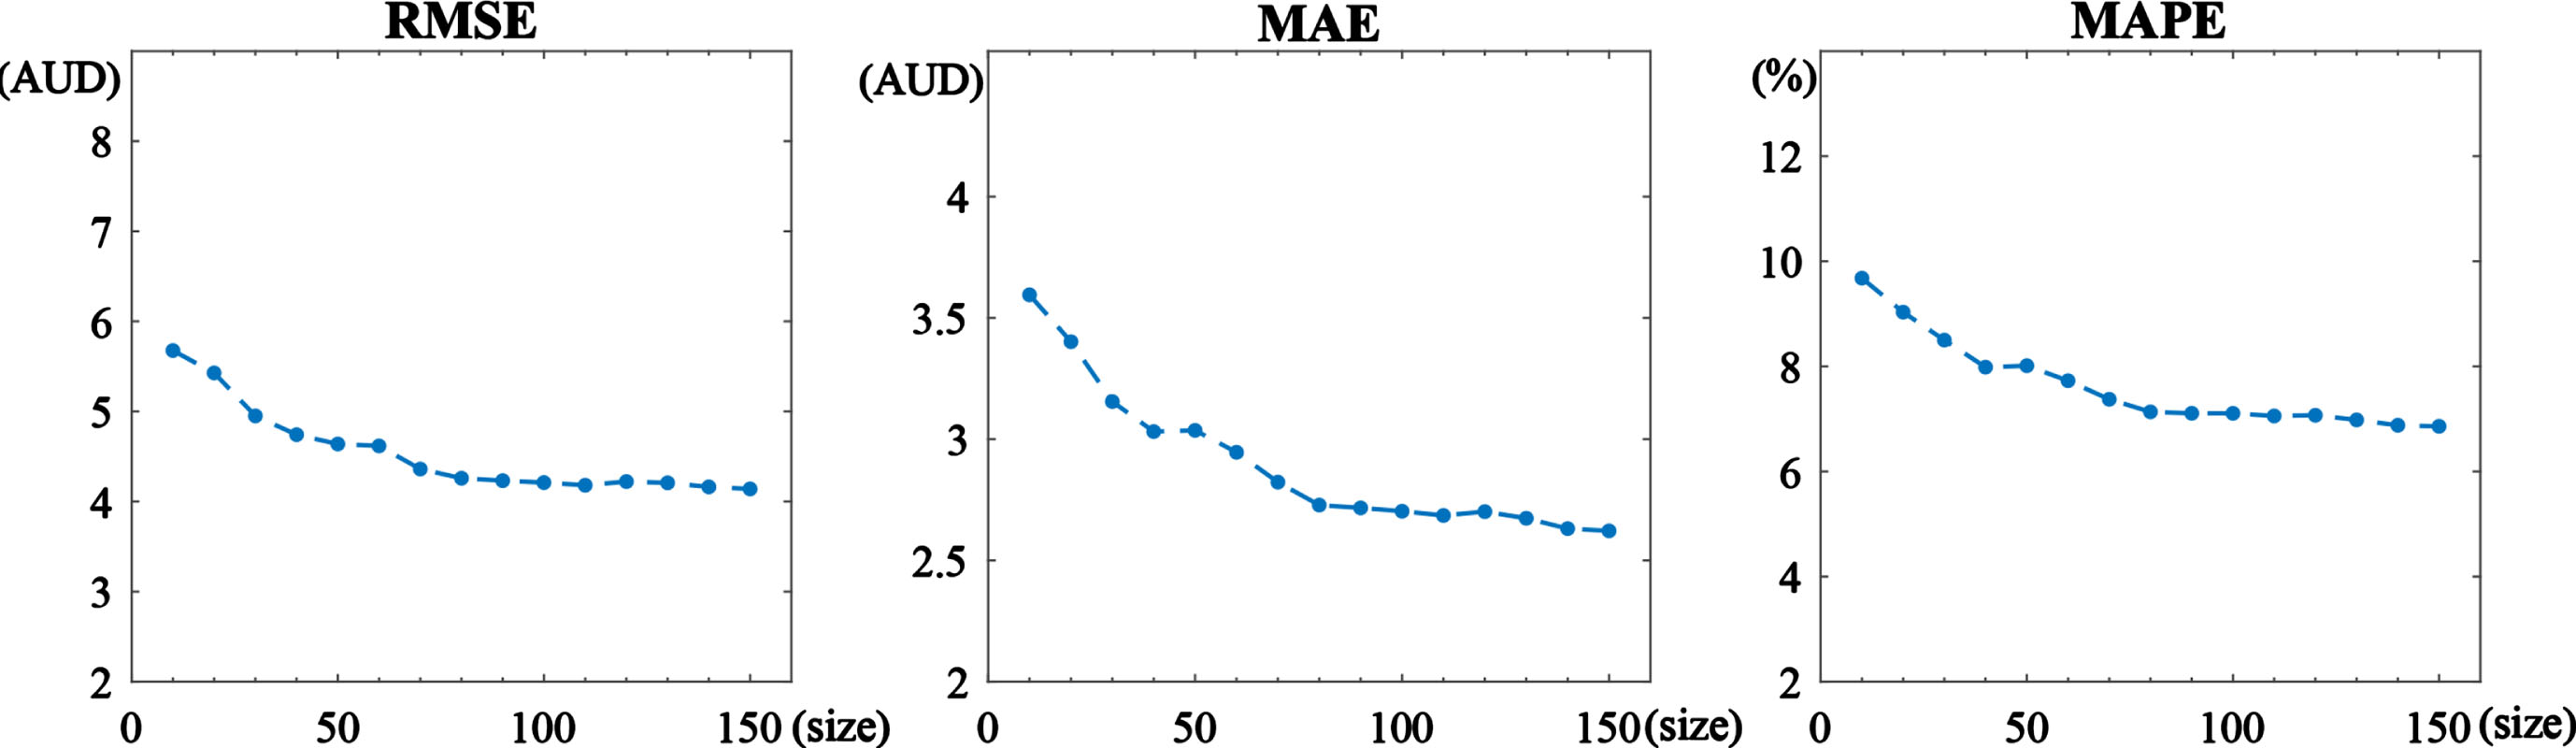
For the Queensland electricity price data set, RMSE, MAE and MAPE with respect to subsample size n at fixed ensemble size B = 50.
Fig. 12 shows forecast results for half hour electricity prices in New South Wales and Queensland. Table 1 lists the prediction errors of KMC-OWSSVRE model on train set and test set. As we can see, KMC-OWSSVRE model performs better on the test set than train set in term of RMSE, MAE and MAPE. Therefore, it shows that KMC-OWSSVRE model has an outstanding generalization ability. Panel (a) and panel (b) in Fig. 13 depict the 95% confidence interval length of the KMC-OWSSVRE model for the dataset of New South Wales and Queensland, respectively. The relatively small interval length of the KMC-OWSSVRE model suggests that the model has robust performance.
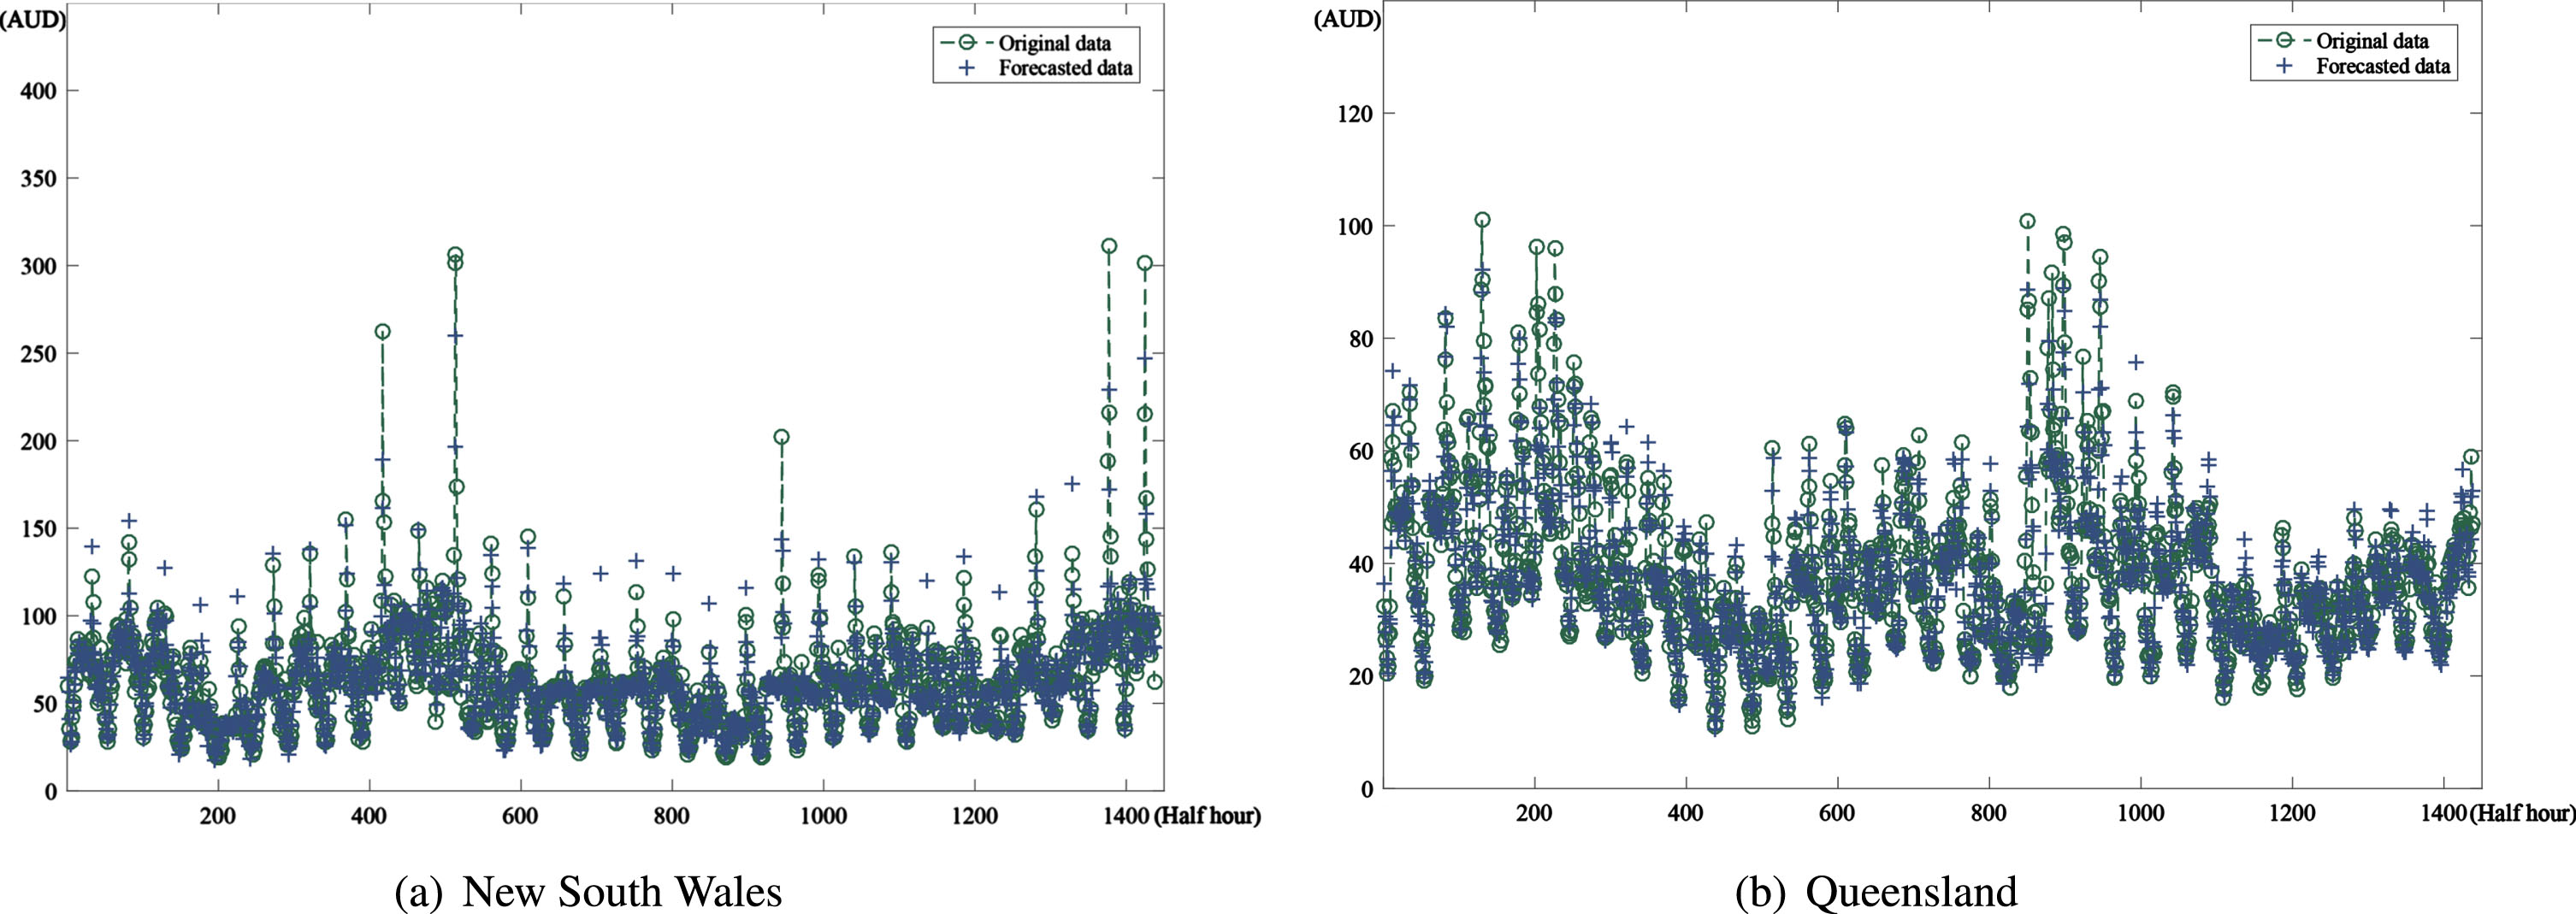
Electricity price prediction with KMC-OWSSVRE based on the data.
Performance of KMC-OWSSVRE model on train set and test set

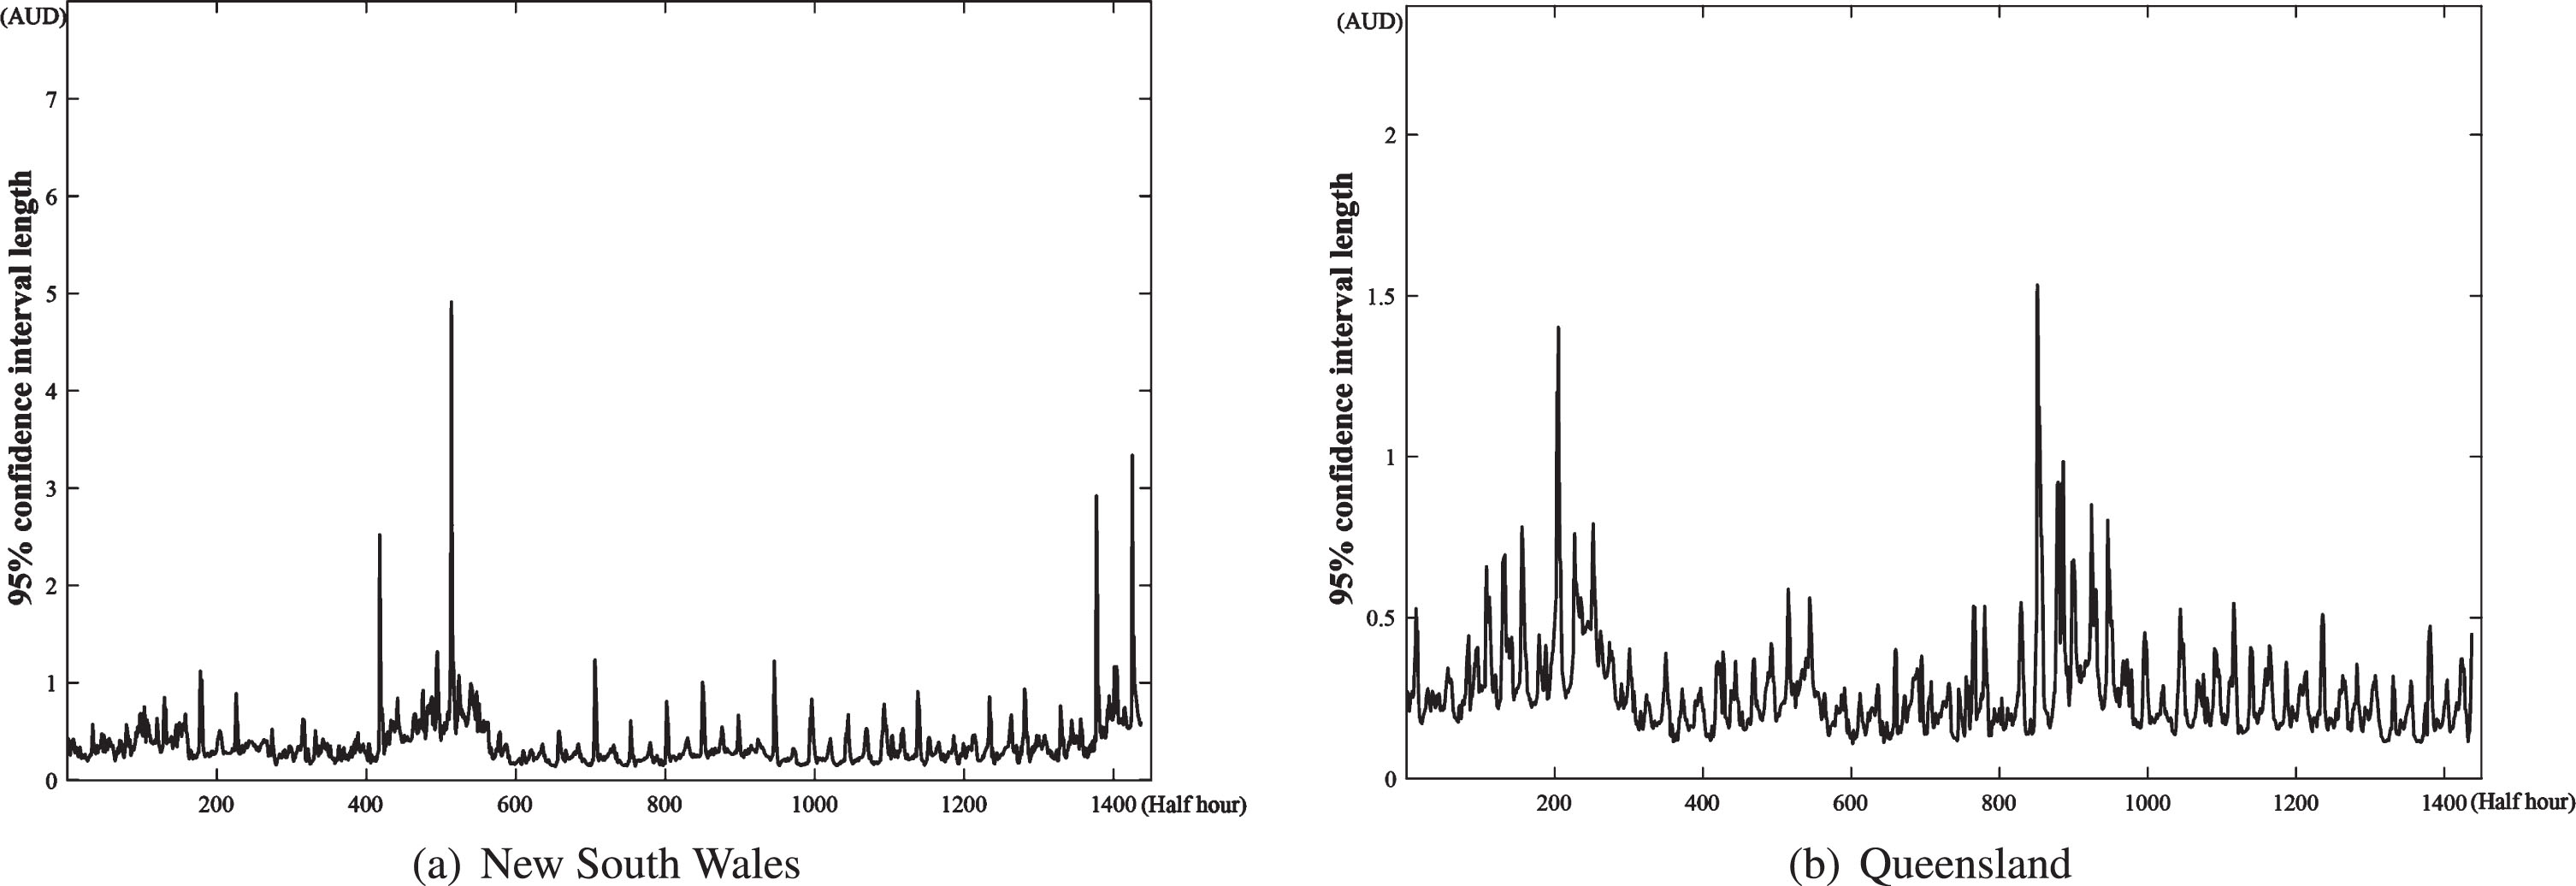
95% confidence interval length of electricity price prediction with KMC-OWSSVRE.
Fig. 14 and Fig. 15 portray the performance of three models (SSVRE model, KMC-SSVRE model and KMC-OWSSVRE model) on the test data of New South Wales and Queensland, respectively. From the two figures, we can come to the following conclusions: (i) Compared the RMSEs, MAEs and MAPEs of KMC-SSVRE and SSVRE, we see that the K-means clustering algorithm makes the subsamples be more representative and hence contributes to enhancing the prediction ability. (ii) From the results of KMC-OWSSVRE and KMC-SSVRE, optimal weight ensemble strategy can further improve the prediction performance of the ensemble model. To sum up, the K-means clustering subsampling technique and optimal weight program can jointly lift the efficacy of SSVRE model.
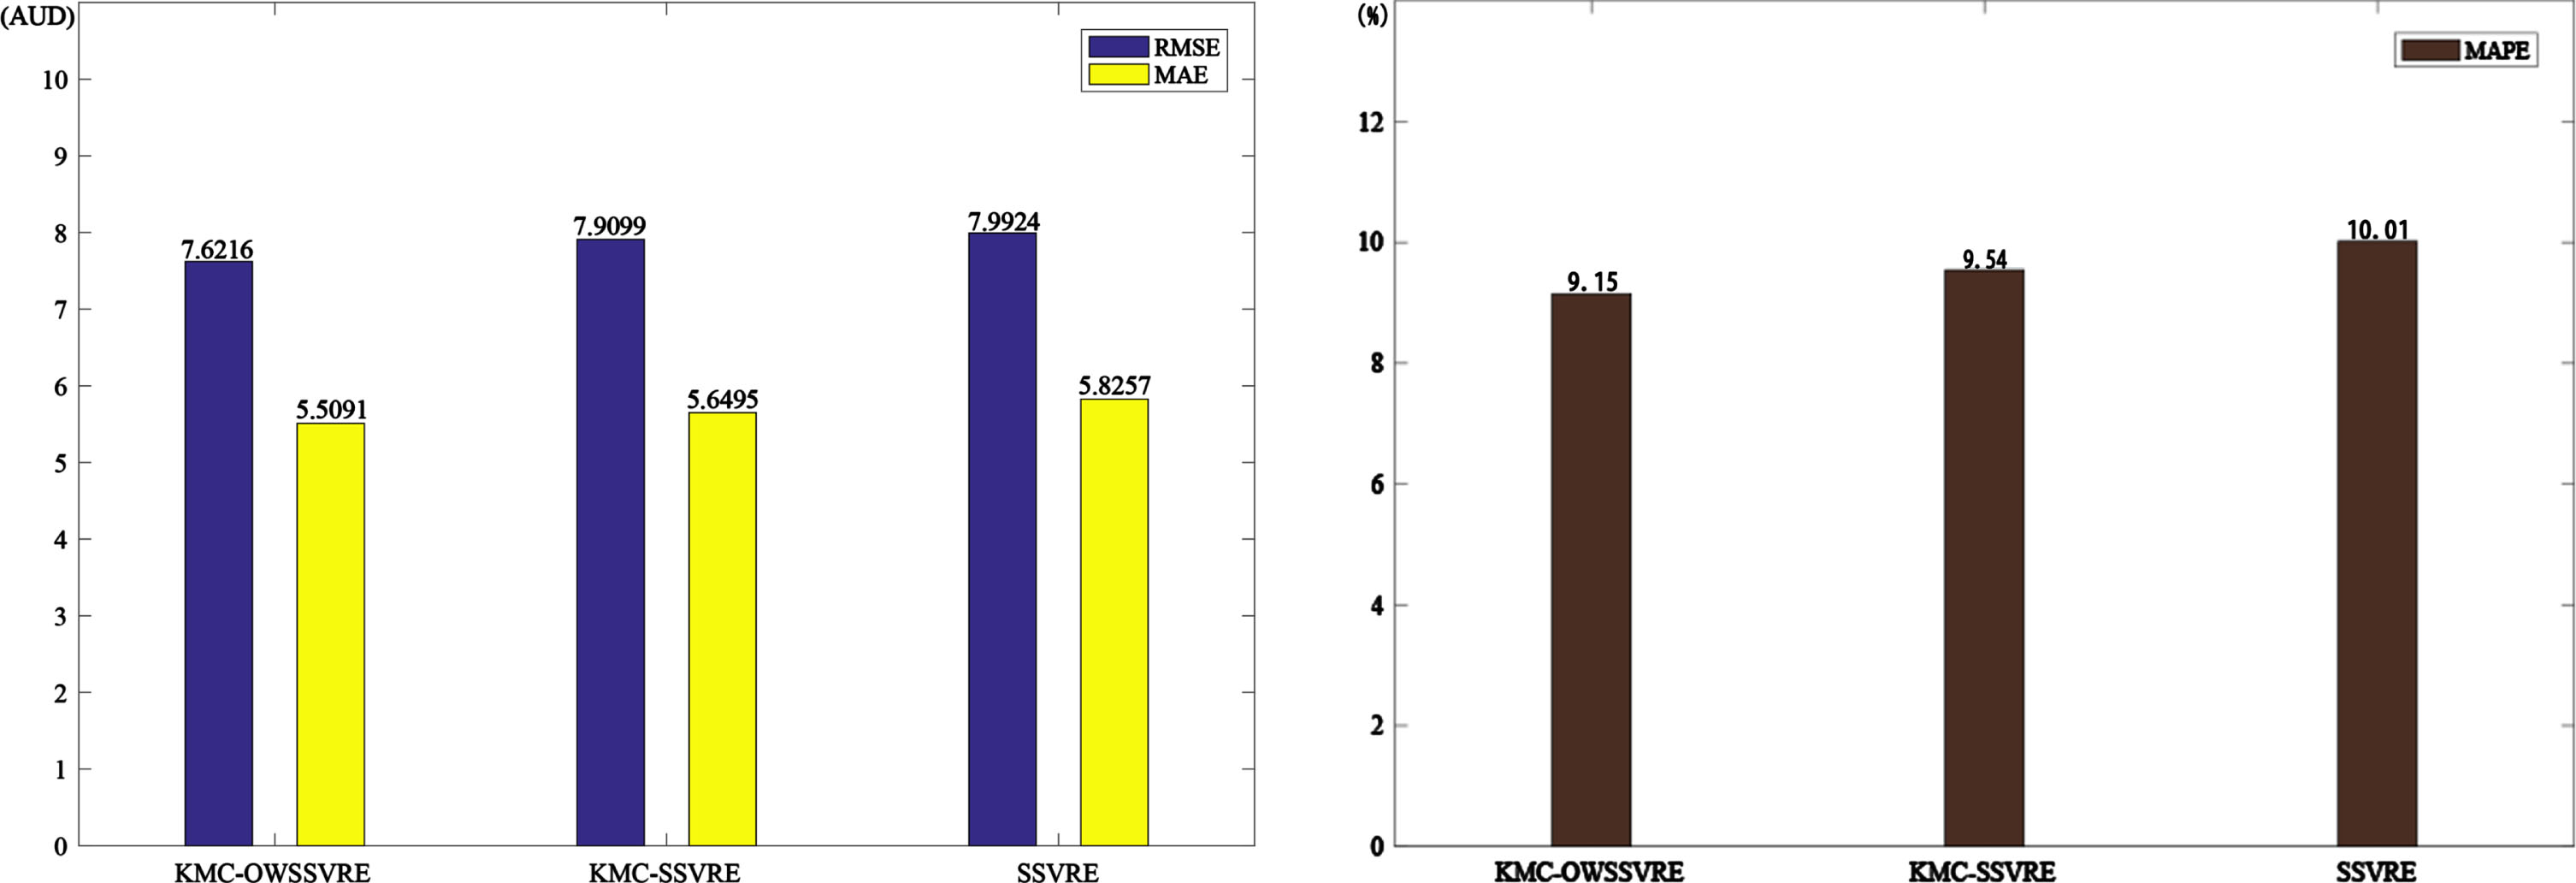
Comparison of prediction performance of KMC-OWSSVRE model, KMC-AWSSVRE model and traiditional SVR model based on New South Wales Electric Utility.

Comparison of prediction performance of KMC-OWSSVRE model, KMC-AWSSVRE model and traiditional SVR model based on Queensland Electric Utility.
To further demonstrate the forecasting effectiveness of the KMC-OWSSVRE model, we conduct a comparison with a recent study [24] that utilizes the particle swarm optimization algorithm to optimize a BP neural network model (PSO-BP) for short-term power generation forecasting. The results, as shown in Table 2, indicate that the KMC-OWSSVRE model outperforms the PSO-BP model in terms of RMSE, MAE, and MAPE on the same dataset.
Performance of KMC-OWSSVRE model and PSO-BP model on test set

Research on effective strategies for short-term electricity price prediction models is currently a hot issue. In this paper, a new effective strategy based electricity price prediction model KMC-OWSSVRE is proposed. In this model, we first explore seasonal decomposition and K-means clustering algorithms to reduce data noise and classify multidimensional the inputs into multiple clusters with similar features. Secondly, subsampling is implemented to create a series of representative subsamples. Thirdly, a series of sub-SVR models, optimized by the particle swarm optimization algorithm, are built using the subsamples obtained from clustering. Finally, an optimal weight strategy is applied to the sub-SVR models for generating the final ensemble model. To demonstrate the effectiveness of the KMC-OWSSVRE model, we conduct experiments using electricity price data of New South Wales and Queensland, respectively. The experimental results show that the model based on seasonal decomposition, clustering subsampling and optimal weighted combination strategy can effectively predict the electricity price series. Therefore, it holds great promise as a practical forecasting method for real electricity markets.
However, our model is not optimal and can be improved in several ways. For instance, some other popular decomposition techniques and deep learning algorithms can be applied to the framework to generate more models with better prediction accuracy and generalization ability. However, these methods were not included in the scope of this study. We aim to enhance the framework in both of these aspects in the near future. In addition, electricity price volatility forecasting will be included in our next extension.
Acknowledgments
The work is partially supported by the Jiangxi Provincial Humanities and Social Sciences Research Project (Grant No. JJ21215), National Natural Science Foundation of China(Grant No. 71971105, 12361096, 12161058)