
Abstract
Imbalanced Learning is a significant issue in machine learning, affecting the performance and accuracy of binary or multi-classification algorithms, especially in large-scale data handling and classification. There are some popular techniques to covert this imbalanced data into a balanced one such as undersampling, under-sampling with tomek links, randomized oversampling, synthetic minority oversampling technique (SMOTE), and adaptive synthetic generation (ADASYN). Generally, the ADASYN algorithm could be used to propagate minority sample points to rise the imbalanced ratio between majority and minority sample points, but in some cases, it may conflict with decision boundary points and noisy points. This paper proposed a Refitted AdaSyn Algorithm (RAA) with Gaussian Distribution (GD). So that new minority samples are distributed much closer to the center of the minority sample to spotlight the conflicts. The classification accuracy has improved with RAA over formal ADASYN. For examining the proposed work the imbalanced benchmark datasets like European, Banksim, Paymentcard, and UCI credit card are considered. Vanilla Generative Adversarial Network (GAN) is a deep learning model used to classify fraud and non-fraud transactions, demonstrating significant differences between balanced and imbalanced learning approaches and achieving an accuracy of 97.5% on dataset DS4.
Keywords
Introduction
Nowadays, with the increase in usage of the internet [1] and smart devices, the number of digital transactions started heading up to the north. As a result of the covid-19 pandemic, governments, and companies showing digital transactions as a safer one which resulted in a hike in digital transactions exponentially. The increased stock in digital payments allowed digital fraudsters to show their prowess. In India, FY 2021-22 has seen 83,638 cases of banking frauds, which involves Rs 1.38 lakh crore. Out of this, only Rs 1,031.31 crore has been recovered till now [2]. It is suspected that most of the attempts for digital fraudulent transactions are happening in Mumbai, Delhi, and Chennai in India. Worldwide, it is estimated that fraudulent infect in the banking sector will hit to 71.7% in 2025.
The average time taken to detect the digital transaction fraud from the date of occurrence was 2 years. If the value of the fraud is more than 100 crore it might take 4 years in time to detect the fraud from the date of occurrence. With a greater emphasis on financial inclusion and customer safety, and in light of the recent surge in customer complaints about unauthorized transactions resulting in debits to their cards, the ideal for determining customer accountability in these prospects have been reviewed. Bank systems and procedures must be designed to make customers feel secure when conducting electronic banking transactions. To achieve this, financial banks are also insisted on appropriate procedures and systems to ensure the safety and security of digital banking transactions [3]. As in recent advancements of technology, many robust mechanisms require various algorithms such as data mining, machine learning, deep learning, and work on massive amounts of data to detect fraud in digital transactions [4]. The researchers are repeatedly working on developing such innovative methodologies to overcome the fraud problems meanwhile, focus on data availability. The best fraud prediction depends only on model learning which requires input as of massive data.
In today’s world, imbalanced learning is critical [5] issue because most machine learning and deep learning algorithms assume that data is distributed equally. When there is a class imbalance, the machine learning classifier is more biased towards the majority class, resulting in incorrect classification of the minority class. So, unable to judge correctly whether that belongs to what kind of transaction it is (either abnormal transaction or normal transactions). Our proposed model concentrated more on this regard to balance the majority and minority sample data points. For distinct applications, academicians gave their thoughts and worked with suitable approaches for imbalanced learning [6] to solve single class and multi-class classification problems [7]. Different authors explored their knowledge and dealt with such an imbalanced problem in various views like dataset with overlapping, overfitting, noisy sample reduction, weighted entropy function, evaluation metrics, add appropriate weights in deep learning model, cost function-based approaches, etc.
In our proposed method, renovated ADASYN algorithm with Normal Distribution (ND) to balance the ratio between majority and minority is discussed. How to overcome the problems of noisy reduction and conflicts in decision boundary points that are more relevant to the majority samples are explored in this work. Here, the training dataset has imbalanced because lack of minority samples in the region. To increase the importance of the specific region in the decision boundary which is related to the minority class, the RAA is used to generate synthetic instances for the minority class to balance the training dataset.
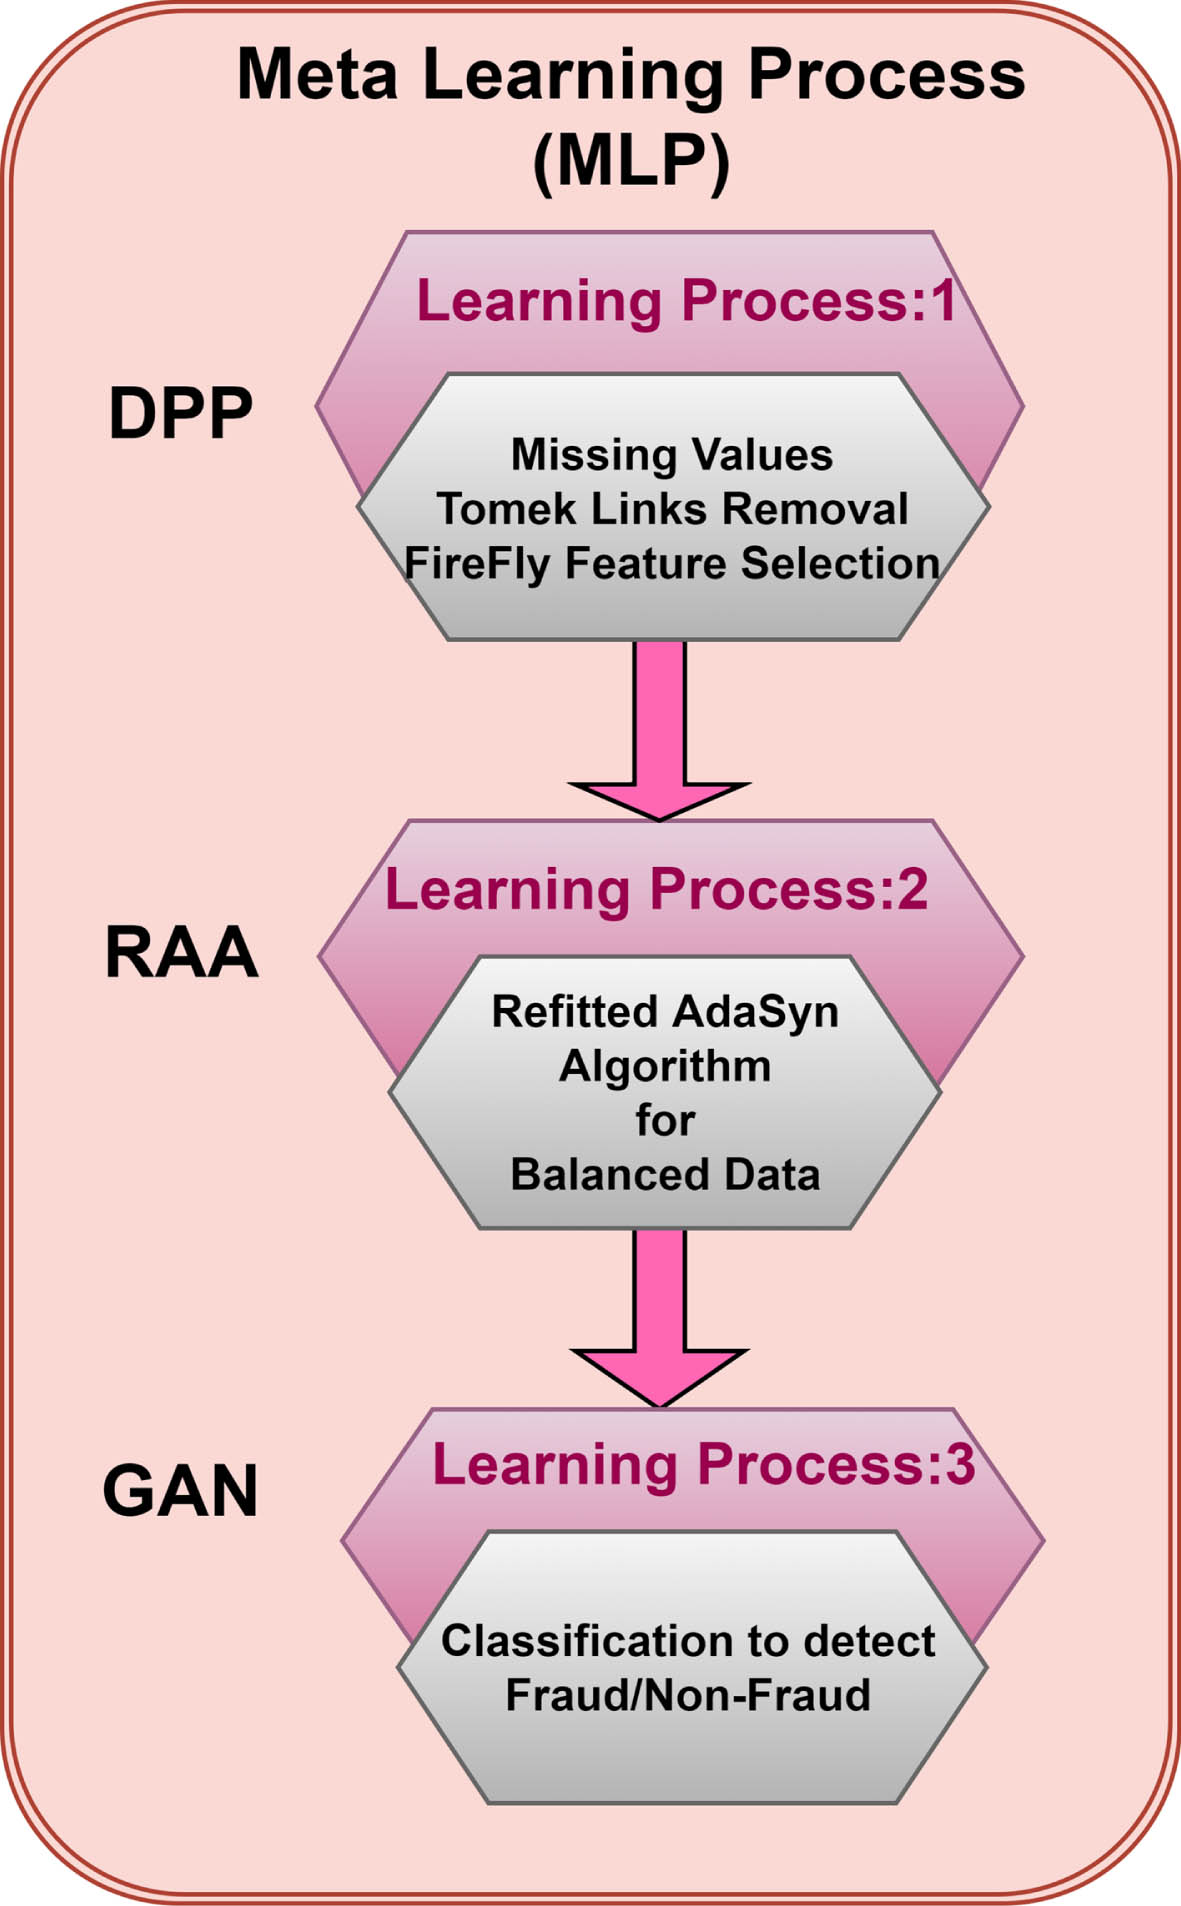
This research article can be elaborated in three-level as shown in Fig. 1 a) Hyper Feature selection b) RAA with GD, and c) Classification.
MLP: Overall framework of model.
Feature Selection: Feature selection is a method to extract the essential features from the set of variables and it can also be reduced the dimensionality space. The FireFly Feature Selection (FFS) Method [8] is the best feature selection technique based on the light intensity and information theory. The best features always yield good performance.
RAA: This is the modified ADASYN algorithm for best fit in the distribution of minority samples in the region using GD. The GD affects the synthetic data generation (belonging to minority samples) by scheming the mean and Standard Deviation (SD). Now will able to get the well distribution over majority and minority samples which is needful for classification. This skewed Class distributions tend to improve the results of machine learning and deep learning algorithms.
Classification: Classification performs a vital role to know the performance of any model. This predictive modelling problem where a class label is predicted for a given example of input data. So this categorizing process is performed on a given set of transactional data that determine whether it is fraudulent or non-fraudulent.
This paper is outlined as follows: Sect. II is the Related works and review of imbalanced techniques; Sect. III about description of related existing methods; Sect. IV describes the proposed model RAA; Sect. V evaluation metrics; at sect. VI. The results and comparison with other results are described; at the end in sect. VII the conclusion will be discussed.
Imbalanced dataset persist by various reasons. In general cases, this caused with incomplete data collections due to privacy related concerns. The studies have begun to focus on analyzing certain characteristics of imbalanced data to solve the problem of imbalances with real data. So, here discuss some thoughts of researchers and scientists. Leraning from misproportional data is vital challenge to digital fraud prediction tasks. When data dealt with hetrogeneous types, many authors are devoted to design an effective data fusion approach, proposing new inventions and algorithms.
C. Fabrizio et al. [9] proposed Stochastic Semi-Supervised learning (SSSL). It is a worth method that add number of majority non fraud samples to the training set. They achieved goal by some oversampling techniques, and given more focus on the majority class (as target class) and not the minority class. In order to assess how SSSL situates in conventional oversampling, authors considered two oversampling approaches such as Random Oversample (ROS) and SMOTE. G. Anjana et al. [10] have been proposed different imbalanced learning techniques which are SMOTE, ADASYN, Borderline-SMOTE, Safe-Level SMOTE and compared results. They combined the border line SMOTE with tomek links technique which reduces the noisy data. The Border line SMOTE used to generate the synthesized positive samples (minority samples).
Rafiq et al. [11] applied latest approach SMOTE to improve the balancing strategy in the binary classification problem on credit card fraud dataset.
Sara makki et al. [12] conduct an experimental study on application which handle the imbalance classification problem. They proved weaknesses of imbalanced dataset and summarized results with the help of fraud labeled imbalance data. The paper revealed about existing approaches. They produced results in a huge number of false alarms and that are costly to financial institutions. W. W. Soh et al. [13] expressed a new way of preprocessing i.e, oversampling called SAS which is applied on imbalanced problem while introducing bias resulted in where prediction not done correctly. Various data mining models are used for classifying the fraud and non fraud data. S. Bagga et al. [14] taken highly skewed european dataset and tested results with approach called pipeling and combined with ensembled learning that generates good accuracy by comparing with different supervised algorithms such as Linear Regression (LR), K Nearest Neighbor (KNN), Random Forest (RF), Naive Base (NB), Multilayer Perceptron (MLP), Adaboost and ensemble learning.
L. Samorjit et al. [15] proposed a new way to generate the artificial data i.e, GAN. The available various kinds of GAN’s approaches are discussed by [15]. Author considered hyperparameter i.e, Gradient Penalty with Wasserstein GAN and Conditional GAN for credit card fraud detection. The GAN approach performed well in balancing the data as well as classification. A. Puri & M. K. Gupta [5] expressed a new hybrid view to tackle the noisy class imbalanced problem i.e, KMeans-SMOTE-ENN. This is happened in three steps a) initial clustering b)SMOTE used in each cluster c)noise removal. Here [5], used KMeans-SMOTE as oversampling technique and modified Edited Nearest Neighbour (ENN) for noise removal. They tested results on different binary imbalanced data sets.
Kyoungok Kim [16] introduced a new technique called noise avoidance SMOTE. This method is efficient for imbalance learning. They used modified smote with ensemble methods such as NASBoost and NASBagging. To address the problem of imbalance learning SMOTE such as Borderline-SMOTE and Safe-level-SMOTE which defines noise samples in a minority class means that cannot be drawn from for sampling. The experimental results has shown that better improvement by applied this ensemble process on 16 different data sets. G A Pradipta [17] modified a SMOTE with safe radius parameter to consider for distance measurement. This method achieves the good results on 5 data sets out of 16 data sets were examined. Here, the synthetic data has generated based on the radius calculation between minority samples. The proposed method taken in categories safe and noise and new synthetic data generated in the form of SAFE category data. By using formula of euclidean distance calculated distance between selected minority sample and all majority samples.
S. Wang [18] explored a new knowledge on imbalanced learning i.e improved SMOTE based on ND. Here, the minority samples are distributed towards the center point. The algorithm has given higher probability of marginalization over the expanded data. RF used for classification. The experimental results gave better classification rate. Out of Bag (OOB) scoring error parameter also considered to this problem with other metrics like true positive rate, false positive rate etc. They applied on some bench mark data sets like Pima, WPDC, WDBC, Inosphere, and Breast cancer wisconsin.
H. Zhu et al. [20] used Weighted Extreme Learning Machines (WELM) with a dandelion algorithm with probability-based mutation and compared with various intelligent optimization methods such as genetic algorithm, particle swarm optimization, bat algorithm and compared their performance on 14 imbalanced dataset to solve the problem of imbalanced classification.
F. Itoo et al. [21] compared the empirical results and classify the fraud and non-fraud transactions of the credit card dataset by dividing data set into 3 different ratios. They applied Random Under Sampling method (RUS) and to checked out whether the performance is improved by method. LR, KNN and NB models were used to test the model. A Singh [22] provided comparative study on various measures like accuracy,error, F1 score etc. of different supervised models and explained about popular imbalanced learning techniques.
A robust and novel method developed by B Baesens et al. [23] to deal with imbalance problem called robRose i.e, a more robust ROSE algorithm that does not oversample minority outcasts and subsequently taken the covariance structure of data into consideration. Robust statistics is a useful tool for anomaly detection i.e, outliers. Outliers are samples which are deviate from minority and with majority samples. They applied this technique on customer churn prediction.
Z. Li et al. [24] stated and expressed their view to handled the problem of class imbalance with overlapping samples. They used a hybrid method called Dynamic Weighted Entropy (DWE). They elaborated hybrid model in two steps such as the divided and conquer. Initially they identified anomalies from overlapping structures (both majority and minority) and subsequently, train the classifier on the overlapping subset.
E.B. Fatima et al. [25] taken the classs imbalanced data which has major issue and the problem faced in many different areas. They presented the solution using three feature selection algorithms namely, Reduce overlapping with No-Sampling, Reduce oversampling with SMOTE and Reduce overlapping with ADASYN. The simulation results have shown that the false discovery rate were minimized.
Hadeel Ahmed et al. [26] came out with new undersampling imbalanced framework i.e, fuzzy c-means clustering along with Similarity Based Selection (SBS). After performed clustering, SBS selecting and combining the instances that have similar features according to the desired ratios 25:75, 50:50, 34:66. After getting the balanced dataset, given training data to ML algorithms like ANN, LR, KNN, NB to know the accuracy.
Description of related existing methods
Balanced technique: ADASYN
An Adaptive Synthetic Minority Oversampling Technique is known as ADASYN. We propose an compatible method to expedite learning from imbalanced data sets, inspired by the success of modern synthetic approaches such as SMOTE, SMOTEBoost, and DataBoostIM rather than different from SMOTE. Generating synthetic data samples as shown in the Fig. 2 based on minority class density distributions improves the determination limits of the original data. To understand the concept of imbalanced problem explains through filled circles with blue, red and yellow are called as majority (non-fraud), minority (fraud) and synthetic fraud samples respectively. Minority (Fraud) samples are defined as MR1, MR2, … MR10 and P1, P2, … P10 are represented as synthetic minority samples. The concise imbalanced model well in making equal of fraud and non fraud samples.

Pictorial representation of majority vs. minority vs. synthetic samples.
Density distribution function helps in determine the number of unnatural samples that are required to be generated interrelated to each fraud samples. The goal here is two fold: reducing learning bias of the original data set and learning adaptive. Algorithm ADASYN [27] describes the proposed algorithm for the binary classification problem. The number of synthetic data generates towards of minority samples are calculated by the Equation (1) and then M J refers to majority samples,M R minority samples and G can store # number of synthetic samples. If β = 1 means that the dataset denotes fully balanced.
Algorithm 1 illustrated how it was works in terms of synthetic data generation based on density distribution. And also we can turn aside from the creation of the more border points which are difficult to classify. That means, Prediction does not meet the belief in discovering fraud transactions.
Choose the number of nearest neighbors as k, β which denote class balanced level after synthetic data generation, respectively. 1. M
J
express the number of non-fraud samples (majority class) and let M
R
denote the number of frauds samples (minority class). Calculate G = (M
J
- M
R
) Xβ 2. C
i
wherei = 1, …, M
R
indicate the observations native to the minority class and A express the set of all C
i
. 3. Measure the distance function (euclidean) between C
i
and all other objects of A. Then capture the KNN’s of C
i
. 4. S
ik
express the set of kNN’s of C
i
. 5. Determine δ
i
where the number of observations in KNN’s region of C
i
. Calculate the ratio S
i
defined as 6. Normalize S
i
with 7. Calculate g
i
= 8. g
i
randomly generated synthetic samples denoted C
ij
j = 1, … g
i
from S
ik
with restoration. 9. Stop algorithm.
GAN is one family of models in the deep generative story. This model is best fitted with ND region. GAN’s take a different approach for dimensional problem where the idea is to sample from a simple tractable distribution (z ∼N(0,1)) and then learn a complex transformation from this to the training distribution. In other words, take a (aZ ∼ N (0, 1)), learn to make a series of complex transformations on it. So, that the output looks as if it came from our training distribution. To train a such a complex normal distribution transformation through a neural network i.e, GAN [28]. It can be train by using a two player game. One is Generator and Second one Discriminator.
Generator (G): The job of the generator is it has to take Z which the data is normally distributed. The Generator used to produce transaction data which look so natural, that the discriminator thinks that the transactional data comes from the real data distribution. Generator was parameterized by G
φ
. So, these are the parameters of the generator this could be a feed forward neural network or convolution neural network (CNN). A neural network based generator which takes an input a noise vector z ∼ N(0,1)) and produces Equation (2) as shown in below.
Discriminator (D): It is best in distinguishing between original and fake transactional data. Generator was parametarized by D θ . A neural network based discriminator which could take as input a real X or a generated X = G φ (Z) and classify the input Equation (3) as real or fake.
The given an image generated by the G as G φ (Z), the discriminator assigns a score D (G φ (Z)) to it. The goal of the G is to minimize this expected loss, overall possible values of Z. The D has to assign high score to real data and low score to generated data. So, when combining the objective functions of G & D as write as in the Equation (4) as follows then subsequently get a minmax game.
The imbalanced learning has been a great challenge in many applications. It has been a great impact in fraud detection especially happening while digital transactions taken place. An architecture of MLP can be a combination of DPP, RAA and GAN which shown in Fig. 1. The MLP is called as learning about learning. The preprocesed information is given as input to the DPP. DPP explained in detail in Sec. 4.2. Here, the output of DPP is fed to the RAA which is resulted in balanced proportion of majority and minority sample data by propagating the synthesized data. This balanced data set is forward to the GAN for classification. From the result, the performance of RAA can be observed.
DataSet description
The Digital transactional fraud detection datasets from kaggle and UCI repositories consists of anonymized credit card and payment transactions labeled as fraudulent or genuine. Applied four Imbalanced datasets DS1 [29], DS2 [30], DS4 [31] and DS3 [32] respectively as European, BankSim, UCI Credit card and Payment type to proposed algorithm to get balanced in improving classification rate. All these skewed datasets were highly imbalanced. The given Table 1 shows more description about skewed datasets and ratios of majority and minority samples. Here Majority samples are non-fraud transactions and minority indicates fraud transactions.
DS1: Comparison of accuracy on different classifiers
DS1: Comparison of accuracy on different classifiers
The European data set contains total observations are 284807 with 31 features including target feature and out of these only 492 are fraud transactions. The ratio between them is 577.88. Another Kaggle banksim data set with transactions 594643 as number of observations and out of these 7200 are considered as fraud with 81.59 ratio rate. Some other Payment type data set contains total 1048573 with 10 feature variables and among all these observations 1141 are fraud samples. This is vert high skewed data set with 917.99 imbalance ratio. The final data set UCI credit card with 25 features having 30000 overall samples and out of these 6636 are fraudulent with 3.52 ratio. Tables 7 to 10 depicts various imbalanced techniques that are applied on different highly imbalanced data set.
The input to any model required in a reliable manner. Data cleaning applied on five fraud data sets related to payment transactions. As a result, we can make the data more adaptable based on our model. To our proposed model, initially done the process of finding missing values, tomek links removal [6] i.e, eliminate the noisy points. This process addresses the paired of nearby majority and minority sample. So, by the technique to apply, removes majority sample from the region. This process is know as under sampling with tomek links. The most important criteria for data sets are reduce the features by applying best feature selection algorithm. For our problem recommended suitable technique called FFS which works based on the light intensity and information theory.
Balanced technique: Refitted ADASYN algorithm (RAA)
A modified ADASYN algorithm known as the RAA. It can be used to generate unnatural or artificial synthetic sample for improving the imbalanced ratio which leads to fraud samples. At the time of synthetic data generation, the algorithm i.e, SMOTE is created bridges between both observations due to embedness of frad and non fraud observations.
This bridge enlightened one as noisy samples where the fraud observations has gotten more non fraud class observations as neighbours. The decision boundary points has meant where the fraud observation gets equal neighbouring distance as measured in [7] for both fraud and non fraud observations. Meanwhile, SMOTE could be worked better with distribution of observations on region with the help of ND to avoid marginalization problem [18]. So, it might works well on some imbalanced datasets. Clearly, it is said that the ND recommended over the density distribution for marginalization data.
An algorithm 2 given here is the modified ADASYN with GD. Here, the terms are mean, median and mode are considered as equal. So that it could distributed observations well. In Equation (5), the GD formula is expressed [19].
The value of P(X) or gaussian function in Equation (5) is equal to this normalizing function when this exponential value will be equal to 1. The overall performance of the function is depended on mean (μ) or expectation of the distribution, SD (σ) and variance (σ2).
The Equation (6) is normalized version of the actual data to avoid errors caused by different marginal dimensions, where as
There after the center point
where n is the ’n’ number of samples in the fraud observations and r is the number of features in fraud observations. Then estimate the GD of n X 1 dimensional normalized minority observations under each feature.
Let σ0 denote the SD vector of minority normalized data samples which is shown in Equation (8).
All normal density curves satisfy the following property which is often referred as the Empirical rule: 65-95-99.7%.
If the curve lies -65% then the observations are all within one SD of the mean, i.e, between (μ - σ and (μ + σ).
If the curve lies -95% then the observations are all within two SD the mean, i.e, between (μ - 2σ and (μ + 2σ).
If the curve lies -99.7% then the observations are all within three SD of the mean, i.e, between (μ - 3σ and (μ + 3σ).
Thus, for a GD, almost all of the values are fallen within three SD’s of the mean.
Input: Imbalanced dataset
Output: Balanced dataset with fraud and non-fraud transactions. Initialization: M
J
-> # Majority Samples & M
R
-> # Minority Samples Standardize the original data Calculate ratio of M
J
& M
R
d = M
R
/M
J
Quantity of synthetic data to generate G = (M
J
- M
R
) × β where β = 1 Identify center point Estimate the GD of n × 1 dimensional normalized minority samples under each feature. σ0 = (σ10, σ20, …… σr0) Synthesize samples based on interpolation formula
f(x) · G Stop the algorithm when it reaches imbalanced ratio
In general, any classification model is developed in two phases Train and Test phase.The trained model is evaluated using the test data in the testing phase in order to enhance the performance of the model. The confusion matrix hyper parameters are more important to calculate basic metrics like accuracy and F1 Score, precision, True Positive Rate (TPR), False Positive Rate (FPR), Likelihood Ratios Positive (LR+), Likelihood Ratios Negative (LR-) as shown in the equations Equations (10) to (16).
Confusion matrix
Confusion Matrix [33] is an important criterion for result measurement techniques or calculating the performance of a classification algorithm and which gives the summarizing helps in understanding what the classification model estimating correct and what types of errors it is making.
T POS the number of samples, means Actual and Predicted has same number of values. T NEG the number of samples, both the values of actual and predicted are negative. F POS the number of samples, actual labels as negative and predicted as positive i.e., called Type I Error. F NEG the number of samples, with actual labels as positive and predicted as negative. i.e., called as Type II Error.
The confusion matrix is an important criterion for calculating the performance of a classification algorithm, and knowing which criterion gives the summarization helps in understanding what the classification model is estimating correctly and what types of errors it is making. TPR is the number of samples that are both given the same value (i.e., positive) in actual and predicted, and TNEG is the number of instances that include both actual and predicted. Negative, FNEG, and FPOS represent the numbers in the classification rate of errors. F1 Score LR+ = Probability that a transaction has a fraud tested positive/probability that a transaction without the fraud tested positive. LR–= Probability that a transaction with the fraud tested negative/probability that a transaction without the fraud tested negative. FMR shows the ratio between LR+ and LR-. F1 Score have the harmonic mean of the precision and recall. The given performance metrics, such as accuracy, true fraud, false fraud, specificity, and precision, are expressed in Equations (10) to (16).
Results of Part:1
In this empirical results section, we have explained in three parts. Initially, plotted balanced ratios of majority(green color) and minority samples(red color) in the form of scatter plots with clear visualization as shown in Figs. 3 to 6 are pictorial representations and compared results of the experiments in the second part with some selected Classic models of machine and deep learning SVM, RF [34], Extreme Learning Machine (ELM) [35], CNN [36] and GAN [28] to train on original data sets DS1 to DS4 for classification. The classification process gives prediction in terms of detecting fraud transaction. Third, applied original data samples to some of the under,over sampling techniques and proposed oversampling technique to make it as balanced. Subsequently, metric can be used to prove the proposed algorithm’s efficiency in terms of LR+ and LR–and this ratio clearly said that how the true positive increases and false rate decreases after balancing our dataset. At last, compare accuracy between before imbalanced and after balanced. All these experimental results presented in the forms of tables (Tables 2 to 5) and group bar graphs presented.
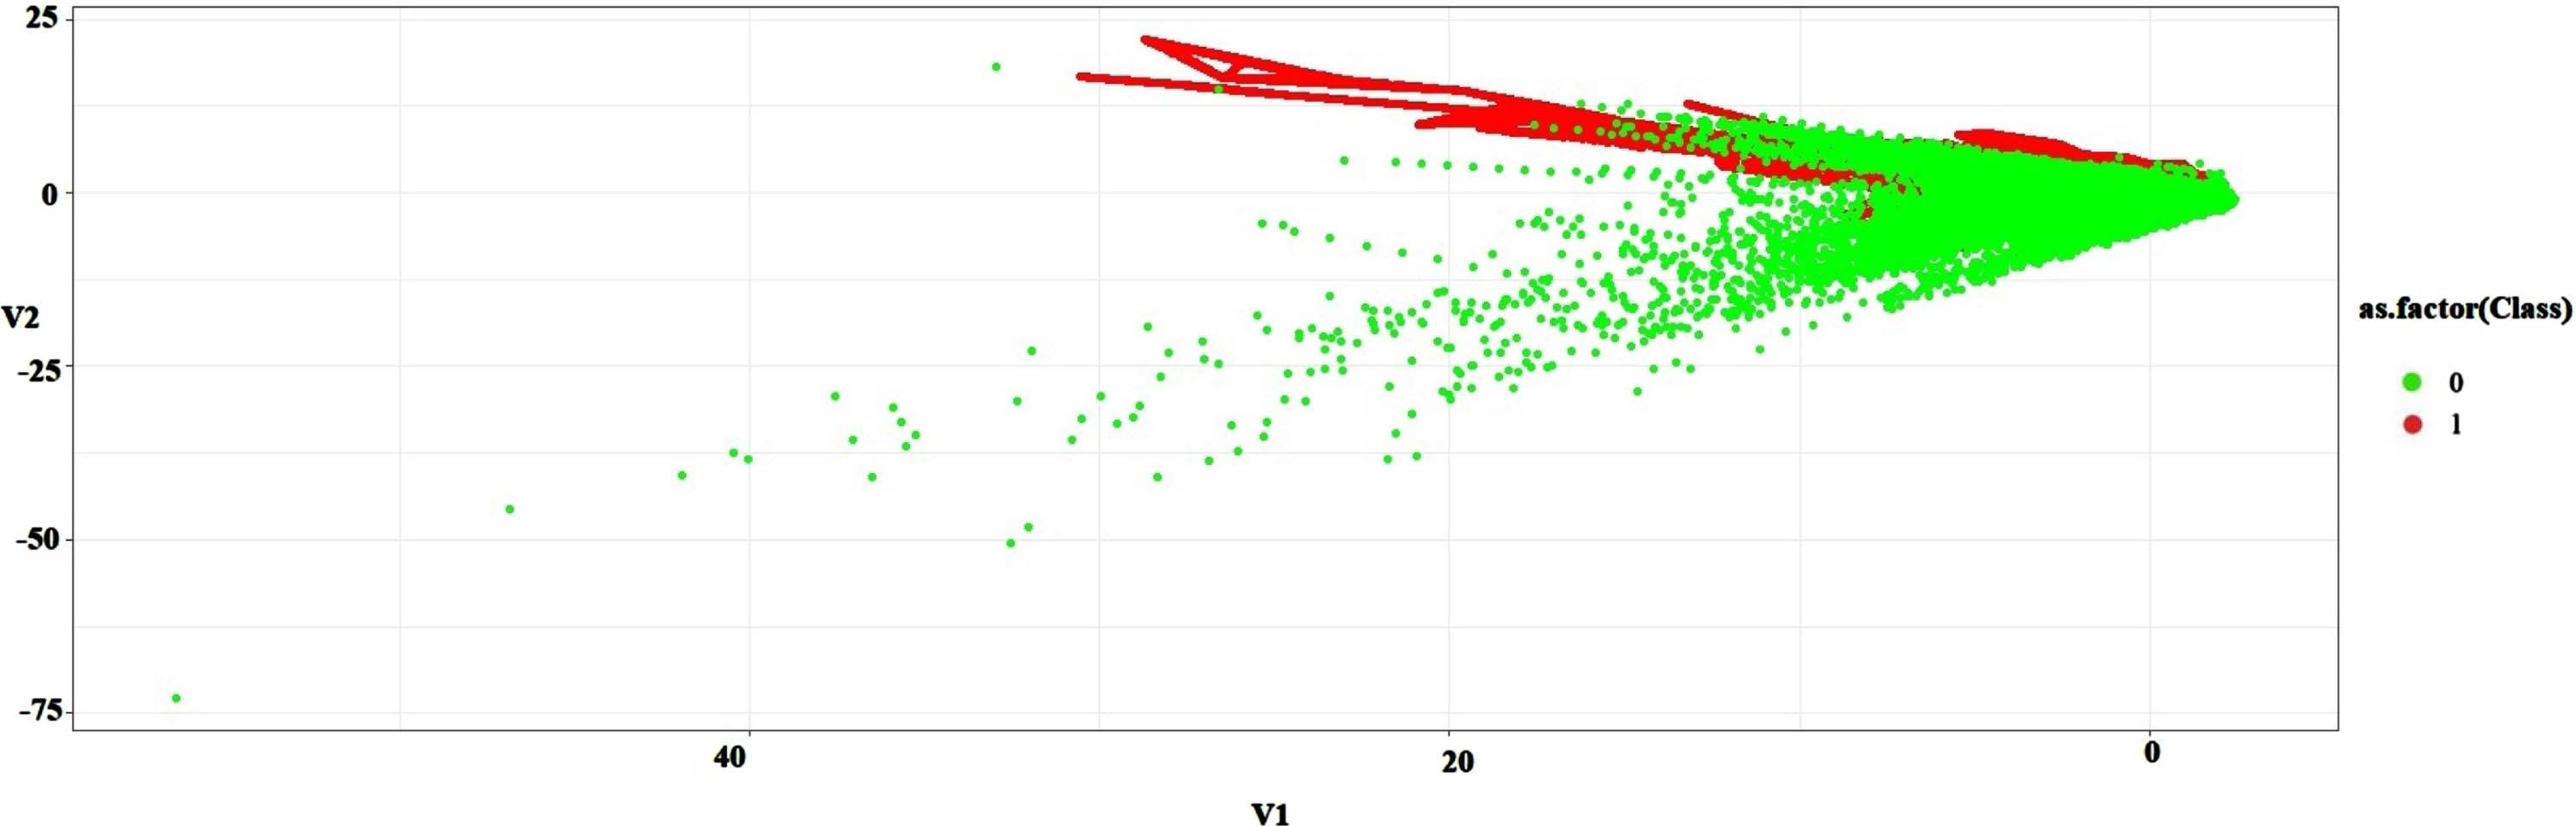
DS1: Balanced pictorial representation of majority vs. minority.

DS2: Balanced pictorial representation of majority vs. minority.

DS3: Balanced pictorial representation of majority vs. minority.

DS4: Balanced pictorial representation of majority vs. minority.
The various classification models that are trained by the original data sets DS1 to DS4. So, we can easily observe that the classification rate in fraud identification. With the imbalanced data set model can not be predicted a fraud transaction correctly. In such a case we required imbalanced techniques to balance the majority of non-fraud and minority of fraud transactions. Best oversampling, under sampling techniques and advanced RAA imbalanced technique were used in this experimental results. Hence, parameters chosen for comparison of results are accuracy, recall or TPR, FPR, F1-Score, LR+ and LR-. The results can be easily visualized from the bargraphs of four data sets.
The results are illustrated in Tables 2 to 5, applied various classical models on imbalanced data sets and that are given results by performing evaluation metrics to know the performance of the model on corresponding data set. While using original data sets, these classic models were performed well in some cases based on feature selection. Here, firefly algorithm used to extract best feature among all to identify fraud in such case. In Tables 2 to 5 classic models of machine and deep learning trained with data set DS1, DS2, DS3, DS4 respectively. Out of all these models GAN outperforms and followed by RF performed well. But in some cases observed that in Table 2 ELM gives more likelihood positive ratio even though getting less accuracy. In Table 3, GAN Performs well followed by CNN and RF. The Dataset 3 is very huge data set with large number of samples. In this a drastic inequality found by the ratio of majority of non fraud and minority of fraud transactions. GAN performed well on working with DS3 by 84.13%.
DS1: Comparison of accuracy on different classifiers
DS1: Comparison of accuracy on different classifiers
DS2: Comparison of accuracy on different classifiers
DS3: Comparison of accuracy on different classifiers
DS4: Comparison of accuracy on different classifiers
Table 5 worked on DS4 with 30000 transactions and was very small in the ratio of fraud and nonfraud. So, obviously that small ratio affects the accuracy while trained by various classic model. Compared to all the imbalanced datasets, it is the best in ratio. GAN, CNN, RF performed well. Hence, GAN outperforms when compared with other models even when working with different imbalanced data sets. It has shown effectiveness of every model drawn in Fig. 12.
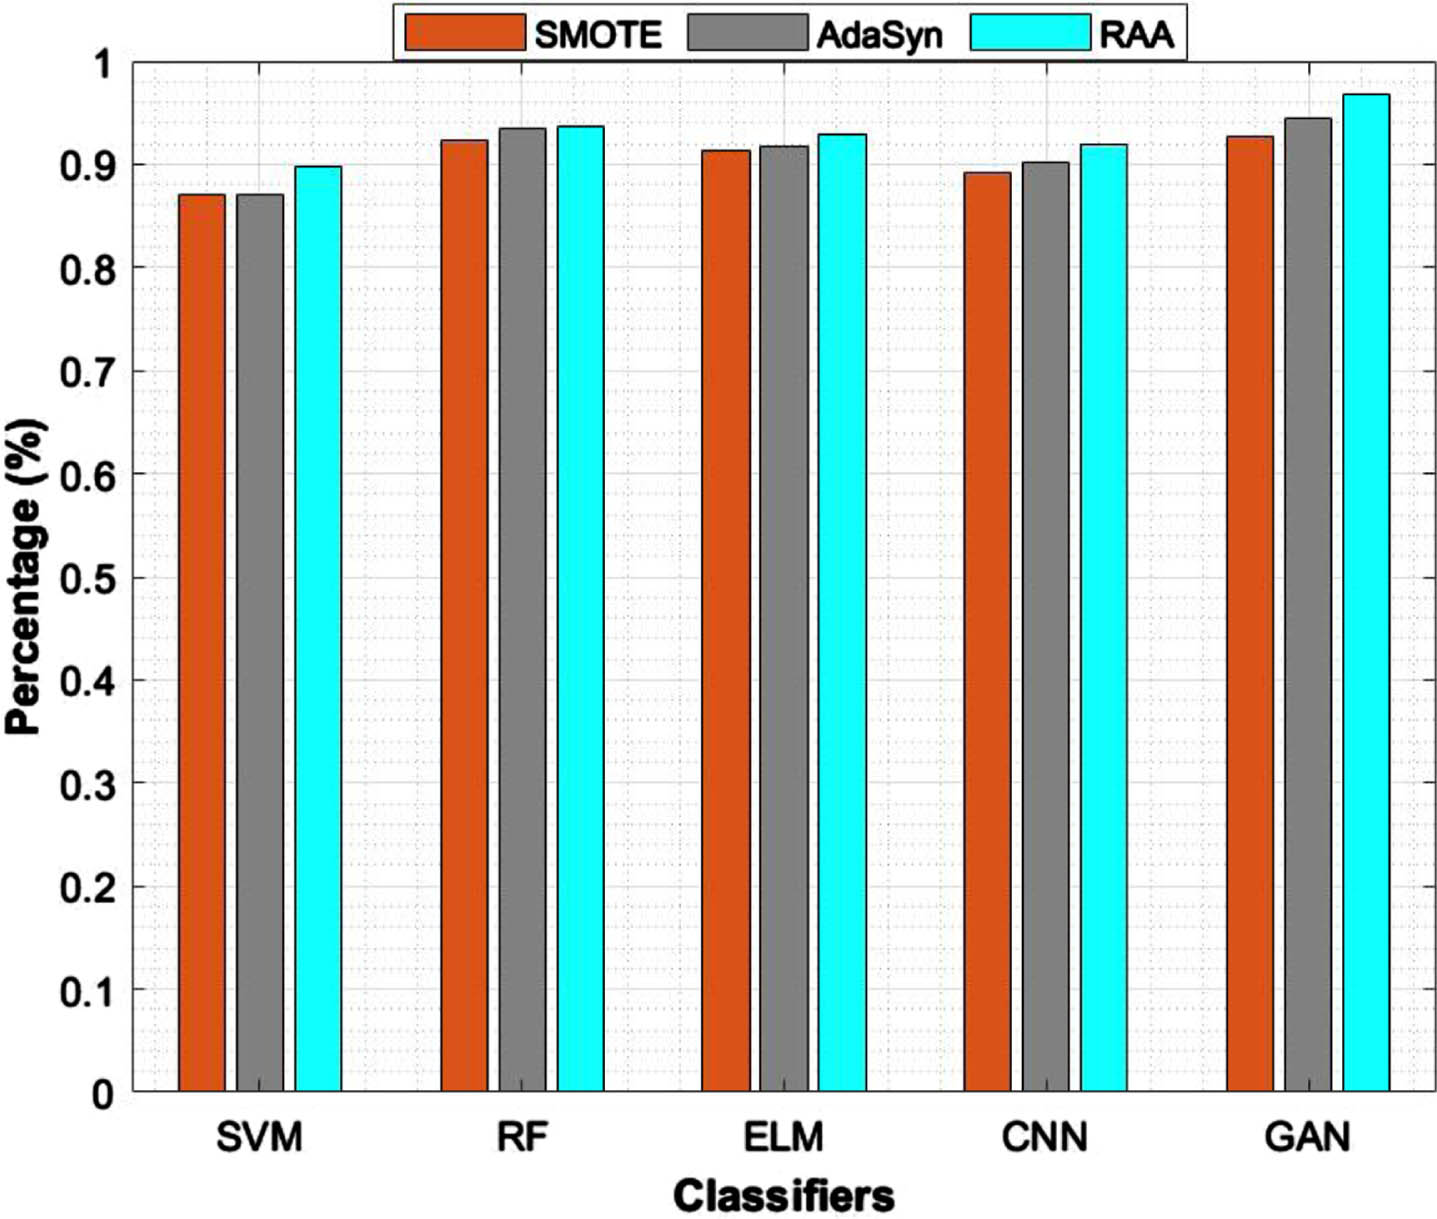
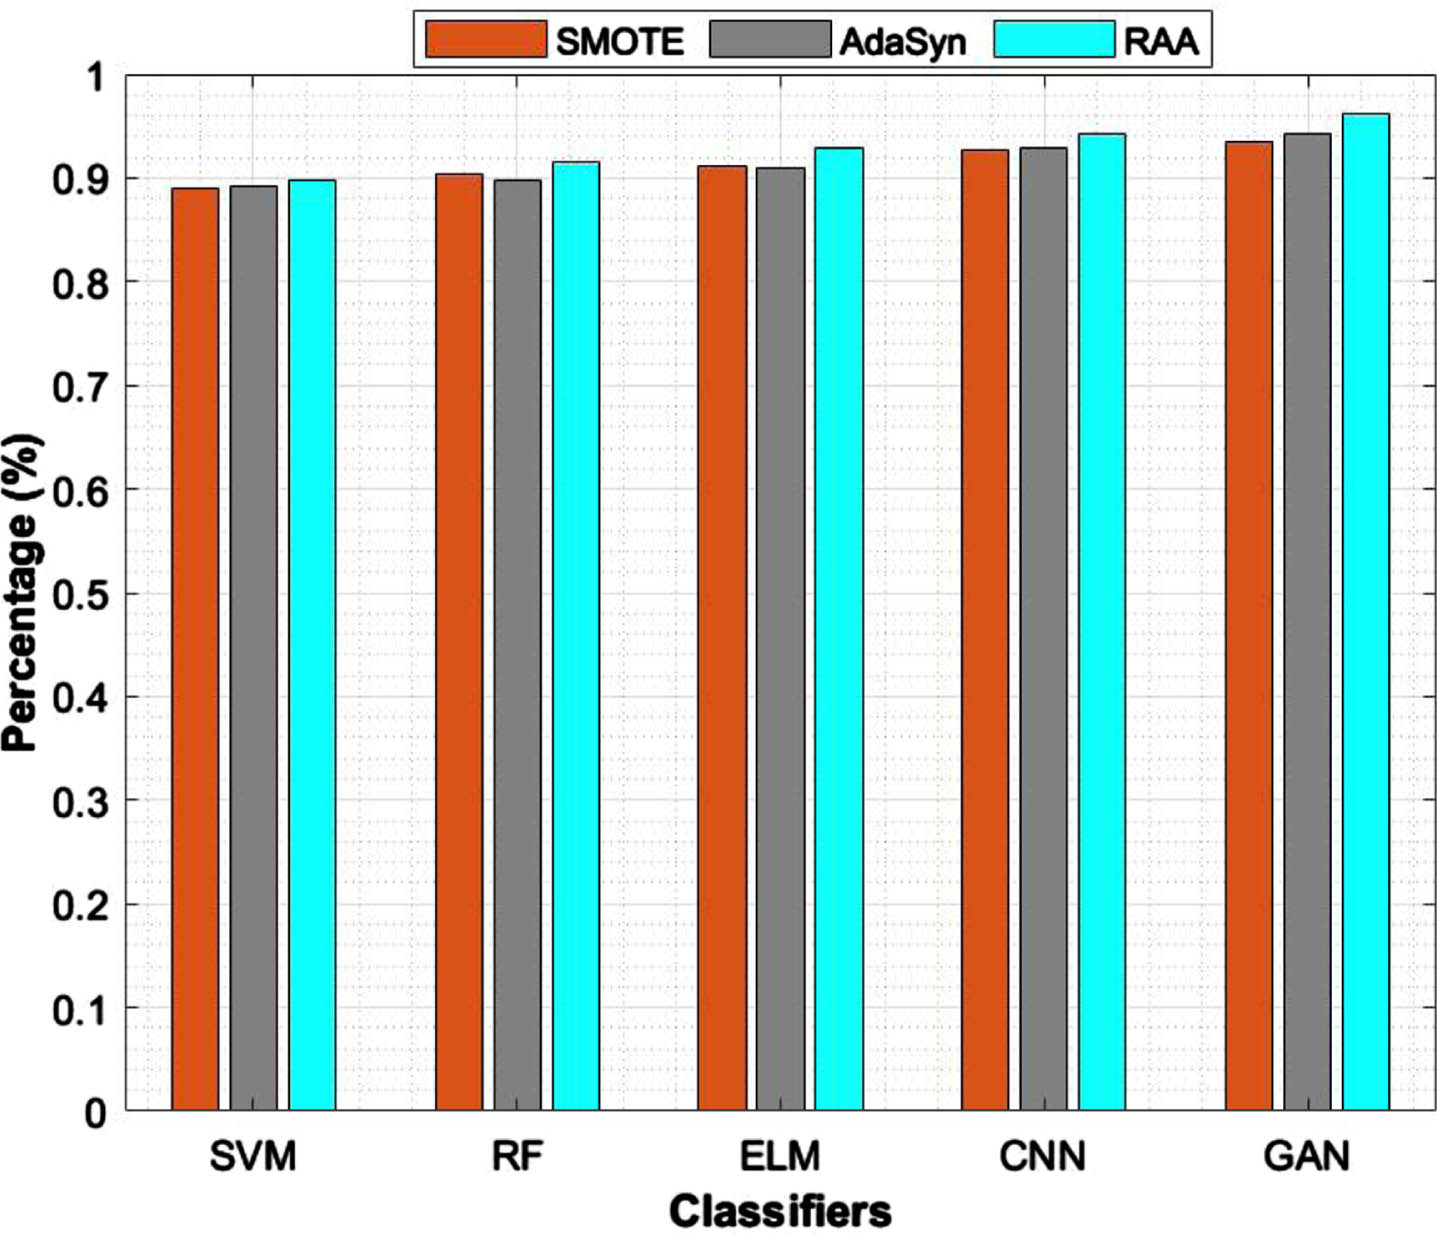
This experiment is designed for the conversion process of imbalanced data set into balanced data set that affects the classification rate. There considered some well known imbalanced methods undersampling (US), oversampling (OS), mixture of US and OS, SMOTE and ADASYN. our proposed method RAA analysed and compared with all well known imbalanced methods. All the experimental results were preserved in Tables 6 to 9. The clear visualization represented results by group bar graphs as shown in Figs. 7 to 10.
Balanced DS1: Accuracy values for imbalanced techniques
Balanced DS1: Accuracy values for imbalanced techniques
Balanced DS2: Accuracy values for imbalanced techniques
Balanced DS3: Accuracy values for imbalanced techniques
Balanced DS4: Accuracy values for imbalanced techniques
DS1: Evaluation metrics report of different classifiers on balanced dataset
DS2: Evaluation metrics report of different classifiers on balanced dataset.

DS3: Evaluation metrics report of different classifiers on balanced dataset.
DS4: Evaluation metrics report of different classifiers on balanced dataset.
The effectiveness of proposed imbalanced method Called RAA designed to verify the effectiveness of the prediction rate that are compared with some state-of-the-art methods in terms of imbalanced techniques introduced above. This proposed RAA method is implemented with ND. This distribution minimizes the decision boundary points and noisy points while distributing the samples on feature space.
Our model can achieve the best performance on all data sets, because of its strong ability on learning the distribution of data set. That means, it well in distribution of samples rather than the state-of-the-art methods in terms of handling the problem of imbalanced learning.
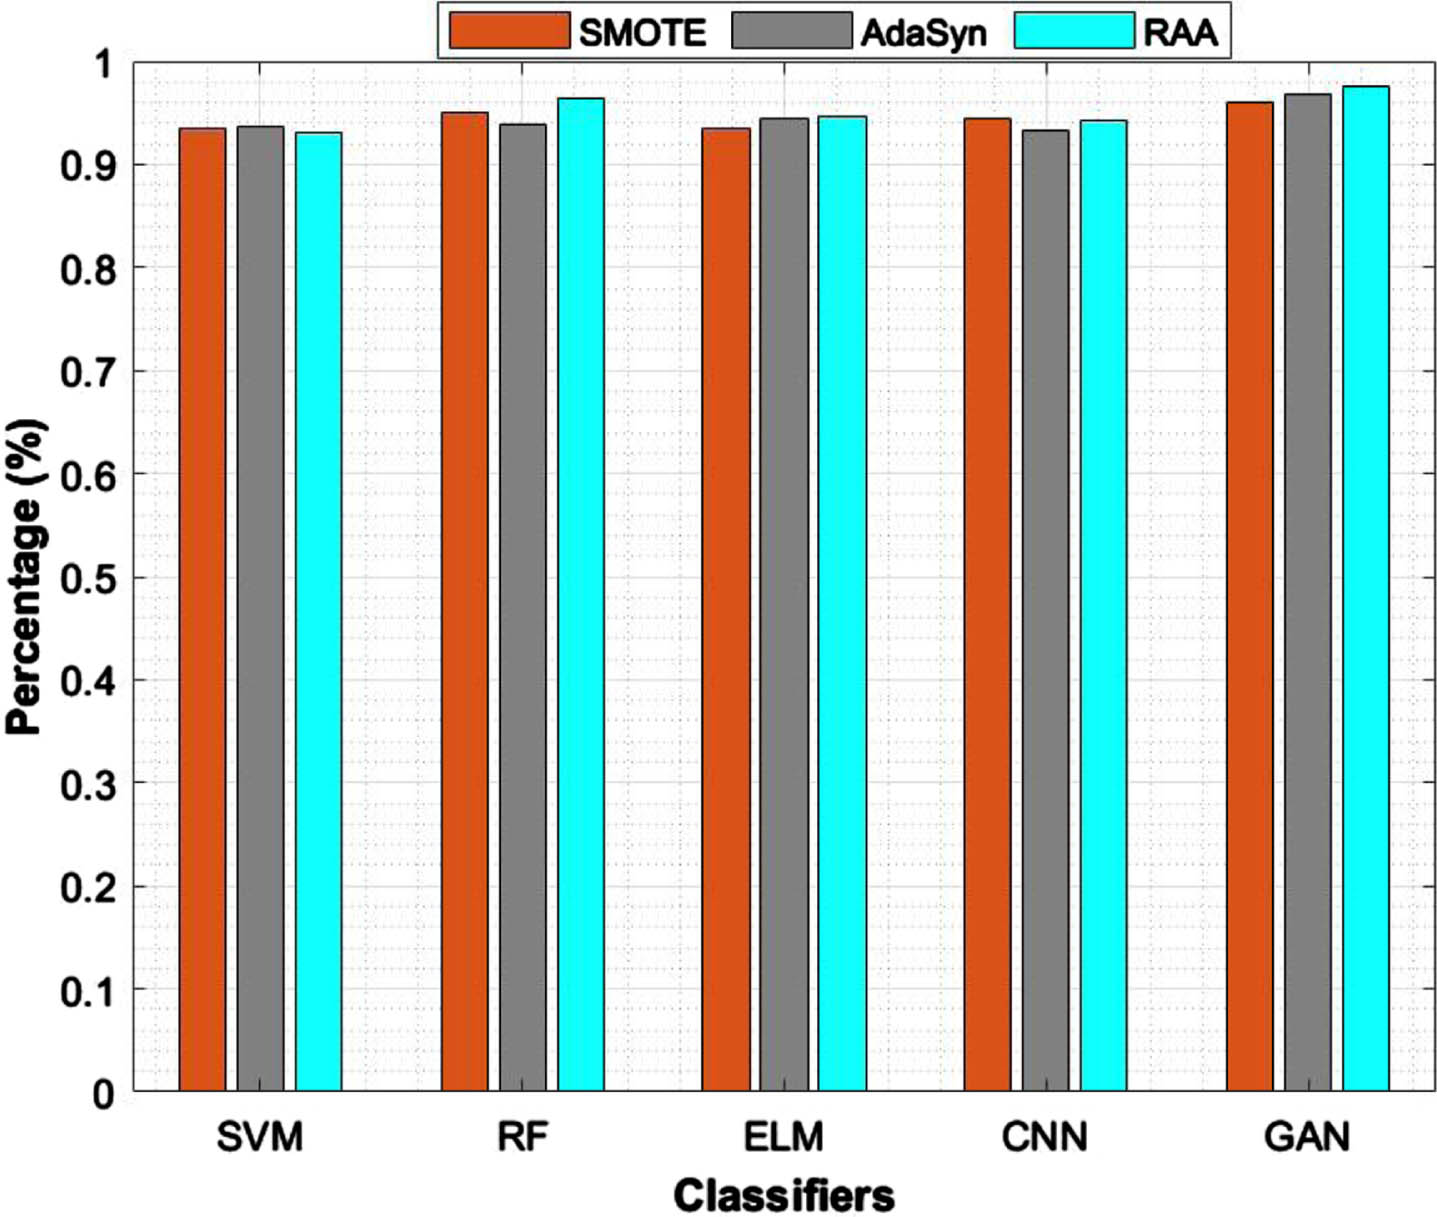
Tables 6 to 9 depicts about imbalanced datasets 1 to 4 and adapted US, OS, mixture of US+OS, SMOTE, ADASYN and RAA to balanced our data set. Then fed balanced datasets on different models to improve the results. As shown in Table 6 classic under sampling and oversampling doesn’t give that much of result. An advanced over & undersampling like SMOTE, ADASYN, and RAA type balanced data given the better result with 92.66%,94.43%,96.73% respectively and followed by random forest. But in Table 8, CNN also works better on balanced datasets. GAN classifier works well on imbalanced data sets as well as balanced data sets. Table 9, proved RF, CNN and GAN improved the result of balanced datasets. The ELM also given best result on balanced dataset which is implemented by ADASYN algorithm. For DS4 Proposed RAA worked better on RF with 96.33% compared to GAN 97.5%. But, ultimately, most of the balanced data sets were implemented by vanilla GAN network in a better way and it was produced in the bar graph Fig. 10.
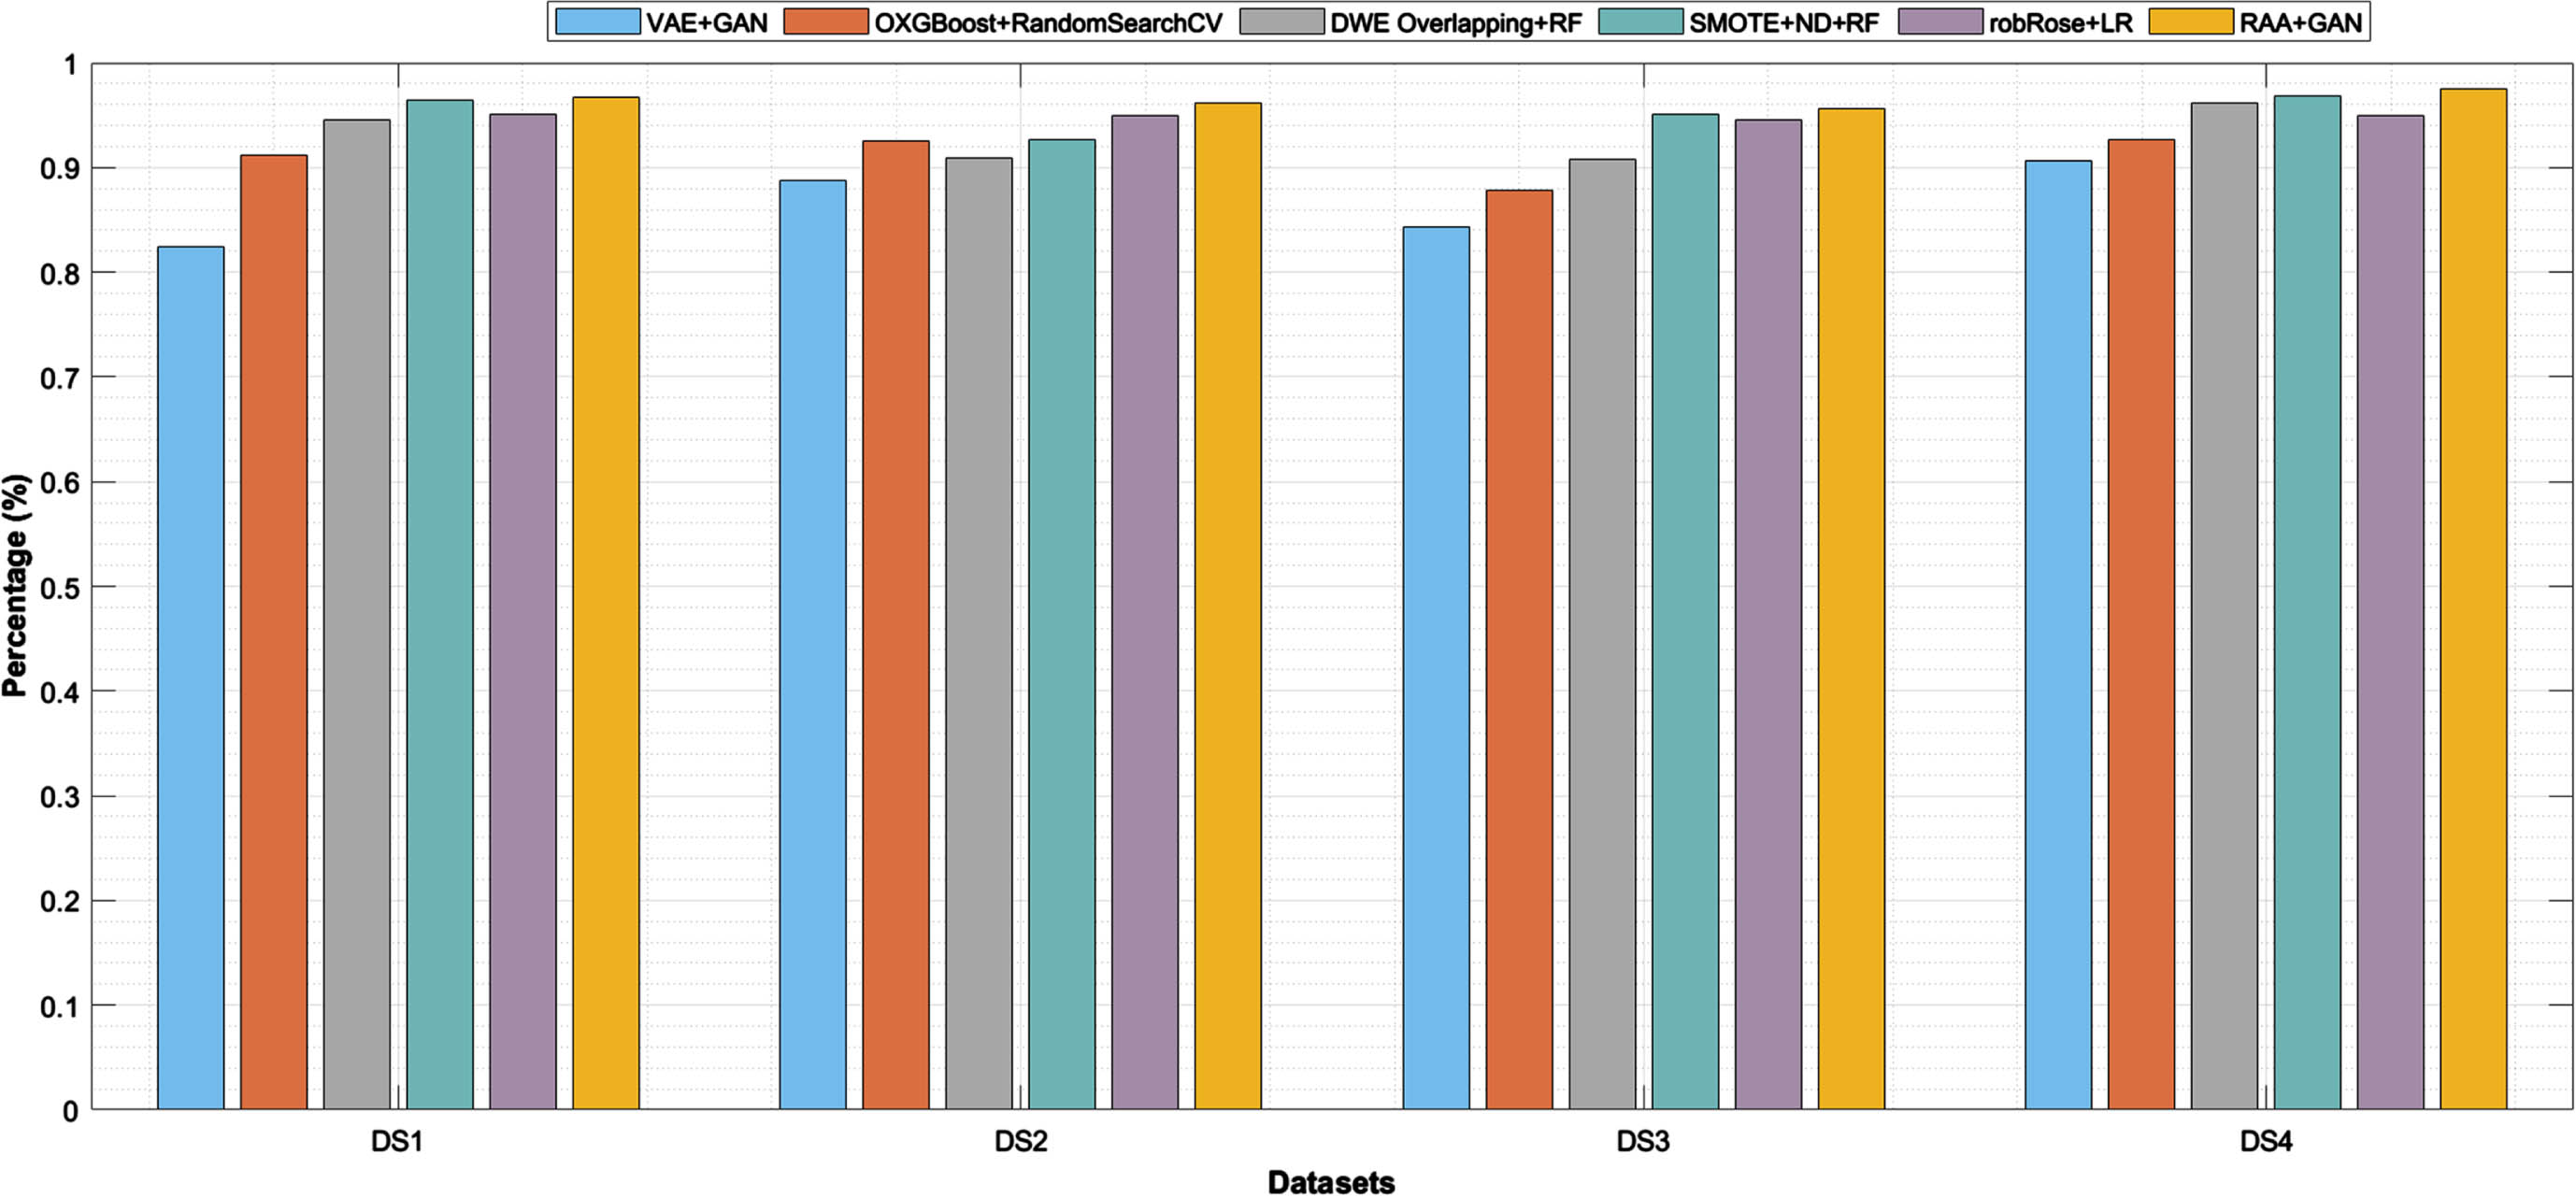
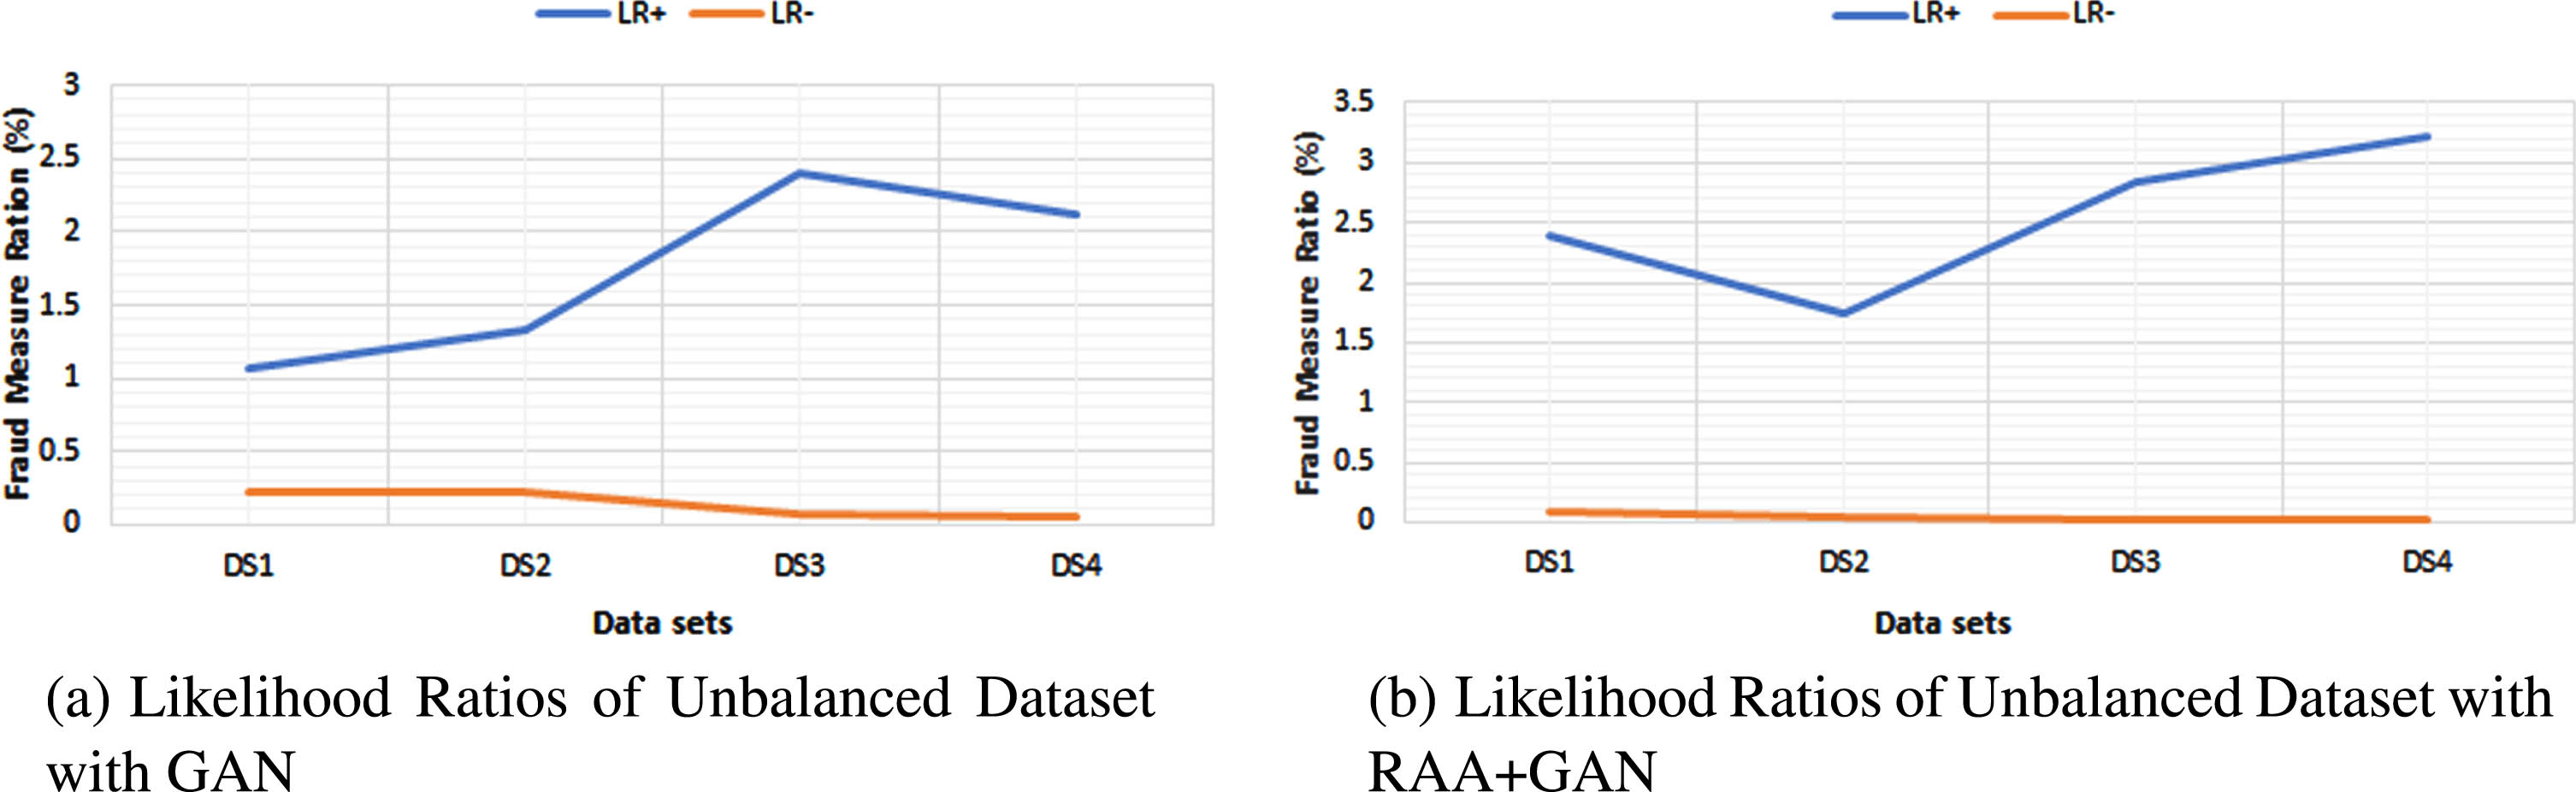
Results of Part 4 describes about how our proposed model works well on existing models. As part in our research work founded some existing imbalanced techniques VAE+GAN (Variational AutoEncoder) [37], OXGBoost+RandomSearchCV [38] (optimized XGBoost), DWE Overlapping+RF (Dynamic weighted Entropy) [24], robRose+LR (robust-Random oversampling examples) [23] and proposed RAA with GAN for effective classification. Table 10 specifies about comparison of RAA+GAN performance in terms of metrics accuracy and F1 score with different existing algorithms to all balanced datasets. Proposed model given Accuracy 96.73% for DS1, 96.16% for DS2, 95.61% to DS3 and 97.50% to DS4 as shown in the Fig. 11. And to know the performance of our proposed GAN, adopted two metrics as measures LR+ and LR–as shown in Equations (14) & (15). There is drastic change in the values between before unbalanced dataset and after getting the balanced dataset to improve proposed model as defined in Table 11. Therefore, comparison of unbalanced & balanced of LR+ and LR–are visualized in Fig. 12(a) & 12(b) through likelihood ratios of unbalanced dataset on GAN and a balanced dataset which is implemented by RAA using GAN are represented by the line graphs. This line graph shows the ratio of true positive on false positive (LR+) and the ratio of true negative on false (LR-) negative.
Comparison of existing imbalanced models with proposed imbalanced technique RAA.
Likelihood ratios.
Comparison:Accuracy,F1 Score Measures of Existing imbalanced Techniques with RAA
Generating values of LR+ & LR–for balanced and unbalanced GAN
The major constraint of binary classification in digital fraud detection is an imbalanced distribution between majority of fraud and minority of non-fraud data observations. Because of this, many algorithms intended to use only the majority class observations and might been classify all observations as non-fraudulent, which yielded a higher overall accuracy but lower precision with respect to minority class of interest. So, this research work focused on distribution of samples in the feature region. Generally, more popular ADASYN, SMOTE has been followed density distribution. The proposed modified ADASYN technique (RAA) utilized ND which has overcome the problems of decision boundary points as well as noisy points too. So, RAA is an appropriate solution for this imbalanced problem. The misproportion datasets (DS1-DS4) were experimented by proposed RAA. Then, performance of RAA is proved with GAN network for efficient fraud & non fraud classification.
Furthermore, one can also apply this proposed RAA to any kind of application that requires the support to balance the dataset. Meanwhile, these are the limitations of this work that need to be processed in future work. other distribution techniques between fraud and non-fraud can be considered. It may not work effectively related to finding overlapping outliers. Hence, we need to improve this by invoking methods for maximum separation of data points.