



Abstract
Detection and classification methods for the melt pool state in laser direct energy deposition (L-DED) can significantly help predict defects and mechanical properties of L-DED metal parts. Although traditional machine learning algorithms based on physical modeling methods and convolutional neural networks have recently been introduced into melt pool state identification, these methods rely on complex artificially designed features or cannot simultaneously detect defects in multiple dimensions. In this paper, a novel bilateral stream neural network was designed for melt pool identification, which performs defect identification in two label dimensions simultaneously. Two sets of single-channel experiments were designed to collect the dataset captured by a high-speed camera. By cutting the metal parts and marking them with professional equipment operated by professionals, the dataset was labeled according to the bonding condition and dilution rate criteria. Without an additive model structure, the model achieved 95.2% accuracy in identifying defects in the bonding condition and 92.8% in determining deficiencies in the dilution rate. In order to explain the identification mechanism of the model, the CAM method was utilized for the visual display of the model recognition process, which provides a potential application solution for the online monitoring method of the L-DED.
Introduction
In the past few years, additive manufacturing technology has received widespread attention from industrial applications and academic research. A large number of applications [1], especially in cutting-edge fields such as aerospace, nuclear energy, and medical treatment, require higher requirements for the shape, precision, and performance of components. However, traditional manufacturing methods, such as forging, welding, stamping, and other processes, cannot meet the needs of the above fields. Additive manufacturing technology, also known as 3D printing technology, utilizes a layer-by-layer stacking method to construct solid objects based on a three-dimensional model. This method frees manufacturing from the constraints of traditional manufacturing methods, making it possible to create high-performance and high-precision components. With the improvement of material application scope and manufacturing precision, additive manufacturing technology will bring revolutionary development to the manufacturing industry [2, 3].
Currently, laser manufacturing technology can be mainly divided into the following categories: powder-bed fusion, directed energy deposition, material jetting, sheet lamination, etc. Among them, directed energy deposition has the advantages of higher efficiency, flexibility, and cost effectiveness [4], which makes it more popular and suitable than other categories. It also possesses some advantages over subtractive manufacturing, particularly in the rapid prototyping of metallic parts, the production of complex and customized parts, as well as the cladding and repair of precious metallic components [5]. This paper investigates the melt pool of the laser direct energy deposition (L-DED) process.
Although the L-DED process has been widely developed, the mechanical quality of manufactured parts cannot be guaranteed due to uncontrollable defects. It is of great value to monitor the process and predict defects during manufacturing. Accurately tracking the manufacturing process is essential in the field of L-DED to improve part quality and reduce costs. However, this task is challenging in real-world implementations due to the high complexity of the process and the difficulty in analyzing the noisy condition monitoring data. Recent studies [6-10] have indicated that the melt pool provides the most valuable information about process quality, such as the geometry of the melt pool, the thermal dynamics, and the intensity of the temperature. Therefore, it is essential to monitor the state of the melt pool and identify its relationships with process parameters to reduce the occurrence of defects in components fabricated using laser-directed energy deposition. Compared with the temperature information of the melt pool, the geometric information is more popular to adopt because it is less complicated and expensive to implement. The melt pool images are usually collected by an industrial camera and charge-coupled device(CCD). In past studies, the quality analysis of melt pool images has relied mainly on computer graphics. For example, it can estimate the radius and center position of the photos of the collected melt pools, which can enable spatter detection via outlier classification [11]. In addition, a narrow and deep melt pool generated by high laser power may cause melt pool instability and intensive flow and further increase the porosity of the built part, which requires monitoring the geometry of the melt pool [12]. However, this task presents a significant challenge in real-world implementations due to the high complexity of the environmental conditions, in which splashes, vibrations, etc., affect the quality of collected data.
Since traditional digital image processing techniques are more susceptible to environmental disturbances and rely on parameter optimization, they are not very robust. In recent years, in computer vision, deep learning techniques have been proven to be a practical approach for data processing and have shown excellent compatibility in feature extraction. Compared to traditional image processing, this characteristic makes it highly suitable for real industrial applications.
Deep learning has demonstrated successful applications in monitoring industrial conditions in recent years. Furthermore, applying deep neural networks has dramatically improved the quality inspection process in additive manufacturing (AM). Ye et al. [13] proposed a deep belief network for quality assessment in SLM process monitoring that can be implemented efficiently and straightforwardly for real-world applications. Grasso et al. [14] conducted a comprehensive survey of monitoring methods in metal powder bed fusion (PBF), and their primary causes. Zhang et al. [15] proposing a deep convolutional neural network model for metal surface quality inspection in AM and validate the efficacy of the proposed approach by recognizing the beautiful-weld category from material CoCrMo top surface images. Marrey et al. [16] utilize an Artificial Neural Network model to optimize the process parameters. Delli et al. [17] proposed a method to evaluate the quality of 3D-printed parts. They utilized image processing and a supervised classification method, the support vector machine, to classify the pieces into the ‘good’ or ‘defective’ categories. Yuan et al. [4] utilized the DenseNet-39 model to distinguish the processing quality through the melt pool states. Li et al. [18] employ thermal imaging data obtained during the manufacturing process to identify the condition of the process and propose a deep convolutional neural network to identify the condition in the manufacturing process.
Although existing methods for detecting defects in additive manufacturing processes have made significant progress, they primarily focus on surface-level defects, such as discontinuities or deformations of the printed material. However, some abnormal phenomena strongly linked to internal defects have not been investigated.
In this paper, we focused on the bonding and dilution conditions of the single channel by L-DED, shown in Fig. 1, whose abnormal scenario could induce internal defects that affect the mechanical properties. Poor bonding between the current printed layer and the substrate or the previous layer induces a lack of fusion, pores or cracks, and lower mechanical properties. If the dilution rate is excessive, cracking and deformation often occur. Conversely, if the dilution rate is insufficient, the mechanical interlocking ability and bonding strength may be inadequate, leading to metallurgical bonding failure. Usually, we consider that the range of 10% to 30% is normal for printed parts to prevent the formation of defects. Considering the need for online monitoring, we tried to predict the bonding conditions and dilution rate via the information of the melt pool, which can be collected in real time by a CCD camera.
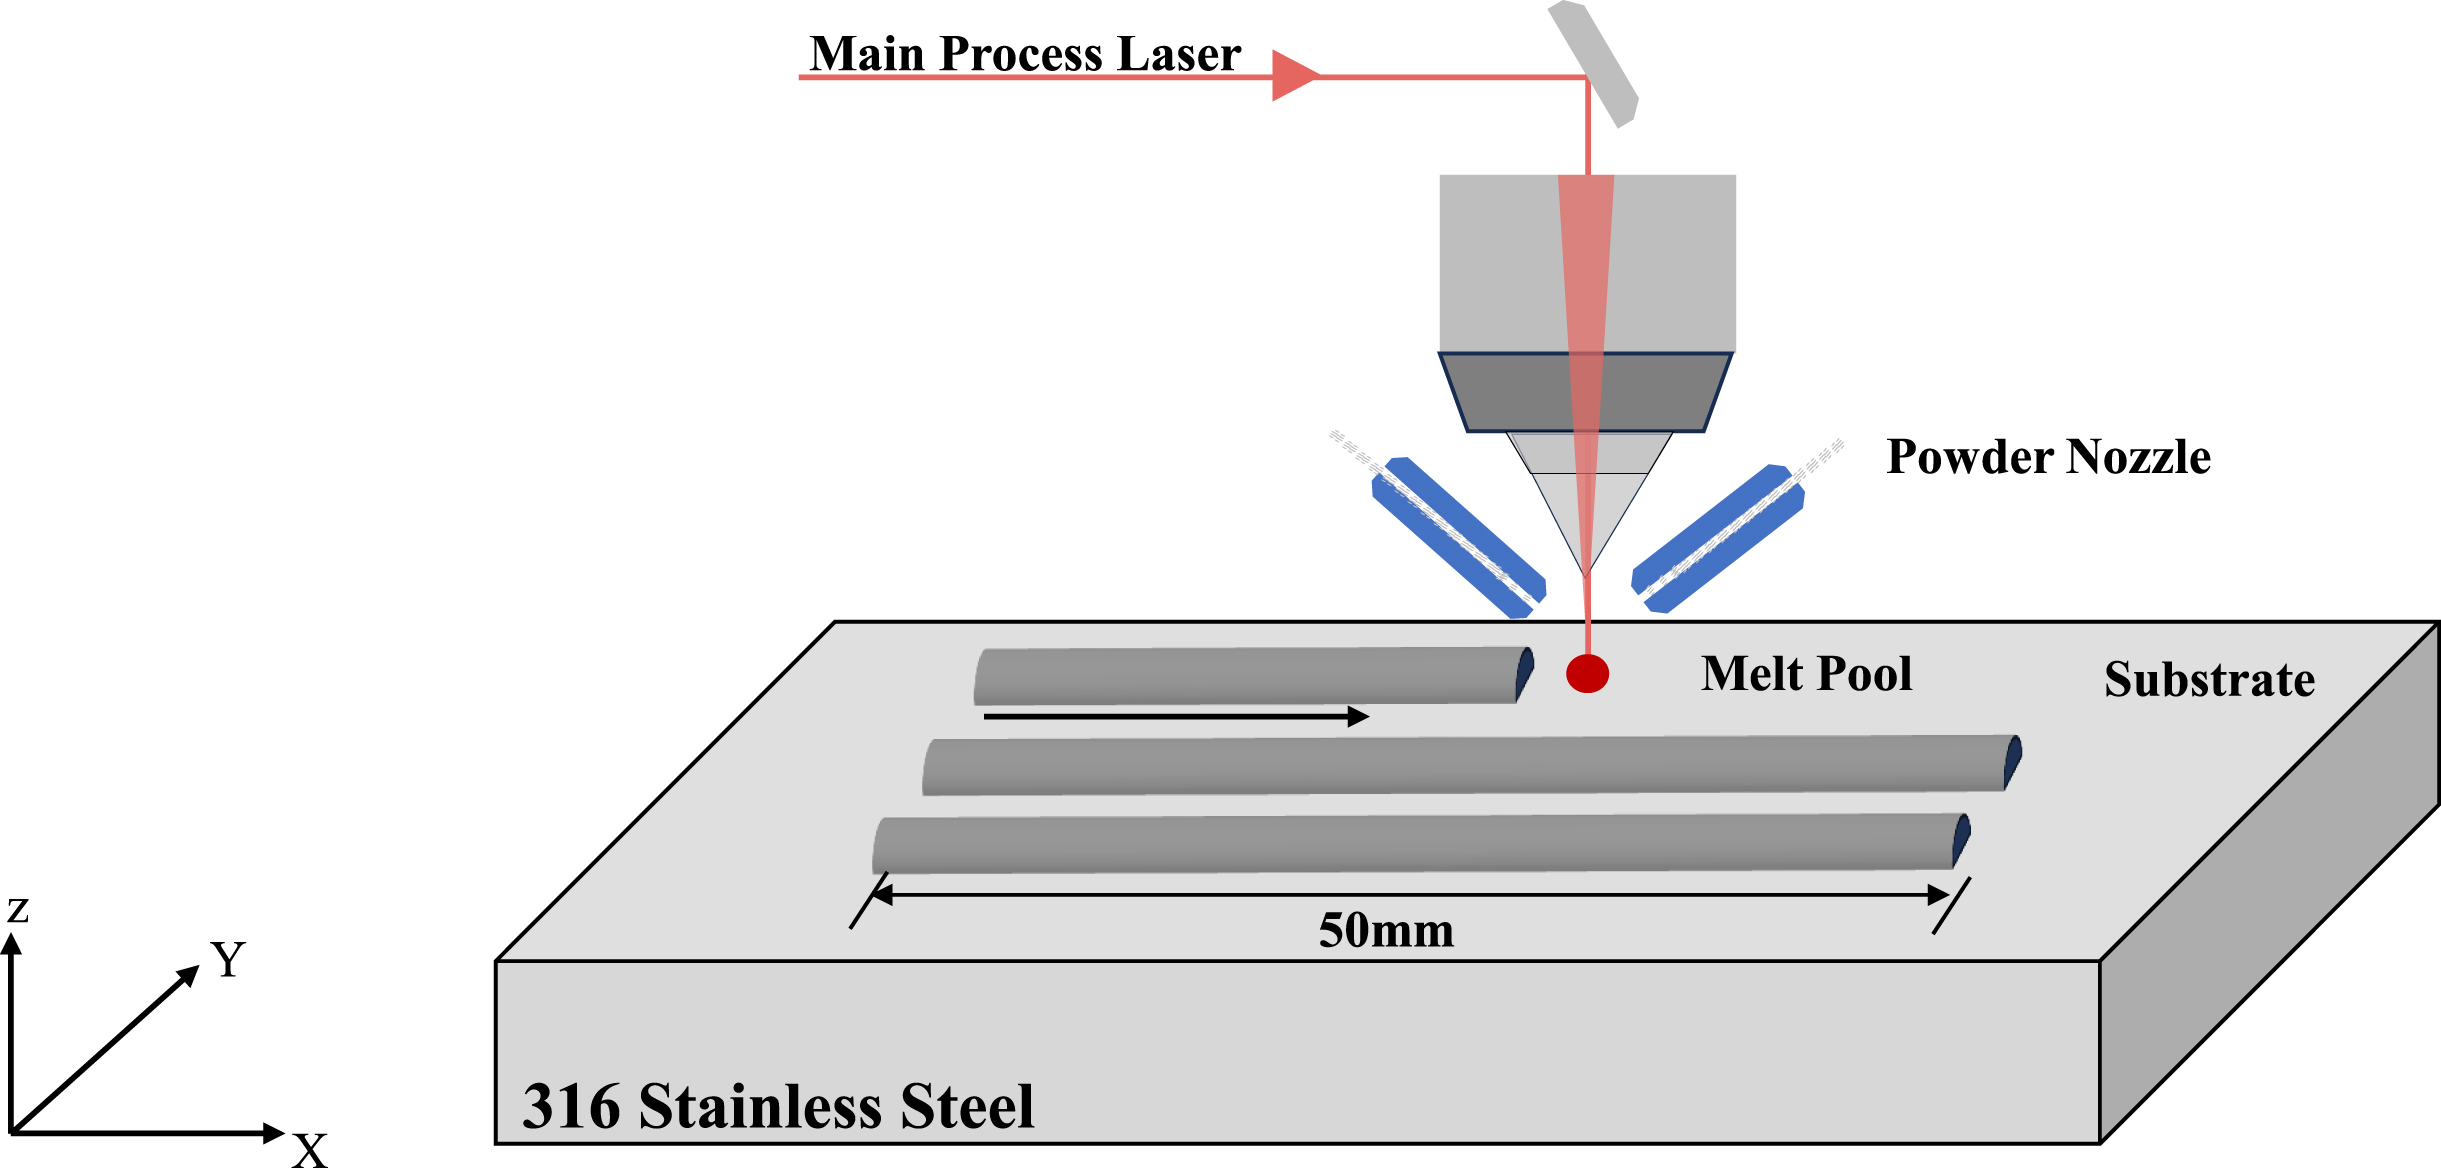
The schematic of the vision-based L-DED system.
To achieve this objective, we developed a neural network with two distinct branches, each responsible for recognizing defects according to the two dimensions described above. The first branch performs a two-class classification task, while the second performs a three-class classification task. To reduce the quantities of the model parameters, we designed a two-branch neural network sharing the same feature extractor. There is a potential issue with this approach. Specifically, training the feature extractor with datasets divided based on different labeling standards can lead to feature confusion. To this end, we designed the adaption module to alleviate this problem. This module has the function of an attention mechanism, which can reduce the confusion of model features. Experiments were conducted on real directed energy deposition (DED) melt pool datasets for validation. In addition, we employ the Class Activeness Mapping (CAM) technique [19], a visualization tool used to highlight the regions of an image most relevant to a given classification decision. By analyzing the CAM results, we can gain insight into the underlying mechanism of image classification and identify the salient features contributing to successful and unsuccessful predictions. The proposed monitoring method is briefly described in Fig. 2.
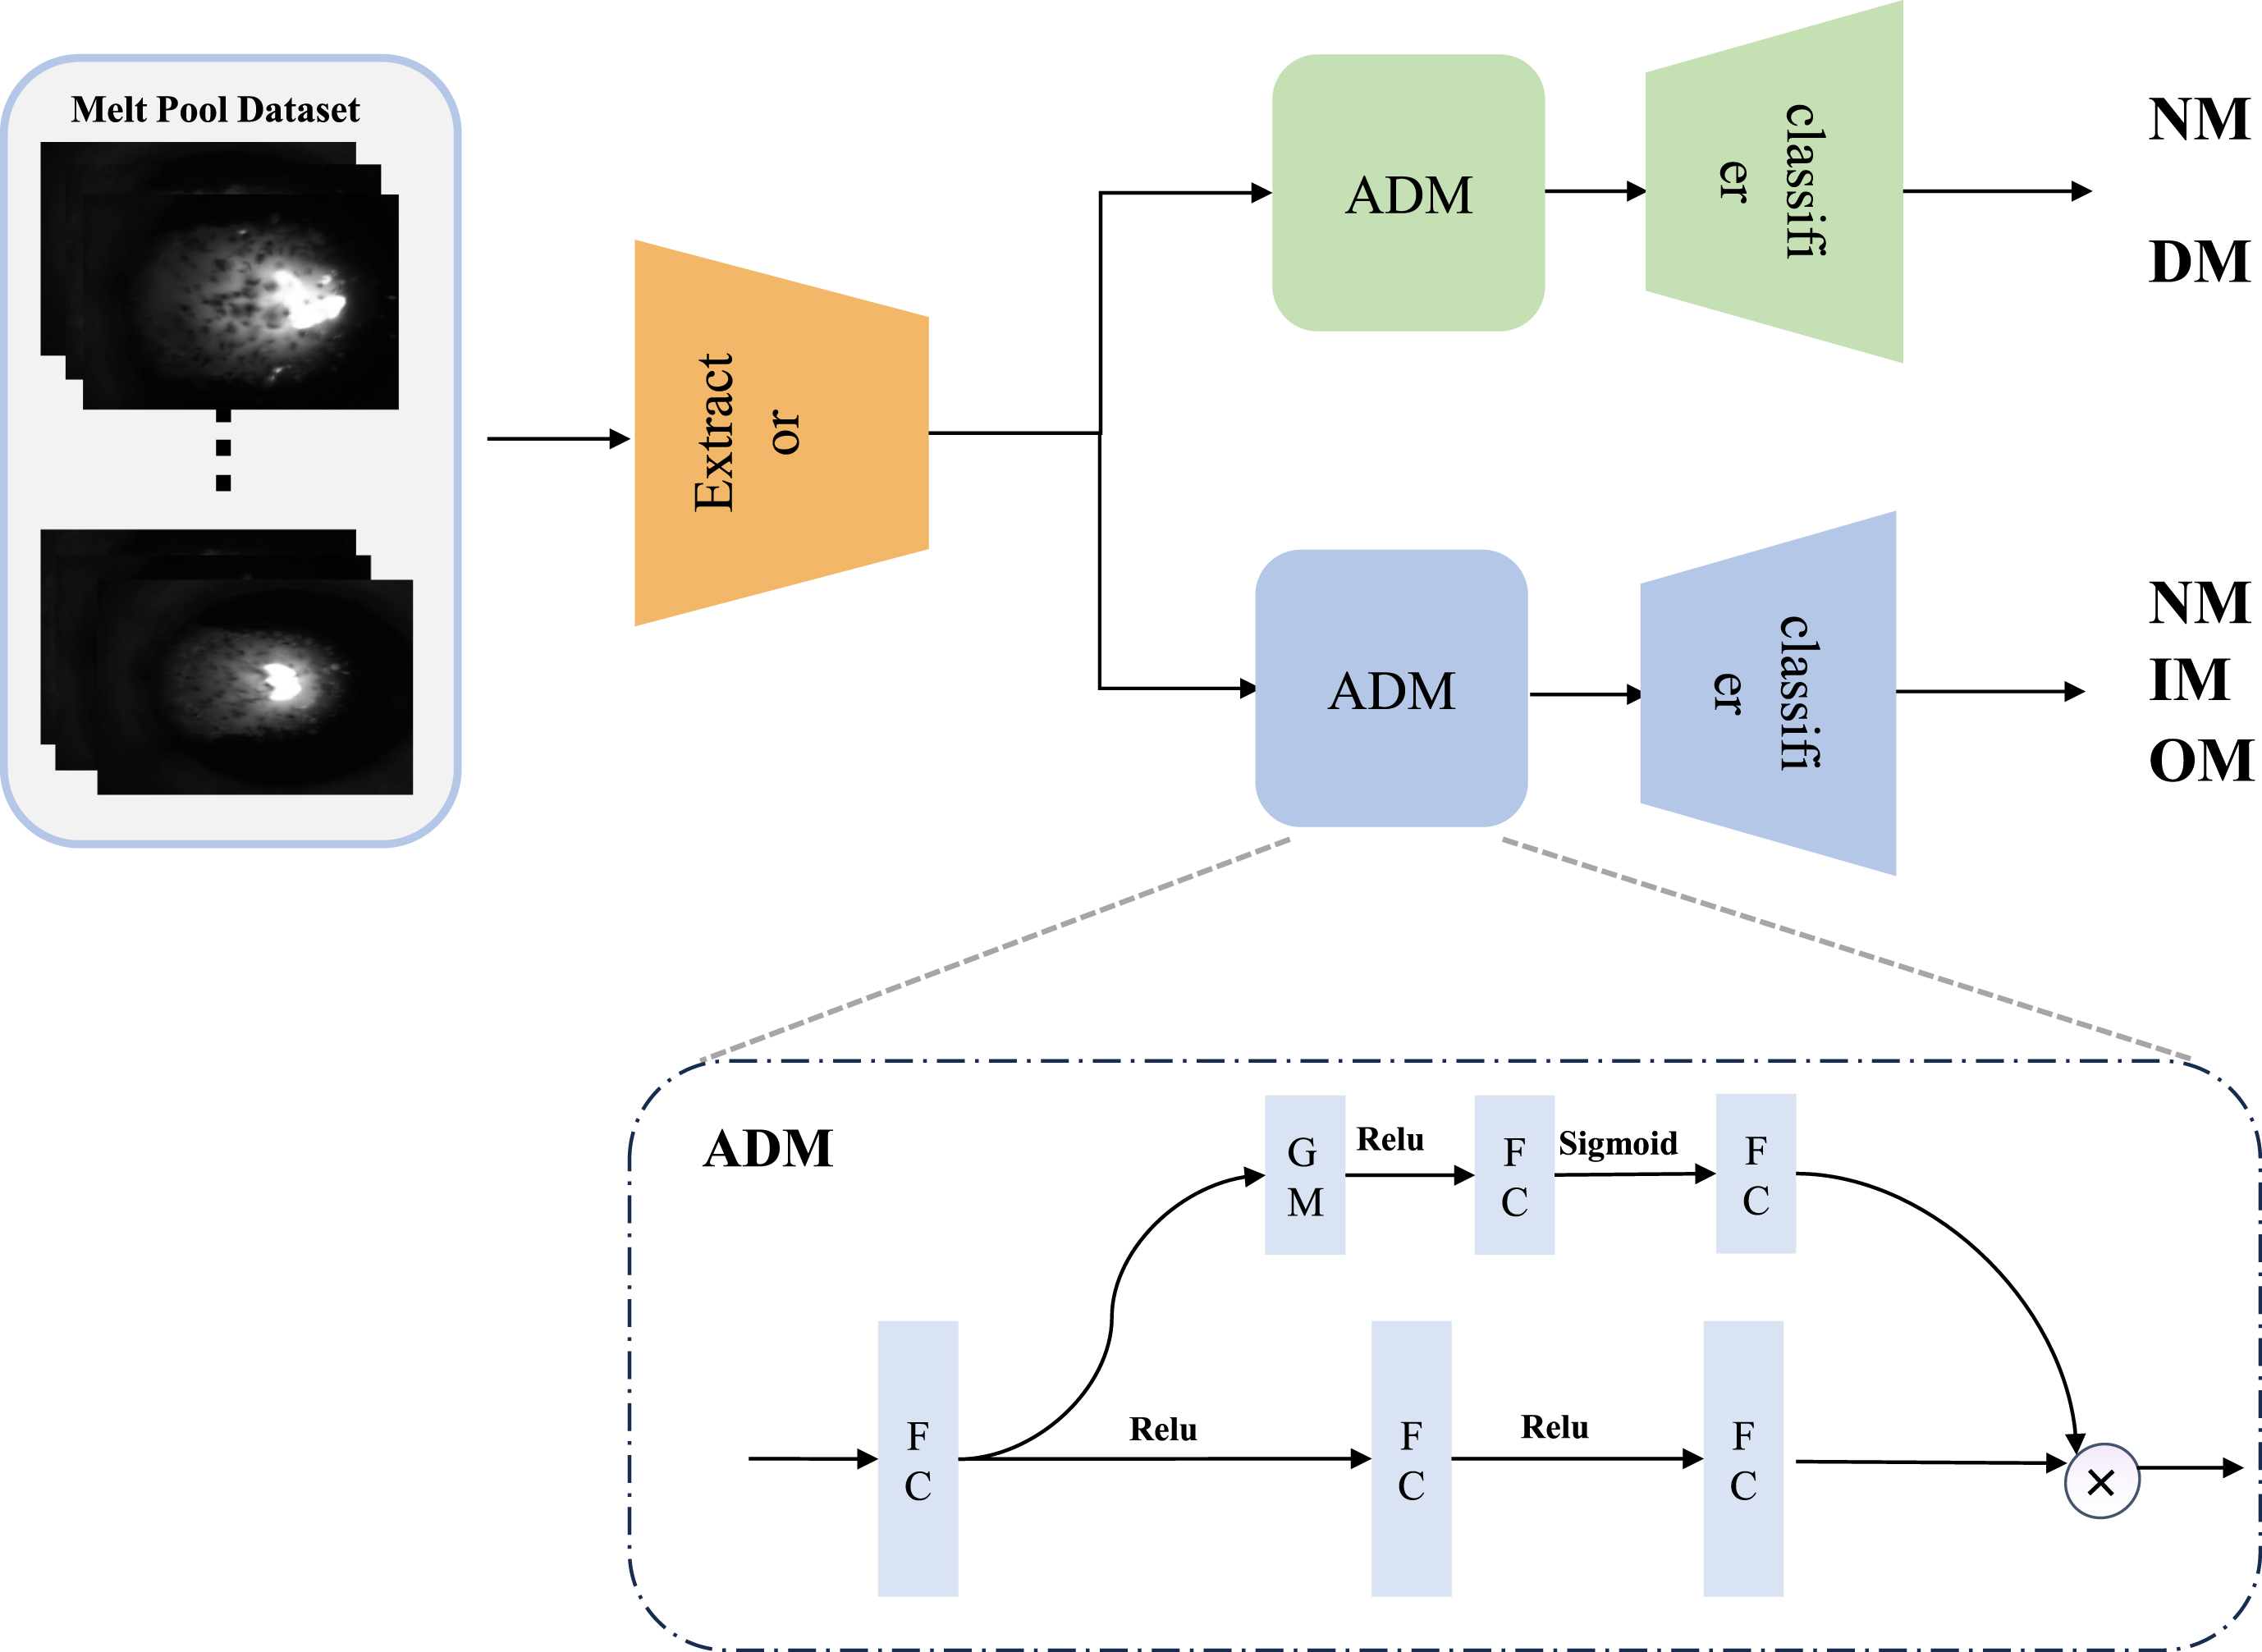
Visualization of bilateral stream neural network structure.
To summarize, the main contributions of this study are as follows: This study presents the first-ever dataset created for 3D printing, designed to cater to specific scenarios. The dataset has been annotated by professionals using advanced equipment. The melt pool image can effectively identify any quality defects present inside the printed part, which proves to be a valuable contribution towards the advancement of the intelligent manufacturing industry. Compared with other single-branch neural networks, We design a two-branch defect recognition network that can identify defects in two dimensions, the dilution rate dimension, and the bonding rate dimension, while sharing the same image feature extractor. A two-stage training method is devised, involving freezing certain weights during different training stages and the introduction of an adaptation module. This approach aims to achieve the function of identifying defects in two criteria dimensions. To enhance the credibility of the melt pool identification results, CAM technology is utilized to display them visually. This approach enables individuals to gain better insights into the link between the melt pool image and the overall quality of 3D printed components.
For this study, the melt pool state was categorized into four types: over-melt, under-melt, normal melt pool, and unformed melt pool. We define the melt pool images
Convolutional neural network
Artificial neural networks (ANNs) are computational models based on biological neural networks’ structure and function. The information flow in ANNs is determined by the inputs received and the corresponding outputs produced. ANNs are non-linear statistical models, indicating a complex relationship between inputs and outputs [20]. In the field of image recognition, the deep learning method typically involves two steps: feature extraction and classification [21]. Specifically, the fundamental theory of CNNs is briefly described below. The primary layer of CNN used for high-dimensional feature extraction is the convolutional layer. This layer consists of several convolutional kernels that compute feature maps. The weights of each kernel are shared over all spatial positions to generate a single feature map. The mathematical formulation for the output of the convolutional layer in CNN is expressed as follows:
The pooling layer, another important layer of CNN, is a subsampling operation that helps to make features more robust and improve computational efficiency. The pooling function can be denoted as P (·, and the mathematical formula for the pooling layer can be expressed as follows: where m represents the kernel size of the pooling operation, R denotes the feature map size, and
CAM is a common visualization method in computer vision that mainly uses the global average pooling layer in CNN to represent the image area that CNN uses to identify the category. We use CAM to visualize the region of interest in the process of model recognition of the melt pool image, which helps people understand the characteristics of the melt pool. For an input image, the activation of unit k in the last convolutional layer at a spatial location is represented as f
k
(x, u). Subsequently, for unit k, the outcome of applying global average pooling is obtained.
By inserting F k = ∑x,yf k (x, y) into the class score,S c ,we obtain:
We can define M
c
as the class activation map for class c, where each spatial element is determined by:
This paper proposes a melt pool deep learning framework with dual branches to address process monitoring issues in additive manufacturing. The diagram presented in Fig. 2 illustrates the model’s architecture, which features two branches capable of executing process monitoring tasks in two distinct dimensions. Assuming that the camera has captured the melting pool images, the images are initially processed through the image feature extractor. This network is designed to be end-to-end, so we have designed the feature extractor to be shareable. This design choice offers the advantage of reducing the number of parameters in the network, which leads to an increase in calculation speed. Moreover, the image feature extractor can be combined with popular network structures in the field of computer vision, such as Vision Transformer [22], Swin Transformer [23], EfficientNet [24], ResNet [25], etc. The advantage of using these pre-trained models is that they can reduce the design difficulty and training cost of the structure and leverage transfer learning techniques to transfer weight parameters from pre-trained models. This approach aims to improve the training speed and accuracy of the model. In order to make each branch complete the classification task under the common feature extractor, we designed an adaptation module(ADM) for each branch. The ADM module is a conditioning module with dynamic attention enhancement. As can be seen in Fig. 2, the feature first improves the dimension through the first FC layer, then restores the previous dimension through an FC layer, dynamically adjusts the features after the FC layer through the attention mechanism, and finally passes to the classifier. The purpose of this is to solve the problem that when using the shared feature extraction module to extract image features, the feature spaces under different label standards may be relatively single, which cannot meet the differentiated features, thus affecting the performance of the classifier. Therefore, we use the ADM module to transform the shared features into a feature space with differentiated labels, thereby improving the discriminability of the features and further improving the performance of the classifier.
Network optimization
The deep learning model proposed in this study comprises many parameters, including the weights and biases in each layer. Consequently, optimizing the network is crucial. To this end, a supervised learning paradigm was employed for network training, where the model was trained to minimize the empirical classification errors on the labeled training data. We utilize the cross-entropy loss function to measure the dissimilarity between the predicted probability distribution and the true probability distribution of the target variable. It can be defined as:
By minimizing the objective function L during the training process, it is possible to reduce the prediction errors in the training data, which can improve the performance of the model to fit the underlying patterns in the data and make accurate predictions in the test data.
In this study, the laser direct energy deposition (L-DED) process was employed using gas-atomized 316L stainless steel (316L SS) powders with diameters ranging from 45 to 150 um and melting temperatures between 1200 and 1300°C. Table 1 presents the chemical composition of the 316L SS powders. The substrate material utilized for the L-DED process was 316L bulk steel, which was produced by hot rolling and had dimensions of 150 Œ 150 Œ 8 mm. To mitigate any potential impact of metal oxide contamination on the substrate’s surface, the substrate was polished prior to experimentation to remove any oxide layer.
Chemical composition of 316L SS
Chemical composition of 316L SS
The present study conducted laser cladding experiments using a three-axis motion platform, the iLAM 510C, manufactured by Nanjing Huirui Photoelectric Technology Co., Ltd. The platform was equipped with a Laserline 6-kW laser and a coaxial powder feed nozzle. The vision-based laser cladding process control system, comprising a high-speed CCD camera from Daheng Imaging Compan and a Jetson AGX Xavier was used to capture grayscale images of the melt pool during the directed energy deposition (DED) process, and a vision acquisition camera was employed. Melt pool images were recorded at a high acquisition frequency of up to 200 fps using a high-speed camera from Daheng Imaging Company. To ensure safety and prevent potential damage caused by laser radiation, light emitted from the melt pool was filtered using a blocking filter with a wavelength of 808 ś 20um before being imaged on the CCD camera sensor. Gas-atomized powders of 316L stainless steel (316L SS) with diameters ranging from 45 to 150 um and melting temperatures between 1200 and 1300°C were used in the L-DED process. The substrate was polished prior to conducting the experiments to eliminate any impact of the metal oxide layer on the substrate on the experimental results.
Experiment dataset
We designed two sets of DOE experiments with three factors and five levels using the Taguchi method, which made the range of selected parameters wider. We obtained 50 sets of single-track samples through experiments, each with a length of 50 mm. During the printing process, the melt pool image is collected in real-time by the CCD camera, and the real-time frame rate of the CCD camera is 200 fps. It has been observed that if the original video is split directly into video frames, the data set will be redundant. Therefore, when we split the video frame, the fps is reduced to 20, which not only preserves the change in the state of the melt pool but also reduces the burden of the large dataset. The resolution of the melt pool images captured by the camera is 512, but in order to save training resources, they are directly reduced to 256 during actual training. However, unlike previous melt pool monitoring methods, we only reduce the resolution of the melt pool images without cutting out the melt pool region through prior knowledge. The reason for doing this is that we hope this method is end-to-end and minimizes the intervention of manual prior knowledge. The experimental settings of DOE can be seen in Tables 2 and 3. We use Experiment 3 as the source of the main experimental data set and Experiment 2 as a supplement to the dataset.
Design of Experiment I with different parameters
Design of Experiment I with different parameters
Design of Experiment II with different parameters
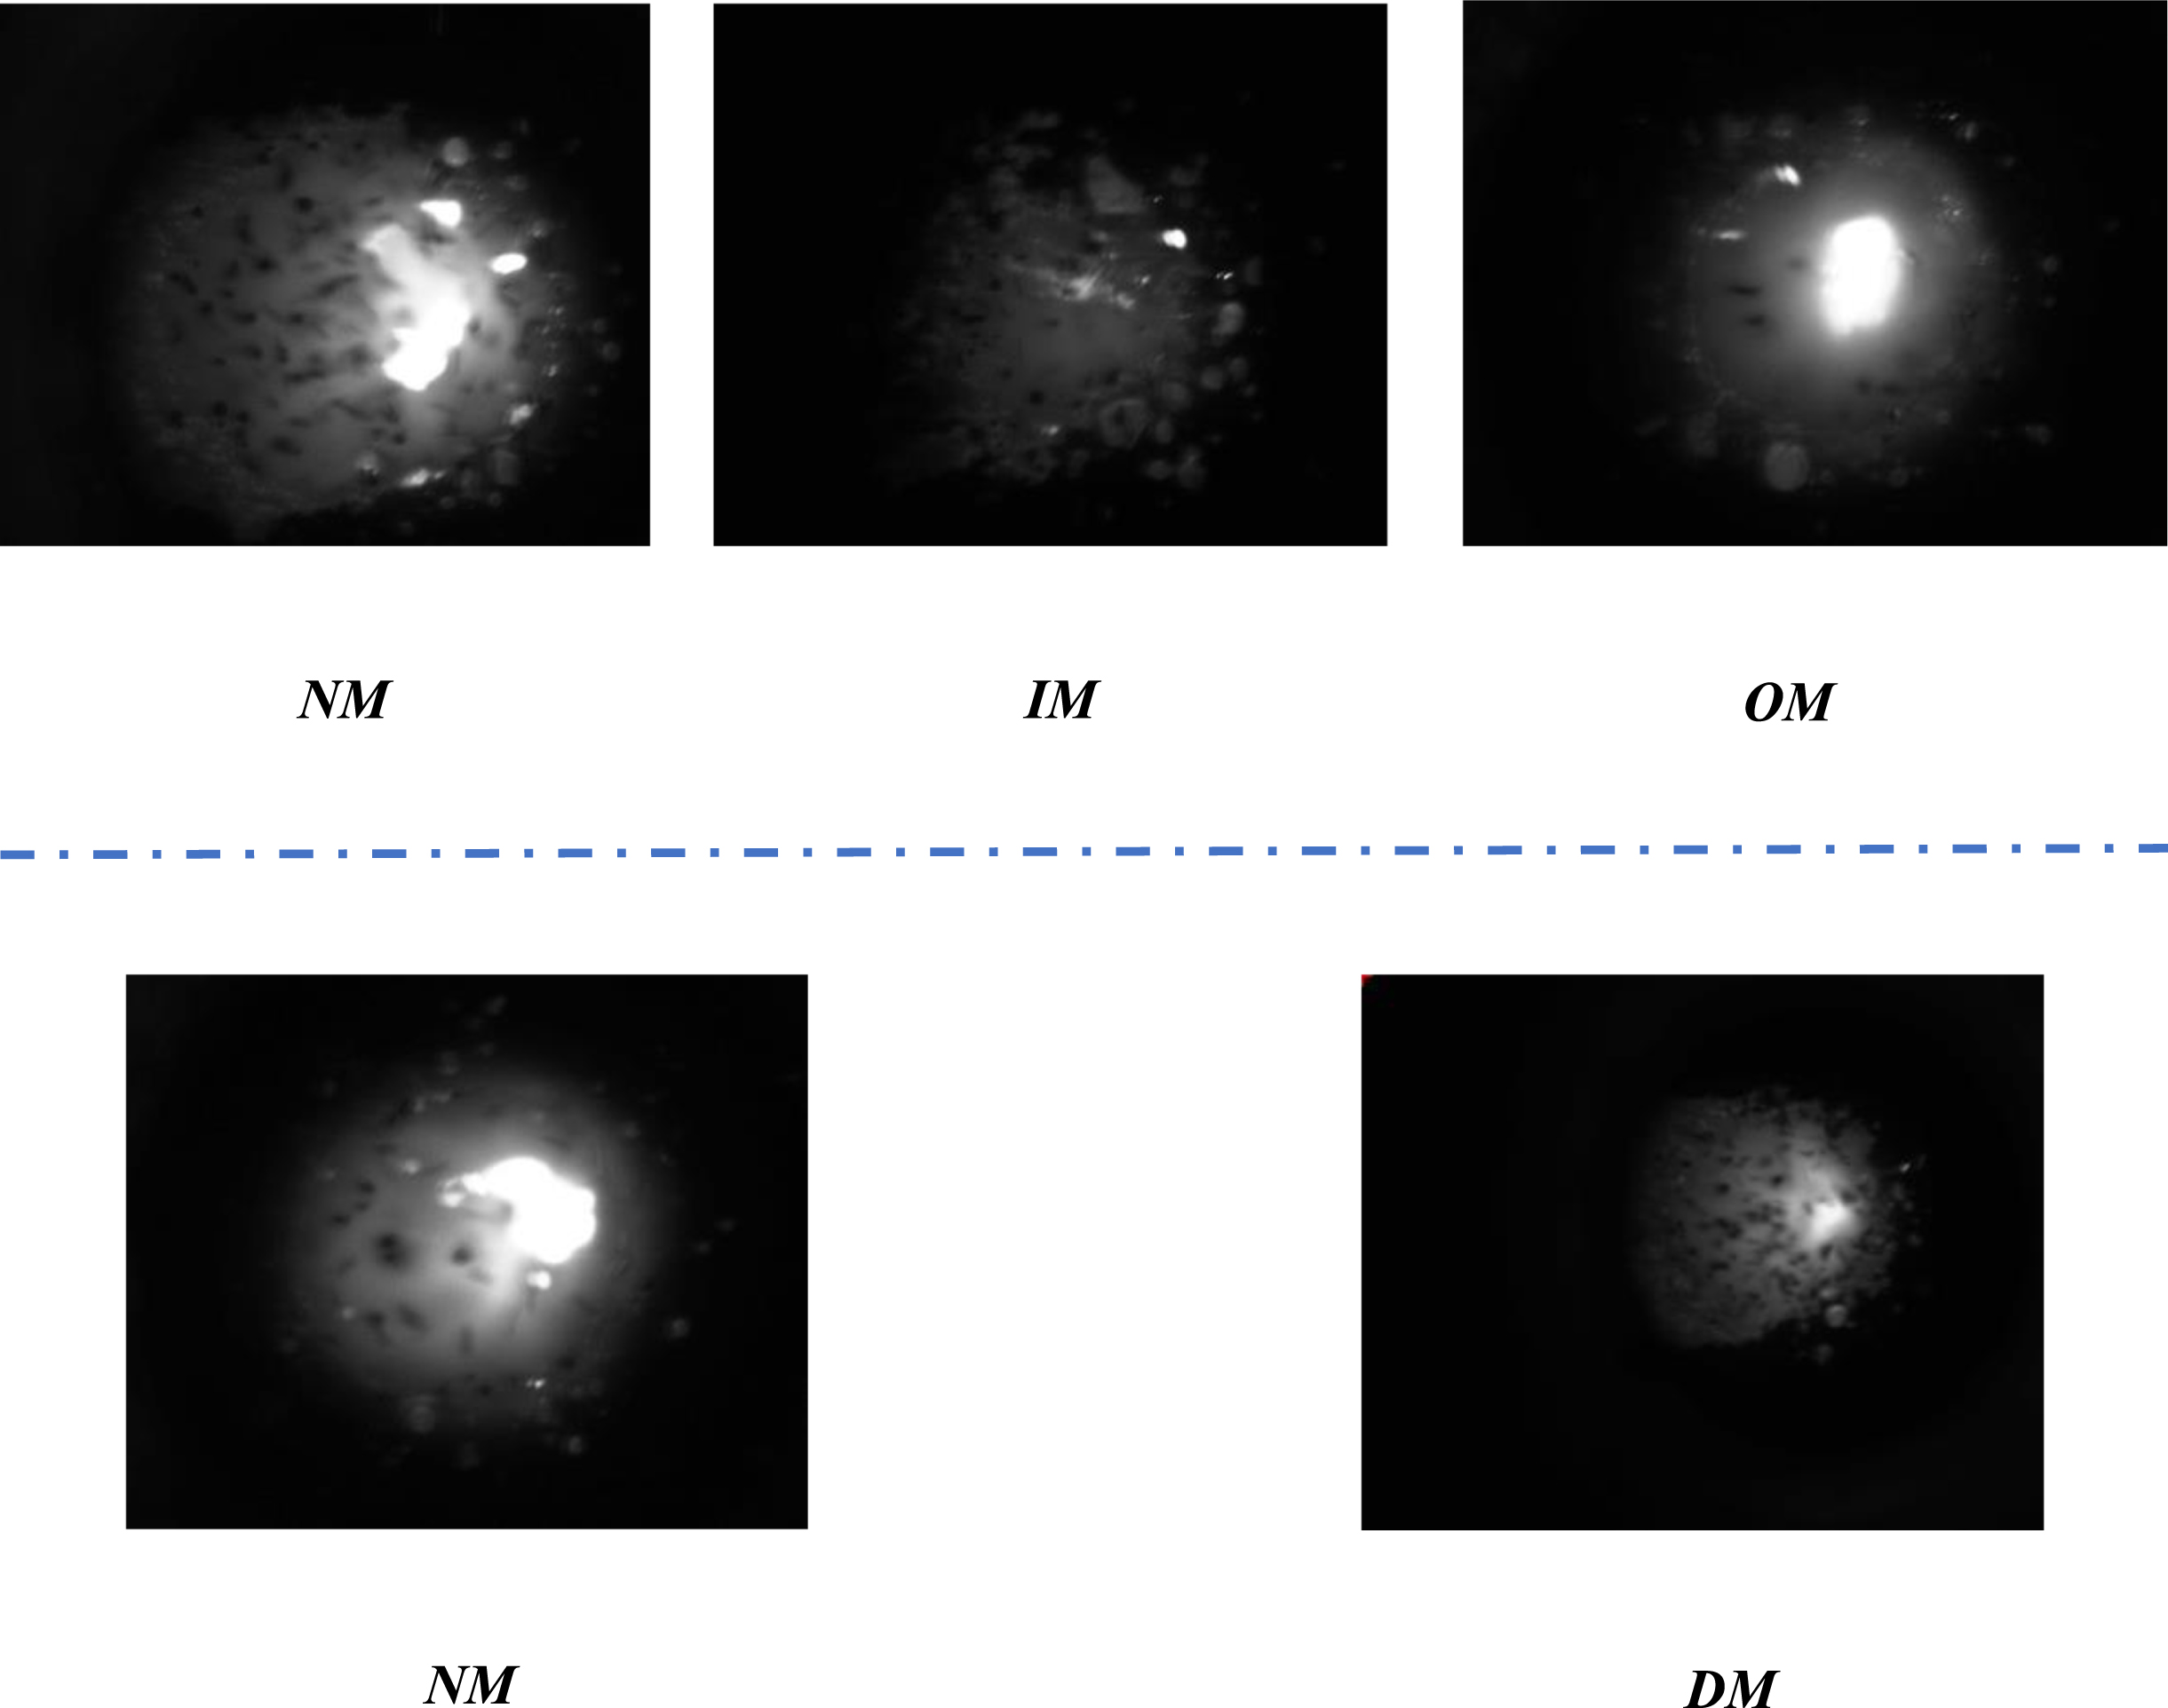
The primary goals of this research are to track the various states of the melt pool utilizing images and to examine the potential advantages of real-time monitoring within the L-DED system. The diverse shapes of the melt pool can indicate variations in the quality of the printing parts [26]. The quality of the melt pool reaction can result in surface defects, as well as internal defects that are not detectable by human eyes. Based on previous research [27], the melt pool state can be categorized according to the surface melting state of the printed part. Taking inspiration from this approach, this work aimed to classify the melt pool based on the dilution rate of the printed part, specifically identifying the melt pool into three categories: over-melting (OM), normal melting(NM), and incomplete melting(IM). In another judgment standard, we further divided the melt pool into normal melting(NM) and discontinuity melting(DM) based on the degree to which the printed parts were bonded together. Figure 6 shows typical examples of the melt pool labels based on their dilution rate of the melt pool and the bonding degree of the printing part. The calculation of the dilution rate was based on measurements from the printed cross-section. As can be seen from Fig. 3, the height of the cladding layer is H and the depth of the melted substrate is D, the dilution rate can be defined as:
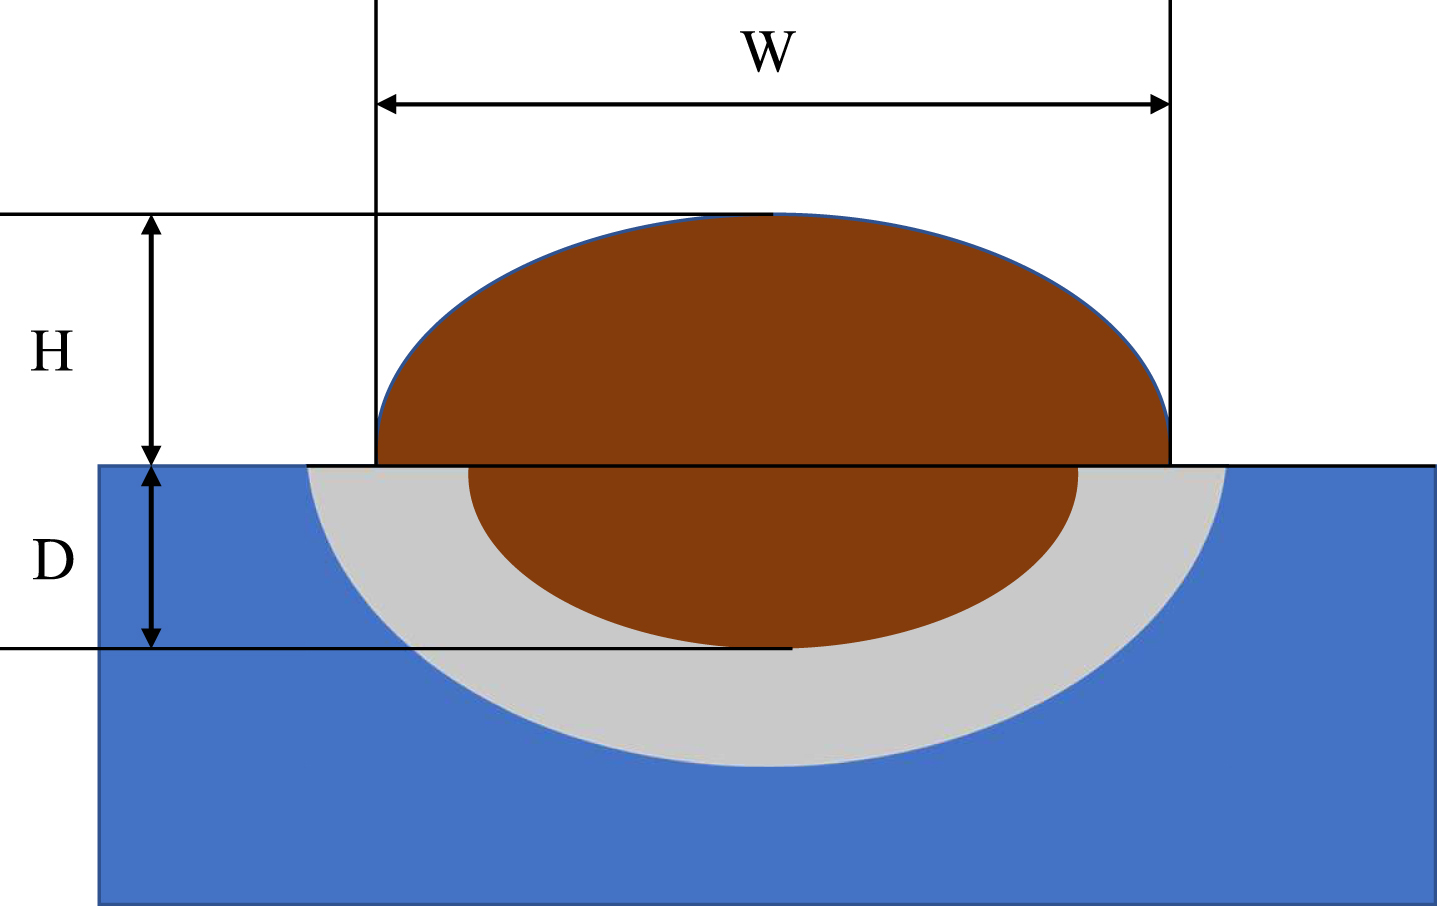
Visualization of the Cross section of the printed part. W represents the width of the melt pool, H represents the height of the melt pool, and D represents the depth of the melt pool.
The labels for the different melt pool states are defined as follows: Based on the experiments, we have determined that a dilution rate exceeding 30% indicates over-melting (OM) of the material, while a dilution rate below 10% indicates incomplete melting(IM). When the dilution rate falls within the range of 10% to 30%, we consider the print part normal melt(NM). In terms of fit, we believe that normal fit is normal, and non-fit is discontinuity melting(DM). The cross-sectional photo of the corresponding label is shown in Fig. 4. The training strategy that we adopt is a two-stage strategy. In the first stage, we used a dataset labeled based on the bonding condition, and in the second training stage, we froze the feature extractor and trained on a dataset labeled based on the dilution ratio. During this stage, the loss value calculation was performed using another classifier. At this point, the ADM and classifier from the first stage did not participate in the gradient update, ensuring that the weights of this part remained unchanged. Following the completion of the second training stage, we obtained a melt pool defect classification model that can detect the defect in the two labeled spaces. The detailed training process is shown in Fig. 5.
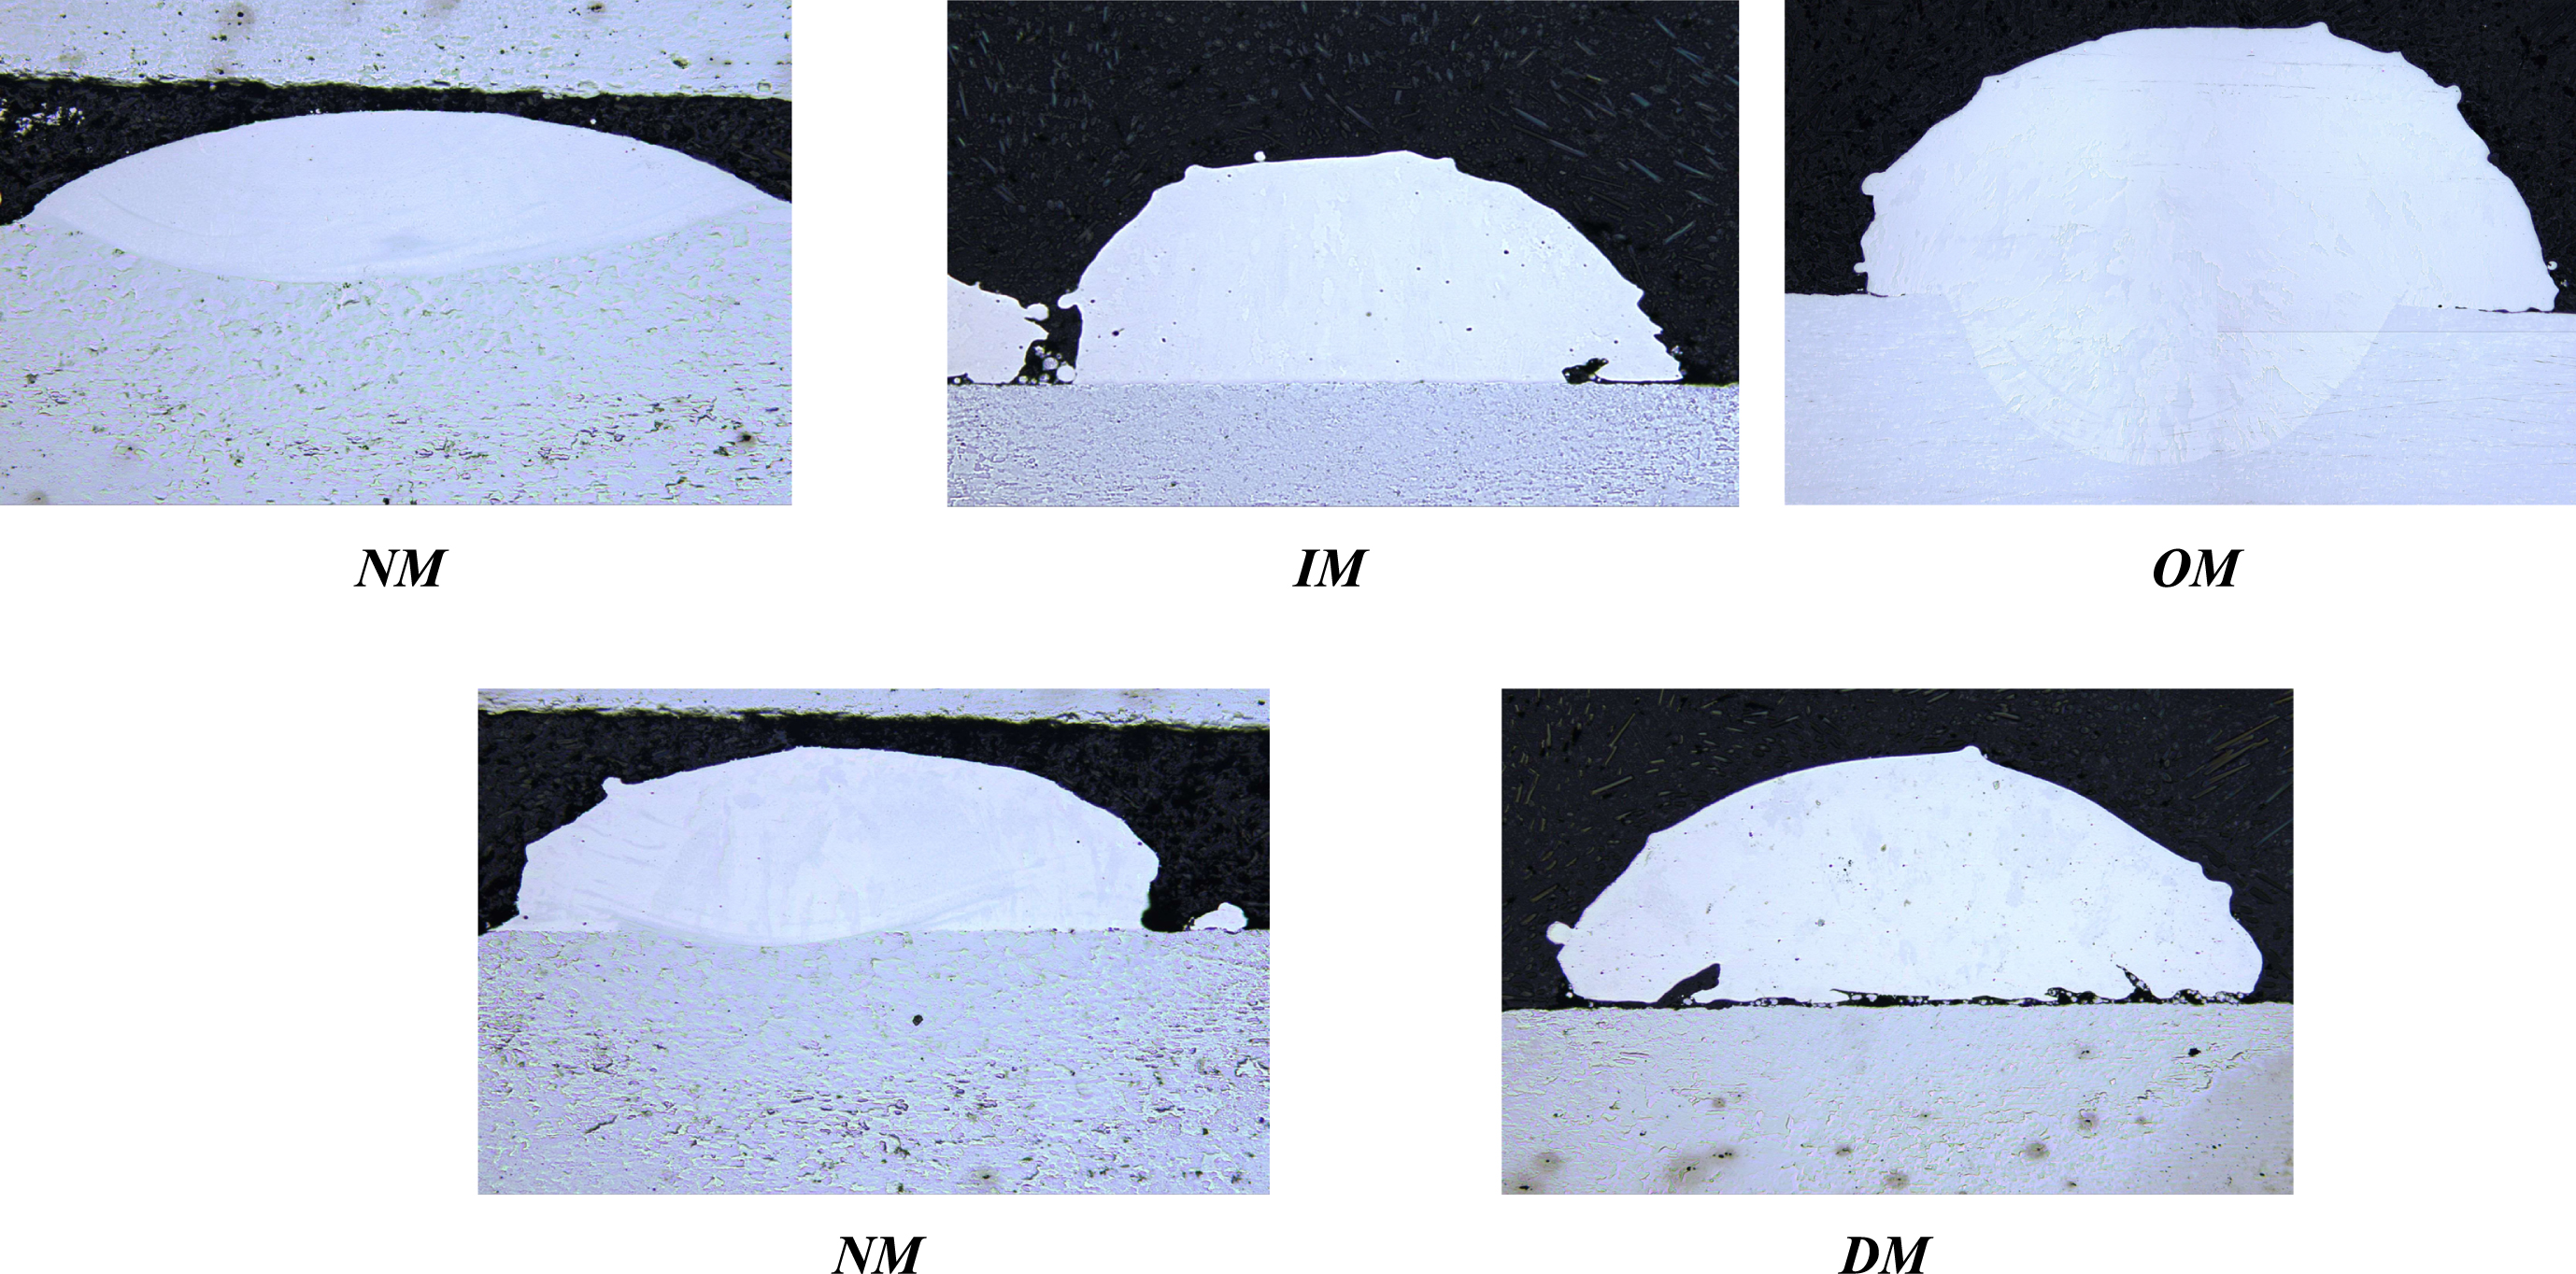
Typical image data of the cross-section of the single channel by L-DED. We divided the data into three categories according to the measurement result of the dilution rate, which are NM, IM, and OM, and divided the data into two types according to the bonding condition, which are NM and DM.
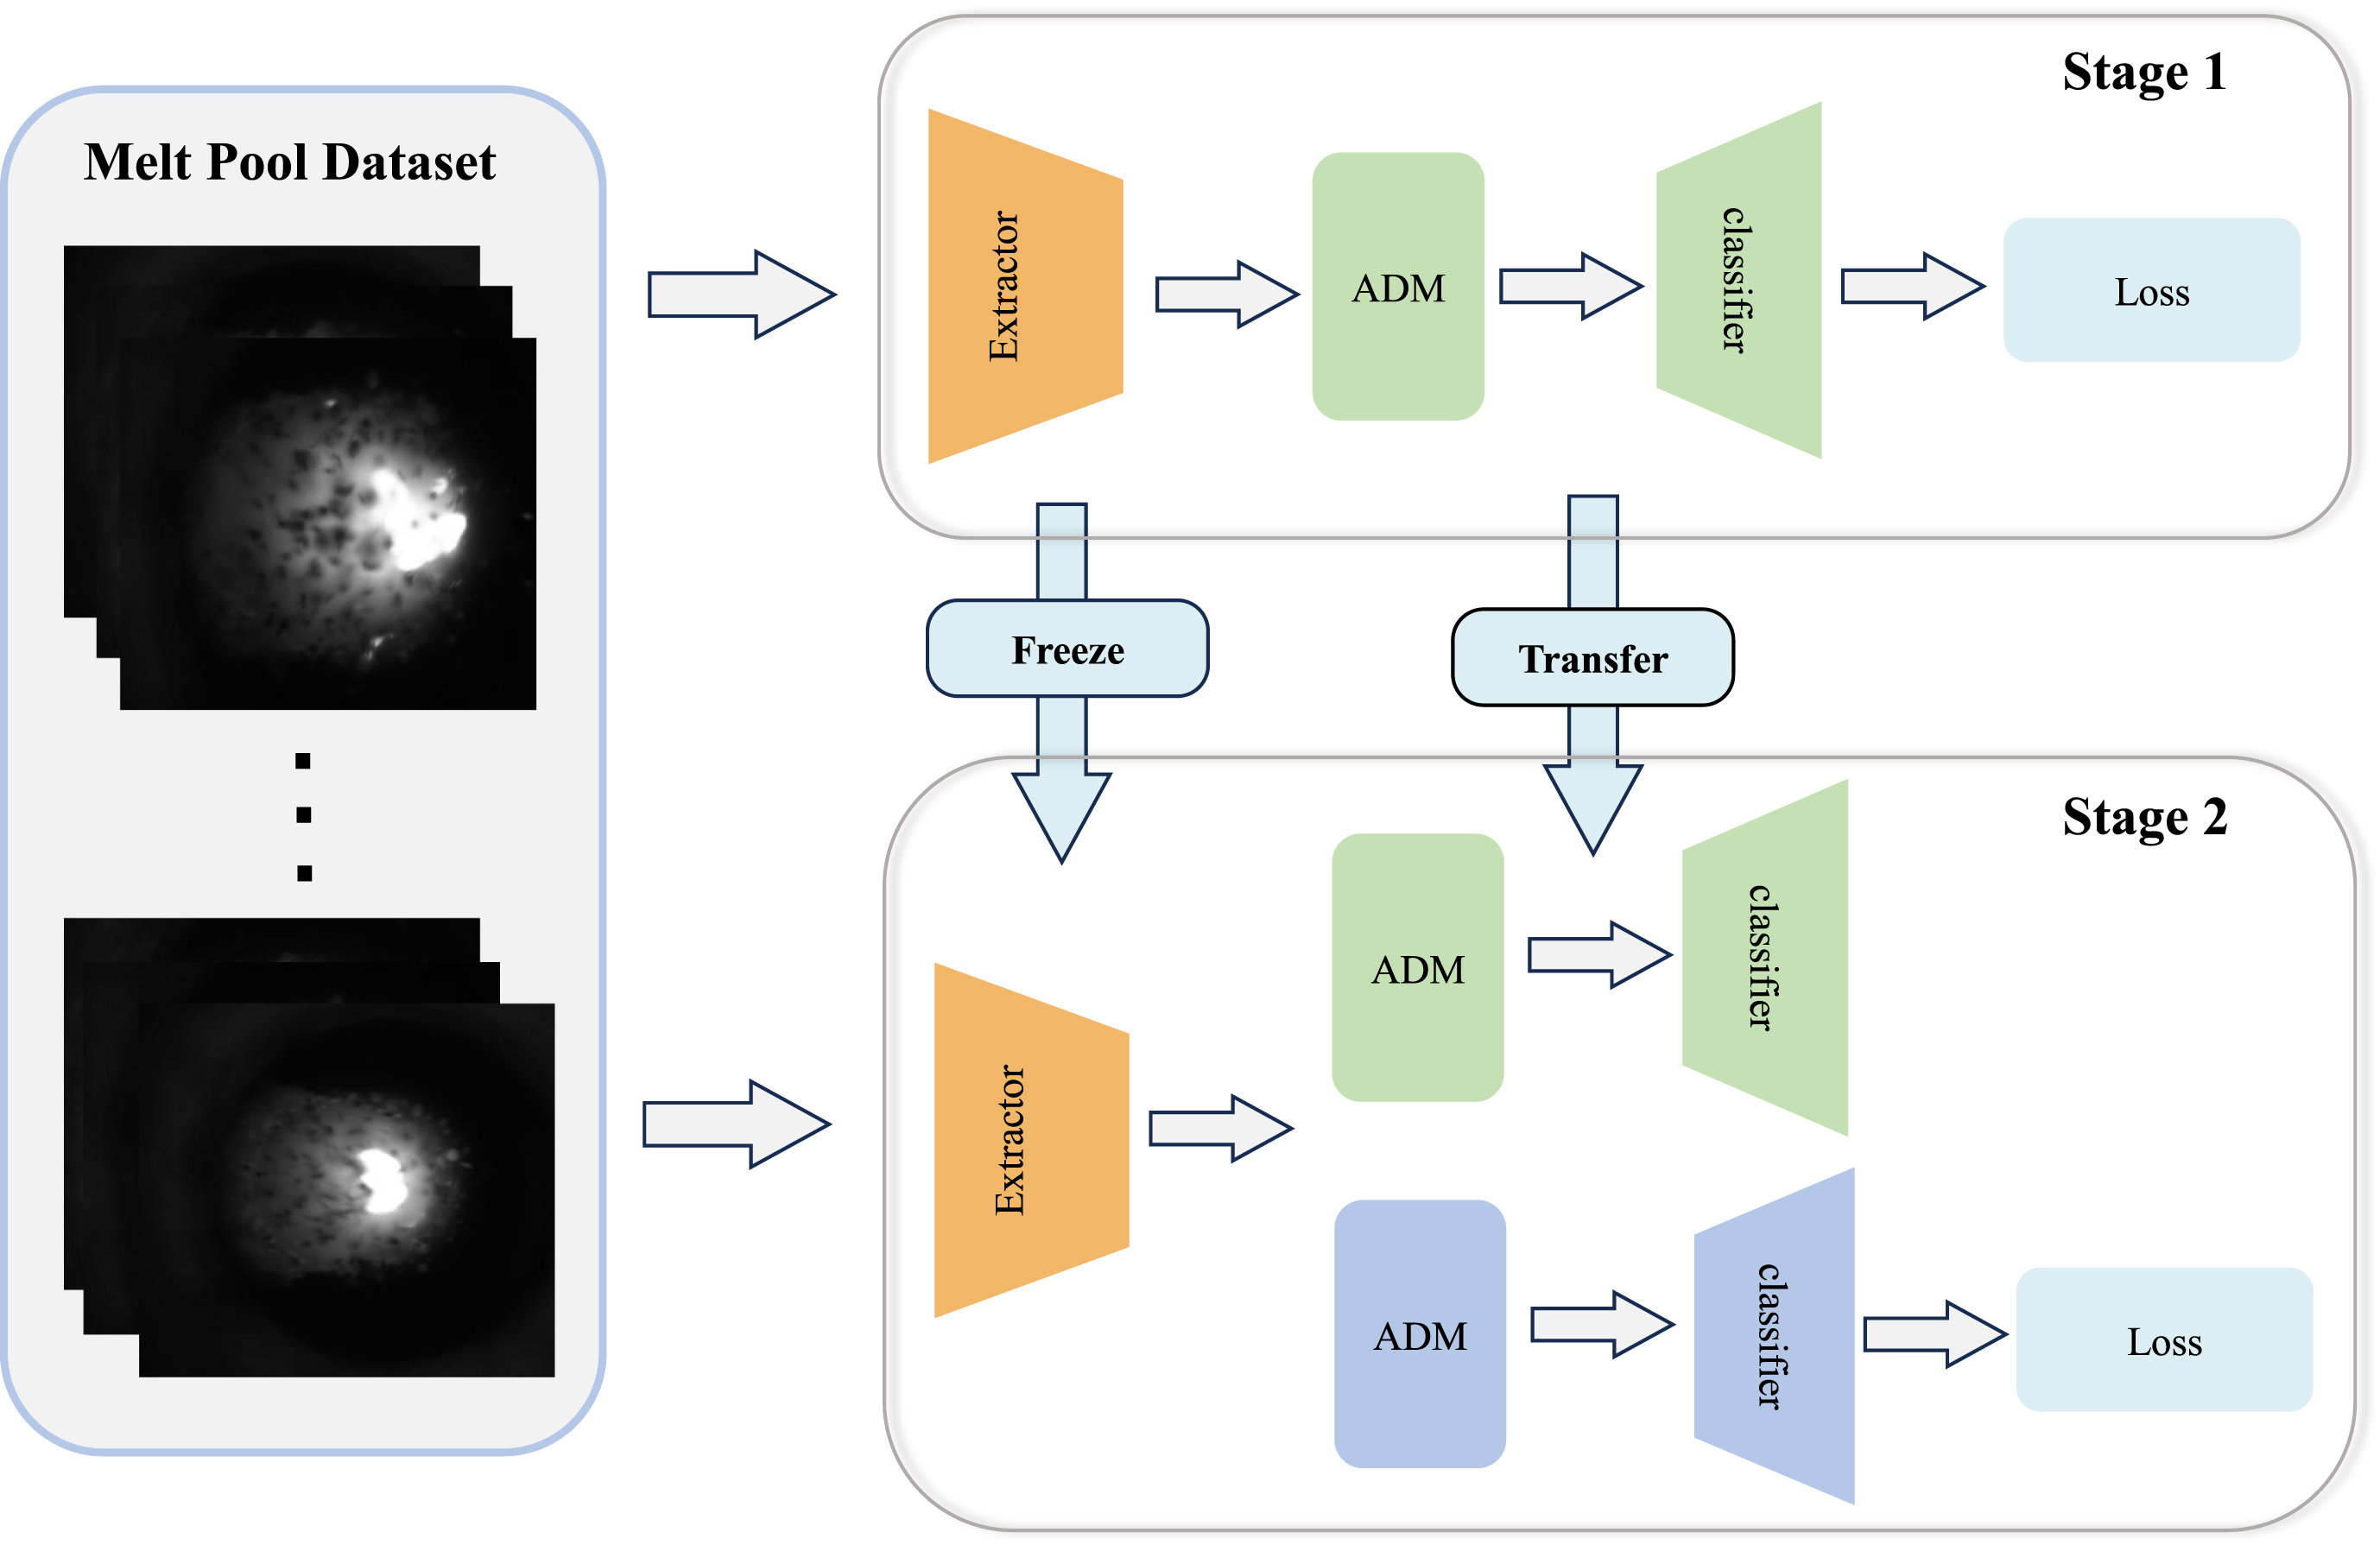
Visualization of the two-stage training process. We train the feature extractor first, then freeze it and train only the ADM and classification modules.
Visualization of the melt pool image with four categories: NM, IM, ON, DM.
We conducted experiments using prevalent visual pre-trained models in the computer vision field, including convolutional neural networks (CNNs) such as ResNet and EfficientNet, as well as Transformer-based neural networks such as Vision Transformer and Swin Transformer. All results can be seen in Table 4. To evaluate the effectiveness of the classification model, we utilize the metrics of Accuracy, Precision, and Recall, which are defined as follows:
Performance of the feature extractor with different pretrained methods
A true positive (TP) refers to a scenario where the model accurately predicts the positive class. Likewise, a true negative (TN) is an outcome in which the model correctly predicts the negative class. Conversely, a false positive (FP) occurs when the model incorrectly predicts the positive class and a false negative (FN) arises when the model incorrectly predicts the negative class. It can be seen from Fig. 7(a) and 7(b) that under different types of feature extractors, no matter which training stage it is, the loss will converge during the training process. We evaluated the performance of the model on the test set and found that the Swin Transformer outperformed the other models in identifying bonding defects, while EfficientNet-B5 performed the worst. Conversely, Swin Transformer performed the best in identifying dilution rate defects, while EfficientNet-B5 showed the poorest recognition performance. This trend is consistent with the performance observed in the first stage of the experiment. The CAM method is employed to visualize the model. The visualization results are shown in Fig. 8. It can be seen that the area of interest of the model is concentrated on the center of the melt pool.
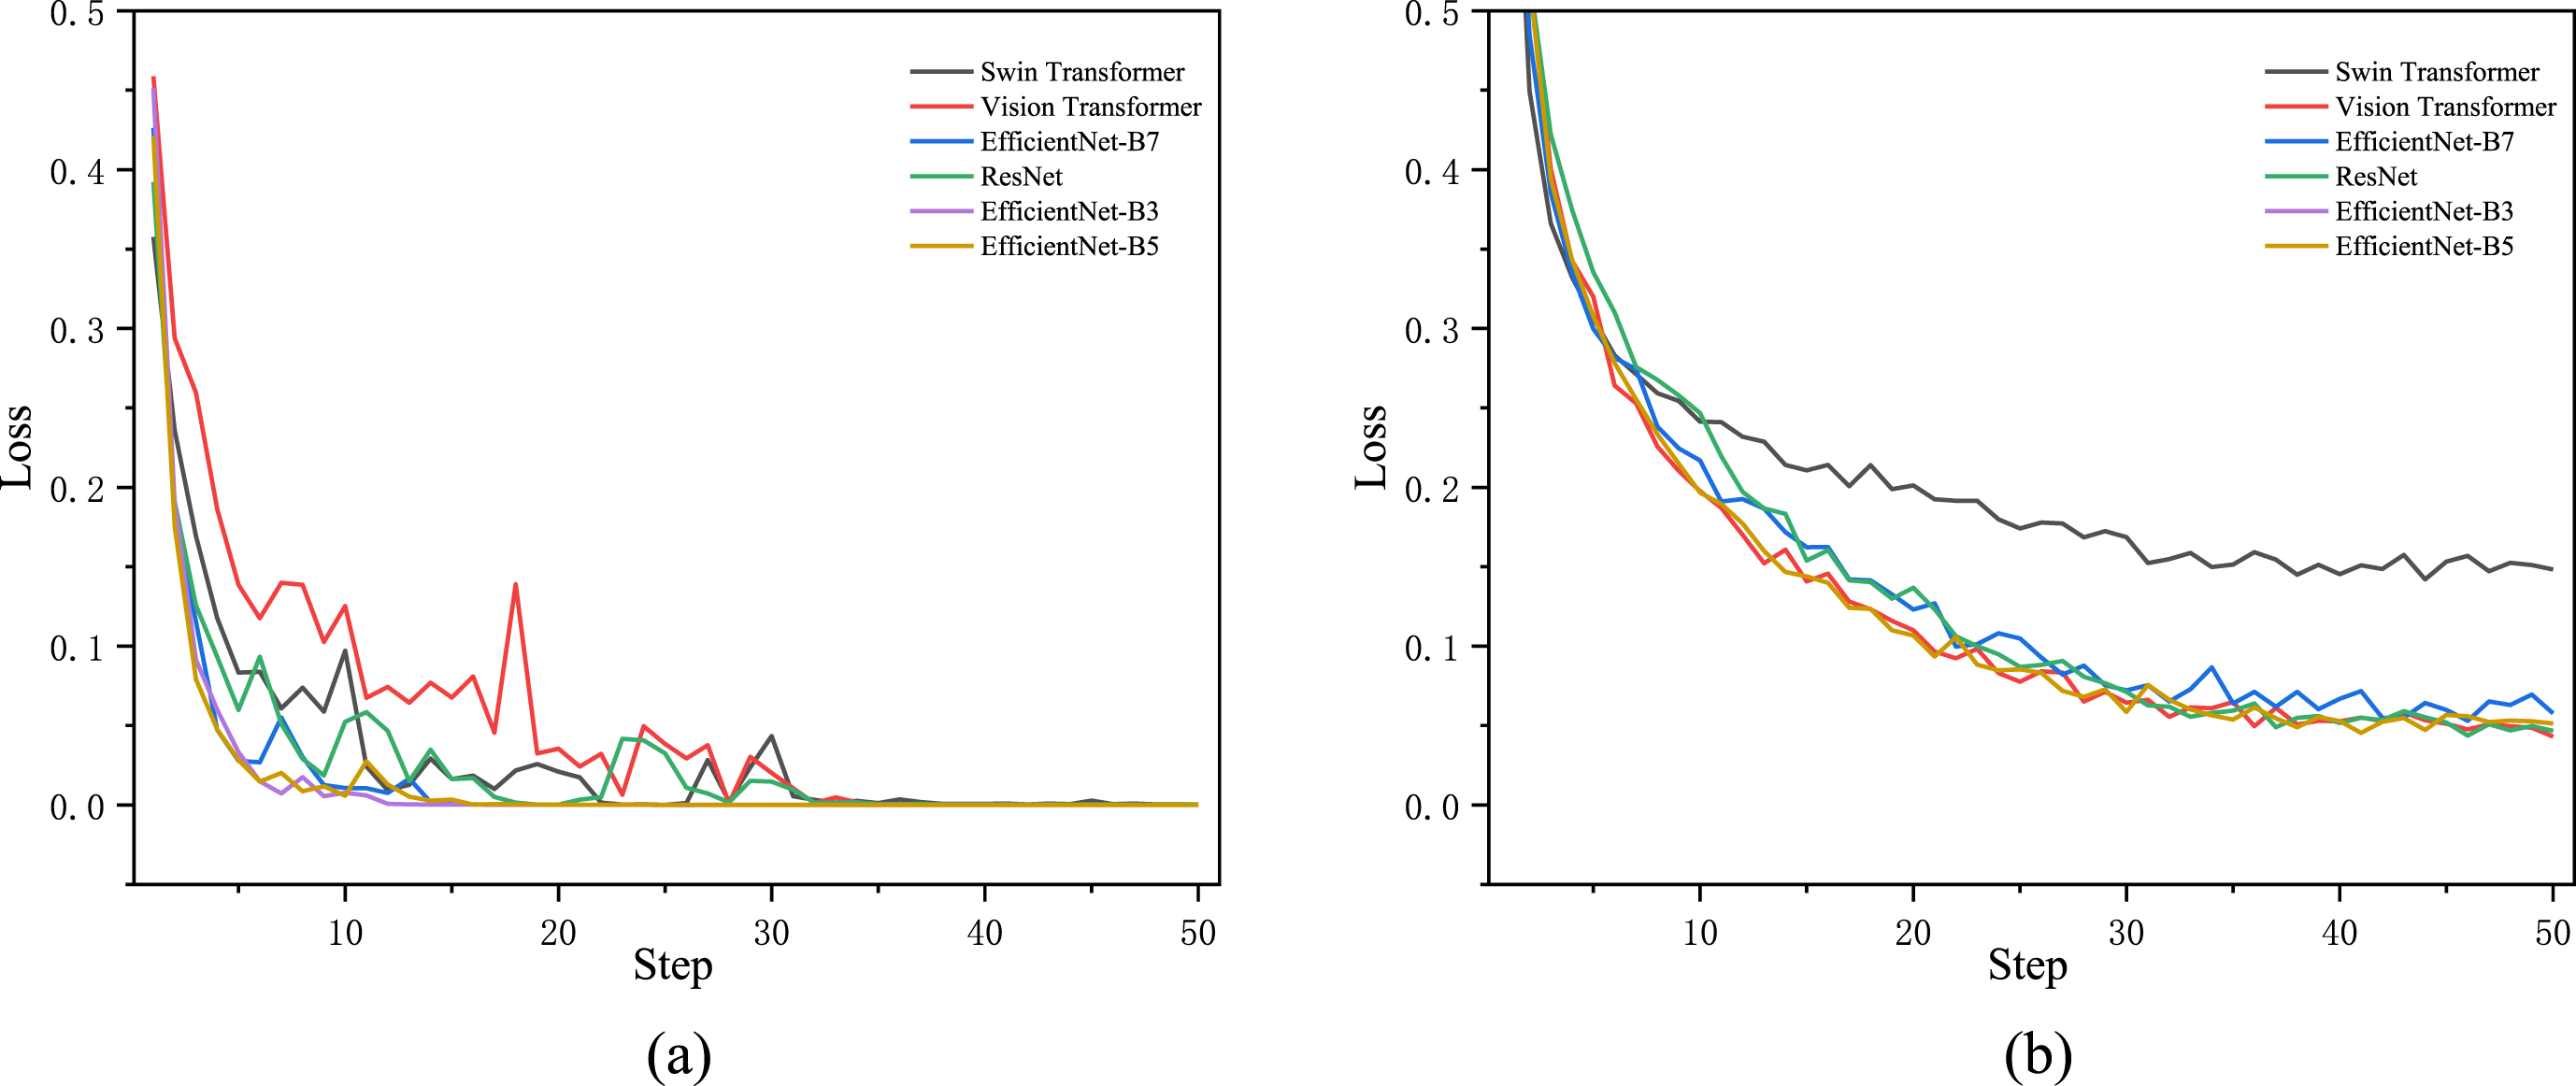
(a)Training loss of different pre-trained extractors on the dilution rate dataset.(b): Training loss of different pre-trained extractors on the bonding condition dataset.
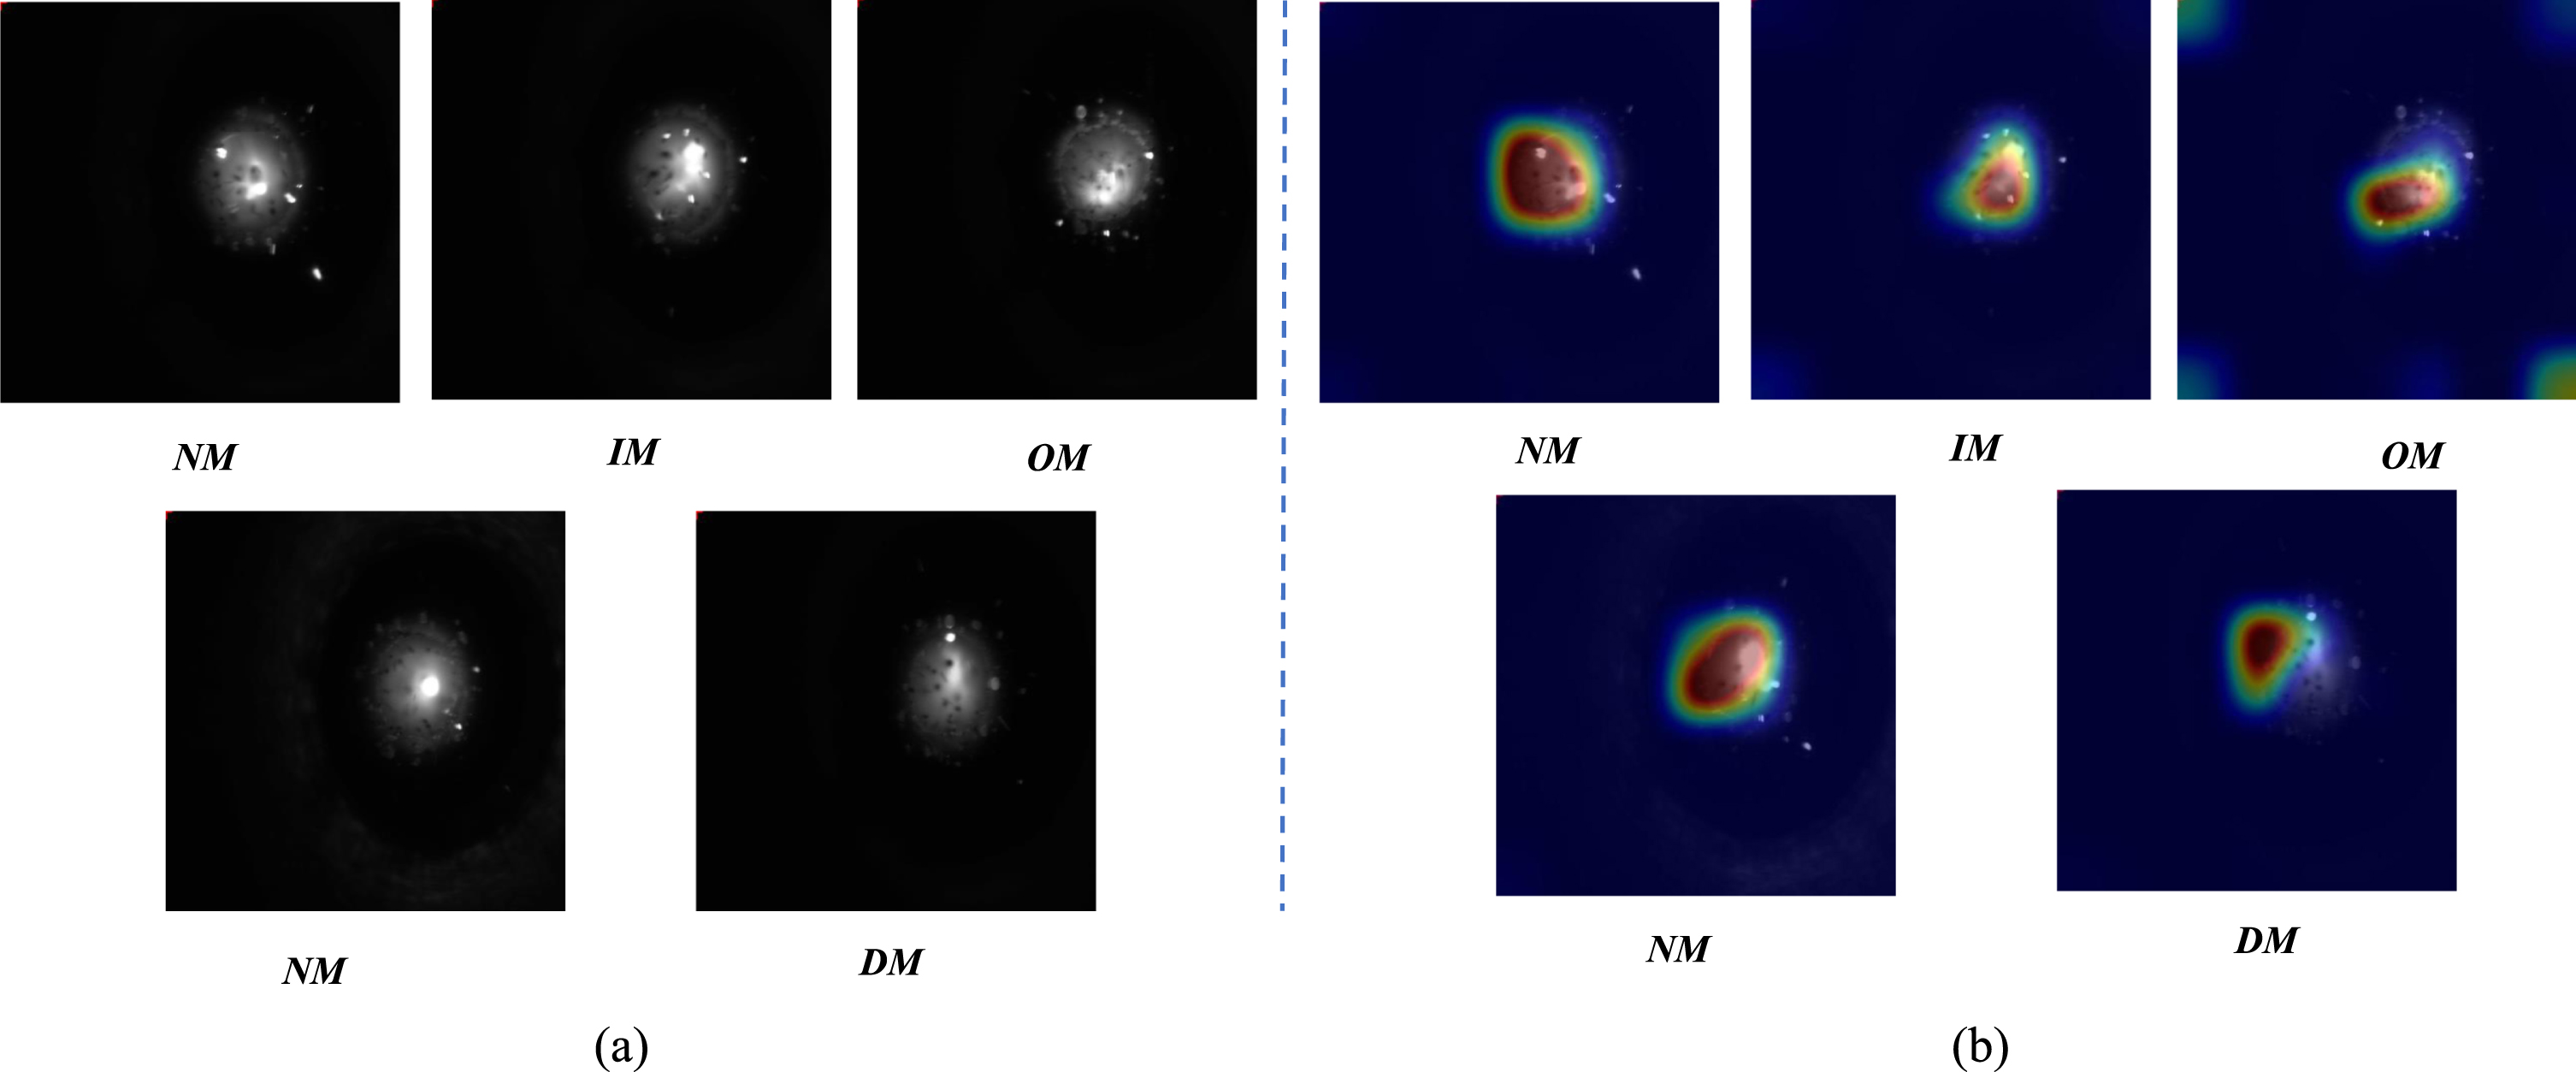
(a) is the original melt pool image, and (b) is the model visualization. The color of the region represents the degree of attention of the model, and the redder the color, the higher the degree of attention of the model.
In this section, we discuss the advantages and disadvantages of our proposed approach. Our work focuses on detecting internal defects in the material rather than just the surface defects, which makes it more practical than other defect detection methods used in additive manufacturing processes. Additionally, we have designed a network that can evaluate differently defined defects in two dimensions, making it easier to deploy in real production. Furthermore, our model has achieved relatively high accuracy, which increases the reliability in real production scenarios. However, there are still some challenges that need to be addressed in future work. Firstly, acquiring datasets is currently laborious and time-consuming since it requires cutting printed materials followed by expert observation using professional equipment. Secondly, the training time of the model may be longer than the single-stage training process, as it is a two-stage training process.
Conclusion
Our study proposes a new end-to-end method for monitoring the state of the melt pool during 3D printing. This method allows for the identification and monitoring of two label dimensions with the use of only one melt pool feature extractor, which significantly improves the efficiency of monitoring the quality of the melt pool. To improve the method, we plan to reduce its dependence on dataset labeling by using semi-supervised or unsupervised methods in future research. Additionally, our current method only identifies two label dimensions, but we aim to improve its versatility by increasing the number of label dimensions in the future.
Funding
The experimental funding comes from Nanjing Huirui Photoelectric Technology Co., Ltd.
Conflicts of interest
All authors disclosed no relevant relationships.