
Abstract
Quality Function Deployment (QFD) is a powerful approach for improving product quality that can transform customer requirements (CRs) into engineering characteristics (ECs) during product manufacturing. The limitations of traditional QFD methods lead to imprecise quantification of CRs and difficulty in accurately mapping customer needs. To address these issues, this paper introduces an innovative QFD approach that integrates extended hesitant fuzzy linguistic term sets (EHFLTSs), CRITIC, and cumulative prospect theory. The method expresses the subjectivity and hesitancy of decision makers when evaluating the relationship between ECs and CRs using EHFLTSs, considering the conflicts among CRs. The CRITIC is used to comprehensively evaluate the comparison strength and conflict between indicators, and the cumulative prospect theory is utilized to derive the prioritization of ECs. A case study is presented to demonstrate the effectiveness of the proposed approach.
Keywords
Introduction
Quality function development (QFD) is a methodology that transforms customer requirements (CRs) into quantifiable engineering characteristics (ECs) for product manufacturing by constructing a linguistic data system with the quality house, and analyzing the degree of correlation between the desired quality from CRs and ECs of the product [1]. Therefore, QFD has been adopted in various industries, including machinery [2], automobile [3], service industry [4], electronics [5] and other fields, with significant achievements made in many fields [6].
The quality house, a component of quality function development, facilitates the transformation of customer needs into ECs by employing a matrix framework to express their relative importance [7]. In practice, enterprises typically prioritize quality control efforts on characteristics with higher degrees of importance using the principle of critical minority and secondary majority. This approach ensures cost control while maximizing economic benefits and returns for the enterprise [8]. Exploring the construction of an appropriate quality house is an imperative inquiry. The quality house is built on customer evaluations and perspectives, which are transformed into key CRs. Consequently, constructing a quality house necessitates handling linguistic information, while acknowledging the inherent ambiguity and hesitancy in human language that inevitably leads to incomplete information acquisition [9]. Therefore, in order to maximize the objectivity of the evaluations obtained, multiple experts are usually chosen to conduct evaluations in groups.
However, in the evaluation of the relationship between CRs and product ECs, experts often employ linguistic terms to describe positive, negative, and strong relationships. As a result, product development has evolved into a group linguistic decision-making process. Given the diverse perspectives of experts, there arises an imperative need to consolidate evaluation information from multiple sources for comprehensive analysis. Currently, approaches have been proposed to address the multiple attribute group language decision-making problem in QFD. Akbas et al. [10] introduced a comprehensive framework for fuzzy quality function unfolding along with a similarity-based ideal solution selection method that enables obtaining an all-encompassing ranking of ECs. Yang et al. [11] developed a novel group decision-making method, combining proportional hesitant fuzzy linguistic term sets (HFLTS) to obtain the priority sort of ECs in QFD. Fang et al. [12] developed an integrated QFD theory utilizing rough set and cloud models in uncertain information. Wang et al. [13] proposed a novel approach that integrates cloud models with grey correlation analysis to address the multi-criteria decision-making problem in QFD. Yang et al. [14] introduced an evaluation model for probabilistic linguistic term sets using grey correlation analysis. Li et al. [15] developed an extended probabilistic linguistic approach relying on fuzzy QFD to sort the importance of ECs according to the CRs in open design. Li et al. [16] suggested employing a binary linguistic QFD model to manage inaccurate and fuzzy evaluation information. Wang et al. [17] utilized a binary transformation function approach to deal with ambiguities and multi-granularity in quality planning simultaneously. Rodrı'guez et al. [18] proposed a hesitant fuzzy linguistic operator, which deals with the situation of expert hesitation. Building upon the work of Rodrı'guez, Wei [19] further proposed an extended hesitation fuzzy linguistic operator that can construct the concatenation set of expert hesitation fuzzy evaluations, addressing evaluative information loss when handling the subjectivity and hesitation of experts in group linguistic decision-making. Chen [20] proposed a integrated multiple criteria decision-making QFD approach, integrating the hesitant fuzzy linguistic term set. He et al. [21] developed a comprehensive method to achieve effective design resilient solutions for SSCs while considering both CRs and risk factors. In addition, methods such as image fuzzy linguistic set and enriched evaluation preference ranking method have also contributed to the multi-attribute decision-making problem in QFD [22–25]. When evaluating the relationship between ECs and CRs, decision makers may use complex language to express their opinions, and these expressions may be vague and uncertain. In order to clearly quantify this complex language expression, Wang [26] proposed the conception of extended hesitant fuzzy linguistic term sets (EHFLTSs), and EHFLTSs can be formed by the union of HFLTSs, which allows it to flexibly adapt to the group language decision model.
The group linguistic decision-making process can be regarded as a multi-attribute decision-making problem (MADM). In the MADM problem, it is very important to determine the attribute weights. When experts evaluate the relationship between CRs and ECs, it is challenging to accurately calculate the weights of CRs due to the different preferences of DMs. The CRITIC can determine the objective weight of the MADM problem. CRITIC compare the strength of the assessment indicators and the contradictions between the indicators, which can assess the objective weights of the indicators [27, 28]. In addition to the preferences of experts, the psychological factors of expert decision-making will also affect the final decision. Tversky [29] extended the prospect theory to the cumulative prospect theory, which can well capture the psychological behavior of decision makers in the assessment procedures. The combination of the cumulative prospect theory and MADM methods to solve uncertain problems has emerged as a prominent research focus within the decision-making domain.
In the current QFD research, two significant challenges are being faced. Firstly, accurately assessing the relationship between CRs and ECs is challenging [30, 31]. Secondly, QFD-based product development is a process that involves group members with varying levels of heterogeneity. To address mentioned issues, this paper proposes a novel QFD method that leverages the advantages of EHFLTSs to express DM’s subjectivity and hesitancy, CRITIC can comprehensively measure the contrast intensity between indicators and express the conflict between indicators. Additionally, it incorporates cumulative prospect theory to consider psychological factors in decision making. Table 1 presents a list of studies on the QFD integrated with different decision-making methods.
Studies on the QFD integrated with different decision-making methods
Studies on the QFD integrated with different decision-making methods
This paper is organized as follows: Section II provides an overview of EHFLTSs and cumulative prospect theory. Section III describes the proposed QFD approach. A case study is presented in Section IV to demonstrate the validity of the proposed approach and conduct a comparative analysis. Section V concludes with some remarks.
This section proposes an innovative QFD method that combines EHFLTS and cumulative prospect theory to derive the weights of CRs and evaluate the significance of ECs. The proposed framework is illustrated in Fig. 1.

Framework of the proposed QFD method.
Step 1: Aggregate opinions of experts. The opinions are grouped and summarized, and the evaluation information EC
i
provided by expert G
r
for customer requirement CR
j
,denoted as
Step 2: Summarize the different groups and construct the matrix. Every element of entire EHFL matrix can be determined by the following equation:
Where the linguistic weighting vectors ω = (ω1, …, ω
R
),
The entire EHFL matrix Hs is denoted as:
Where h sij denotes the evaluation of correlation between EC i and CR j .
Step 3: Obtain CRs weights through CRITIC method. In this section, we will provide an explanation computing the weights of CRs using the CRITIC method within EHFLTS. The steps are as follows:
(1) Convert h
sij
to a numerical value φ
ij
by binary semantic model, and apply the Equation (4) to obtain the score matrix to expand the hesitant fuzzy group decision matrix φ
s
= (φ
sij
) m×n,
Where i = 1, …, n,j = 1, …, m,
(2) Use the Equation (5) to determine the correlation coefficient between CRs.
Where
(3) Employ Equation (6) to measure the standard deviation of each CR.
Where σ a indicates the standard deviation of the j-th CR, j = 1, …, n.
(4) Calculate the deviation degree of each CR with Equation (7).
Where τ j denotes the standard deviation degree of the j-th CR,j = 1, …, n.
(5) The CR weights are calculated based on Equation (8).
Where ψ j indicates the weights of the j-th attributes.
Step 4: Choose the positive ideal solution and the negative ideal solution as the reference points. The positive ideal solution is obtained from the following equation:
The negative ideal solution is obtained from the following equation:
Step 5: Calculate the distance between h
sij
and the reference points. Use d (h
sij
, P
j
) to denote the distance between h
sij
and the positive reference point P
j
, and d (h
sij
, P
j
) is defined as:
Use d (h
sij
, N
j
) to denote the distance between h
sij
and the negative reference point N
j
, and d (h
sij
, N
j
) is defined as:
Where I (s i ) = s i ,g = 2t. t is determined by the linguistic term set S ={ s-t, …, s t }. l is the number of elements in h s , if l (h sij ) ≠ l (N j ),l = max{ l (h sij ) , l (N j ) }.
Then, collecting the above results, the distance sets of EC
i
to the reference points are obtained.
Step 6: Calculate the prospect function values.
The value of the prospect function from the following equations:
Where α (0 < α < 1)and β (0 < β < 1) are concave degree of the functions, θ (θ > 1)shows the sensitivity parameter for decision makers to avoid losses, α, β and θare the parameters.
Step 7: Calculate the weight function of prospect function values. The weight function of prospect function values from the following equations:
Where η (0 < η < 1)and ς (0 < ς < 1) are the weighting function curvature function, generally, η = 0.61, 1pt1pt1ptς = 0.69.
Step 8: Calculate the values of entire prospect function. The values of entire prospect function from the following equation:
Step 9: Sort ECs in descending order by the values of V i .
According to the cumulative prospect function, the value of V i and the priority of EC are positively correlated. Therefore, the most important ECs can be obtained by sorting the values of V i in descending order.
Case study
In this section, the proposed method is used to a building material equipment enterprise to prove the effectiveness of the developed QFD model. QFD has important status in the mainframe manufacturing production of building material equipment enterprises, addressing current challenges such as controlling production conditions and balancing economic cost with quality level. This case study provides a detailed computational process of the proposed QFD methodology. Five decision makers (DM1, DM2,..., DM5) were invited to participate in the interview and choose the significant ECs based on their experience and knowledge. Through the investigation of expert interviews, six CRs are selected as shown in Table 2, and five ECs are selected as shown in Table 3. Divide the five decision makers into two groups: group 1 consists of decision makers 1, 2, and 3, while group 2 consists of decision makers 4 and 5. Each expert has the same weight. Depending on the number of experts in each group, the weight vectors for both groups are determined to be w = (0.6, 0.4).
Customer Requirements
Customer Requirements
Engineering Characteristics
The proposed QFD method involves the following steps to prioritize the ECs:
Step 1: Combine the linguistic assessments of EC i relative to CR j provided by each group of experts. The collective EHFL correlation matrices H1 s and H2 s were established by means of Eqs (1-2), as indicated in Table 4. The assessment of the correlation between ECs and CRs can be regarded as EHFLTS.
Collective EHFL correlation matrix for each group
Step 2: Using Equation (3), the two sets of relationship matrices are aggregated in order to establish the entire EHFL correlation matrix Hs, as presented in Table 5. The OWA weighting vector is derived by utilizing the normal distribution approach [33] as ω = (0.5, 0.5).
Overall EHFL correlation matrix Hs
Step 3: The CRITIC method is used to obtain the CR weights through Equations (4–8). The calculation results are shown in Table 6 to Table 11.
Converting assessment information into a score matrix
Standardized score matrix
Correlation coefficient between CRs
Standard deviation for each CR
Deviation for each CR
Weights of CRs
Step 4: Positive reference point P
j
and negative reference point N
j
are determined by Equations (9-10) as respectively:
Step 5: Determine the distance between h sij and P j by Equation (11) and (13), and the distance between h sij and N j by Equation (12) and (14). The outcomes are presented in Table 12.
Distance between h sij and the reference point
Step 6: We can derive the prospect function of gain from Equation (15), and the loss by Equation (16). The results are shown in Tables 13-14.
Value function of the prospect functionv+
Value function of the prospect functionv-
Step 7: The gain and loss weights of CRs are calculated according to the Equations (17-18), as shown in Tables 15-16.
Probability weights as CRs gains
Probability weights as CRs losses
Step 8: The overall foreground function value of ECs is determined by the Equation (19) as follows:
Step 9: By ranking the values in descending order, the five ECs are ranked:
Hence, EC3 emerges as the foremost critical EC. In the manufacturing of products, manufacturers should focus on EC3.
In this Section, relevant QFD methods are used to analyze the case of the previous section, including conventional QFD, rough cloud QFD [12], hesitant fuzzy QFD [22], and AHP-QFD [25], and the outcomes are presented in Table 17.
Ranking of different methods
Ranking of different methods
Firstly, in contrast to conventional QFD method, significant differences are observed between their respective outcomes. For instance, the conventional QFD method ranks EC1 and EC3 together as top priorities, while proposed method places EC3 at the forefront, which demonstrates the effectiveness of proposed method. Moreover, unlike conventional approaches that cannot distinguish the priority between EC1 and EC3 or provide consistent rankings for EC4 and EC5 across different methods, solely relying on numerical values for evaluation purposes, our approach takes into account expert hesitation levels.
Second, it can be observed that the first two EC priority rankings of the two methods are consistent, with a slight difference in the priority ranking of EC2 and EC4. Additionally, the conventional QFD method, fuzzy QFD, and the proposed method consider EC2 to have a higher priority than EC4, highlighting the impact generated by EC2 over EC4 in terms of satisfying customer satisfaction. This variation may be attributed to differences in expert experience and preference, as well as the fact that the rough cloud QFD method does not account for the interaction between CR and the psychological behavior of experts.
Besides, a comparative study between hesitant QFD and AHP-QFD reveals that while both methods utilize hesitant fuzzy term sets, AHP-QFD differs slightly from all other methods concerning the priority ranking of EC1 and EC2. This difference stems from AHP-QFD that each expert is rational. Further analysis shows that although hesitant QFD yields similar results to proposed method, it calculates CR weights differently, using fuzzy measures without considering data conflict. In contrast, CRITIC accounts for these factors when calculating weights.
Finally, to corroborate the efficacy of the purposed approach, the ECs composite distances of different methods under CRs are calculated with Equation (20).
To exemplify the feasibility and effectiveness of the proposed method, EC3 is considered to serve as an illustration. The composite distances of EC3 is calculated as shown in the Table 18. The CR1, CR2, CR3 and CR6 represent revenue-oriented customer needs, and CR4 and CR5 correspond to loss-oriented customer needs. The different ways of calculating C1 are 1, 0.8195, 0.8817, 0.8477, 0.9024. The proposed method exhibits the highest composite distances among the compared methods, which prove that the description of the relationship between CRs and EC3 is closest to the ideal solution when CR is revenue-oriented customer need. Based on the comparison of composite distances, it is evident that the proposed method yields the largest distances for CR1, CR2, CR6, while the smallest distance is observed for CR4. Therefore, these results indicate that proposed method surpasses other methods by satisfying the CRs.
Composite distances of EC3
Calculate the composite distances of different methods for all ECs, the results are shown in the Fig. 2. Figure 2(a) shows the composite distances of EC1, CR1, CR2, CR3 and CR5 represent revenue-oriented customer needs, while CR4 and CR6 represent loss-oriented customer needs. As can be seen from Fig. 2(a), compared with other methods, the composite distances of CR1, CR2, CR3 and CR5 are most close to 1, which can more truly reflect the relationship between EC1 and CRs. Figure 2(b) displays the composite distances of EC2, the PM is close to revenue-oriented CRs of the most closed to 1, which is significantly higher than composite distances obtained by other methods. It can be seen from the Fig. 2(d) and(e), the PM calculates the closest composite distances to 1 for the revenue-oriented customer needs of EC4 and EC5. Therefore, the proposed method can describe the relationship between the ECs and CRs accurately.
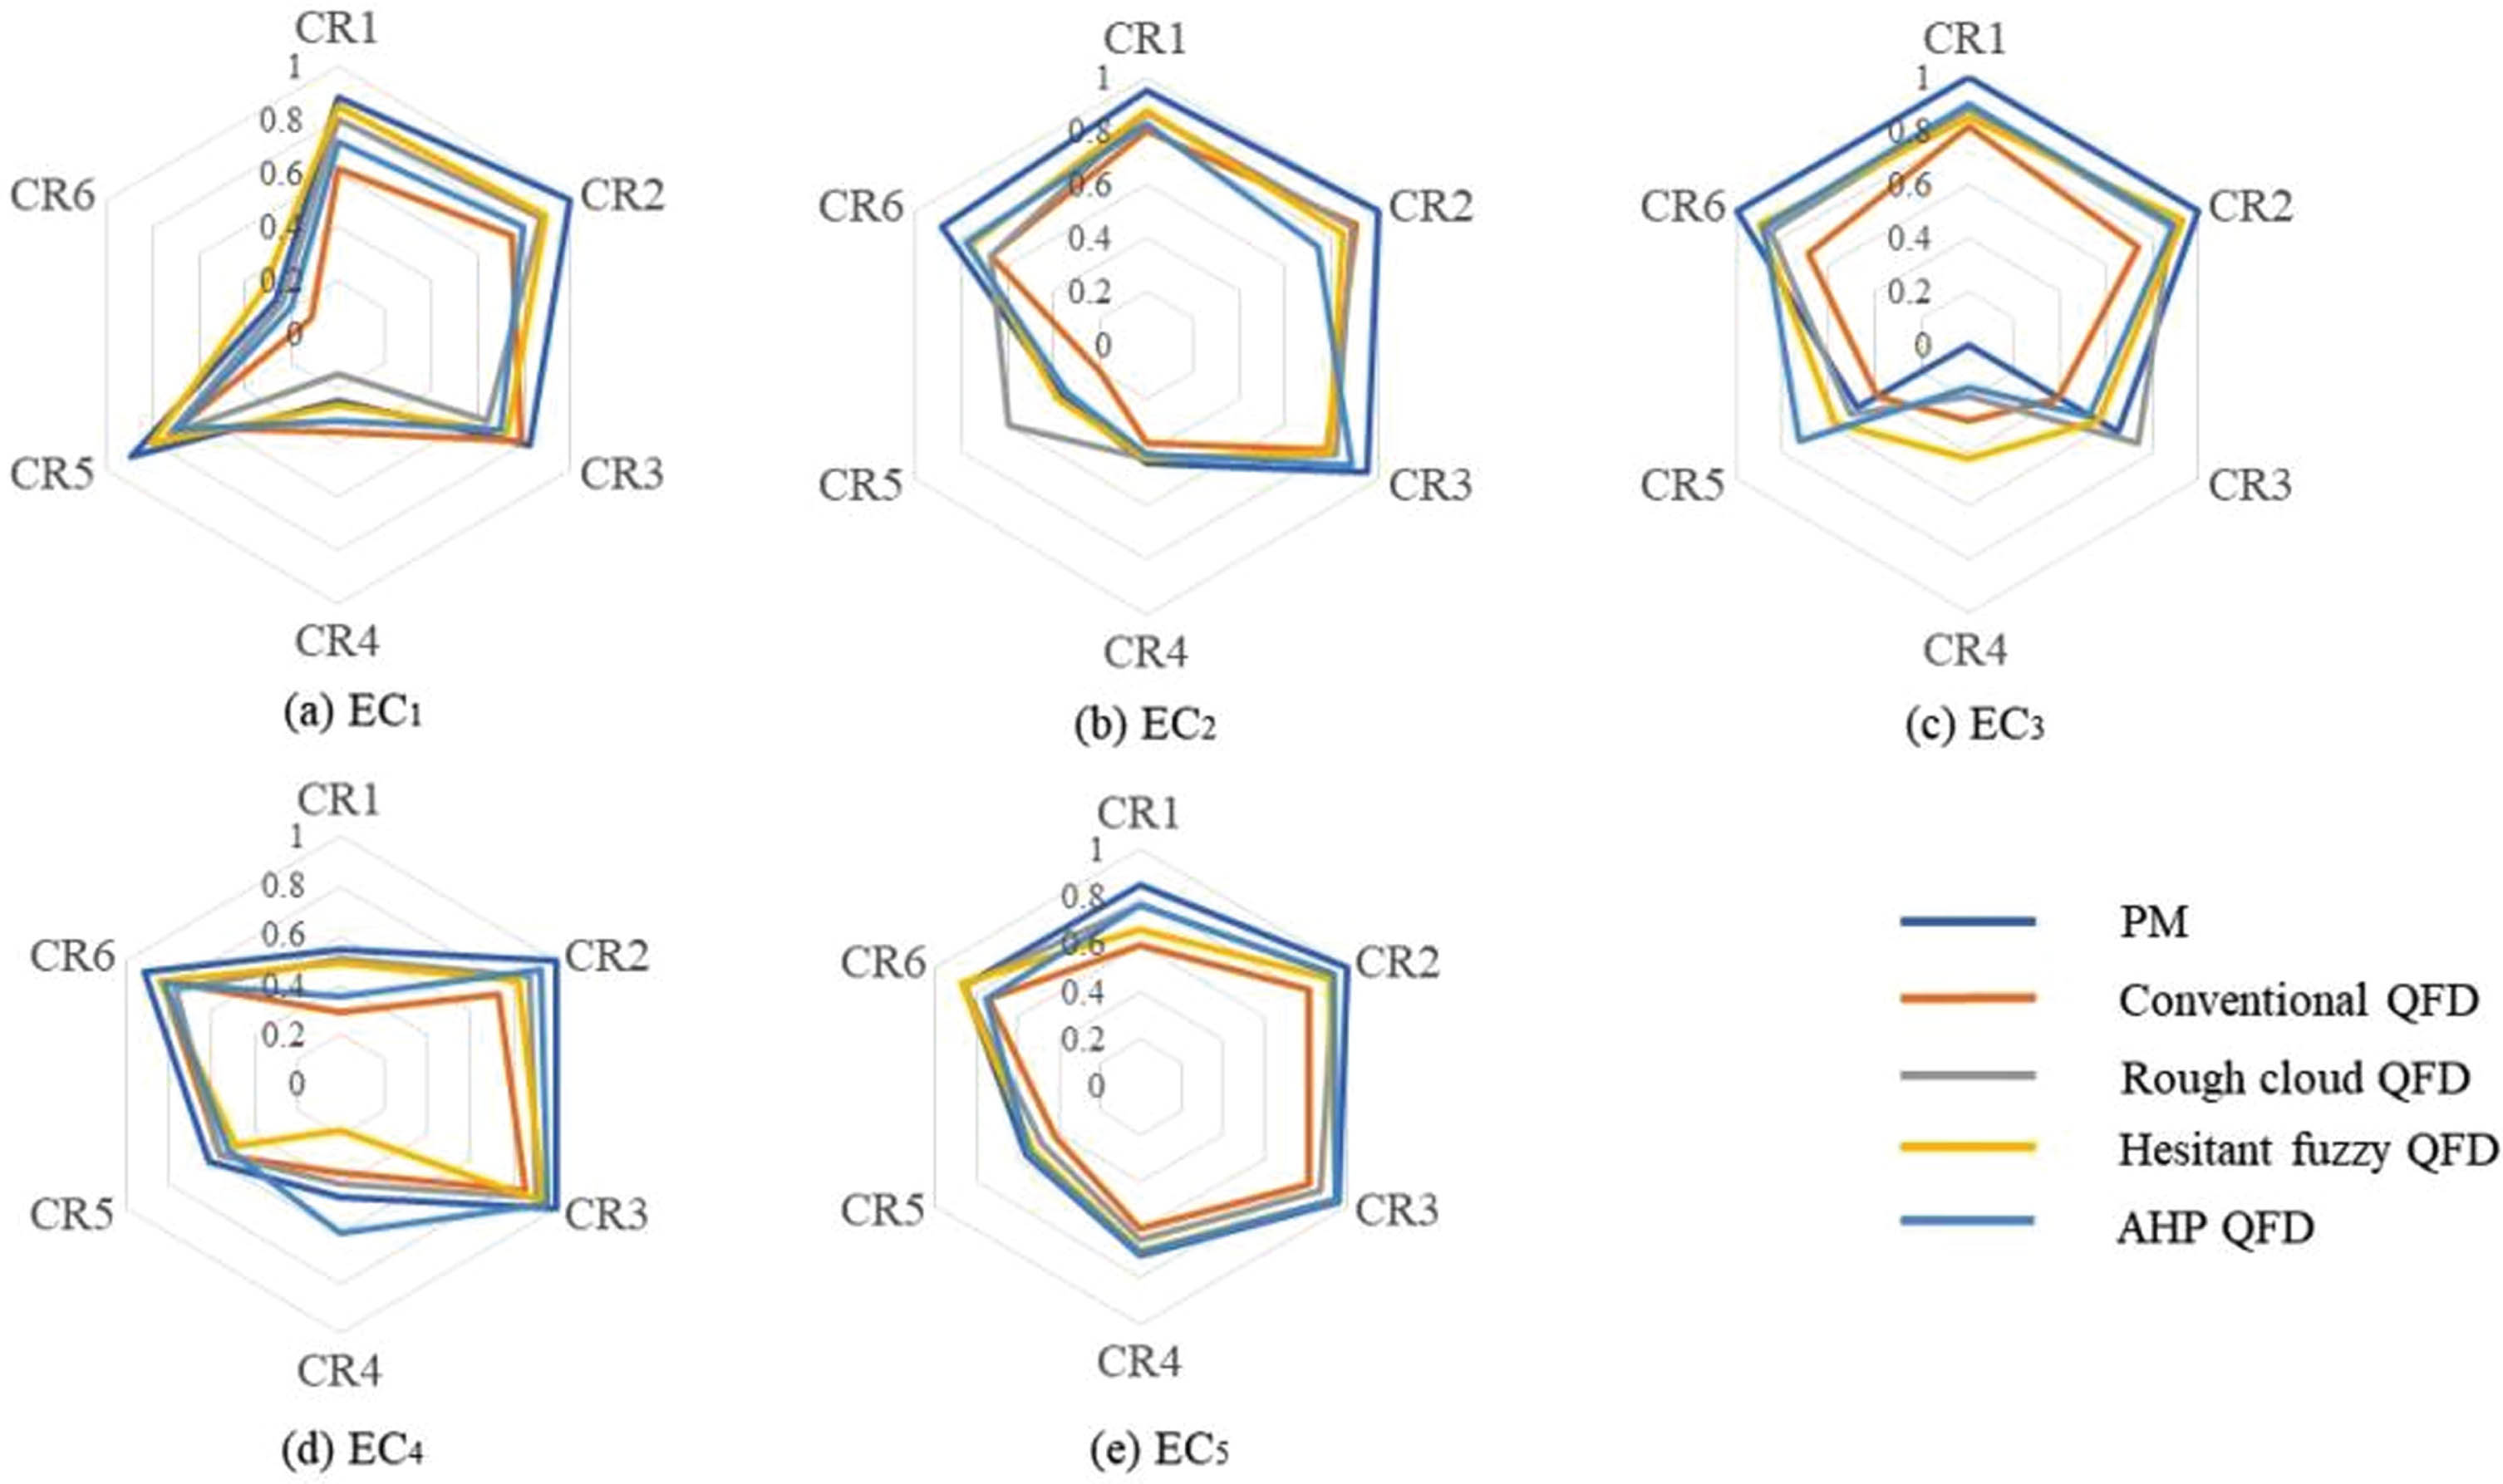
Composite distances for ECS calculated under different methods.
Given the diverse risk preferences of decision-makers, this subsection conducts numerical experiments on employing the curvature parameters of value function (η) and weight function (ζ) as variables.
The ranking of ECs alternatives obtained from sensitivity analysis with respect to the two scenarios are presented in Figs. 3-4. The conclusion can be drawn from the graph that despite the continuous fluctuation of curvature parameters, the ranking of ECs has remained constant,EC3 > EC1 > EC2 > EC4 > EC5. In summary, the sensitivity analysis indicates that the parameters of the cumulative prospect theory have virtually no impact on the final ranking of ECs. Therefore, the deduction results of the PM are reliable.

Sensitivity analysis in the case of the parameter η changes.

Sensitivity analysis in the case of the parameter ζ changes.
In this paper, a new decision-making method is proposed for EC priority rankings in QFD, which captures the subjectivity and hesitancy regarding the relationship between ECs and CRs while preserving the evaluations content of DM. This allows us to obtain the evaluation aggregation information of EC and CR. Subsequently, the CR weights are obtained by considering the conflicting nature between the CRITIC evaluation indicators. Finally, we incorporate the psychological factors of DMs, such as cumulative prospect theory, to determine the ranking of ECs.
Future research can explore two aspects: First, increasing the number of experts and considering their heterogeneity by assigning different weights; Secondly, in many cases involving QFD problems, the CR weight information may be entirely unknown, rendering the PM insufficient. Therefore, it is recommended to expand the approach in future research to address this limitation.
Abbreviations
basic 2-tuple linguistic term set
customer requirement
double hierarchy hesitant linguistic term sets
decision maker
engineering characteristics
extended hesitant fuzzy linguistic
extended hesitant fuzzy linguistic terms sets
fuzzy analytic hierarchy process
interval-valued spherical fuzzy
interval rough number
interval type-2 fuzzy sets
multi-attribute decision-making
probabilistic fuzzy language term sets
probabilistic hesitant fuzzy language term sets
probabilistic language term sets
proposed method
quality function deployment
Footnotes
Acknowledgments
This work was supported by the National Natural Science Foundation of China (No. 51705386); China Scholarship Council (No.201606955091).