
Abstract
Cattle detection and counting is one of the most important topics in the development of modern agriculture and animal husbandry. The traditional manual monitoring methods are inefficient and constrained by factors such as site. To solve the above problems, a SCS-YOLOv5 cattle detection and counting model for complex breeding scenarios is proposed. The original SPPF module is replaced in the YOLOv5 backbone network with a CSP structured SPPFCSPC. A CA (Coordinate Attention) mechanism is added to the neck network, as well as the SC (Standard Convolution) of the Neck network is replaced with a light convolution GSConv and Slim Neck is introduced, and training strategies such as multi-scale training are also employed. The experimental results show that the proposed method enhances the feature extraction ability and feature fusion ability, balances the localization accuracy and detection speed, and improves the use effect in real farming scenarios. The Precision of the improved network model is improved from 93.2% to 95.5%, mAP@0.5 is improved from 94.5% to 95.2%, the RMSE is reduced by about 0.03, and the FPS reaches 88. Compared with other mainstream algorithms, the comprehensive performance of SCS-YOLOv5 s is in a leading position, with fewer missed and false detections, and the strong robustness and generalization ability of this model are proved on multi-category public datasets. Applying the improvement ideas in this paper to YOLOv8 s also yields an increase in accuracy. The improved method in this study can greatly improve the accuracy of cattle detection and counting in complex environments, and has good real-time performance, so as to provide technical support for large-scale cattle breeding.
Introduction
The health of cattle determines the development and economic efficiency of dairy farming. Precision husbandry plays an important role in the process of intensive cattle breeding, and has achieved more and more positive results in terms of pasture protection, animal welfare, workforce optimization, livestock traceability, understanding of disease trajectories and quarantine of major diseases, vaccination, production management, tracking and health monitoring, and large-scale cattle ownership management [1–4]. In the process of intelligent farming, along with the birth, death and sale of cattle, the inventory and counting of cattle has become an important issue in the process of intelligent breeding. Therefore, real-time counting of dense herds is of great significance for the construction of modern animal husbandry. Currently, cattle counting on farms is mainly manual, resulting in a lot of wasted human and material resources, extremely low efficiency and large errors in counting results. The use of wearable devices for monitoring has great advantages over manual work [5], but can cause stress to cattle. Contactless methods based on computer vision have become an important tool for intelligent cattle counting in recent years [6], saving workforce input and improving management efficiency, while offering significant advantages in terms of animal welfare, and playing an important role in intelligent cattle breeding.
However, with the increasing scale of the ranch and the increasing real-time requirements of digital farming, the inventory and counting of cattle are facing new challenges. On the one hand, it is vital to improve the accuracy of cattle counting, while on the other hand, it is necessary to ensure the real-time performance of the algorithm.
Recent research in the field of livestock population counting at home and abroad includes three main methods, which are based on object detection, instance segmentation and density estimation, respectively. Instance segmentation method and density estimation method have their own advantages, but their shortcomings are also obvious, neither can satisfy the requirements of accuracy and speed at the same time.
Instance segmentation has a good performance in solving the occlusion problem, but its biggest drawback is the large model and slow inference speed, which makes it difficult to meet real-time requirements.
Methods based on density estimation are mostly applied to UAV scenarios with a large number of objects and high density. However, the biggest shortcoming of the density estimation method is the low accuracy of counting, which is difficult to meet the needs of large-scale aquaculture.
Compared to the other two methods, the object detection method is the most widely used and can achieve both high accuracy and fast inference to meet real-time requirements. Therefore, the counting method based on object detection was used in this study.
What’s more, most of the existing cattle counting studies only focus on a single breeding scene, which leads to poor generalization ability of the model, and the small number of cattle is less affected by external influences such as occlusion and background interference. To solve the above problems, this study uses rich experimental scene dataset, taking into account interference such as occlusion and complex backgrounds. In order to improve the detection accuracy and real-time performance, this study proposes a cattle detection and counting method based on improved YOLOv5. The main contributions of this paper are as follows: The fast spatial pyramid pooling in the backbone using the CSP cross-stage local connectivity idea fully integrates the features of each layer of the network, improves the feature extraction capability, and enhances the accuracy of detection. In order to make the network pay more attention to the foreground image and resist the interference of the complex background, the CA mechanism is added to Neck so that the network pays more attention to the detailed features of the cattle, which can effectively solve the occlusion problem. Replacing the SC of Neck with GSConv, the same CSP idea is used to introduce Slim Neck containing GSConv Block, which balances the accuracy and speed of the model and ensures the real-time performance of the algorithm.
Methods based on instance segmentation
Among the many types of inventory and counting algorithms, in order to improve the accuracy, many researchers have conducted many studies for instance segmentation methods. Xu et al. [7] applied Mask R-CNN to cow counting, and achieved good results in both wild grazing and captive breeding scenarios. Hu et al. [8] solved the occlusion problem well by improving this network and integrating the deep and shallow features of the network. Based on SOLO v2, Wang et al. [9] proposed a high-density herd pig counting model integrating multi-scale features, which has good performance on public datasets. Wei et al. [10] used Faster R-CNN based Transfer learning method to detect and count wheat grains, with a low error rate. Singh et al. [11] combined Mask-RCN and a bidirectional convolutional long-term memory network, the counting accuracy outperformed more sophisticated techniques.
Methods based on density estimation
When targeting dense scenes and small objects in the UAV’s field of view, the instance segmentation method is no longer able to meet the speed requirements, and the density estimation method becomes a new option. Zhao et al. [12] used Bayesian Loss model to count sheep and achieved good results. Liu et al. [13] proposed a crowd density estimation method based on Multiple Information Aggregation, which solved the problems of difficulty in feature extraction and insufficient feature fusion. For the problem of duplicate detection, Soares et al. [14] proposed a good countermeasure in their CNN network structure, which outperformed other methods in the UAV scene. Tian et al. [15] used the ResNeXt model to learn the mapping from image features to density, and integrated the density map to estimate the total number of pigs, and achieved good verification results on a real breeding scene dataset. Gao et al. [16] improved GSRNet, a crowd counting network, to obtain predicted density maps by sensing multi-scale features and integrating the density maps to achieve pig number estimation, which showed high accuracy and robustness. YAO et al. [17] used AdaBoost and SVM classifiers to extract features and set thresholds to achieve counts and population density estimates of white-backed flycatchers. To address the issue of scale variation and background complexity, Yu et al. [18] developed a Multi-scale Aware Module and a Hybrid Attention Module, resulting in more accurate crowd counting.
Methods based on object detection
Existing object detection methods mainly include traditional algorithms and deep learning-based methods. The teams represented by He et al., Liu et al., Wang et al., Song et al., Qin et al. [19–24] did a lot of research on cow object detection and feature extraction using traditional object detection algorithms, which promoted the development of cow object detection technology from theory to application. However, compared with deep learning methods, there is still a large room for improvement.
Deep learning-based object detection methods are widely used in livestock object detection and counting, such as One-Stage methods represented by YOLO, SSD, Retina-Net, and Two-Stage methods represented by Faster R-CNN, Grid R-CNN and others [25–30]. YOLO has become one of the most popular algorithms in the field of object detection over the past few years. It can be seen that object detection methods have been widely used in cattle detection and counting.
High-accuracy object detection methods
Weber et al. [31] used 24 architectures of YOLOv4 and YOLOv5 models to evaluate the feasibility of cattle identification and counting in UAV images, and achieved good results. Ahn et al. [32] applied YOLOv4-Tiny to a development board to realize the detection and counting of pigs in pigpens. Ning et al. [33] used the improved YOLOv5 model to achieve accurate counting of pigs in different breeding scenarios. Ding et al. [34] implemented the YOLOv5 model on the Jetson Nano platform by quantizing the network structure and reducing the model’s arithmetic power requirements to achieve real-time accurate detection of lactating piglets. Hu et al. [35] used YOLO as a detection network to locate the head, torso and tail of cows, and Tassinari et al. [36] also used this network successfully realize real-time detection and identification of cows. Weng et al. [37] proposed a channel-pruned YOLOv5 network-based method for cattle face detection, number of parameters and FLOPs were reduced by 86.10% with only a 1.6% reduction in mAP0.5. In order to capture long-distance dependencies, Wang et al. [38] designed an improved attention module based on global context information and convolution, and combined with porous spatial pyramid pooling to realize multi-scale fusion of high-level semantic information, improving the model’s feature extraction capability for dense cow images. For the purpose of improving recognition accuracy and detection real-time, Xing et al. [39] proposed an improved SSD algorithm SFM-SSD based on shallow feature module and achieved good results. Song et al. [40] achieved accurate corn cob detection using a rich experimental dataset and by incorporating an attentional mechanism to suppress the interference of occlusion.
Multi-scale object detection methods
Due to the comprehensive consideration of accuracy and speed of detection for scale-varying objects, many people have made efforts in related fields. Khan et al. [41] proposed the MFNet and MFNet-FA networks to solve the problems of computational complexity, accuracy limitation and scalability. Three versions with different model sizes are proposed to meet the multi-scale detection requirements. MFNet-M and MFNet-L enable high accuracy bird and UAV detection, while MFNet-S has good real-time performance and is well suited for deployment on limited hardware. In addition, in order to overcome the problem of small size of UAVs and low visibility at night, and to improve the detection accuracy of infrared images at night. They proposed an infrared image object detector called GAANet, which uses an automatic anchor calculation method and replaces the traditional convolution with ghost convolution, and introduces an ultra-small object feature extractor and detector. In the experimental results on birds, UAVs and helicopters, the mAP@50, Recall and Precision are improved by 2.5%, 2.3% and 1.4% respectively [42]. Although the research content is directed at different objects, they focus on the detection problem of multi-scale objects, and we focus on solving the occlusion problem, but ultimately the purpose is to improve the detection accuracy and ensure the real-time algorithm, which is valuable for our work.
Materials and methods
Image acquisition and preprocessing
The experimental videos were collected from the Jiayu Breeding Professional Cooperative located in Horinger County, Hohhot, Inner Mongolia, China. The acquisition device was two 4-megapixel network cameras (DS-2CD3T47EWD-L, Hikvision, China) with a resolution of 2560 pixels×1440 pixels. The cameras were installed in the middle of the outer wall of the 40 m×20 m cowshed at a height of approximately 3.5 m. The surveillance videos were temporarily stored in a Video Cassette Recorder (VCR) and downloaded via remote access over the network, with the data acquisition schematic shown in Fig. 1. The video dataset contains a total of 272 videos during the day and night from July 24 to 26, 2022, with each video lasting approximately 5 minutes. Key frames were extracted from the video using FFmpeg, images that did not contain individual cattle were manually removed, and multi-object images were labelled using LabelImg, saving the labelled file in xml format.
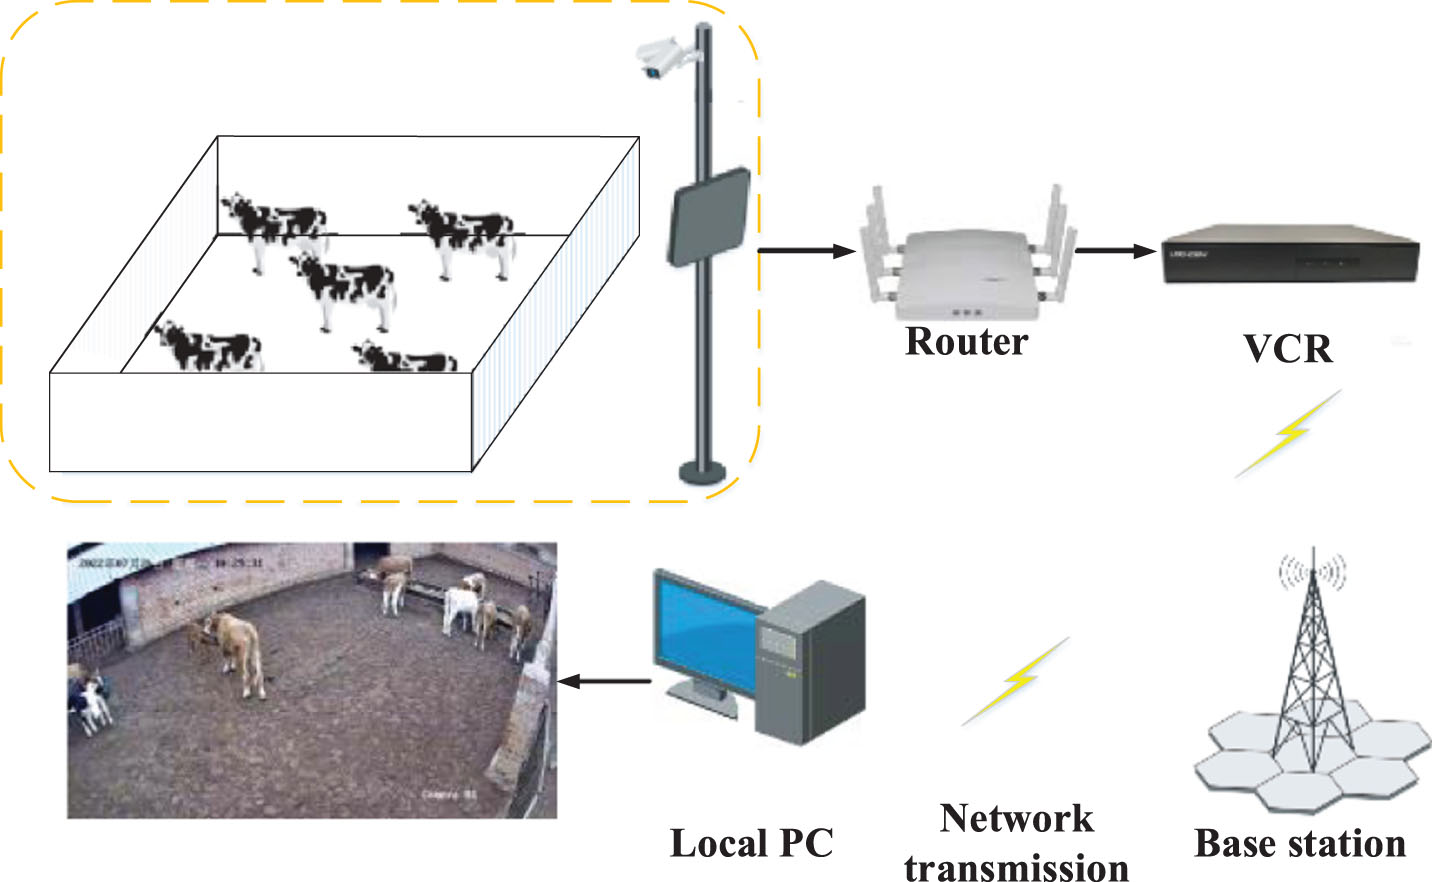
Schematic diagram of data acquisition.
In order to increase the diversity of samples and improve the adaptability of the algorithm to different environments, the dataset used in the experiment is composed of four parts. After data cleaning in the Baidu EasyData platform and removing images with similarity > 0.85 and sharpness < 5, a total of 2282 images were obtained, and Table 1 gives the detailed composition of the experimental dataset. The first part is the 925 images obtained from the surveillance video extraction frames collected by Jiayu Breeding Professional Cooperative, including 624 images during daytime and 301 images during nighttime. In the second part, 318 images are selected from OpenCows2020, a public dataset of cow backs. The third part is a public dataset downloaded from the Roboflow website, containing 460 images from 4 scenes. The fourth part is the dataset with the class of cow in the VOC dataset, which consists of 579 images. Figure 2 shows the composition of the four parts with a total of 8 scene datasets.
Detailed composition of experimental data

Detailed composition of experimental data
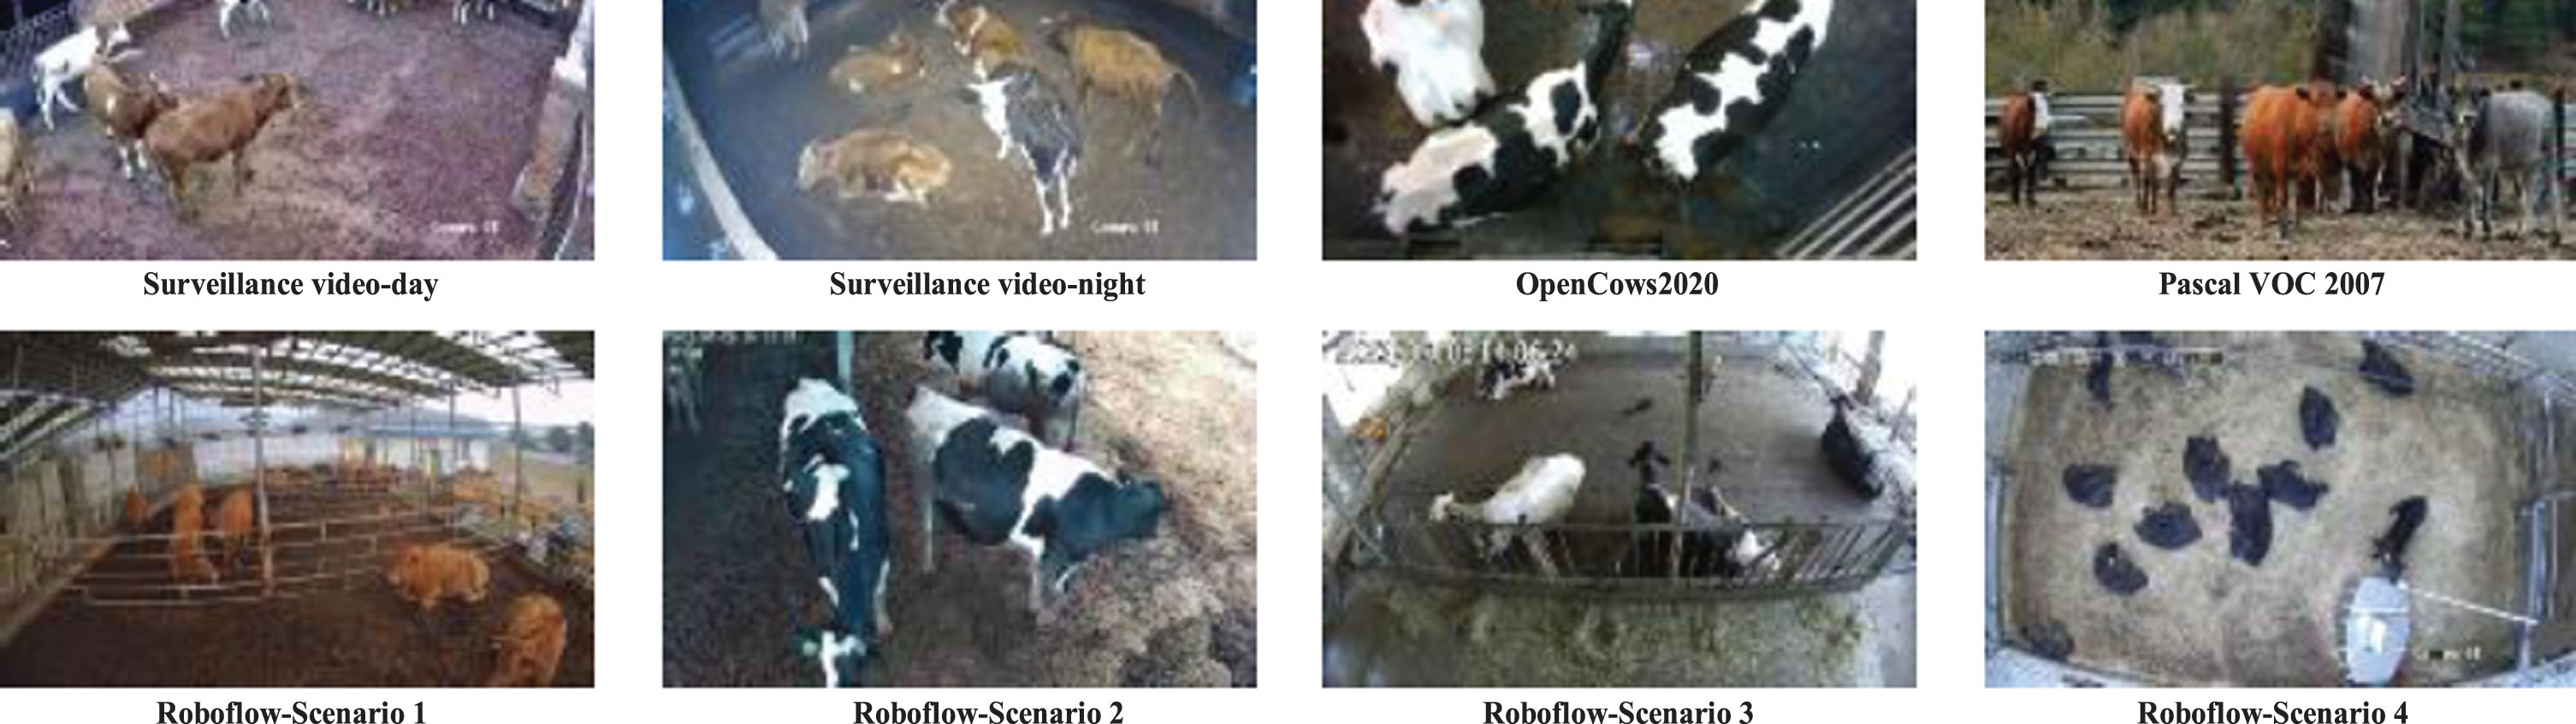
Composition of all scenario datasets.
By analyzing the number of cattle in the dataset images, the number of cattle in each image ranges from 1 to 22, with the majority of the images focusing on 1–15 cattle. In addition, according to the number of cattle in each image, the density of cattle is divided into three levels: sparse, dense and crowded, which are represented by blue, orange and red respectively, as shown in Fig. 3.
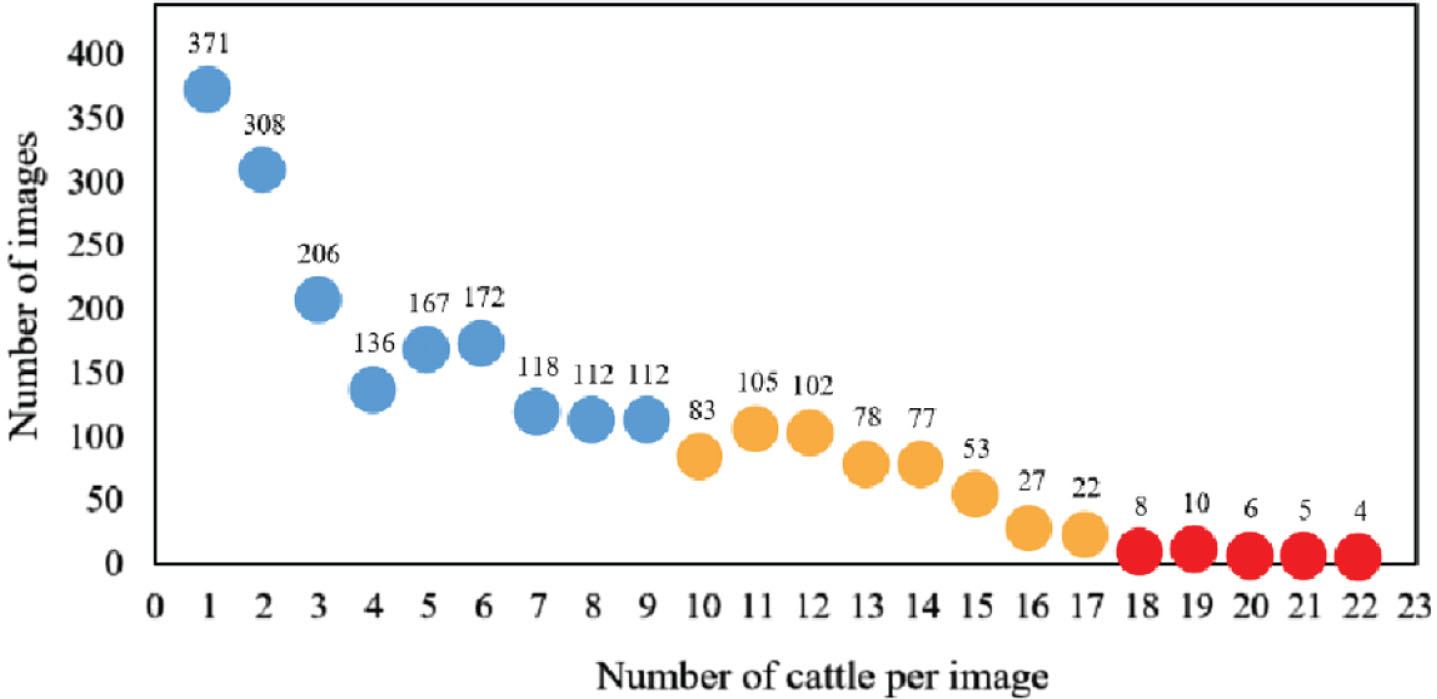
Distribution of the number of cattle in the images of the dataset.
Combined with the camera mounting height analysis, there are a lot of occlusion cases in the experimental dataset, which is one of the main research issues in this paper. The small amount of experimental data and the density of individual cattle lead to poor model robustness, so the experiments used Mosaic, random scaling, translation, rotation, color transformation, saturation transformation, and brightness transformation to improve the model generalization. The dataset was divided into a training set, a validation set and a test set in the ratio of 8 : 1:1, with 1824 images in the training set, 229 images in the validation set and 229 images in the test set.
Compared to the latest YOLOv6, YOLOv7 and YOLOv8 models, YOLOv5 has the characteristics of small size and fast inference, while YOLOv5 is divided into ten different structures such as n, s, m, l, x, n6, s6, m6, l6, x6, etc., of which YOLOv5s has both accuracy and speed advantages. In addition, compared with other object detection algorithms, YOLOv5 has been quite mature in the industrial field [43]. Considering the above factors, YOLOv5s is chosen as the base model to ensure real-time performance and improve detection accuracy.
YOLOv5s mainly consists of three parts, including backbone network, neck network and prediction layer. The backbone network is mainly responsible for feature extraction, and the main body is CSPDarknet53. Through the stacking of Conv and C3 modules, features are fused across stages to reduce the number of parameters and improve the feature extraction capability. The neck network combines Feature Pyramid Networks and Path Aggregation Network, making full use of the fine-grained information of the shallow structure and the semantic information of the deep structure to enhance the feature fusion effect. The prediction layer consists of three detection branches, which generate category and location information for large, medium and small objects respectively.
In this paper, the backbone network of the model is first improved to enhance model accuracy, followed by replacing the standard convolution module in the neck and adding an attention mechanism to balance the accuracy and speed requirements for real-time detection of cattle. In the backbone of the network, a CSP cross-stage local network structure is adopted based on the original SPPF network, which combines the original features with the SPPF output to improve feature extraction ability by fusing gradient changes into the entire feature map. A Coordinate Attention mechanism is added after layers 17, 21 and 25 of the model neck, respectively, which makes the network more focused on the cattle object and improves detection performance. The GSConv module is also used instead of the Conv module to balance the accuracy and speed of the model, and Slim Neck is introduced to reduce the model’s floating-point operation in the model, achieving greater computational cost effectiveness. The improved model is called SCS-YOLOv5s, SCS is the initials of SPPFCSPC, CA and Slim Neck respectively, and its structure is shown in Fig. 5.
Structure diagram of CA mechanism.
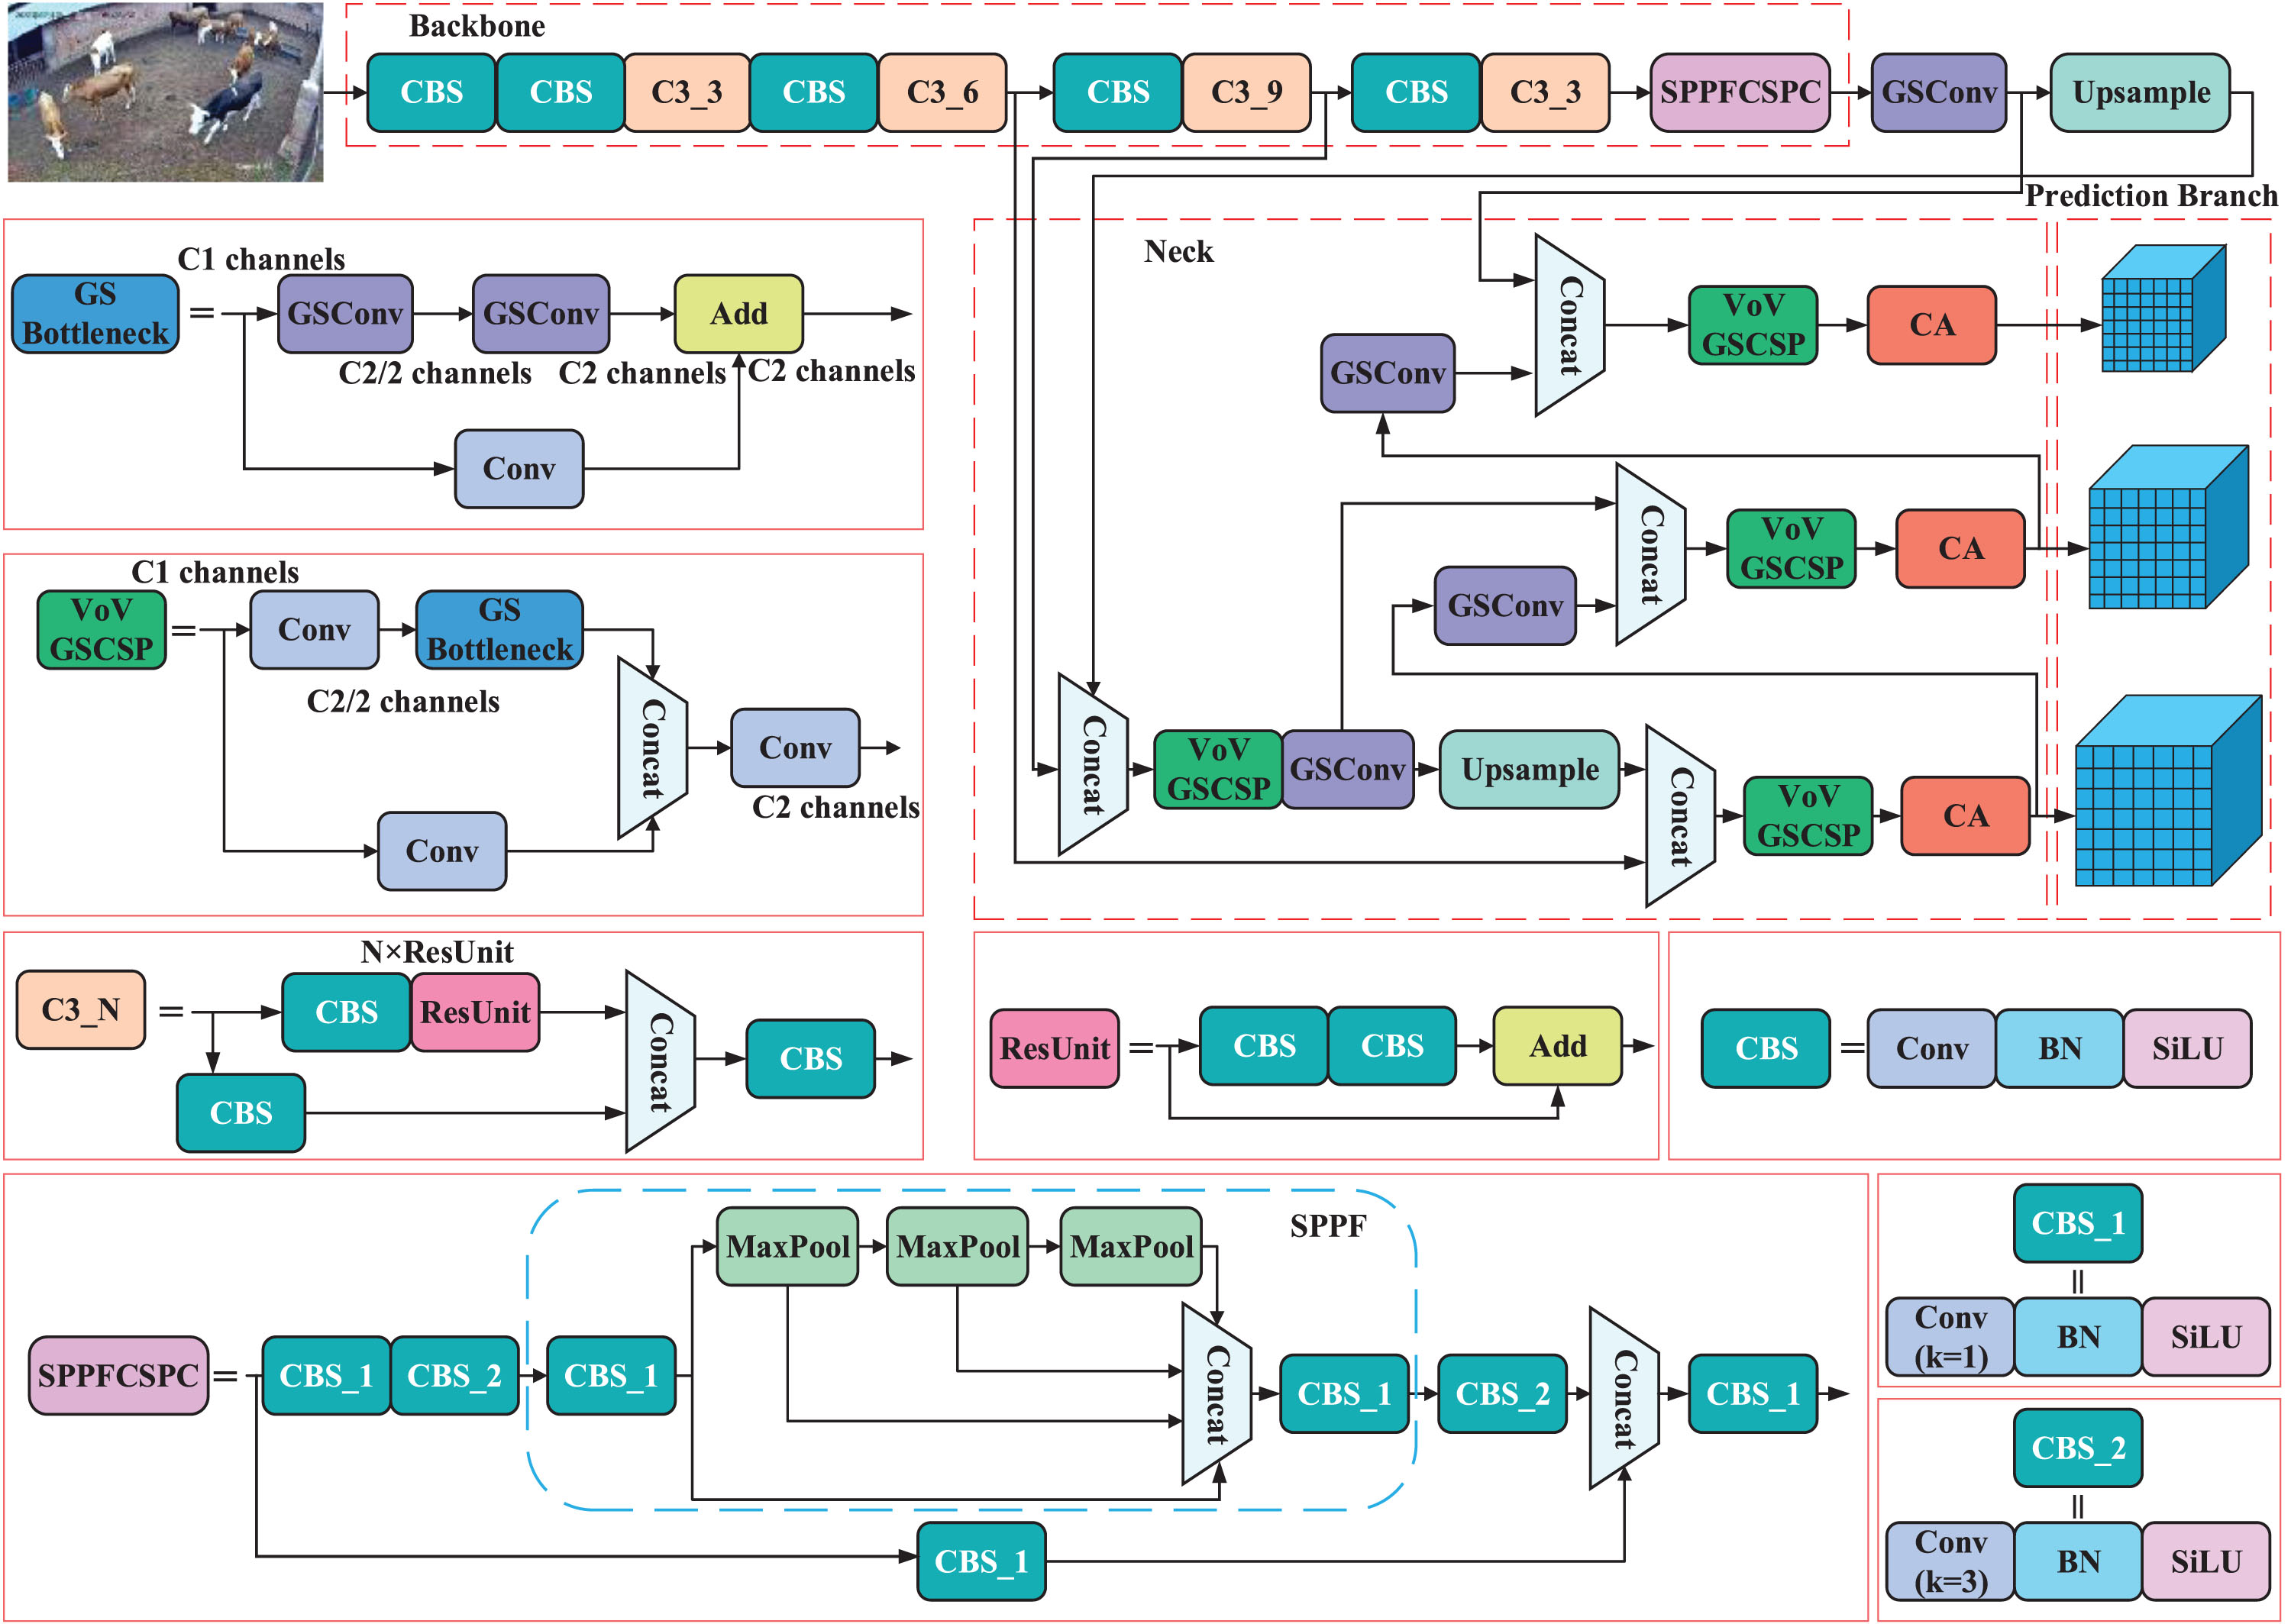
Structure diagram of SCS-YOLOv5s.
In the original YOLOv5 model, SPPF can avoid image distortion caused by cropping and scaling operations on images regions, while solving the problem of repeated extraction of image features by convolutional neural networks, saving computational costs and improving computational speed. In the improved model of this study, the idea of CSP cross-stage local network is introduced into SPPF to fully integrate the deep and shallow features of the network, maximize the number of branching paths, and improve the learning ability of the network. The structure of SPPFCSPC is shown in the lower left of Fig. 5, and the structure in the blue dashed box in the figure is the original SPPF network.
The CA mechanism was integrated to reduce complex background interference
In conventional object detection tasks, complex backgrounds tend to make the network ignore the detailed features of the target object and extract a large number of background features, which seriously affects the detection effect. To solve the above problems, this study proposes a YOLOv5 network integrating CA mechanism for the complex light and environment of pastures.
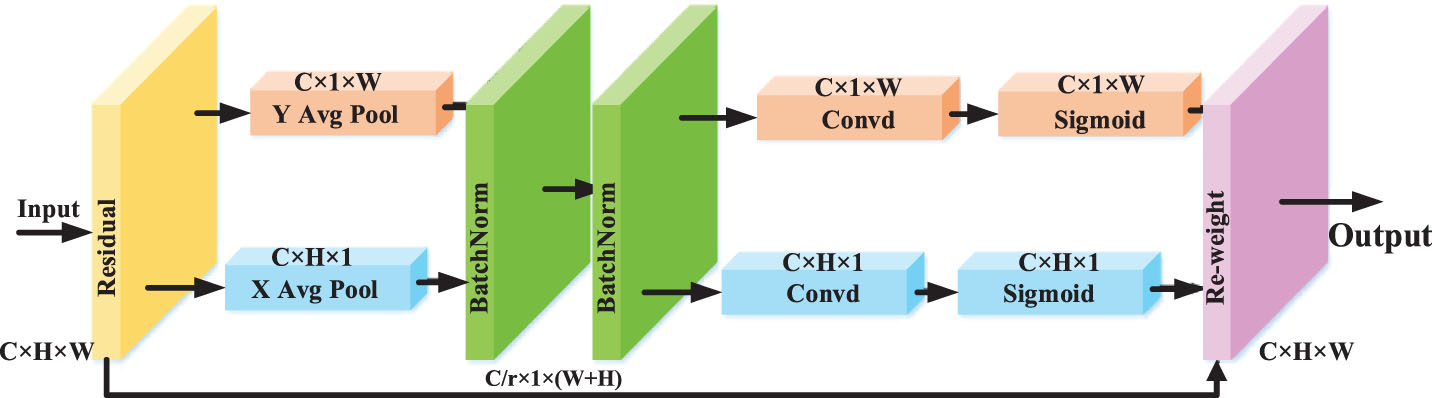
CA decomposes channel attention into two 1-D feature encoding processes, and aggregates features along two spatial directions respectively, which not only captures remote dependencies, but also retains precise location information, generating a pair of direction-sensitive and location-sensitive attention maps respectively to enhance the representation of the object of interest. The structure of CA mechanism is shown in Fig. 4.
Slim Neck is introduced to ensure the detection speed
Considering the needs for real-time object detection, the detection network should consider both accuracy and speed. Accordingly, all the standard convolutions in the neck of the network are replaced by GSConv with both accuracy and speed advantages, and its structure is shown in Fig. 6.
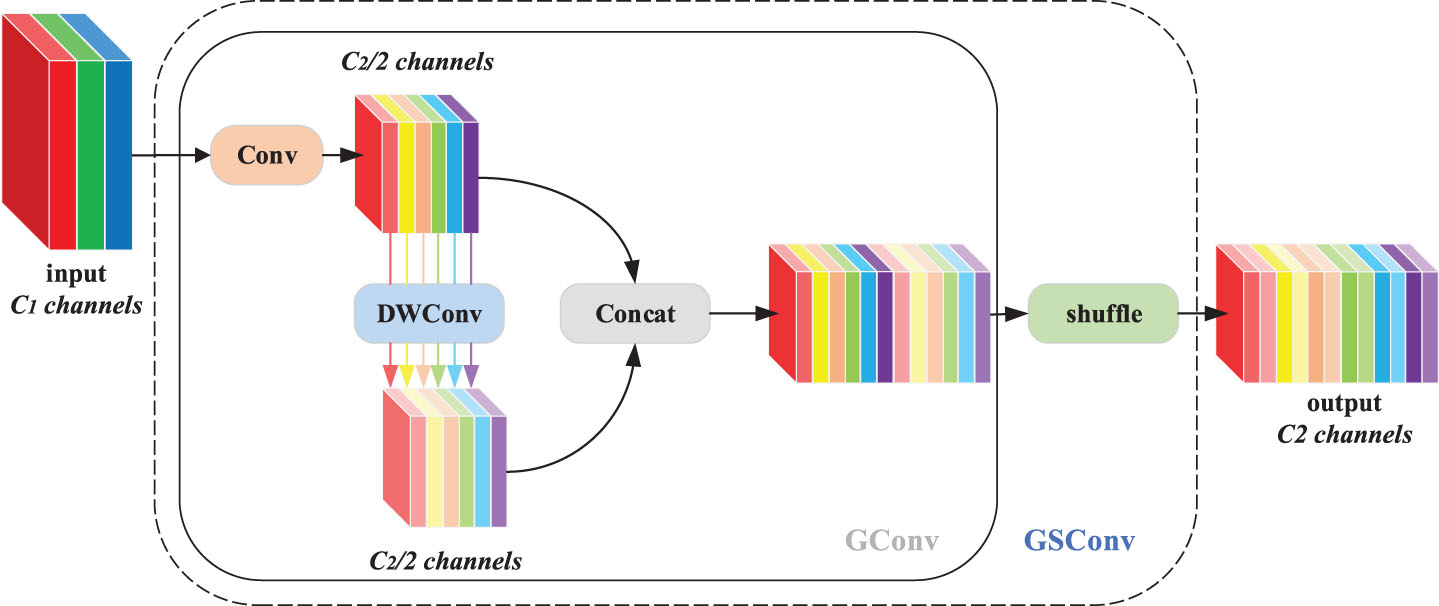
GSConv module structure diagram.
GSConv is the product of combining SC and DSC (Depth-wise Separable Convolution), retaining the feature extraction power of SC, taking the advantage of DSC in reducing the number of parameters. The SC-generated information is permeated into every part of the DSC-generated information using shuffle. In addition, the introduction of Slim Neck enables the detector to be more computationally cost effective, saving computational resources.
In this paper, the default image resolution is 640×640, the Batch Size is 32, the AdamW optimizer is used, the momentum is 0.937, training 200 epochs on a single GPU. To describe the effectiveness of model detection, the Precision, mAP (mean Average Precision) and FPS (Frames Per Second) are used as evaluation metrics for the object detection algorithm. The closer the values of Precision and mAP are to 100%, the better the detection effect is. The RMSE (Root Mean Square Error) is used as an evaluation indicator for cattle counting, the closer the RMSE is to zero, the lower the counting error is, and the better the effect is.
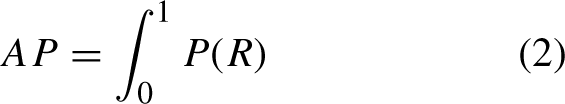
Precision evaluates the accuracy of the classifier’s prediction, the number of correctly predicted positive samples as a proportion of the total number of predicted positive samples. mAP measures how well each category is detected on average, there is only one category in this paper, so it is also equivalent to AP, which is the area enclosed by the PR curve. mAP evaluation metrics with 2 IOU thresholds are used in the paper respectively, namely mAP@0.5 (mAP with IoU set to 0.5) and mAP@0.5 : 0.95 (mAP with IoU from 0.5 to 0.95 with step size 0.05). For the above object detection evaluation metrics with four values of TP (positive samples predicted as positive samples), TN (negative samples predicted as negative samples), FP (negative samples predicted as positive samples) and FN (positive samples predicted as negative samples). In addition, the number of object detection classes is defined as c, then the above indicators can be calculated by the following formulas: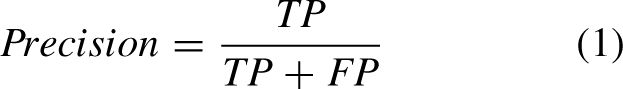

RMSE is commonly used as a measure of the dispersion between predicted and true values, that is, the deviation between the model’s predicted and true cattle numbers. RMSE is calculated as follows: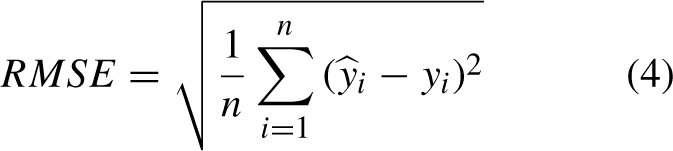
In Equations (4),
The workstation configurations used in the experiments are shown in Table 2.
Experimental software and hardware configuration parameters
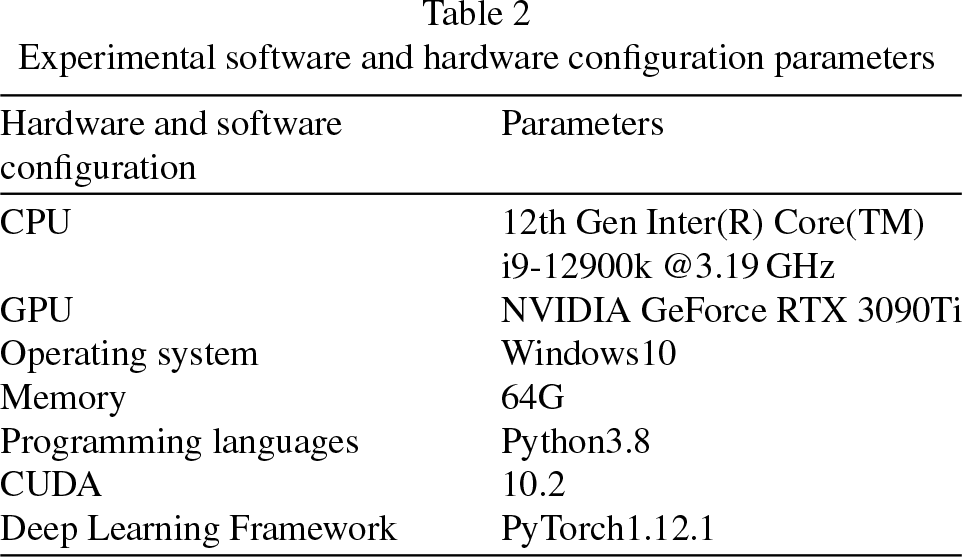
Experimental software and hardware configuration parameters
The most widely used optimizers for object detection tasks are SGD and Adam. However, SGD may fall into a local optimum with large fluctuations. Adam parameters are smoother and different adaptive learning rates are calculated for different parameters. AdamW, on the other hand, incorporates weight decay, which adds the regular term directly to the backpropagation process and is more computationally efficient. The validation loss curves when using different optimizers are shown in Fig. 7. Obviously, the model converges faster and the curves are smoother when using AdamW, and the losses are relatively lower after smoothing.
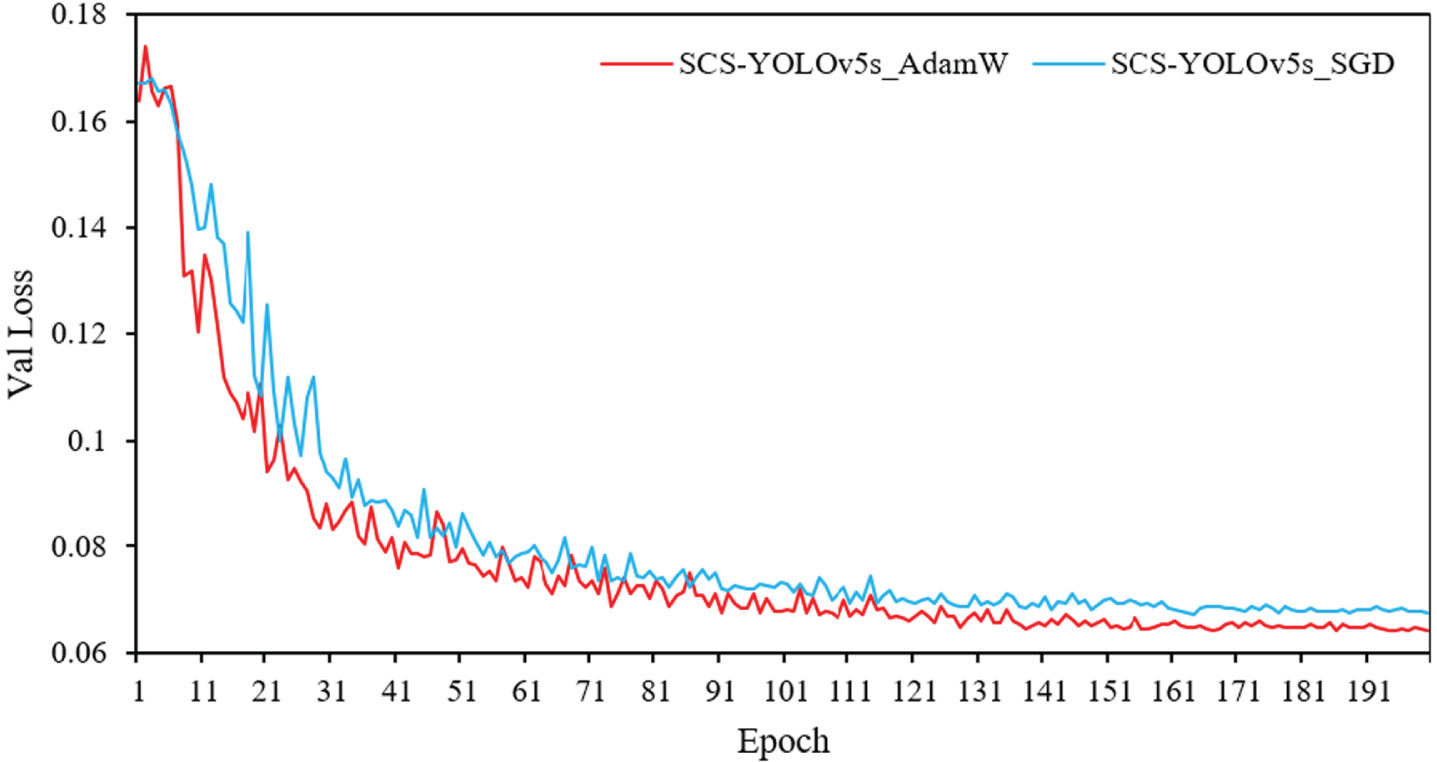
Comparison of validation loss curves using different optimizers.
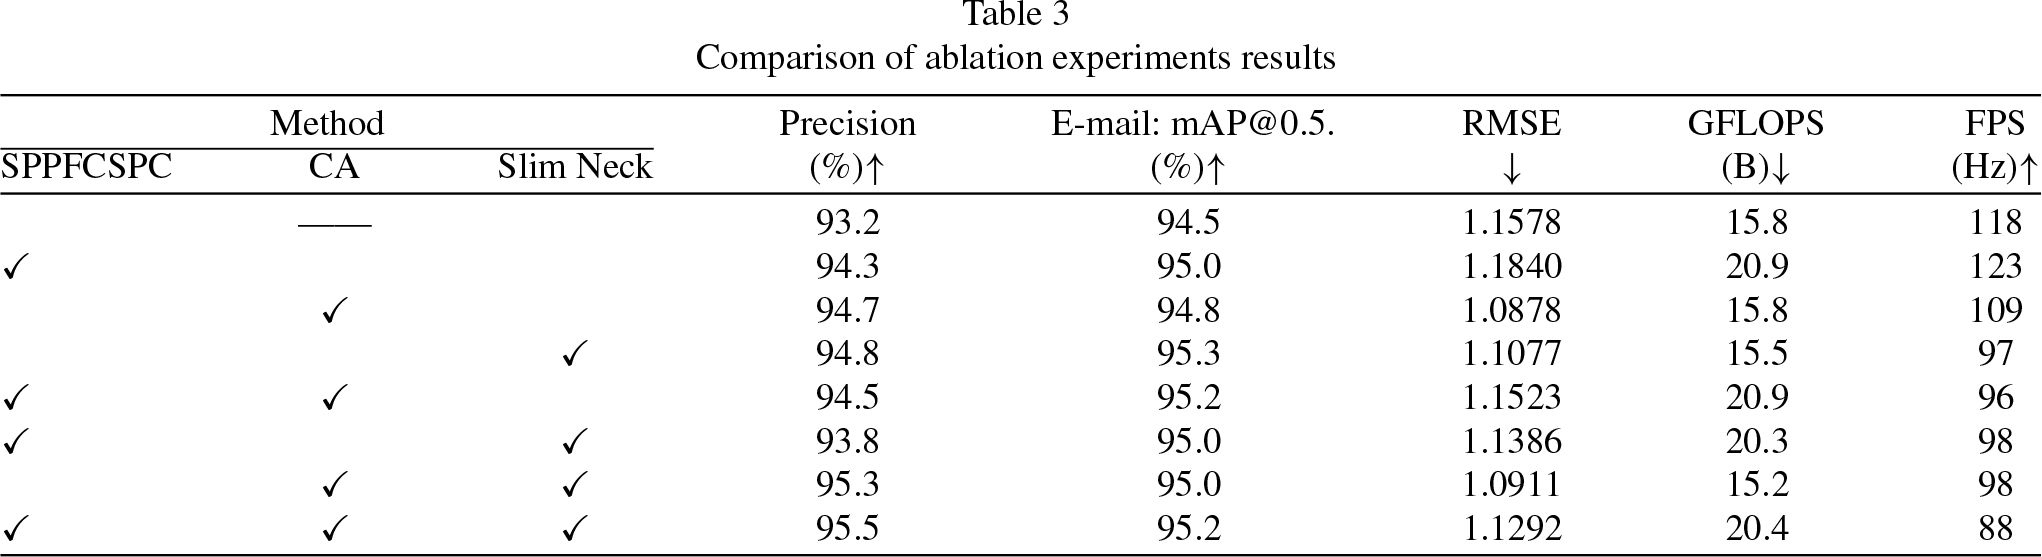
In order to verify the effectiveness of each improvement method, ablation experiments were designed in this paper to verify the effects on the experimental results for one improvement point, different combinations of two improvement points and three improvement points, respectively, as shown in Table 3.
Comparison of ablation experiments results
Comparison of ablation experiments results
As can be seen from the table, all three improvement points were able to obtain an improvement in accuracy as well as a reduction in counting error. After replacing SPPF with SPPFCSPC, the Precision and mAP@0.5 of the model are increased by 1.1% and 0.5% respectively, and it also has a small improvement in FPS, which shows that the cross-stage idea can improve the detection speed of model. After introducing CA mechanisms, the Precision is increased by 1.5%, mAP@0.5 is increased by 0.3%, and the RMSE is reduced by 0.07. After using Slim Neck, the Precision and mAP@0.5 of the model are greatly improved, while the model floating point operation is lower than the original network by 0.3B, which is a good balance between accuracy and computational cost.
When the three improvement points are combined in pairs, compared with only one improvement point, Precision and mAP@0.5 gain different degrees of increase, the RMSE also increases slightly, but the FPS decreases slightly with the increase of the number of model parameters. The Precision value of the improved model is increased from 93.2% to 95.5%, the mAP@0.5 value is increased from 94.5% to 95.2%, the RMSE is also reduced by about 0.03, and the FPS can still maintain a high level to meet the requirements of real-time.
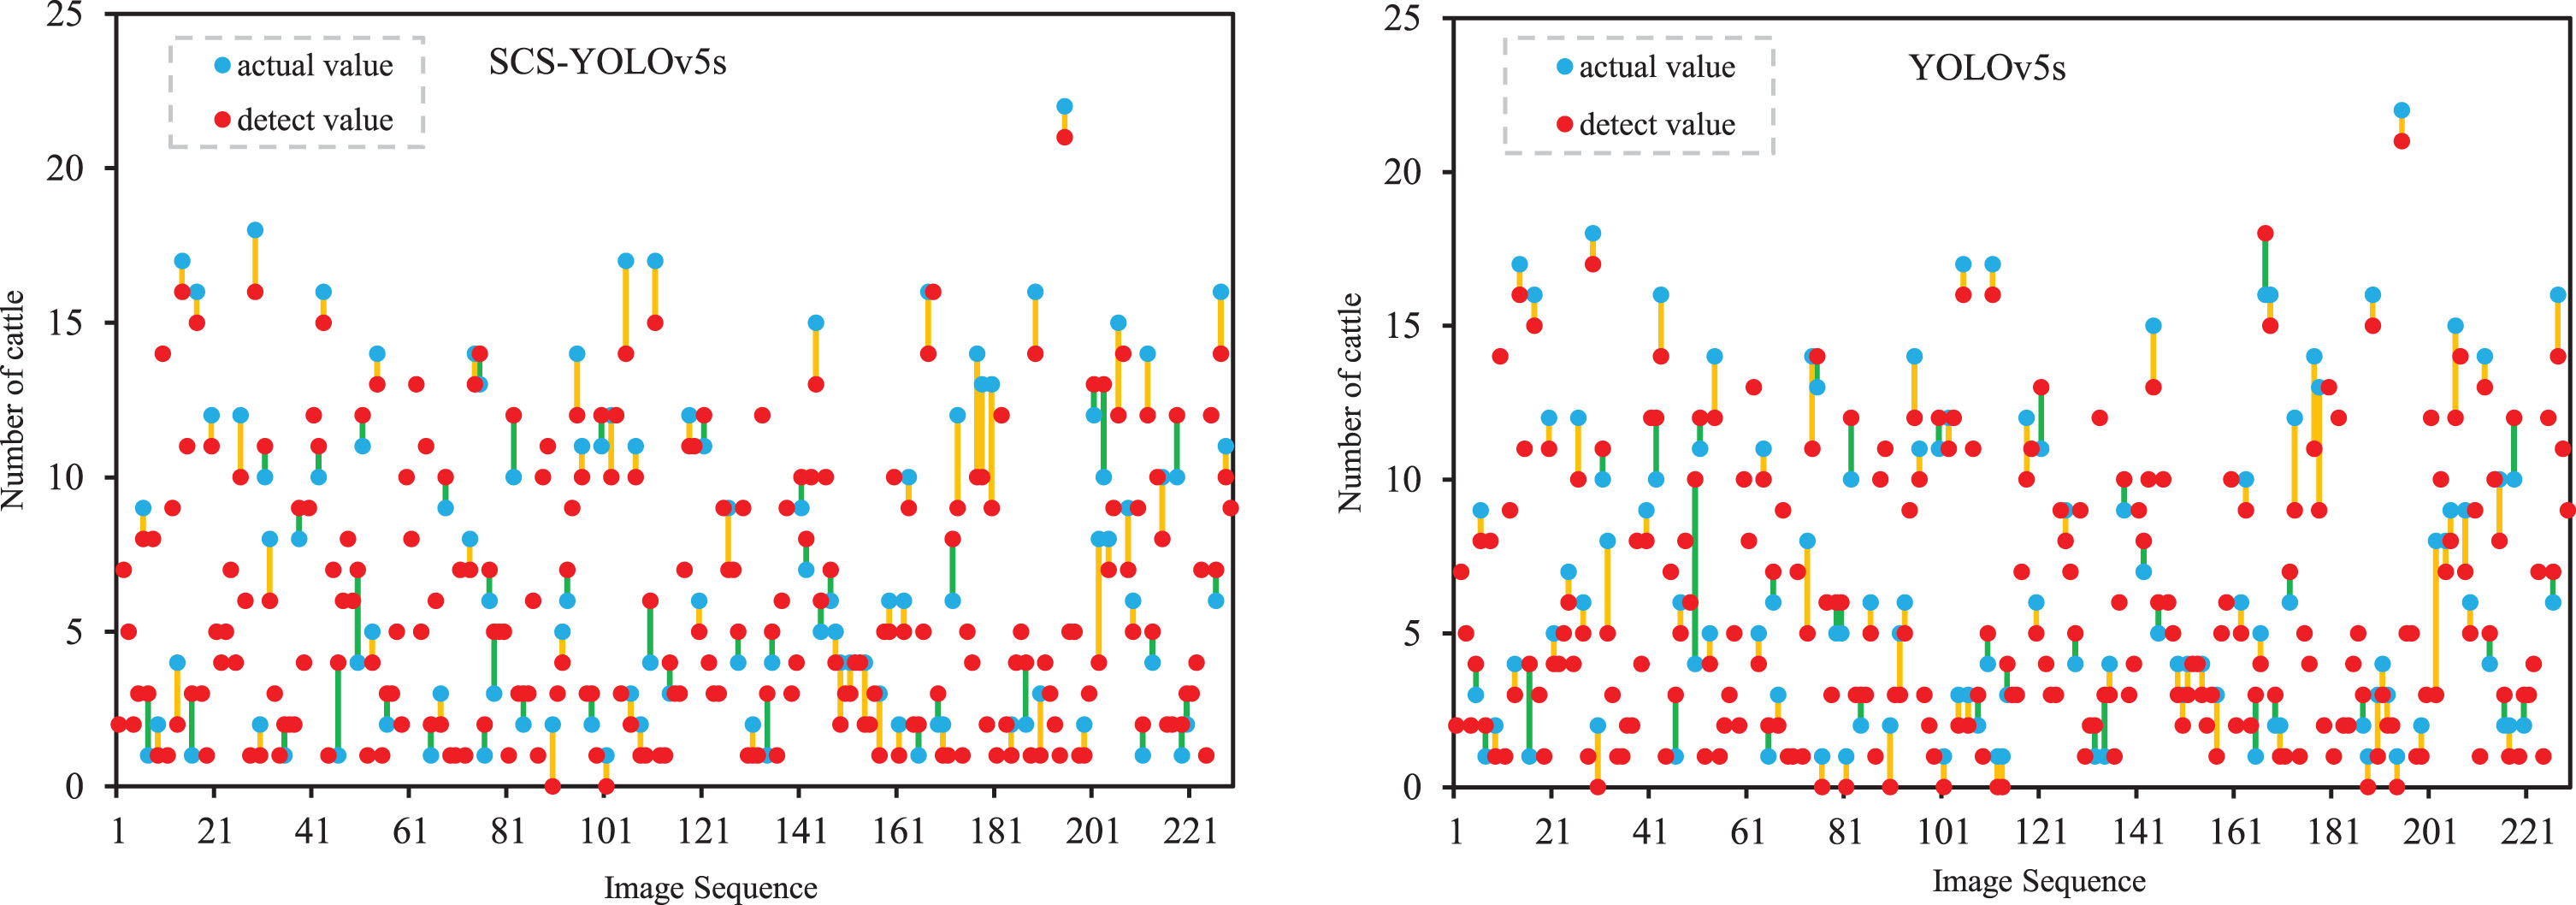
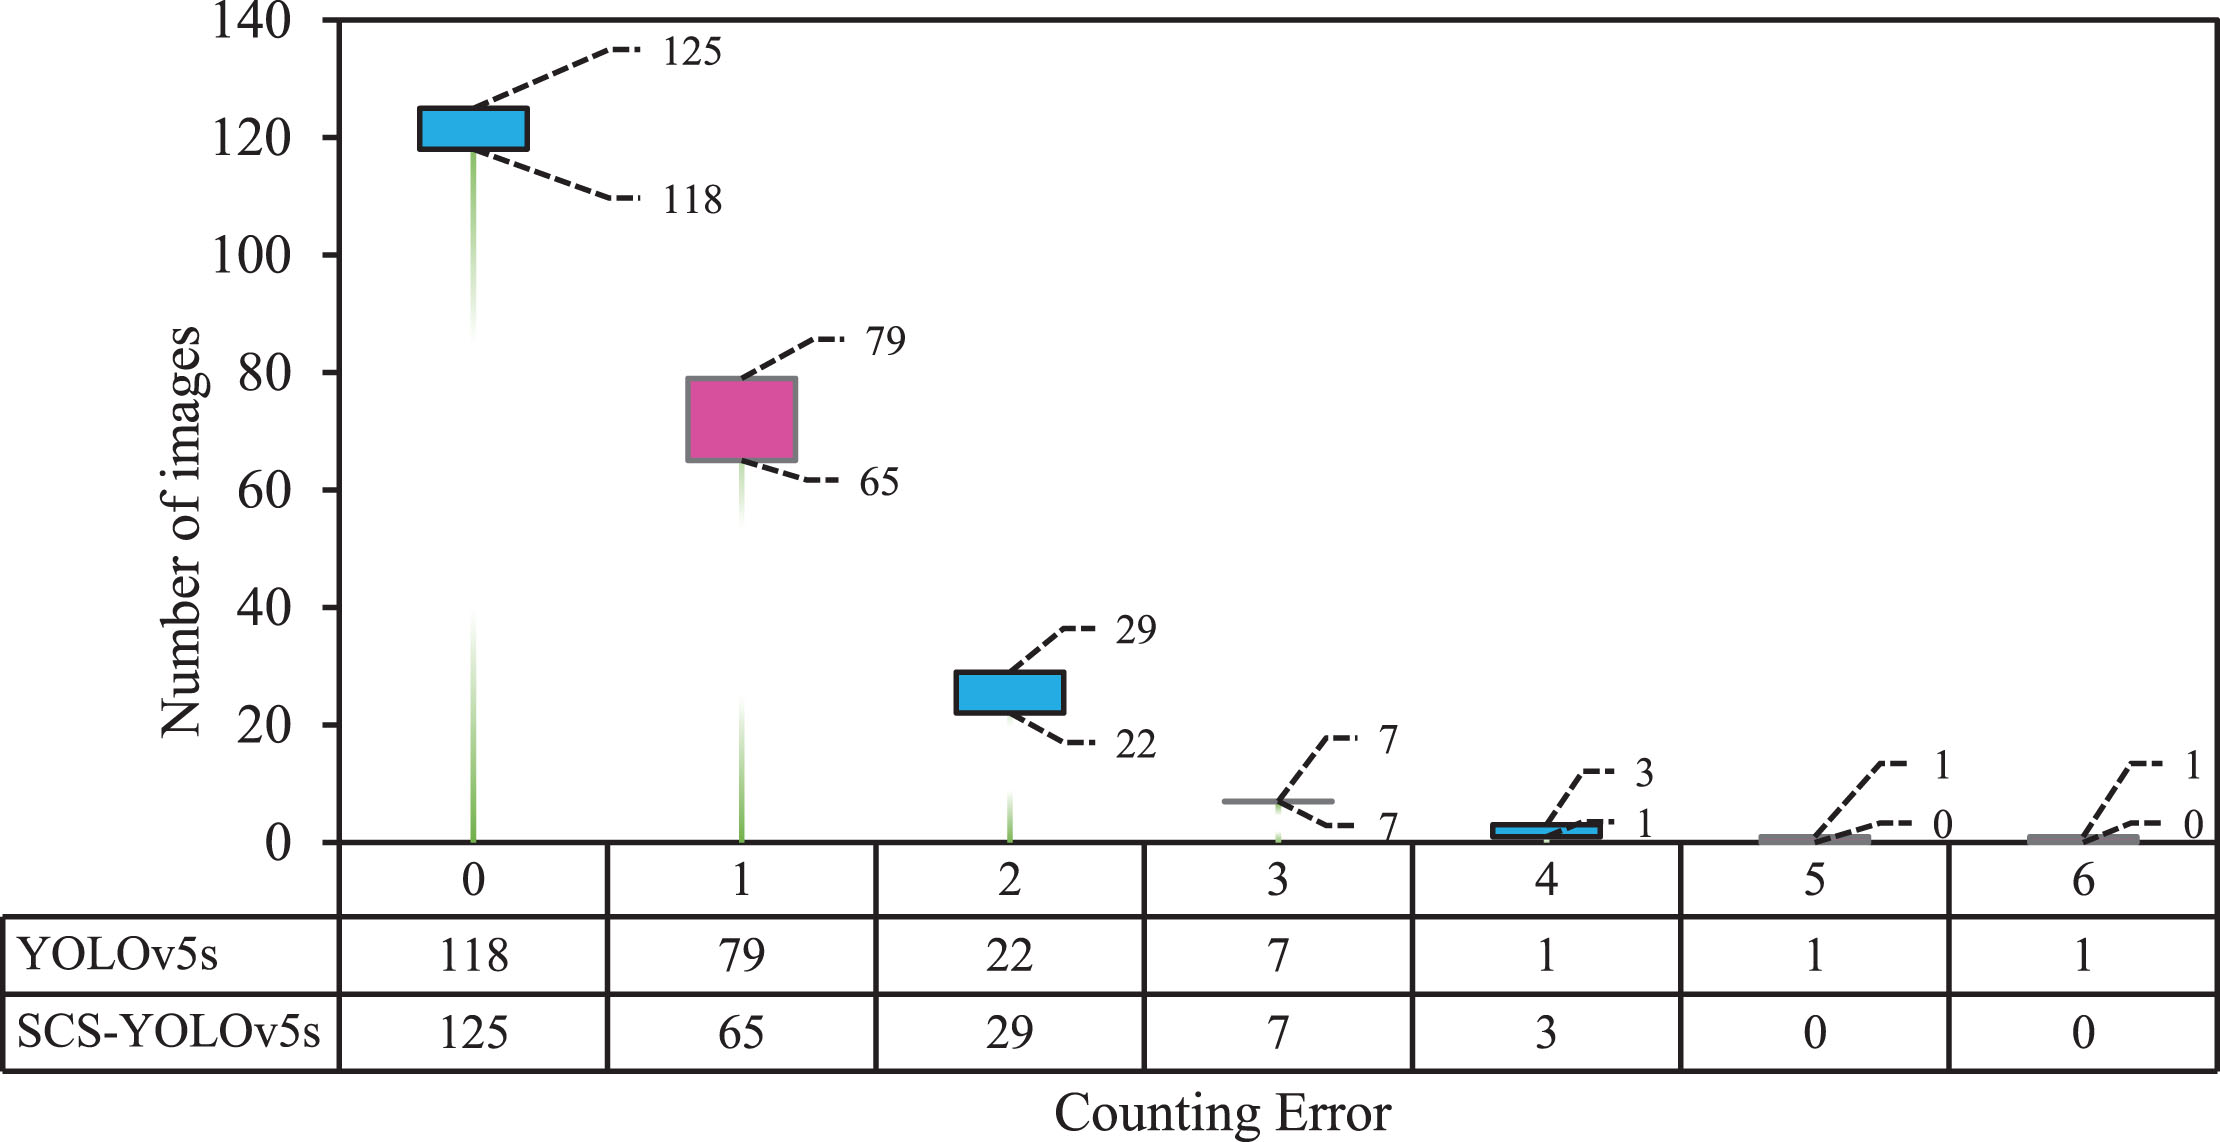
The counting effects of SCS-YOLOv5s and YOLOv5s were examined on 229 test set images, and the improved model has fewer missed and false detections compared to the original model, as shown in Fig. 8, where the blue dots represent true values, the red dots represent detected values, and the orange line represents cases where the true value is greater than the detected value, and the opposite is true for the green line. Figure 9 shows the counting error comparison statistics between YOLOv5s and SCS-YOLOv5s, where the horizontal coordinates indicate the distribution of counting errors in the 229 test images, and the vertical coordinates are the corresponding number of images under each error. The pink color represents that there are more images with the same counting error for YOLOv5s than for SCS-YOLOv5s, while the blue color represents the opposite. As can be seen from the figure, SCS-YOLOv5s has the largest number of cases with an error of 0, and the number of cases with an error of 5-6 is zero, and their error is reduced to 4. Although the improved model has a slightly larger number of cases with an error of 2 cattle than YOLOv5s, it zeroes out a large number of cases with an error of 1, and exhibits much better robustness, which improves the model’s detection performance and counting accuracy in the same environment.
Comparative statistics of YOLOv5s and SCS-YOLOv5s counting errors.
Comparison of counting errors between YOLOv5s and SCS-YOLOv5s.
Use different attention mechanisms
In the field of image processing, the attention mechanism can essentially achieve focusing on important information with high weights and ignoring irrelevant information with low weights, and important information can be selected under different usage situations by adjusting the weights. Different attention mechanisms are suitable for different application scenarios. This paper finds the most suitable attention mechanism for this model by introducing an attention mechanism to efficiently extract features and adapt to the complex cattle breeding environment through comparative experiments.
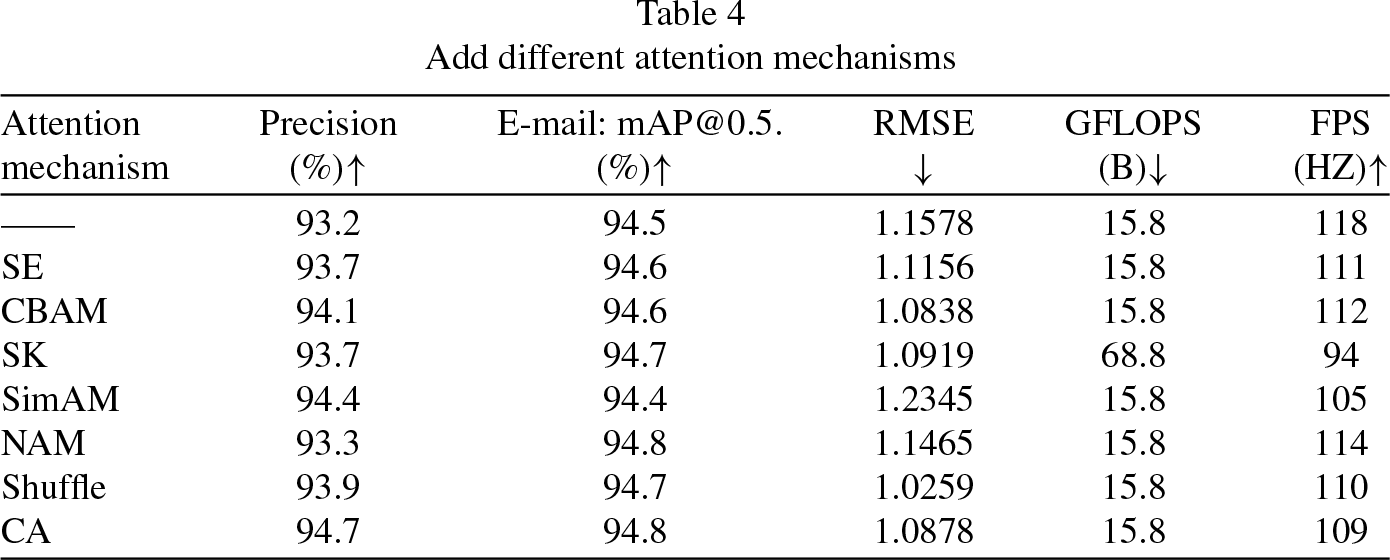
Table 4 presents the experimental results of the seven commonly used attention mechanisms, focusing on their accuracy and Root Mean Square Error, the attention mechanisms are added to the CA location as shown in Fig. 5.
Add different attention mechanisms
Add different attention mechanisms
The experimental results show that CA has the most significant effect on improving model accuracy and reducing counting errors. Precision is improved by 1.5% compared to no attention mechanism used, mAP@0.5 is improved by 0.3%, while RMSE is also reduced by 0.07.
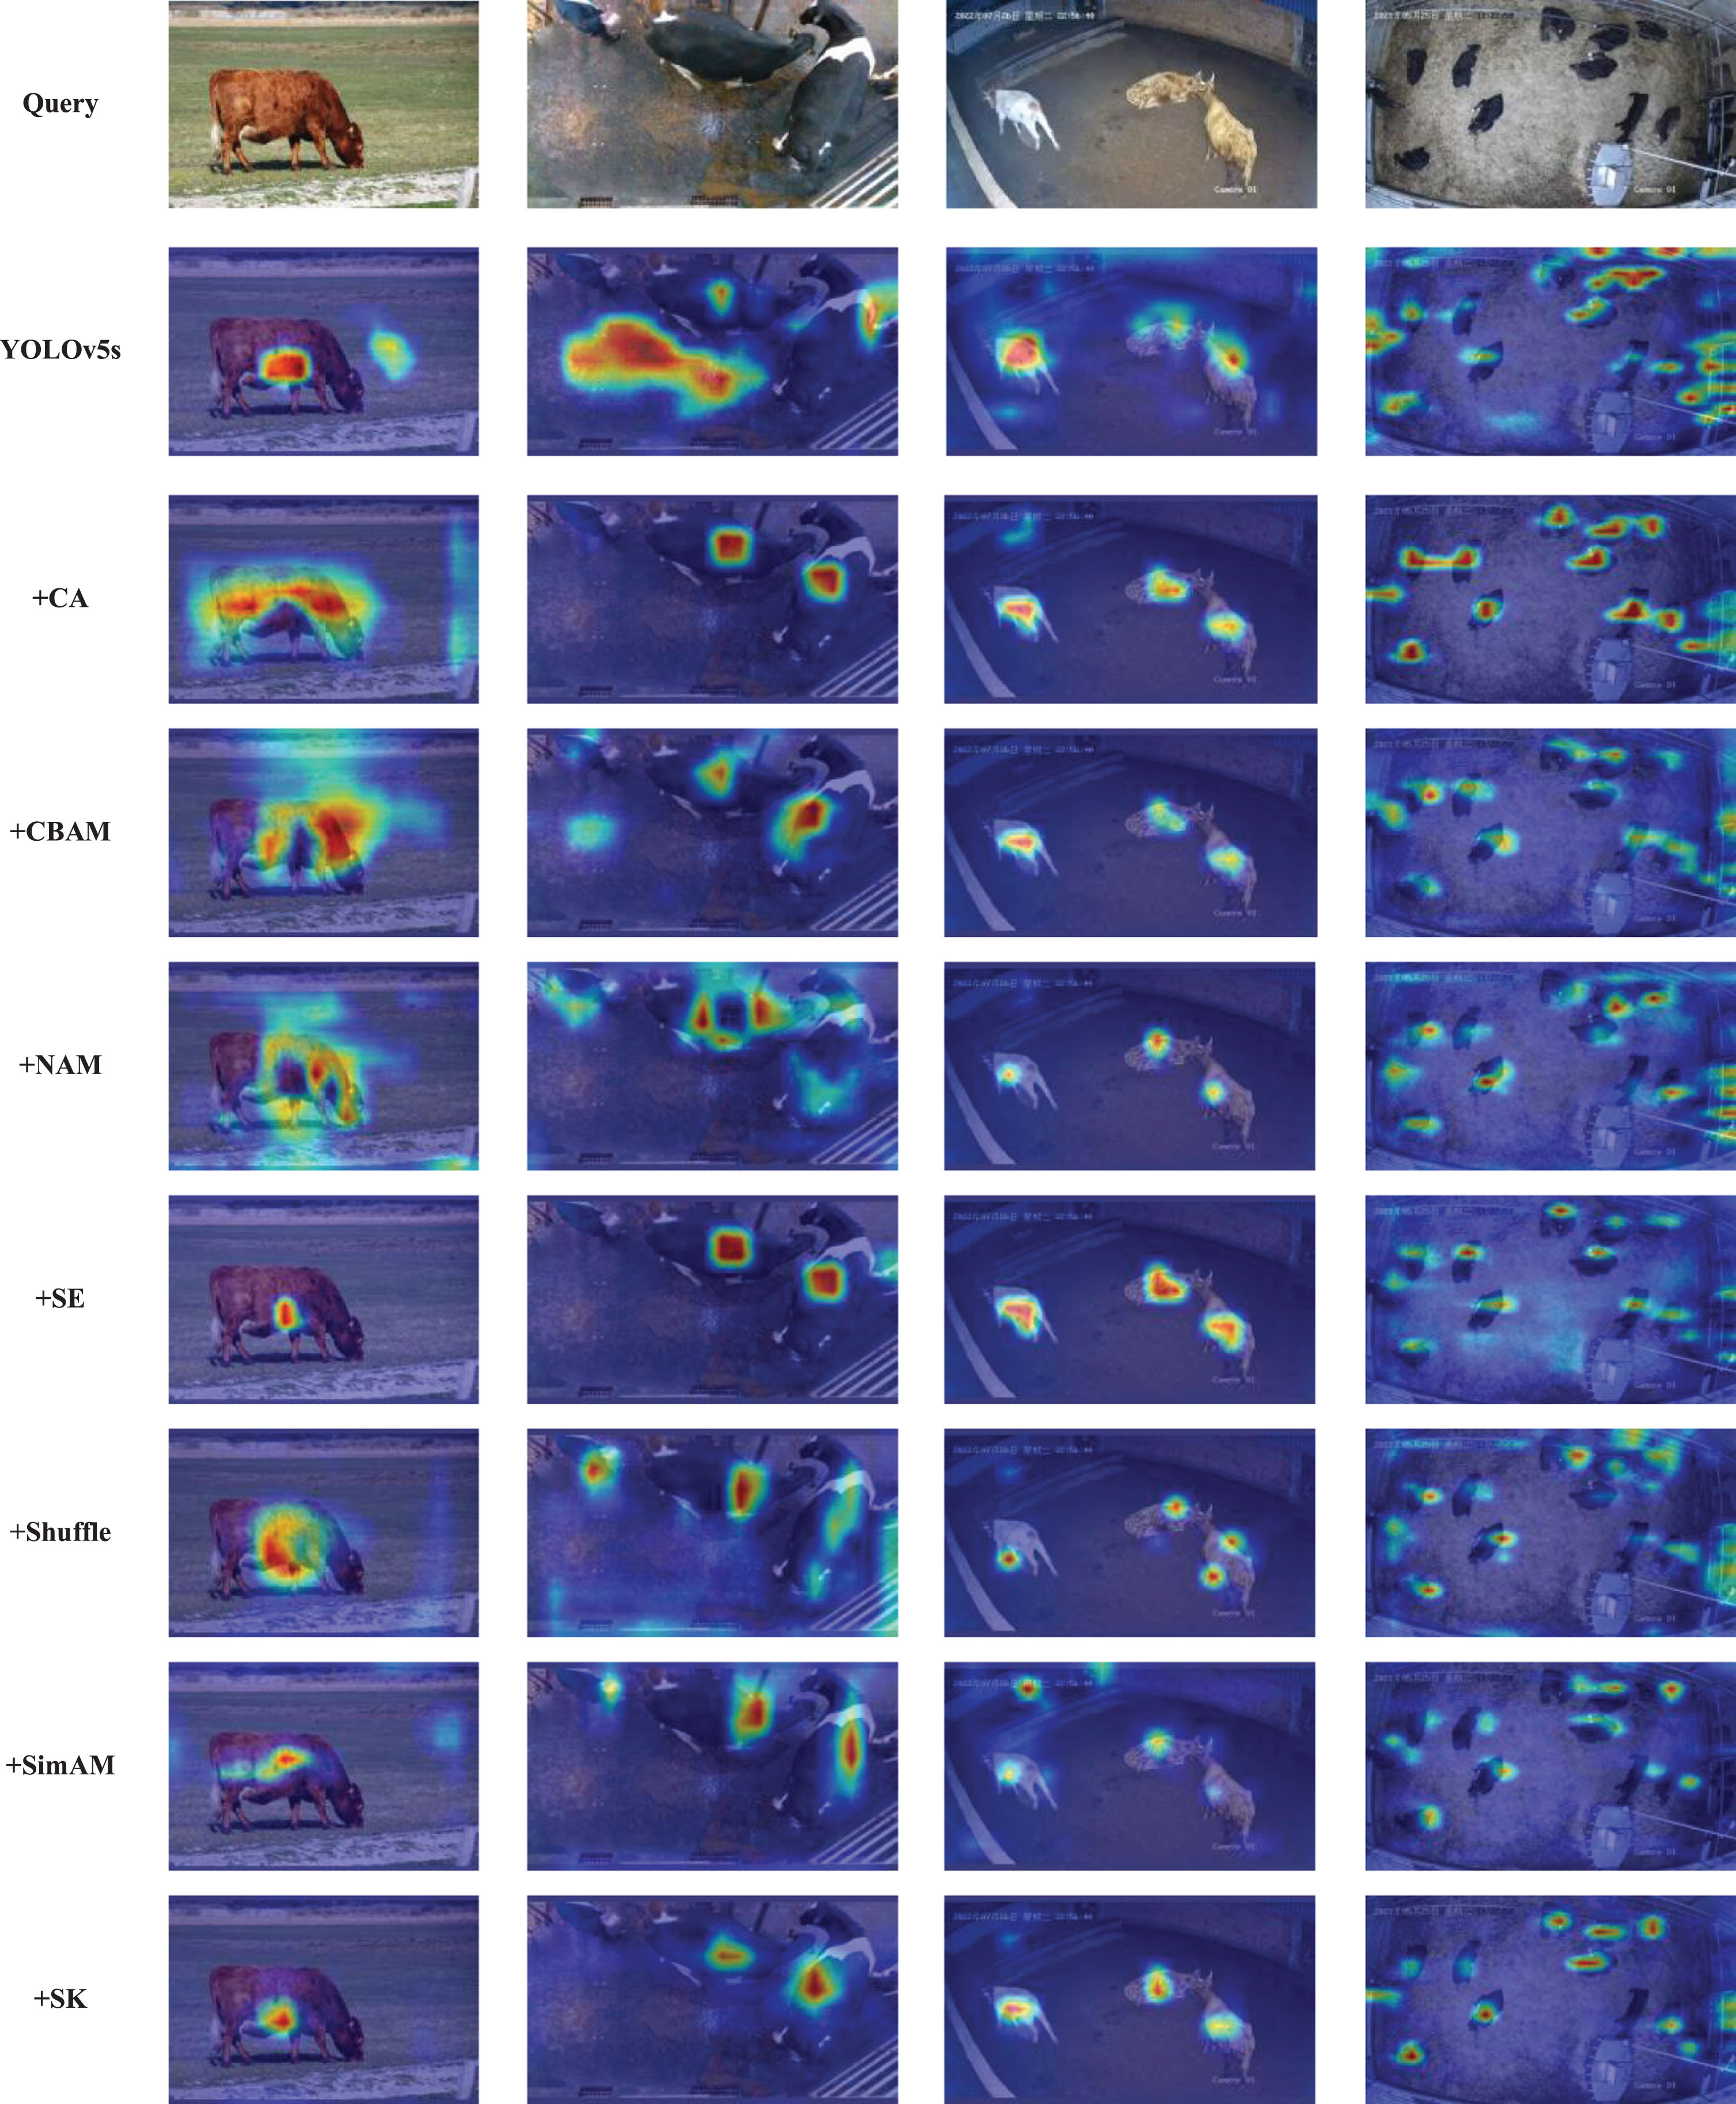
In order to compare the effect of CA more intuitively, the visualization results of the heatmap of the middle layer features of the model are output, as shown in Fig. 10. Four scenarios are randomly selected to verify their effects, each column represents one scenario, the 1st row is the original input image, the 2nd row is the original YOLOv5 network heat map, and the 3rd–9th rows are the heat maps after adding seven attention mechanisms respectively. Compared with other attention mechanisms and no attention mechanism added, all target instances are detected by adding CA mechanism, and the features extracted by CA are more focused on the target itself and contain less background information, which can distinguish the individual cattle well from dense scenes. While other attention mechanisms extract a lot of background information and even fail to extract target instances, and the performance of other attention mechanisms is poor in dense breeding scenes. Therefore, this study chooses an improved approach based on the CA mechanism.
Comparison Experiment of Attention Mechanisms.
In order to verify the effect of the location of the attention mechanism on the performance of the model, the following experiments were designed: the attention mechanisms were added at the four locations shown in Fig. 11, and the P/2 layer of the Backbone, and the P/4, P/8, P/16 and P/32 layers of the Head were output to compare the differences between the feature maps. In Fig. 11, ding172 is added before Head, ding173 is added after Backbone, while ding174 and ding175 are scattered in Neck. The four additions cover almost the entire network structure, which gives a more comprehensive picture of the effect of different additions on the feature extraction process of the network.
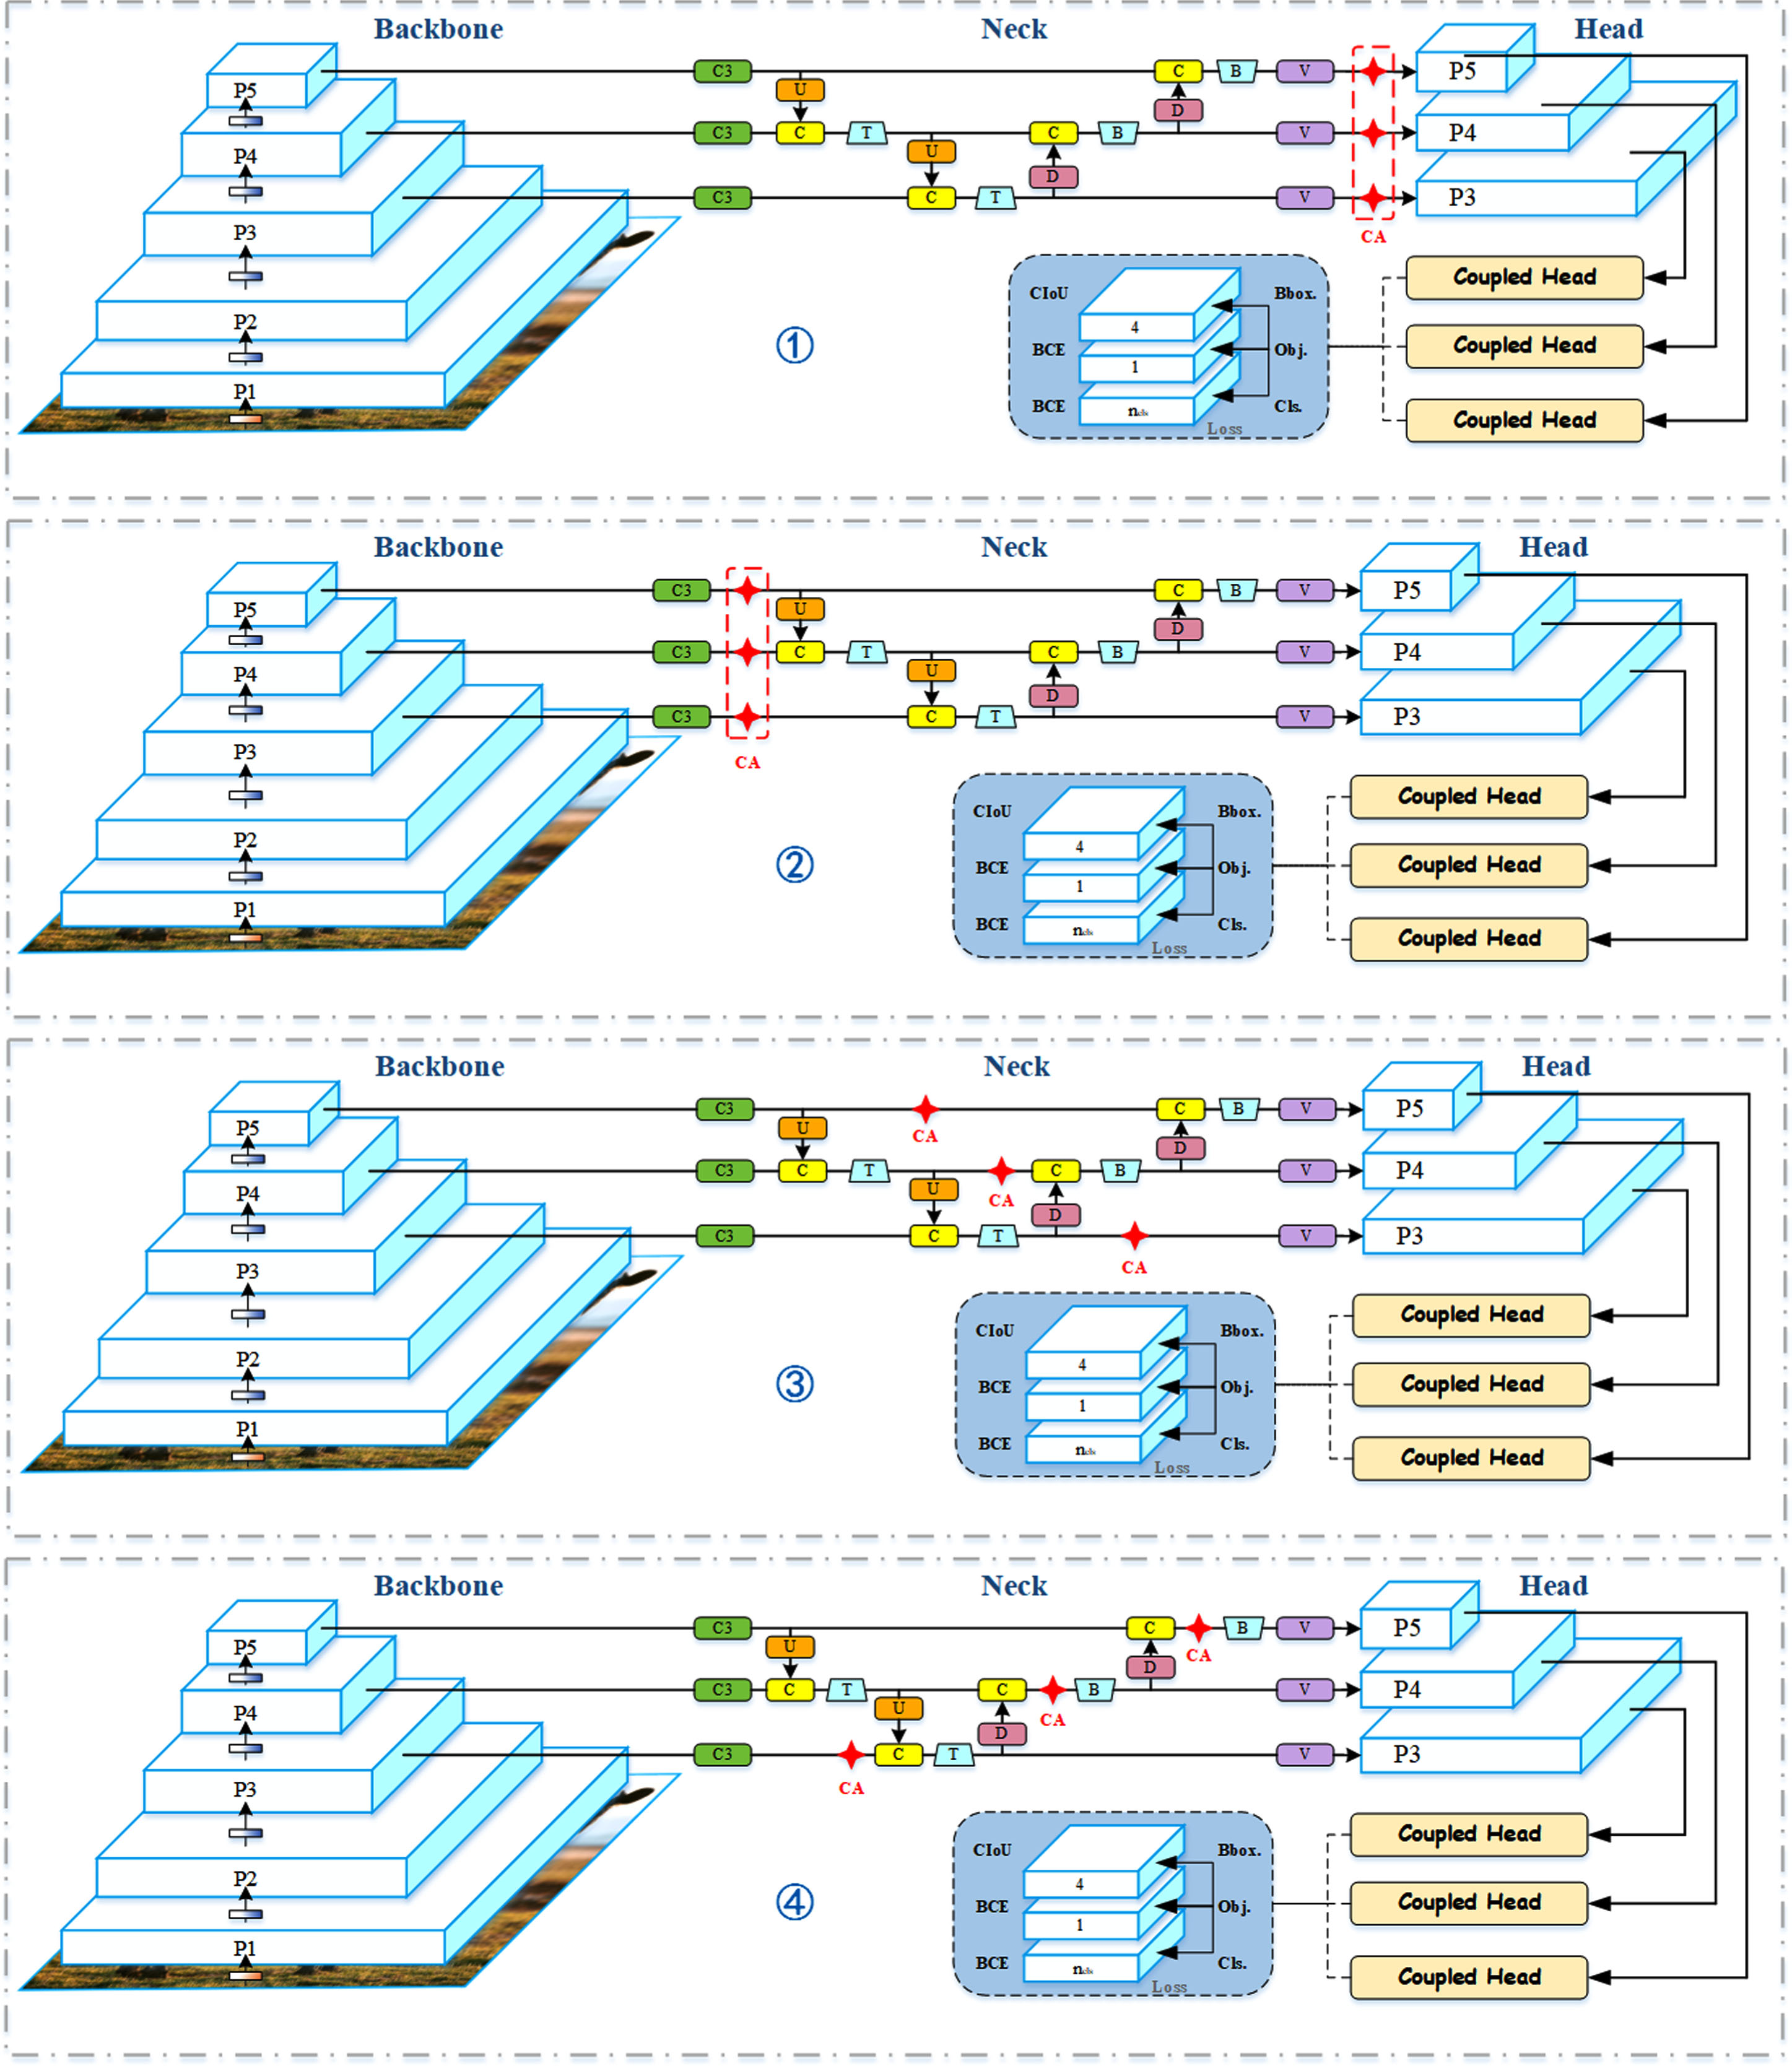
Schematic diagram of the experimental comparison of attention mechanism positions.
Figure 12 shows the visualization results of the feature maps added by the CA mechanism at different locations. The top two panels show the input image and its annotation map respectively, while the bottom four columns from left to right indicate the visualization results of the feature maps at each of the four added locations. Figure 12(a)–(e) show the feature maps of the middle layers of Backbone’s P/2, Head’s P/4, P/8, P/16 and P/32 respectively.
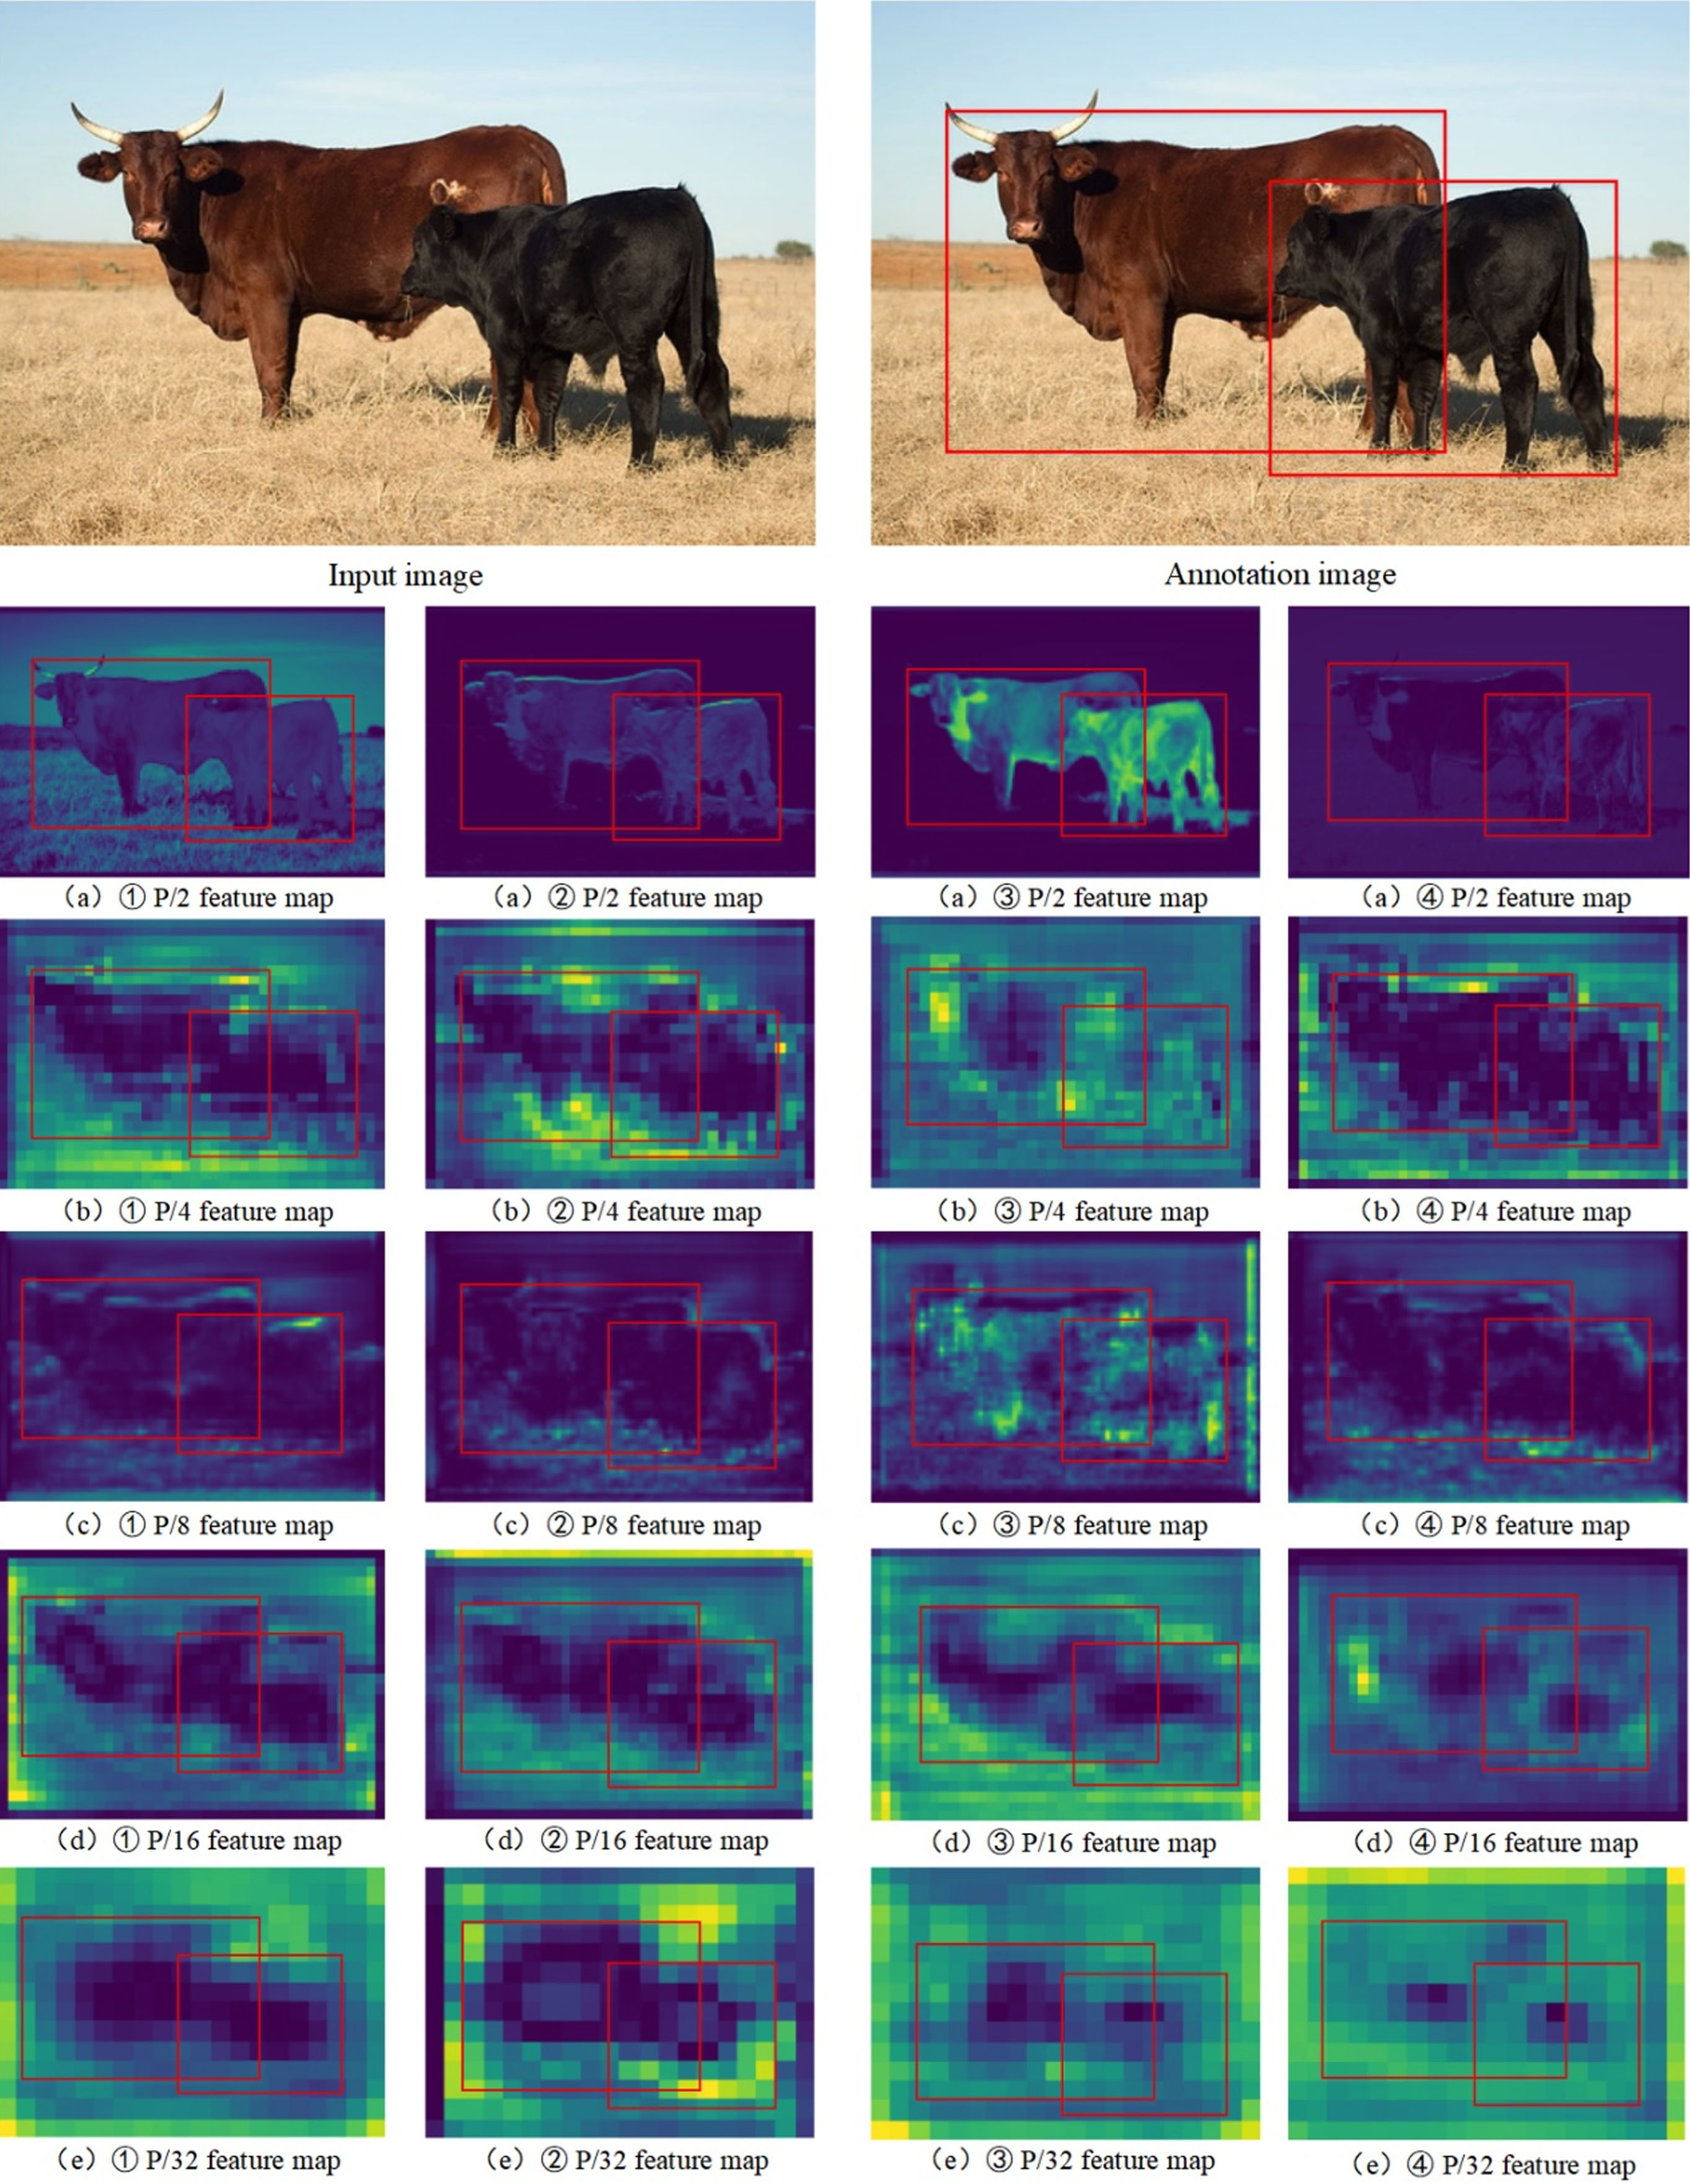
Results of feature map visualization for CA at different locations.
As can be seen in Fig. 12(a), the complete cattle body features were extracted in all four approaches as more shallow features were extracted at layer P/2 of Backbone, before which no attention mechanism was added. Figure 12(b) and (c), on the other hand, extracted more intermediate layer features and were able to roughly see the outline of the cattle, with better results in mode ding172 ding173 ding175 than mode ding174. Figure 12(d) and (e) extract more semantic features through the stacking of convolutional layers. Compared with mode ding174 ding175, mode ding172 ding173 contain rich semantic features and extract more spatial features, although they are deeper networks, they can roughly see the outline of the cattle. Comparing the overlapping parts of the cattle in Fig. 12(d) and (e), mode ding172 can better distinguish the boundary between the two cattle, while mode ding173 joins the outlines of the two cows as a whole. It is clear that the attention mechanism added to mode ding172 can better solve the occlusion problem, and this improved mode is finally chosen in this paper.
In this paper, the one-stage SSD model, the two-stage Faster RCNN model, YOLOv5s, YOLOv6s, YOLOv7 and YOLOv8s models were selected for comparison experiments with the SCS-YOLOv5s model proposed in this paper, the Precision, mAP@0.5, mAP@0.5 : 0.95, Model size, and detection speed of each model were respectively compared, and the experimental results are shown in Fig. 13. Compared with Faster RCNN and SSD, SCS-YOLOv5s has significant advantages in accuracy and speed. Except for SCS-YOLOv8s, Precision and mAP@0.5 of SCS-YOLOv5s are the highest among all algorithms, and its mAP@0.5 : 0.95 is also second only to the most advanced YOLOv8s and SCS-YOLOv8. YOLOv6s has lower values than SCS-YOLOv5s for both mAP evaluation metrics, and its larger model and lower frame rate limit its usage scenarios. Although mAP@0.5 : 0.95 of YOLOv7 is higher than the improved model, its model size is about 2.5 times that of SCS-YOLOv5s, and the frame rate is also inferior, making it difficult to meet the real-time requirements.

Comparison of experimental results of different network models.
In addition, compared with YOLOv8s, the two most important accuracy evaluation indexes Precision and mAP@0.5 of SCS-YOLOv5s are higher than those of YOLOv8s, but they are inferior in terms of model size and detection speed. More importantly, applying the method proposed in this paper to YOLOv8s, the improved model is called SCS-YOLOv8s. Compared to YOLOv8s, the mAP@0.5 and mAP@0.5 : 0.95 of SCS-YOLOv8s has improved by 0.9% and 0.8%, respectively, sacrificing about a quarter of the detection speed, but still maintaining good real-time performance. Therefore, the improved model proposed in this paper is competitive and the optimization method used is effective.
As an important tool for comprehensively assessing the performance of object detection algorithms, the P-R curve usually uses AUC (Area Under Curve) to determine whether the model is good or bad, and the larger the area represents the better performance of the detection algorithm. This paper utilizes the experimental results of the above mainstream YOLO series of object detection algorithms to draw P-R curves, which are compared with the SCS-YOLOv5s proposed in this paper, as shown in Fig. 14. As can be seen from the figure, SCS-YOLOv5s has the best performance, followed by YOLOv8s, YOLOv6s and YOLOv7 have similar performance, while YOLOv5s has the worst performance, which is consistent with our expectation and proves once again the effectiveness of the proposed method.
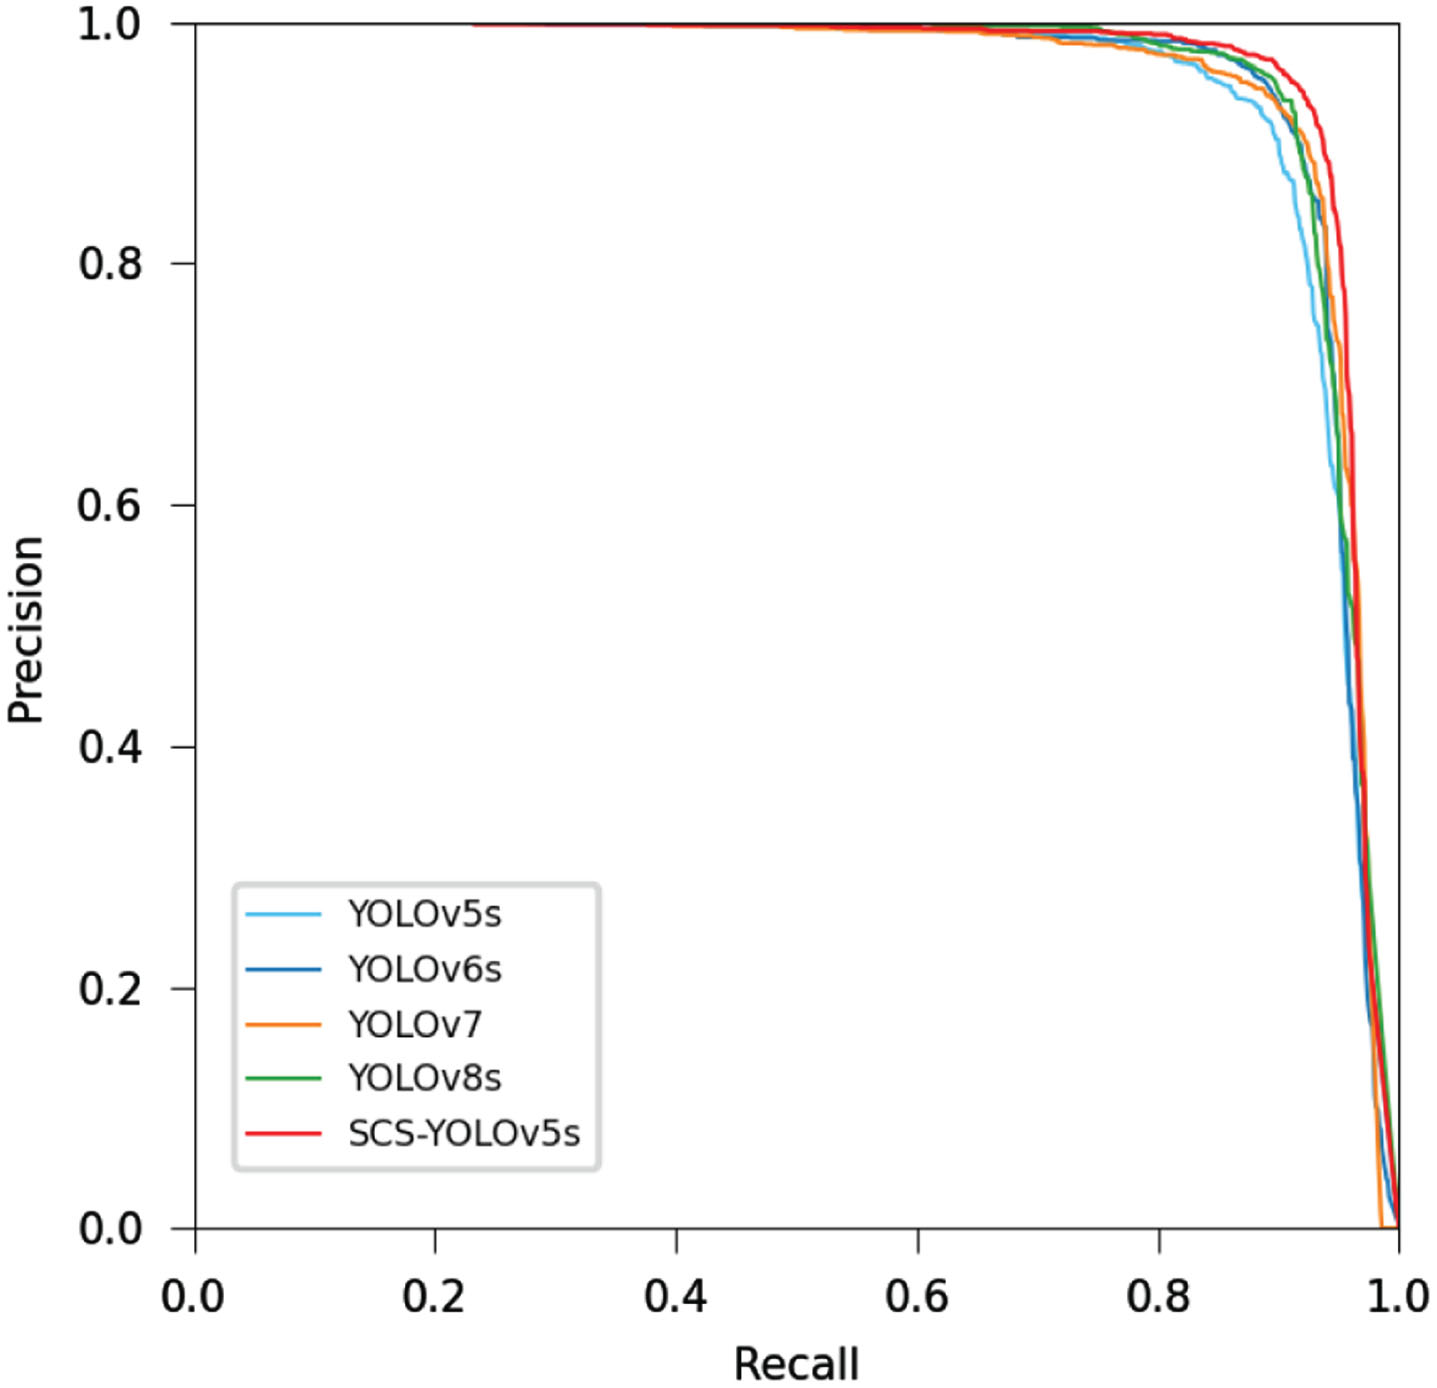
P-R curves of different YOLO models.
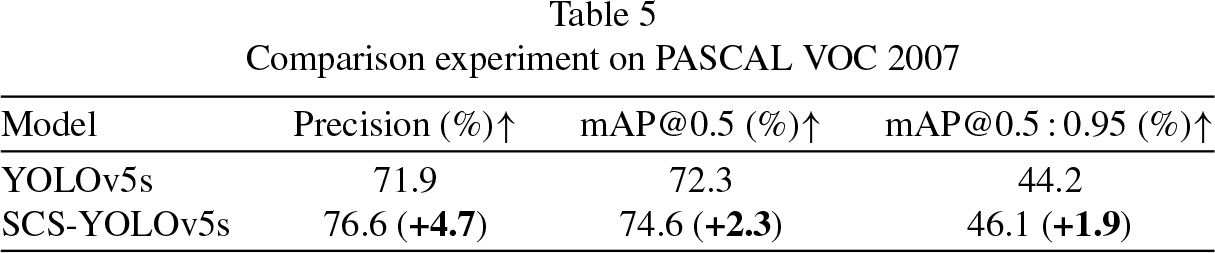
In order to verify the robustness and generalization ability of the method in this paper, a comparison experiment on the PASCAL VOC 2007 public dataset was designed, as shown in Table 5. The experimental results show that the index data of SCS-YOLOv5s model are greatly improved, among which Precision is increased by 4.7%, mAP@0.5 is increased by 2.3%, and mAP@0.5 : 0.95 is increased by 1.9% . It can be seen that as the experimental data in this paper contains numerous farming environments, the proposed method can adapt to the changes of various scenarios and has certain anti-interference ability, which not only obtains improvement in single-category detection tasks, but also performs better in multi-category detection such as VOC dataset, showing strong robustness.
Comparison experiment on PASCAL VOC 2007
Comparison experiment on PASCAL VOC 2007
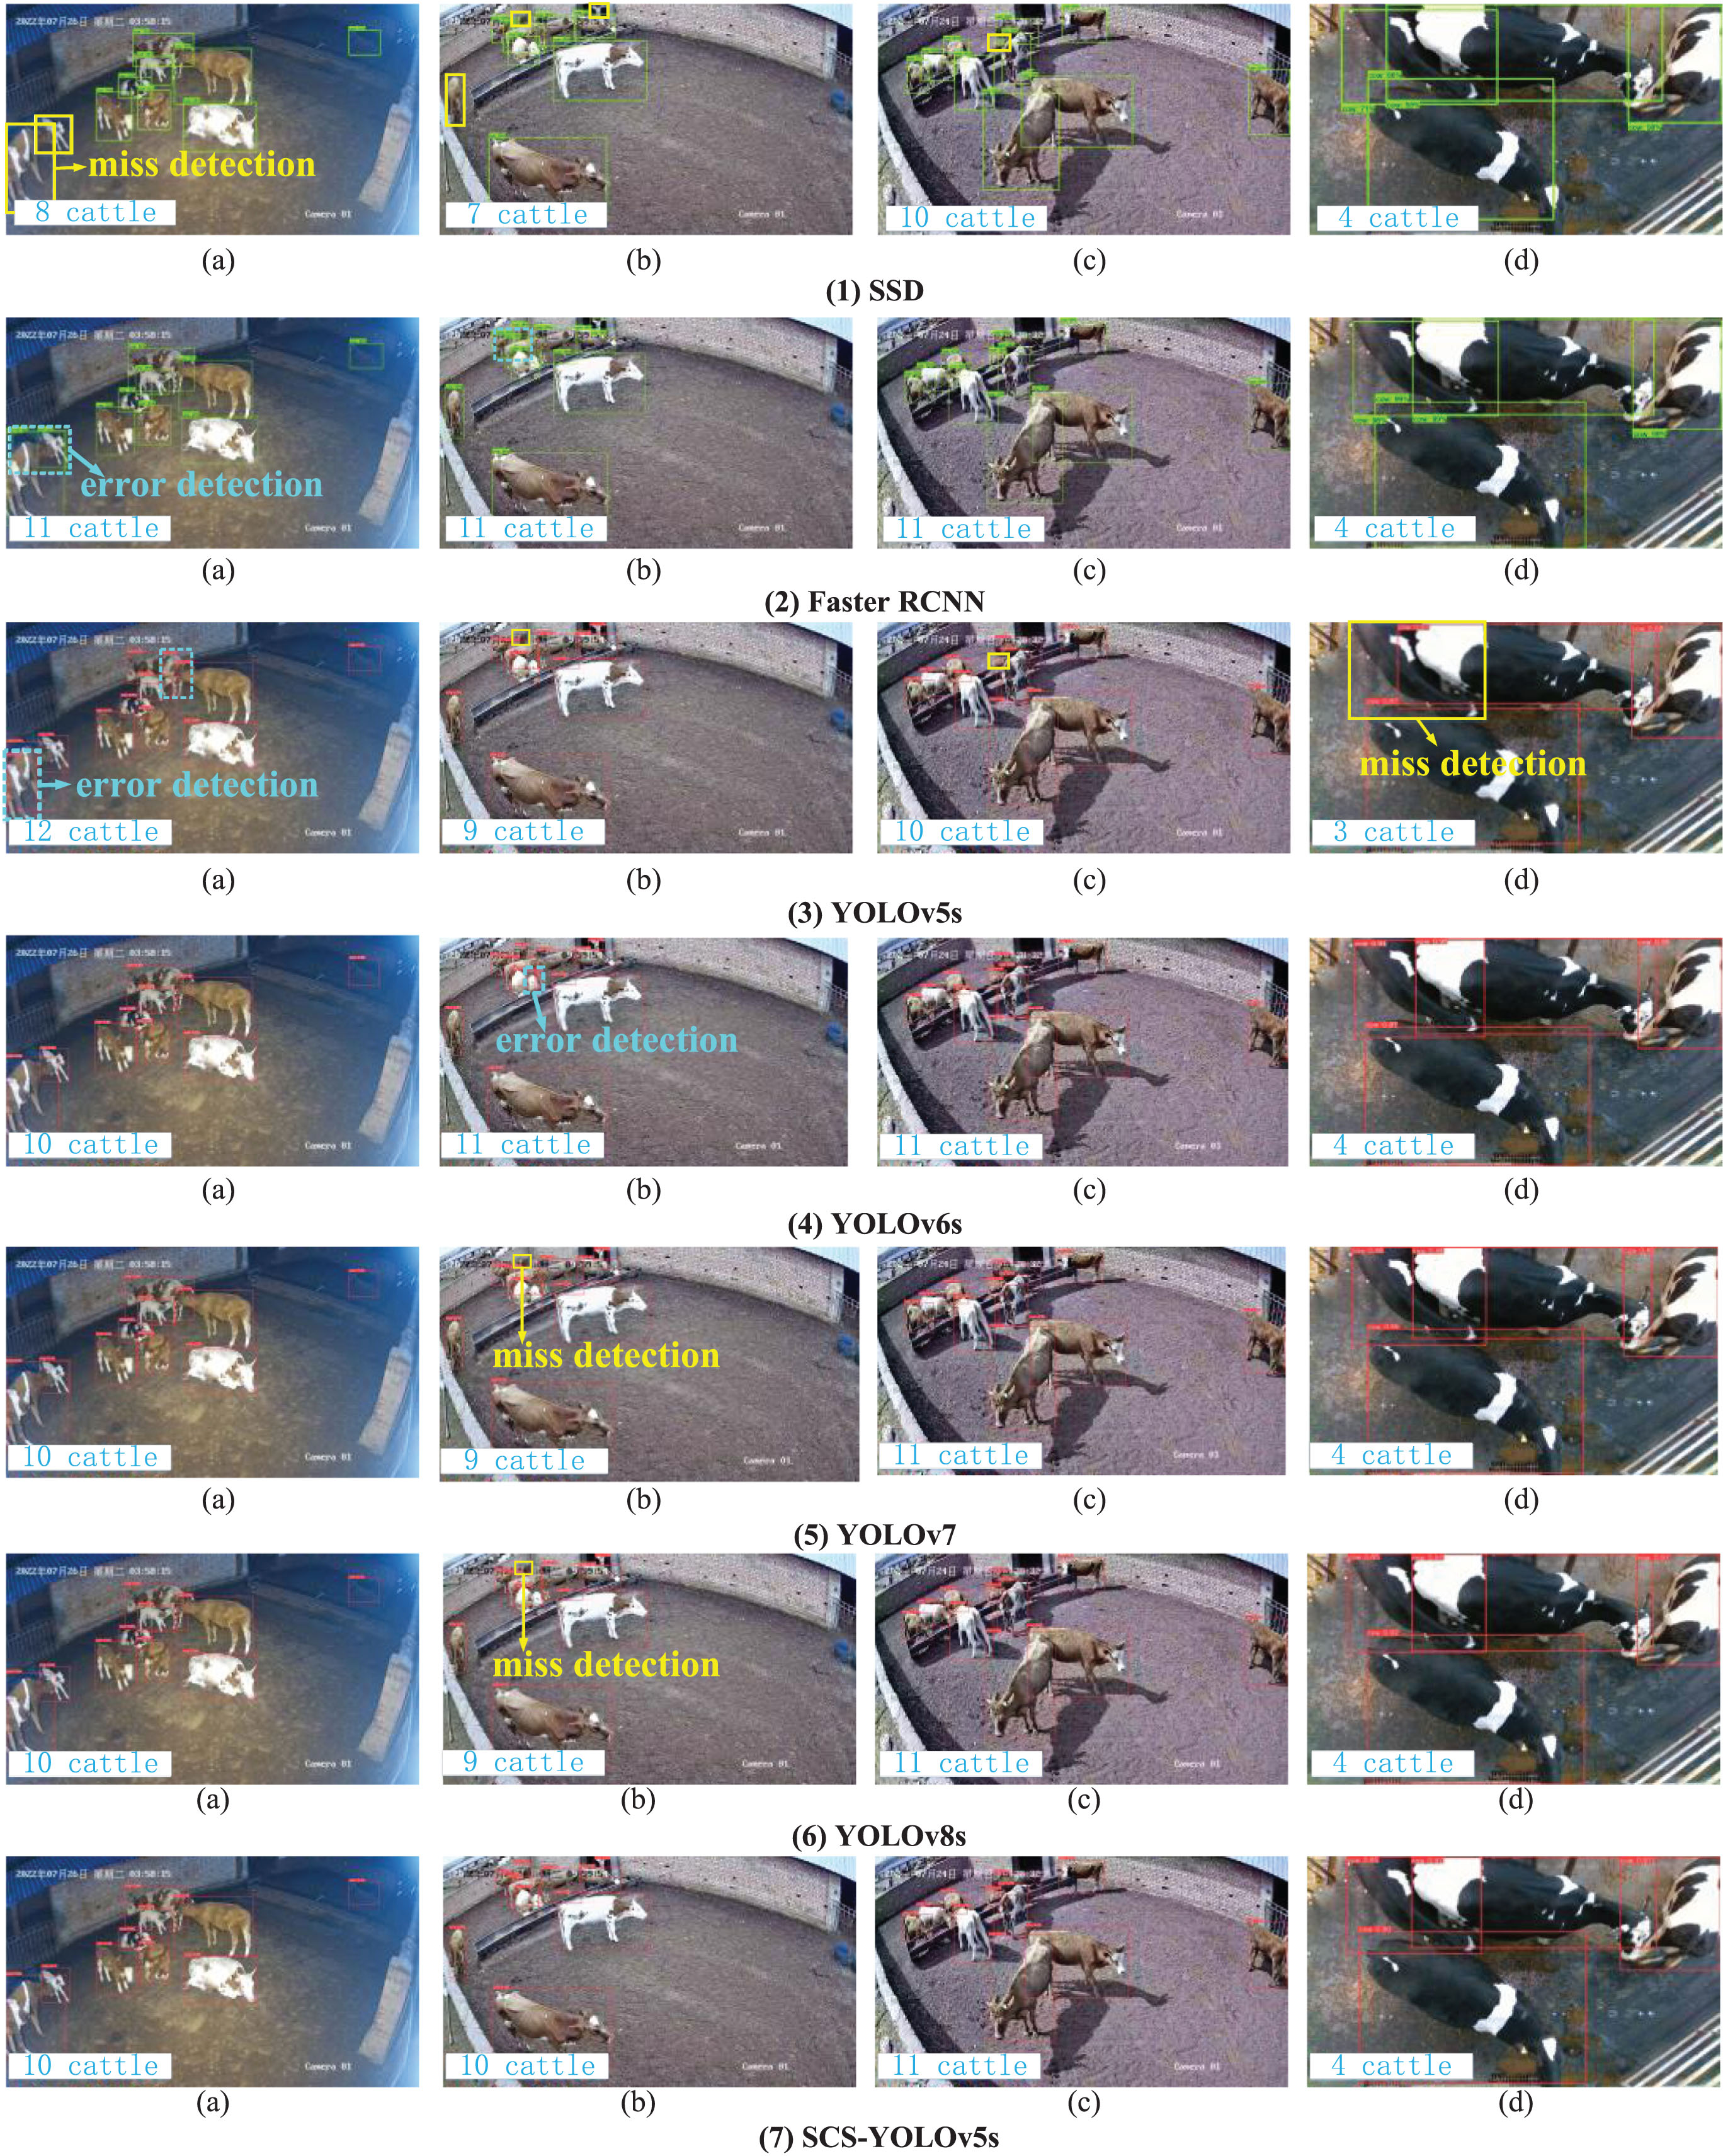
In order to demonstrate the detection and counting effect of SCS-YOLOv5 algorithm on cattle, images were randomly selected from the test set for testing, and some error detection and counting results were analyzed, as shown in Fig. 15. Among them, Fig. 15(1)–(6) are the detection effect diagram of SSD, Faster RCNN, YOLOv5s, YOLOv6s, YOLOv7 and YOLOv8s respectively, and Fig. 15(7) is the detection effect diagram of the proposed SCS-YOLOv5s.
Visualization of the test results of different model.
The yellow rectangular boxes in Fig. 15 represent missed cattle detection and the cyan dashed boxes represent false detection targets. The SSD shows more missed detections and fails to detect all cattle even without occlusion, indicating that the SSD performs poorly in object detection tasks with complex backgrounds. While the Faster RCNN, YOLOv5s and YOLOv6s all show varying degrees of false detections, mostly in areas where cattle overlap or features change significantly, and the above algorithms fail to distinguish cattle contours correctly. In addition, the YOLOv5s model has missed detections in (b)–(d). Through analysis, the location of the missed cattle in (b) is obscured by the camera text and is far away, and the ground color and fence color also interfere with the detection process. The missed detection in (c) is mainly caused by the occlusion between cattle, even if 80% of the area is occluded, SCS-YOLOv5s can still detect it. In (d), two cattle are close together and can easily be mistaken for one cattle, which the improved model can also easily detect and achieve accurate counts. Although the mAP@0.5 : 0.9 of YOLOv7 and YOLOv8s is higher than SCS-YOLOv5s, there are also missed detections, which shows that it does not show a strong competitive edge in improving the occlusion. In summary, the improved model SCS-YOLOv5s proposed in this paper achieves better results in improving the effect of occlusion and complex environment on detection results.
The method proposed in this paper achieves a large improvement in accuracy, ensures better real-time performance, and at the same time well improves the occlusion problem between cattle in complex breeding scenes with high anti-interference ability. Compared with the current mainstream object detection and counting methods, it shows strong competitiveness, provides ideas and directions for people in related research fields, and further enhances the feasibility of automatic cattle counting.
However, the method proposed in this paper also has shortcomings, for example, the model size of SCS-YOLOv5s nearly doubled, while mAP only gained a small amount of enhancement, which may be attributed to the relatively small number of farming scenarios and the small amount of data. What’s more, in the application scenario of cattle counting in the UAV field of view, which contains a large number of small object cattle individuals. Due to the limitations of the sliding window, the situation of large changes in the scale of the cattle has not been considered for the time being.
Relevant researchers can collect data from more scenes in future studies and obtain better quality datasets through image super-resolution reconstruction and more image enhancement methods to further improve the model accuracy. In addition, model pruning and knowledge distillation can greatly reduce the number of model parameters, which is a good choice for future model deployment and lightweight applications. In the future research, we will combine the multi-object-tracking algorithm and the Re-Identification framework to further optimize the model performance and improve the accuracy and application scope of cattle counting. Of course, cattle detection and counting based on UAV scenarios is another focus of the work, and automatic counting of sheep and pigs will also be involved.
Declaration of competing interest
The authors declare that they have no known competing financial interests or personal relationships that could have appeared to influence the work reported in this paper.
Footnotes
Acknowledgments
This research was funded by the National Natural Science Foundation of China under Grant 61966026. The authors appreciate the funding organization for their financial supports.