
Abstract
The quantification of the interplay between student behavior data and classroom teaching effectiveness using quantitative metrics has perennially posed a challenge in the evaluation of classroom instruction. Classroom activity serves as a reflection of student engagement, emotional ambiance, and other pertinent aspects during the pedagogical process. This article presents a methodology for quantifying student head posture during classroom instruction utilizing AI-driven video analysis technology, notably the Classroom Activity Index (CAI). A Classroom Activity Analysis System (CAAS) was designed and developed, integrating a multi-scale classification network based on ECA-ResNet50 and ECA-ResNet18. This network discerns and categorizes various head regions of students situated in both the frontal and real rows of a lecture-style classroom, irrespective of their dimensions. The classification network attains exceptional performance, boasting F1 score of 0.91 and 0.92 for student head-up and head-nodding. Drawing on the live classroom instruction at a higher vocational college in Wuhan, Hubei Province, China, a comparative experiment was executed. The findings revealed that three factors: teacher-student verbal interaction, teacher body language, and utilization of digital resource, all exert an influence on CAI. Simultaneously, the degree of classroom activity as gauged by FIAS and manual analysis fundamentally aligns with the CAI indicators quantified by CAAS, validating the efficacy of CAI in the quantification of classroom activity. Consequently, the incorporation of CAAS in teaching, research, and oversight scenarios can augment the precision and scientific rigor of classroom teaching assessment.
Keywords
Introduction
The emergence of artificial intelligence (AI) technology has revolutionized the field of educational evaluation [12]. Utilizing neural networks and video analysis, these technologies can intelligently collect behavioral data from learners during the teaching process, such as head posture, body posture, and trajectory [8]. By matching, analyzing, and processing this data, student behaviors such as raising hands, speaking up, and asking questions can be further analyzed to evaluate classroom activity [5]. The evaluation of classroom activity is a critical indicator of the learning process [40], encompassing numerous abstract and challenging-to-quantify factors, such as cognitive input, behavioral input (related to learner roles, participation, and interaction), and emotional input (including learner interest and learning style) [2, 52]. Many of these factors are implicit states of learners, and it is often difficult to utilize them directly for evaluating classroom activity [4].
There are several direct and indirect factors that can impact classroom participation during teaching, including learning materials, teacher-student interaction, student attitudes toward learning, changes in teacher demeanor, and digital environmental factors [10, 52]. While Mehta et al. evaluated classroom activity by recognizing facial and head postures to determine whether students were paying attention, they did not extensively explore the connection between sound, posture, physiological signals, and classroom activity [26]. Hence this study proposes a CAI and develops a Classroom Activity Analysis System (CAAS) employing a multi-scale head posture classification to extract head-up and nodding indicators for quantifying and evaluating classroom participation. To verify the effectiveness of CAI in determining classroom activity, we selected the “Sensory Deprivation Experiment” from the course “Child Psychology Development” at a vocational college in Wuhan, Hubei Province, China, as our case study. We selected differences in classroom activity between two teachers and utilized Flanders Interaction Analysis System (FIAS) to analyze teacher-student speech interaction, body language, and the use of digital resources in these segments to confirm the reliability of our classroom activity data platform.
Through the use of CAI in data analysis, our study helps foster a framework for interpreting classroom behavioral data, promoting the deep integration of technology and teaching.
Related literature
The literature review for this study is bifurcated into two sections. Initially, we reviewed the literature on classroom activity utilizing video analysis technology, followed by studying specific research related to factors that impact classroom activity and are pertinent to this study.
Classroom activity through video analysis
Classroom activity is a vital dimension in evaluating the effectiveness of classroom teaching, reflecting important information such as teacher-student classroom interaction, student participation, and emotional atmosphere during the teaching process. FIAS is a typical quantitative tool utilized for analyzing classroom interactive behavior and obtaining valuable reference data on detailed classroom activity for teaching researchers [7]. However, the process of data collection and analysis requires a significant amount of time and manpower, making it challenging to apply in large-scale, rapid classroom evaluations. AI technology has been extensively employed in various domains, such as image classification [34] and bioinformatics [35]. The utilization of AI-driven intelligent video analysis facilitates the rapid detection of students’ behavioral states in the classroom [31]. For instance, Prieto et al. employed video analysis technology to track and identify face detection and posture movements, constructing a predictive model for assessing classroom activity levels [30]. However, due to the close correlation between students’ head posture and body movements, the computational complexity of the predictive model is high, leading to low evaluation accuracy. Head-up and nodding are common head posture changes that students exhibit during classroom teaching, which can intuitively reflect evaluations of teachers’ knowledge explanation and analysis abilities, as well as self-identity, feedback, and understanding levels [44]. These changes can effectively reflect the engagement and participation of the learning object [23]. AI video analysis techniques, utilizing advanced deep learning algorithms like VGG and ECA-Net, enable the categorization of students’ head postures when lifting and nodding, thereby offering valuable insights for assessing classroom engagement. In comparison to other networks within the ResNet series, ECA-Net, with its channel attention mechanism, demonstrates superiority in both classification accuracy and model parameter efficiency at the same network depth. Researchers have previously leveraged AI video analysis technology to detect students’ head-up movements, providing valuable clues for evaluating classroom activity via head-up and nodding [17]. However, the study did not provide a systematic quantification index for classroom activity.
This paper proposes utilizing AI video analysis technology to extract and quantify students’ head posture changes of head-up and nodding in classroom teaching videos. We propose the CAI, which quantifies the frequency of students’ head-up and nodding per minute. This index provides a new quantification path for data-driven classroom activity evaluation.
Factors affecting classroom activity
The Three Elements of Classroom Teaching comprise Teachers, Students, and Teaching Environment [42]. Sadikov asserted that teachers play a pivotal role in the classroom, and their influence on classroom teaching is reflected in their ability to motivate students’ learning [36]. Grant & Ray have proposed that teachers should place greater emphasis on fostering student engagement and encouraging active participation in teaching [14]. Wilen has suggested that a teacher’s nonverbal cues, such as body posture and movements, can substantially impact classroom teaching effectiveness [43]. This section explores the factors that influence classroom activity through three key aspects: teacher-student verbal interaction, teacher’s body language, and the application of digital resources.
Verbal interaction between teachers and students
Verbal interaction between educators and learners refers to the exchange of thoughts and emotions through language within the context of classroom teaching. This exchange of communication accentuates the teacher-student interaction and flow state, which pervades throughout the entire class and directly impacts the quality and effectiveness of classroom teaching [38]. FIAS can be leveraged to observe and analyze the verbal dynamics between teachers and students in the classroom. Verbal interactions are classified every three seconds into ten types of behaviors, including teacher language (such as accepting emotions, encouraging praise, accepting opinions, questioning, teaching, instructing, criticizing, or maintaining the teacher’s authority), student language (including passive responses, active expressions, or questions), and quiet or chaotic behavior. By coding teacher and student language through classroom videos, the ratio analysis method can be used to compute the percentage of teacher and student speech, the proportion of teacher instruction and student active speaking, and the proportion of quiet or chaotic behavior. The matrix analysis method can also be employed to analyze the characteristics of classroom language structure, questioning, emotional atmosphere, and teacher style. Verbal interaction between teachers and students represents one of the main factors for gauging classroom activity [27]. For instance, real-time and effective classroom questioning during the teaching process can augment positive interaction between teachers and students, stimulate learners’ curiosity and desire for exploration, and encourage them to raise their hand and express their opinions [18]. A positive and pleasant classroom emotional atmosphere can mobilize and maintain students’ learning initiative, enhance their sense of participation, and encourage them to nod and respond actively to their teachers [32]. Conversely, a lecturing and directive teacher approach can reduce the frequency of interaction between educators and learners. Harsh and frequent directive language used by teachers may dampen students’ learning enthusiasm and trigger negative reactions, causing them to keep their heads down [24]. In summary, verbal interaction between teachers and students, such as classroom questioning, classroom emotional atmosphere, and teacher style, can influence students’ engagement and receptivity. Therefore, the following hypothesis is put forward:
H1: Verbal interaction between teachers and students (classroom questioning, classroom emotional atmosphere, and teacher style) can affect CAI.
Teacher’s body language
Teacher’s body language pertains to the nonverbal cues utilized by educators to convey information, express emotions, and demonstrate attitudes towards students during the teaching process. It represents a crucial means for teachers to impart educational content and orchestrate classroom activities [37]. Through the judicious use of appropriate body language, educators can attract students’ attention, kindle their learning motivation, and enhance the efficacy of classroom teaching [3]. Referring to Ekman’s classification framework for body language [9], the teachers’ body language during teaching activities can be categorized into five distinct types: routine, descriptive, directive, peripatetic, and instrumental, as outlined in Table 1, which delineates the unique features of each body language category and its impact on students.
Main postural characteristics of teachers
Main postural characteristics of teachers
Routine body language is characterized by limited dynamism and consequently results in comparatively minor visual stimulation [25], which has a marginal effect on students’ Head-up Rate (HUR) and Head-nodding Rate (HNR). In contrast, descriptive and directive body language pertains to the strategic use of hand gestures by teachers to steer students’ attention towards specific subject matter, convey fundamental information not explicitly covered in speech, assist in elucidating educational content, and improve students’ perception of knowledge [16]. For instance, educators may utilize their fingers to highlight crucial points on the PPT or indicate a particular student for explanation purposes. Both forms of body language can direct students’ visual attention, prompting them to follow the teacher’s hand movements or focus their gaze on particular information, ultimately enhancing classroom HUR [29].
Peripatetic body language involves teachers monitoring and guiding students’ learning activities by walking around the classroom, leading to closer proximity between teachers and students. Once students perceive that a teacher is monitoring their learning status and progress, they will consciously regulate their own learning behavior [33]. Students will watch the teacher’s movements and obey instructions to complete learning tasks. In contrast, if a teacher lacks adequate surveillance and remains confined to the podium, there will be a constant spatial separation between the teacher and students, resulting in a psychological barrier between them [15]. This diminishes motivation to follow the teacher’s thought process and engage in learning activities, making students susceptible to distractions.
Instrumental body language entails teachers utilizing various teaching aids and tools to coordinate with teaching activities, such as playing videos to illustrate experimental processes, or jotting down course notes on the blackboard. This form of body language can significantly stimulate students’ interest and curiosity, boosting the likelihood of them watching videos or taking note of lectures [11]. In summary, teachers’ use of descriptive, directive, peripatetic, and instrumental body language can influence students’ Head-up and Head-nodding Rates. Therefore, we propose the following hypothesis:
H2: Teacher body language (i.e., descriptive, directive, peripatetic, and instrumental) has an impact on CAI.
Digital resources encompass teaching materials that have been processed digitally and stored as symbolic language including text, imagery, audio, and video. They may be utilized and disseminated in an information environment, and possess qualities of intellect, interactivity, and scalability. These resources generally fall into three major categories, namely multimedia teaching software, networked teaching resources, and course material libraries [13]. Teachers’ discerning and skilled employment of digital resources may elevate classroom interactivity, deliver diverse and profound learning experiences to students, and optimize teaching efficiency [45].
For instance, teachers can craft vivid and engaging situational environments with the help of networked teaching resources such as images and videos that align with the teaching content, thereby enlivening dull and tedious information to a lively, intuitive, and three-dimensional platform. This approach stimulates the senses, such as vision and hearing [22], captivating students’ attention, promoting a quest for new knowledge, and fostering the creation of knowledge nodes [6]. During the teaching process, teachers have access to several multimedia teaching software functionalities, including resource calling, activity publishing, screen projection interaction, and learning situation statistics functions [20, 50]. These capabilities enable teachers to push learning tasks, resources, and classroom assignments in real-time, organize diverse learning activities that encourage autonomous exploration, collaborative communication, and interactive discussion, inspire students’ enthusiasm for learning, enhance student participation and teacher-student interaction rates, and facilitate student nodding interaction, leading to resolution of complex learning challenges [46, 51].
In summary, the implementation of digital resources such as networked teaching resources and multimedia teaching software may also affect students’ Head-up and Head-nodding Rates, thus we propose the following hypothesis:
H3: The use of digital resources (including networked teaching resources, multimedia teaching software, and so on) may impact CAI.
Design and Implementation of CAAS
CAAS is constructed in accordance with the cloud-edge-device collaborative architecture and employs deep learning neural network models to carry out video image collection, processing, and analysis at the classroom terminal. The resulting activity analysis findings are stored in the cloud. The classroom terminal leverages edge computing technology to handle video data recorded by broadcasting equipment, while employing deep learning techniques to discern and identify students’ head postures during instruction, thereby obtaining crucial activity indicators reflective of classroom participation.
System design
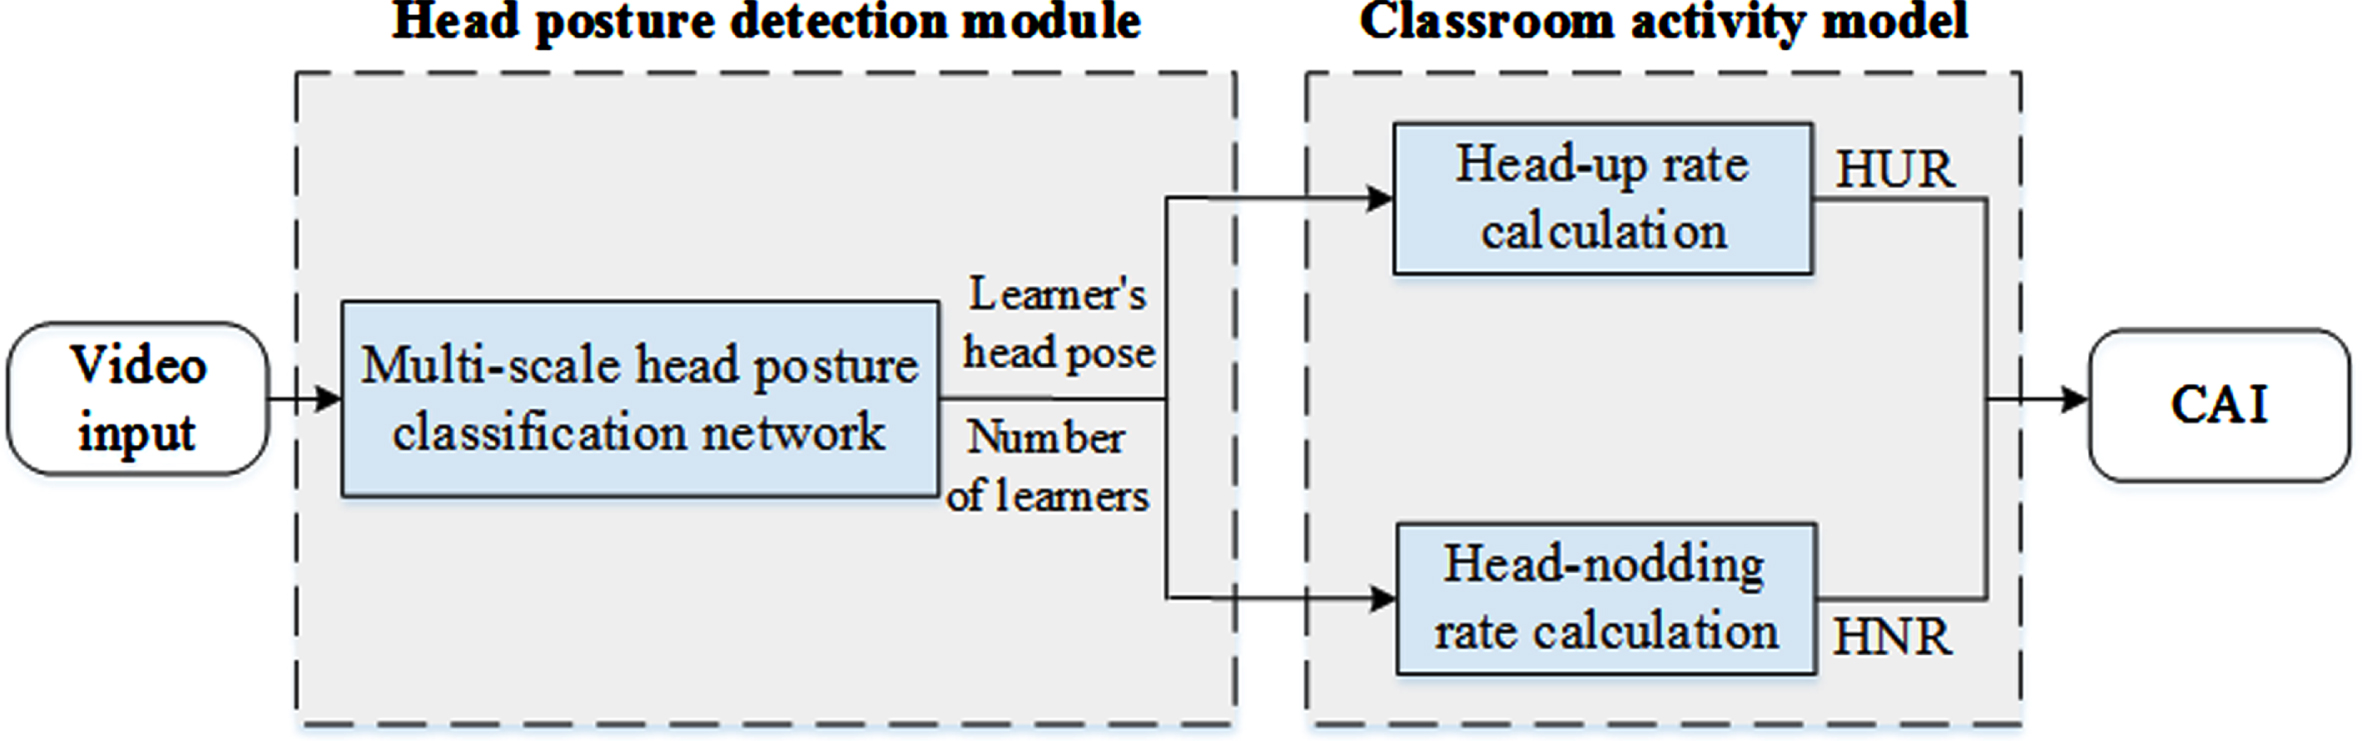
CAAS consists primarily of two essential modules, namely the head posture detection module and the classroom activity model construction module, which are presented in Fig. 1. The head posture detection module scrutinizes classroom video inputs and surveys the number of students and their respective head postures. Conversely, the classroom activity model construction module calculates the HUR and HNR displayed by learners during classroom instruction to produce a comprehensive assessment of CAI. In executing these tasks, CAAS relies on the Python 3.11 version together with ubiquitous Python libraries and tools such as numpy, scikit-learn, and matplotlib to undertake critical preprocessing, visualization, and model evaluation functions. Furthermore, owing to its popularity and efficiency, the deep learning framework TensorFlow2.11 is utilized in neural network training, optimization, and deployment tasks. To guarantee the reliability and stability of system development, we make use of the Jenkins automation tool, coupled with a robust testing framework.
CAAS framework.
The system adopts a comprehensive cloud-edge-device collaborative architecture, with edge servers deployed within educational institutions to capture classroom video data and intelligently recognize and analyze students’ head postures. The cloud platform is responsible for anonymizing and statistically analyzing classroom engagement indicators. Cameras within the classroom facilitate video capture. Edge servers, utilizing the ARM platform, conduct AI video analysis, while cloud platform employs web technologies. Figure 2 illustrates the operational interface of the CAAS, enabling real-time aggregation, presentation, and analysis of student behavioral data. It is noteworthy that the edge side of CAAS utilizes homomorphic encryption learning algorithms to analyze student behavioral data, ensuring the confidentiality of sensitive information such as facial recognition and classroom conduct.

CAAS Interface.
The CAAS, developed and maintained by the National Engineering Research Center for E-Learning (NERCEL), has been deployed in multiple schools for classroom observations and teaching supervision. In this study, a representative school was selected to validate the systematic performance and applicability of CAAS, conducting an in-depth analysis of its effectiveness in real teaching scenarios.
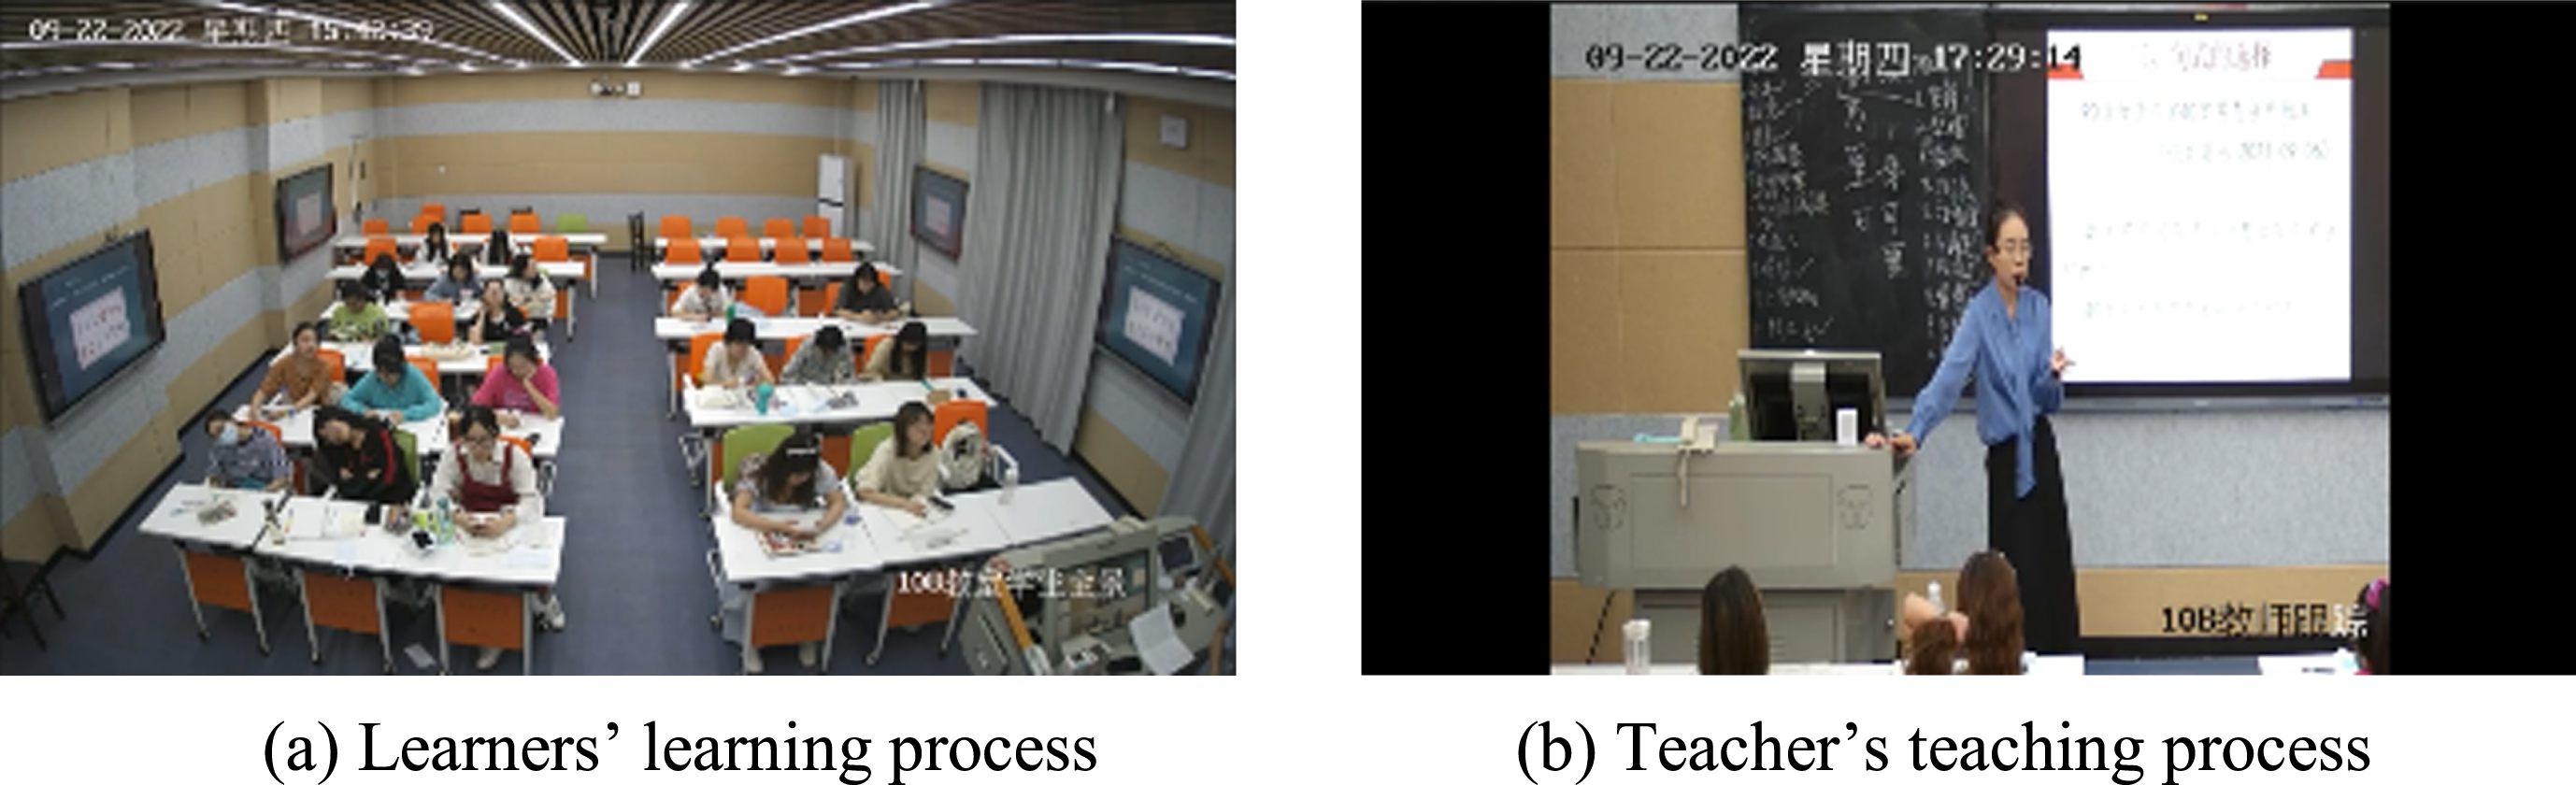
The classroom is equipped with monitoring cameras installed at both the front and rear. A camera mounted above the electronic whiteboard at the front end of the room captures and records students’ educational endeavors during the course of the class, while a monitoring camera situated at the back records the teacher’s pedagogical techniques and employs a set of hanging microphones to capture the teacher’s vocalizations within the classroom. The use of a video frame alignment algorithm effectively offsets the synchronization delay that might arise from different video sources. Additionally, a screen capture plugin is integrated into the classroom’s host computer, which enables the teacher’s teaching courseware to be recorded at a rate of one frame per minute. Figure 3 presents an overview of the learner’s learning process, the teacher’s educational delivery, as well as screen captures of the teacher’s computer that were fashioned during class.
Classroom screen capture.
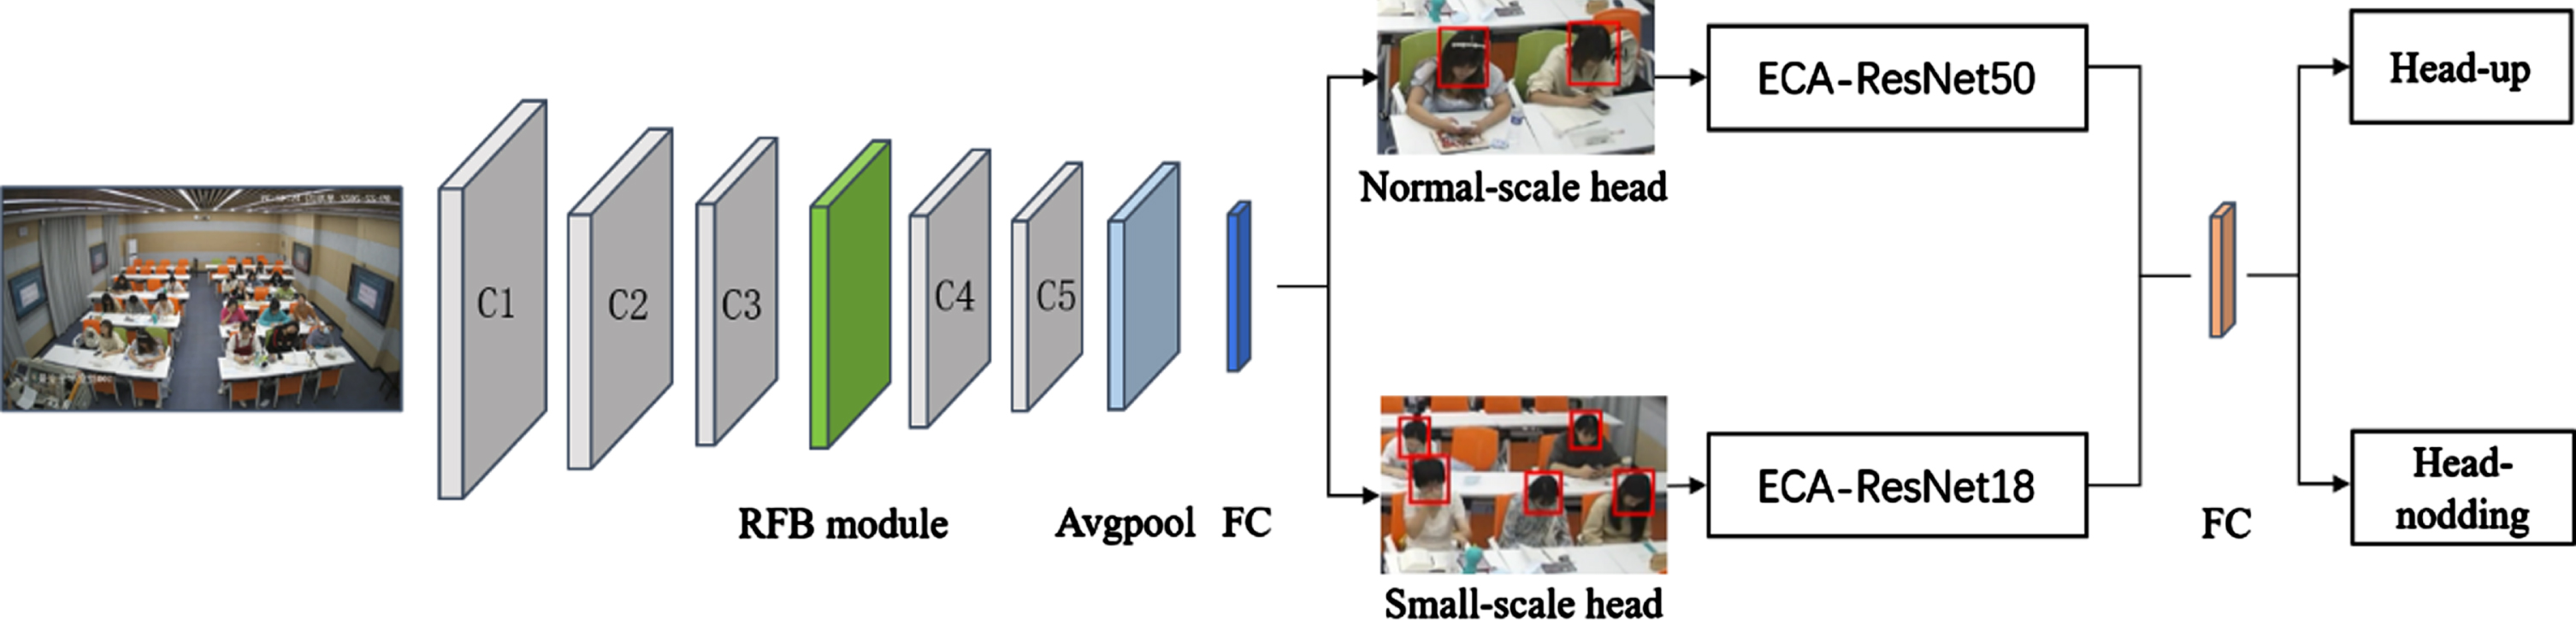
This module employs object detection algorithms to determine the position of students’ heads within the video image and then determines the learners’ head posture through construction of a classification network. The object detection algorithm is composed of six downsampling modules, each containing a distinctive convolutional neural network - C1 through C2. These networks are characterized by their unique kernel sizes and, in conjunction with the additional downsampling layer (Extra Layer), form an effective framework for object detection. Given the “near large and far small” characteristics of video perspective imaging, the learners seated in the front and back rows of the video have different sizes, and therefore require different scales to locate their heads within the image. To accurately capture the learners’ heads within the image, an RFB module [21] is added between C3 and C4 to fuse head features of diverse scales. The total number of detected learners equals the entire class size. In lecture-style classrooms, there is a notable disparity in the size of students’ heads in the video images due to the depth of field [39]. This study defines small-scale head images as regions with dimensions less than 30, and normal-scale head images as regions with dimensions greater than 30. ECA-ResNet50 and ECA-ResNet18 are utilized to extract head posture features for both normal-scale and small-scale head images, enabling the construction of a multi-scale classification network. for head-up and head-nodding demonstrate high levels of accuracy. In the context of raising head posture, the multi-scale classification network achieved precision, recall, and F1 score of 0.92, 0.90, and 0.91, respectively. For the lowering head posture, their precision, recall, and balanced F1 score were 0.91, 0.94, and 0.92, respectively.
Calculation of CAI
Based on the processing steps shown in Fig. 4, the study extracts head-up and head-nodding postures from lecture-style classrooms, calculates the HUR and HNR, and derives the CAI, which serves as a reflection of the degree of student participation and activity in the classroom. In a vibrant classroom atmosphere, the frequency of changes in head posture is positively associated with the students’ excitement level [19]. As students closely align themselves with the rhythm of the teaching, their interaction with course materials and notes intensifies, thereby augmenting the frequency of changes in head posture. and subsequently resulting in a higher CAI. Conversely, when a majority of students remain bowed or do not engage in interactive activities, both HUR and the CAI will diminish. Even in the absence of course materials and note-taking, as long as students are attentively listening, the CAI can still be maintained at a certain level, significantly higher than that in a state of prolonged downward gaze.
Overall framework of the multi-scale head posture classification network.
HUR, which measures the attentive response of learners to the teacher’s instructional behavior, refers to the ratio between the number of individuals who raise their heads to gaze upon the teaching content or the teacher’s explanation and the total number of individuals present within the classroom at any given moment. Meanwhile, HNR, which serves to showcase the degree of learners’ engagement and enthusiasm, refers to the ratio between the number of individuals nodding in affirmation and the total number of individuals present within the classroom at any given moment.
Equation (1) illustrates the calculation of HUR:
In which,
The calculation of HNR is shown in Equation (2):
In which,
The calculation of CAI is shown in Equation (3),
CAIT represents the classroom activity index during time period T.
Research object
The student participants in this study were randomly chosen from two second-year classes of pre-school education majors at a higher vocational college located in Wuhan, Hubei Province. The students’ gender ratio, age, and other distinguishing characteristics were essentially identical between both classes. Meanwhile, the teacher participants included Teacher A, possessing four years of teaching experience, and Teacher B, possessing thirteen years of teaching experience. Both teachers were female and conducted instructional activities within their respective courses. This research diligently upholds ethical guidelines and regulations, ensuring data security and student privacy protection through the cloud-edge-device collaborative architecture of CAAS. Additionally, explicit consent is obtained from students and parents prior to the commencement of the experiment, ensuring their understanding and voluntary participation.
Research process
This study verified the effectiveness of CAI through a comparative experiment, as shown in Fig. 5.
Initially, two classes consisting of second-year pre-school education majors were discerningly chosen. Student participants underwent a pre-test of their learning levels consisting of fifteen questions, including ten multiple-choice and five fill-in-the-blank queries that reflected an extensive breadth of developmental psychology principles pertinent to preschool children. This was thoroughly revised several times by the research group. The test totaled 150 points. One-way ANOVA analysis was carried out, yielding results indicating p = 0.569 > 0.01, thereby establishing no significant disparity in learning levels between both student groups. Consequently, they were deemed homogeneous teaching cohorts, thus eliminating any potentially confounding effects on analyses of classroom activity levels due to disparate student learning levels.

Experimental process.
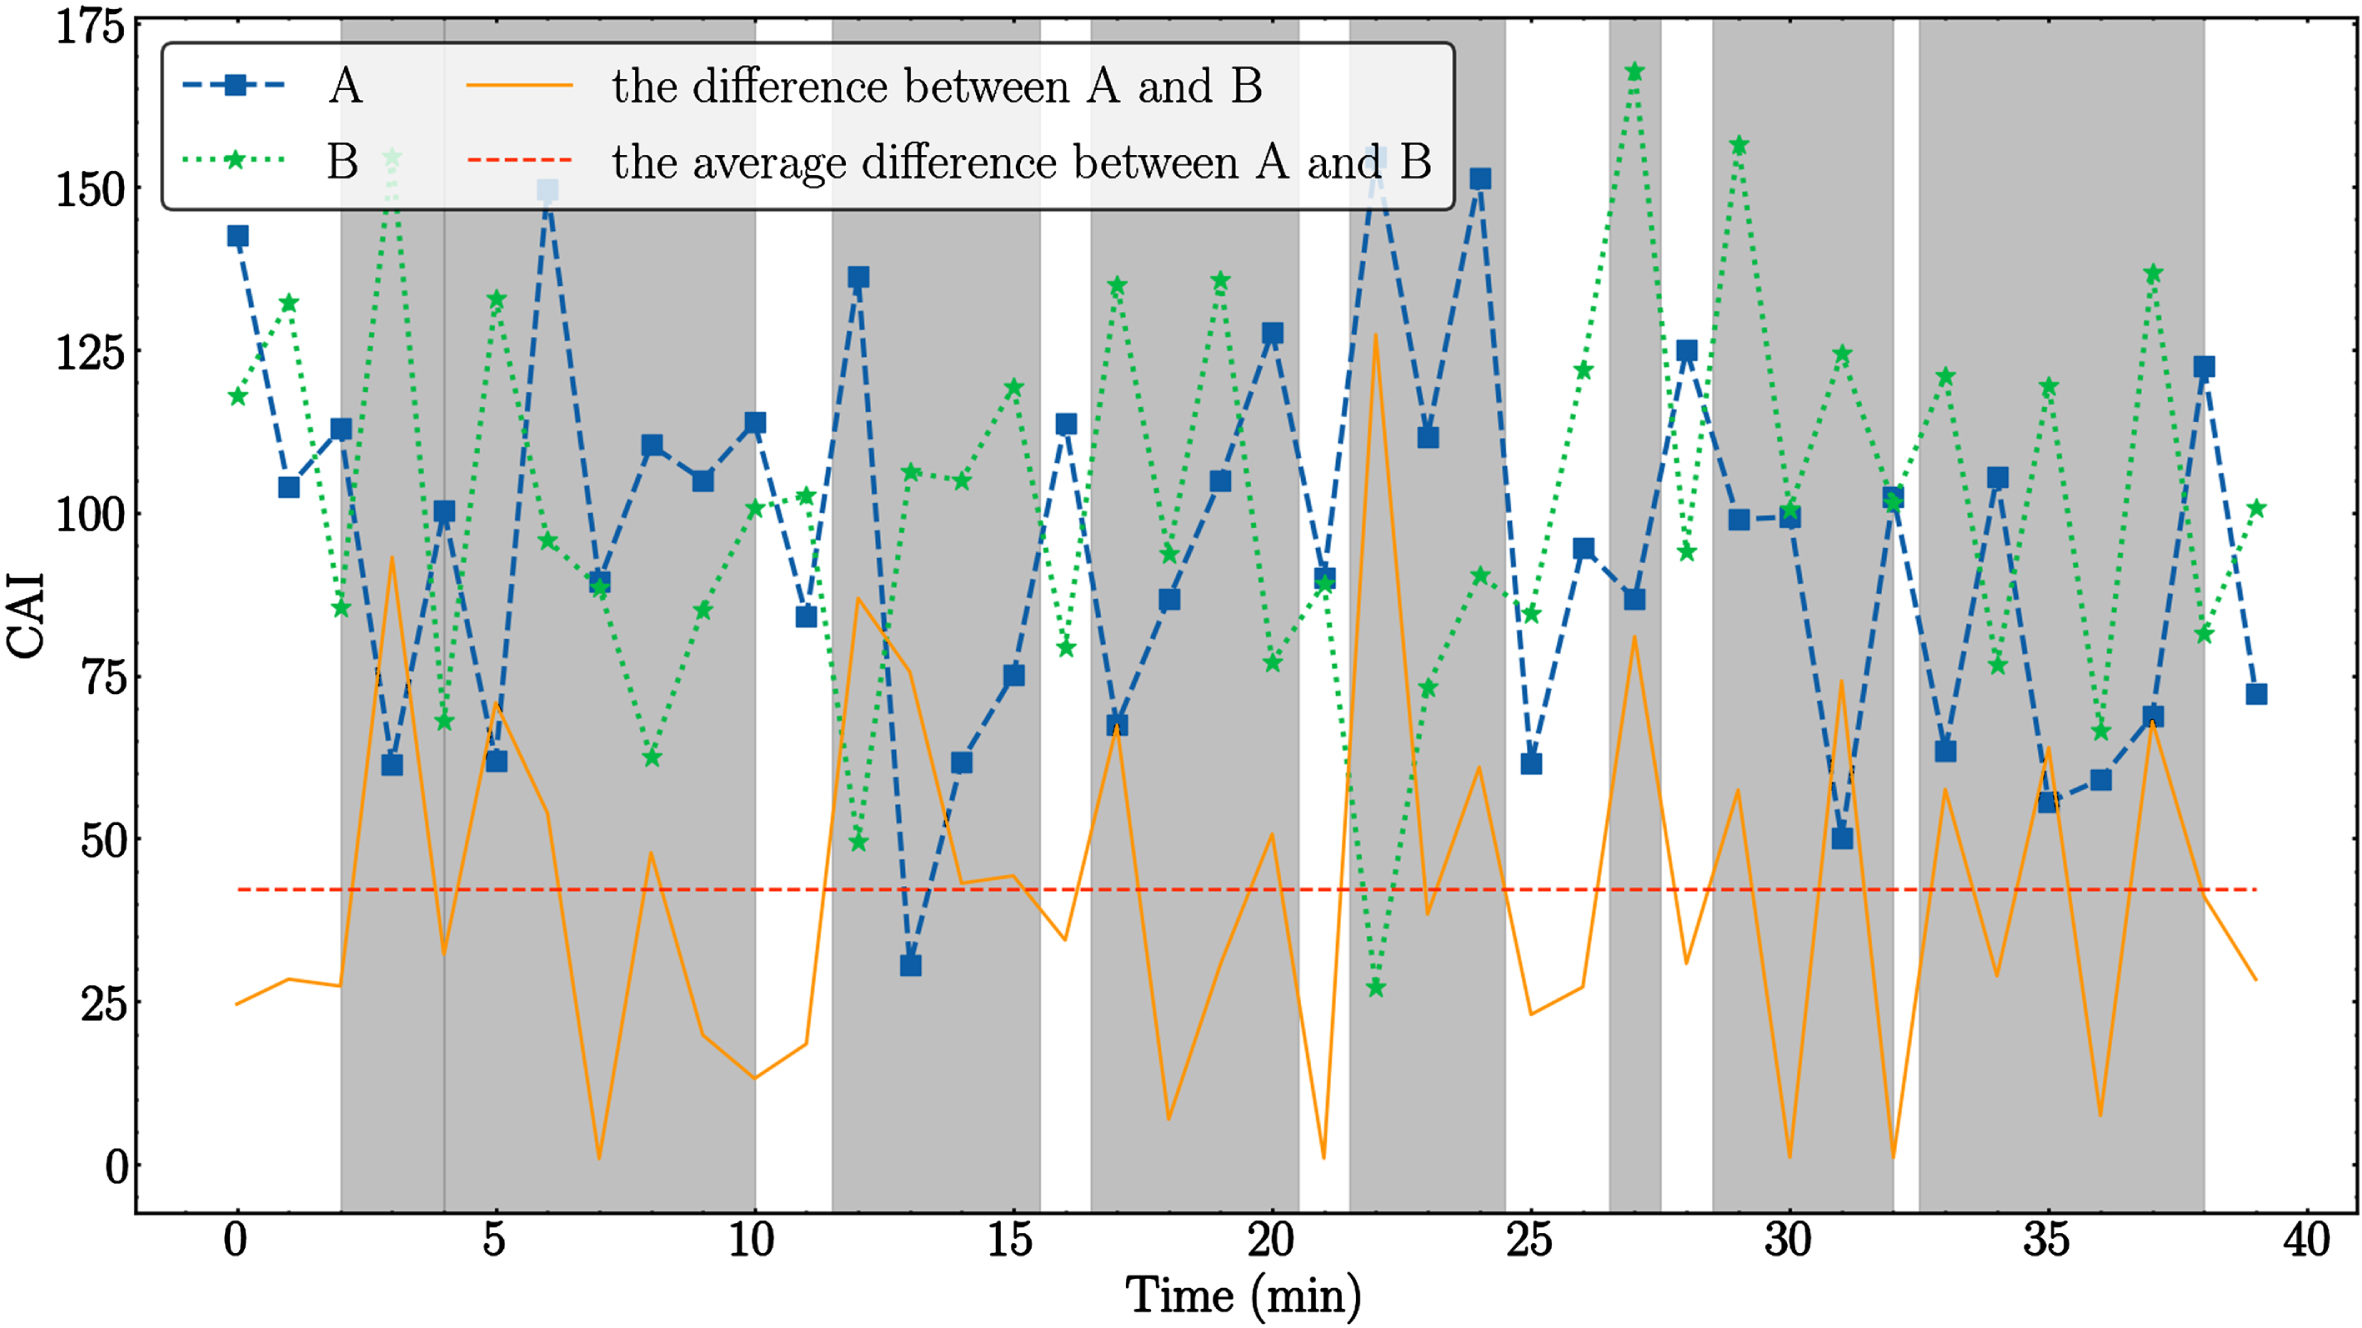
Next, the fourth chapter of “Psychological Development of Preschool Children” which pertains to the “sensory deprivation experiment” content, was taught by two teachers in their respective classes under identical conditions. The entire teaching process was recorded using video and subsequently, CAAS, developed in this study, was utilized to analyze student classroom behavior during both lessons. HUR and HNR, reflecting students’ attentive and participatory response respectively, were extracted and incorporated into a CAI curve manifested as Fig. 6. Finally, by scrutinizing and selecting time intervals with the largest differences between the CAI curves of the two teachers, FIAS and manual analysis were employed to validate the efficacy of CAI through analyzing teacher-student speech interaction, teacher’s body language, and digital resource application during these intervals. To ensure coding consistency, four researchers conducted the FIAS coding process, resulting in a Kappa test coefficient exceeding 0.75, signifying admirable coding consistency.
CAI curve.
Analysis of CAI
By extrapolating the difference curve of the CAI from CAAS as illustrated in Fig. 6, it is apparent that no significant pattern emerges from the overall CAI fluctuation of both classes. Nevertheless, the local CAI difference fluctuation is quite prominent.
Analysis of teacher-student classroom behavior
To investigate the reliability of CAAS detection outcomes, the researchers computed the mean absolute value of the CAI difference between teacher A and B at each moment during the teaching process (represented by the dashed line in Fig. 6). Subsequently, time intervals with considerable differences exceeding the mean were identified as significant differential intervals. Table 2 delineates that eight such time intervals were discovered with marked CAI disparities. The classroom teaching scenario within these intervals was manually examined to corroborate whether CAI genuinely reflects the students’ classroom activity level.
Significant difference time intervals of CAI
Significant difference time intervals of CAI
4.3.2.1 Comparison of teacher-student verbal interaction. Leveraging FIAS analysis to scrutinize the teacher-student verbal interaction during the eight significant differential time intervals of CAI, and amalgamating manual observation and analysis of the teacher’s body language and digital resource applications, we selected a time interval where no marked difference was discerned in the teacher’s body language or digital resource application. This was carried out to evaluate the impact of teacher-student verbal interaction on the CAI interval and to determine whether the CAI exported by CAAS reflects the authentic classroom teaching situation. Using the FIAS to code the teacher-student language in terms of classroom questioning, emotional atmosphere, and teacher style, we meticulously documented the corresponding codes to generate a 10*10 matrix (See Annex 1 and 2). Based on the values of the rows and columns in the matrix, we calculated various parameters such as the frequency of classroom questioning, the frequency of positive and negative integration grids, as well as the ratio of indirect to direct influence using the formula outlined in Table 3. This was done to ascertain the classroom activity level.
Calculation of behavioral variables based on FIAS
Table 4 presents a comparative analysis of teacher-student verbal interactions across intervals marked by significant differences in CAI. Of the four intervals, both Teacher A and Teacher B abstained from using descriptive, directive, or peripatetic body language. Instead, they employed instrumental body language (such as operating PPT on the podium) and relied on multimedia courseware’s text and pictures to elucidate teaching content. No notable contrast surfaced between the two teachers in terms of body language and digital resource application. However, Teacher B exhibited marked dissimilarities from Teacher A in the dimensions of classroom emotional atmosphere. These differences encompassed the frequency of questioning, positive and negative integration grid frequency, as well as the ratio of indirect to direct influence. This indicates that Teacher B is more adept at using indirect influence to encourage and praise students, resulting in a harmonious emotional communication between teachers and students. Analysis of classroom recordings revealed that after posing a question, Teacher B could guide students to answer the required questions themselves, while Teacher A accepted more answers without adequate preparation or appropriate responses. In the (16.5–20.5) interval, the proportion of indirect influence to direct influence of Teacher B was 2.67% higher than Teacher A, with a higher frequency of positive integration grids. Although both teachers were explaining “categories of sensations,” Teacher A failed to give students sufficient time to contemplate and taught the content in a self-inquisitive and self-answering format, accompanied by a lack of guidance and patience in classroom language, resulting in a suppressed classroom atmosphere. In contrast, Teacher B exhibited more patience and enthusiasm, actively encouraging student participation, leading to a better classroom activity situation. Moreover, during this time interval, Teacher B’s CAI was 14.11 higher than Teacher A’s, consistent with the actual teaching situation.
Comparison of teacher-student verbal interaction in time intervals with significant differences in CAI
Note: The difference between the average CAI scores of Teacher A and Teacher B can be determined by subtracting the latter from the former. If the resulting value is negative, it indicates that Teacher B has surpassed Teacher A in terms of their respective CAI averages.
By comparing the FIAS dimensions and CAI values across the four intervals, we observed that the frequency of questioning, positive integration grid frequency ratio to negative integration grid frequency, and the proportion of indirect influence to direct influence in teacher-student verbal interactions have a significant impact on CAI. The larger the difference in these parameters, the greater the average difference in CAI. For instance, in the (16.5-20.5) and (28.5-32) intervals, the frequency of classroom questioning, positive integration grid frequency ratio to negative integration grid frequency, and the proportion of indirect influence to direct influence were higher than those in the (11.5–15.5) and (21.5–25.5) intervals, resulting in a more pronounced average difference in CAI. These results further demonstrate the efficacy of CAI in evaluating classroom activity situations.
4.3.2.2 Comparison of teacher’s body language. Following manual observation and analysis of the teacher’s body language and digital resource application in eight time intervals marked by significant differences in CAI, and combined with FIAS analysis of teacher-student language interaction results, we proceeded to select time intervals devoid of significant differences in teacher-student language interaction and digital resource application within the same interval to compare the dissimilarities in the teacher’s body language that caused the variations in CAI. The analysis results indicating whether the CAI generated by CAAS accurately reflects the actual classroom teaching situation are presented in Table 5.
Comparison of Teacher’s Body Language in time intervals with significant differences in activity index
Analysis of the results reveals a significant difference in the frequency of body language usage between Teacher A and Teacher B during the two teaching segments. In the [4–10) time interval while explaining the “sensory deprivation experiment,” Teacher B took slow steps towards the third row of students, holding a flip pen in his right hand, pointing to the classroom screen, flipping through the courseware with the flip pen, and turning his head to face either the students or the screen depending on the content. The students followed the teacher’s directions and focused on the screen, listening to the lesson. Meanwhile, Teacher A stood on the right side of the podium, with his left hand on the podium and his right hand holding the mouse to flip through the courseware. Compared to Teacher A, Teacher B utilized more descriptive, directive, and peripatetic body language, leading to a higher CAI for her. Upon comparison of the CAIs derived from CAAS, it was found that Teacher B had a higher CAI than Teacher A, with an average difference of 7.66, consistent with the identified teaching situation.
In the [32.5–38) time interval while explaining the observation of snails by kindergarten children, Teacher B stood on the podium to operate the PPT while flipping pages and walked towards the students at other times, observing their expressions, listening to them, answering any questions they might have had and encouraging them to express themselves. She used more descriptive, directive, and peripatetic body language than Teacher A, who merely paced back and forth on the podium throughout the lesson. Teacher B’s use of body language kept most of the students focused on the learning process, leading to a higher CAI for her. Upon comparison of CAI values derived from CAAS, it was found that Teacher B had a significantly higher CAI than Teacher A, with an average difference of 32.31, consistent with the actual teaching situation.
4.3.2.3 Comparison of teacher’s body language. Following manual observation and analysis of eight time intervals with significant differences in CAI due to digital resource application, we selected a time interval where there were no remarkable disparities in teacher-student verbal interaction and body language usage. Subsequently, we compared the impact of the difference in teachers’ use of digital resources on classroom activity. We evaluated whether the CAI values exported by the CAAS accurately reflected the actual teaching scenario. The findings of our analysis are presented in Table 6.
Time interval with significant differences in CAI
The analysis results indicate that during the [2–4) interval, both Teacher A and Teacher B taught a textbook case. While Teacher A relied mostly on verbal descriptions to convey knowledge, Teacher B utilized online teaching resources and played a video to appeal to students’ visual and auditory senses. During the [21.5–24.5) interval, Teacher B employed a mobile end question-and-answer approach to consolidate the students’ newly acquired knowledge of the “sensory deprivation experiment.” By contrast, Teacher A simply summarized and emphasized pertinent information through verbal expression alone.
In both time periods, Teacher B’s use of video teaching resources prompted students to look up and watch videos, while their mobile end questionnaires stimulated student learning enthusiasm, inspired independent thinking, and encouraged exploration. These techniques led to increased classroom activity levels in Teacher B’s class when compared to Teacher A’s approach. Comparison of the CAI values revealed that Teacher B consistently had higher CAIs than Teacher A in both time periods, with average differences of 14.59 and 23.56 respectively. These results accurately reflected the respective teaching scenarios.
This study primarily examines the correlation between classroom teaching behavior and CAI and explores the reliability of the CAI generated by the developed CAAS. The findings reveal that three critical factors - teacher-student verbal interaction, teacher’s body language, and digital resource application - significantly impact CAI. Assuming H1, H2, and H3 are established, the consistency of student classroom activity analyzed by FIAS and manual analysis with CAI analyzed by CAAS confirms that CAI is dependable and can be utilized in teaching research and daily teaching scenarios, improving the accuracy and scientific rigor of classroom teaching assessment.
Schools can utilize the CAAS to organize discussion-based teaching research activities such as same-class-same-content, same-class-different-content, and theme-based different-content, and assess teacher performance using CAI difference curves. This approach can help the teachers focus on discussion topics, clarify teaching improvement ideas, and promote their professional development. Moreover, they can quantify each class’s CAI to understand the actual situation of teaching.
Teachers can employ the CAAS to assist in multi-dimensional teaching evaluation and identify student behavior change rules, actively carry out teaching interventions, and improve their teaching control ability. They can also analyze teaching processes using CAI to reflect on their own teaching performance, formulate teaching optimization strategies, adjust teaching behaviors and knowledge point distribution in subsequent teaching sessions, and design more captivating teaching activities to improve overall classroom teaching effectiveness.
Students can use the CAAS to analyze their learning process, reflect on classroom learning performance, examine and optimize their own learning behavior, and enhance classroom activity and participation. By integrating CAI with existing evaluation methods, such as teaching supervision, student evaluation, teaching achievement, and reflection, a comprehensive quantitative and qualitative assessment of classroom atmosphere and teaching effectiveness can be achieved, fostering a deeper understanding of students’ learning interests and engagement levels for improved teaching quality. This study provides valuable insights into designing and constructing CAAS to meet the needs of quantifying classroom activity, further promoting the development of classroom teaching evaluation under the backdrop of AI.
Limitations and future research
Although CAAS addresses the issues posed by traditional manual evaluation of small samples and lack of objectivity, concerns exist regarding the limited data collection volume and inadequate adaptability to diverse languages and cultural backgrounds. Furthermore, CAAS based on hardware devices, such as cameras and microphones, fails to capture subtle interactions between teachers and students, and presents certain limitations in analyzing details. Additionally, when verifying CAAS’s efficacy, it is crucial to compare the consistency of the CAI value with the outcome of the researcher’s manual evaluation and classroom behavior evaluation tool as the objectivity of the researcher’s evaluation can impact the evaluation accuracy.
Regarding future research, we suggest expanding the research sample to explore more teachers in different disciplines and educational stages, thereby determining whether similar results can be observed in larger project samples and verifying the reliability and generalizability of this study’s conclusions. Secondly, we recommend enhancing CAAS by exploring accurate and comprehensive data collection and analysis methods, optimizing the design of the classroom teaching evaluation system, increasing adaptability to diverse cultural and language backgrounds, and generating process analysis reports automatically to better evaluate teaching effectiveness. The authors anticipate continuously improving their methods and optimizing the classroom teaching evaluation system’s design in future research.