
Abstract
Health assessment is one of the important theoretical bases for deciding whether the diversion tunnel can operate safely and stably. A project of the TBM diversion tunnel is taken as the research object to ensure the normal operation of the diversion tunnel. Based on measured data and considering multiple safety aspects such as structural response, durability, and external factors of the diversion tunnel, a TBM diversion tunnel structural health evaluation index system is established. A new method for the TBM diversion tunnel structural health comprehensive evaluation based on Analytic Hierarchy Process-Matter Element Extension-Variable Weight Theory (AMV) is proposed to explore the impact of AMV fluctuation with the measured results of the indicators on the weight, closeness, and health grade of each evaluation index. The high sensitivity and high-risk evaluation indicators for the structural health of the diversion tunnels are identified. It is found that the variable weight varies with the changes in various indicator values, which can accurately evaluate the health status of tunnels in real-time. The characteristic values of the tunnel grade calculated by the AHP and the AMV are 1.589 and 1.695, respectively. The results of the corresponding interval diversion tunnel are the basic safety state of grade B. Except for the two evaluation indicators of concrete strength and slurry properties, the variable weight values and grade characteristic values of other evaluation indicators increase with the increase of indicator values. The four indicators of segment settlement, segment opening, segment misalignment, and segment cracks are more sensitive to the health of the TBM diversion tunnel. This AMV can accurately evaluate the health status of the diversion tunnel structure. The research results can provide references for later maintenance work and similar projects.
Introduction
In recent years, Tunnel Boring Machine (TBM) have been widely used in the field of hydraulic engineering due to their strong adaptability to surrounding rock conditions during construction and good hydraulic characteristics of the tunnel flow surface. However, diversion tunnels are more susceptible to varying degrees of damage due to the influence of the surrounding environment and bearing capacity when in operation. The leakage, cracking and carbonization of pipe segments can pose a threat to the health of the diversion tunnel structure [1, 2]. Therefore, a reasonable health assessment of the diversion tunnel structure has important practical significance [3, 4].
Many diseases affect the health status of tunnel structures in practical engineering, and the evaluation results of tunnels based on individual indicators and expert scoring are often too limited. Therefore, selecting a reasonable fuzzy evaluation method is particularly crucial for evaluating the health status of the diversion tunnel structure. Currently, scholars have achieved many results in this field [5–7], including main methods such as ANP-TOPSIS [8], fuzzy logic [9, 10], fuzzy analytic hierarchy process [10], AHP-TOPSIS [11], and Bayesian method and so on. Huang et al. [12] used an improved sparse Bayesian learning method to establish high-precision models for monitoring data of different structures, achieving highly sensitive localization of structural health damage and probabilistic data-driven damage detection. Jing et al. [13] proposed a composite risk analysis model based on TOPSIS theory, analyzing the influence of multiple factors on the stability of tailings dams. The calculation results of the TOPSIS model were compared with the actual measurement results, and the conclusion was drawn that this evaluation method is more reliable and reasonable. Liu et al. [14] used a normal cloud model for quantitative evaluation of the risk of damage during tunnel excavation, used the entropy weight method to determine the weight of indicators, and used the maximum membership amount fuzzy entropy weight method to determine the risk level of the tunnel. Wang et al. [15] proposed a TFN-AHP method for multi-factor risk assessment of water inrush in karst tunnels and compared the evaluation results with actual situations to verify the rationality and practicality of this method. Zhang et al. [16] conducted a study on the uncertainty of tunnel health by merging different types of data into tunnel-level evaluation, introducing exponential scales, defining fuzzy operation symbols, and obtaining results that match the fuzzy comprehensive evaluation indicators with actual measurements. Cui et al. [17] proposed a new health state evaluation method based on fuzzy gray clustering and combinatorial weighting for the comprehensive evaluation of aircraft hydraulic system, using entropy weighting and hierarchical analysis to determine the weights of the relevant indexes, combined with the combinatorial assignment method to combine the two weights, and utilized the fuzzy comprehensive judgment method to accurately evaluate the health state of the hydraulic system of the aircraft. The health evaluation of the above engineering structures mainly adopts traditional methods such as the AHP and Fuzzy Mathematics. The above fuzzy evaluation methods are mainly aimed at engineering projects such as bridges and dams and have strong subjectivity. The weight of evaluation indicators is fixed, which cannot accurately reflect the health status of tunnel structures. Therefore, there is an urgent need to propose an index weight optimization method to improve the accuracy of the health evaluation of diversion tunnel structures.
Currently, many scholars have researched the calculation methods of indicator weights. Liu et al. [18] used the AHP method to determine the fixed weights of 19 indicators based on tunnel engineering in karst areas and survey data. Sun et al. [19] proposed a mixed fuzzy method for riverbank risk based on the Three Gorges Project, using the AHP entropy weight method to calculate the weights of different influencing factors and determine the likelihood of erosion in the area. Cheng [20] used the principle of the efficacy coefficient method based on the diversion tunnel project, combined the evaluation index weight with the efficacy coefficient, and conducted modeling analysis to confirm the feasibility of this method. Qiu et al. [21] used the fuzzy Delphi method to select initial indicators and establish an evaluation index system for the sustainable development of tunnels. Using the scoring data of researchers and tunnel builders, the relative weights of each indicator were calculated to determine the indicators that have more advantages for the sustainable development of tunnels. In summary, most calculation methods for indicator weights only rely on the correlation coefficients between indicators for health assessment and risk prediction of engineering structures, without exploring the impact of measured data of indicators on indicator weights in actual engineering.
In response to the limitations of the health evaluation methods and indicator weight calculation methods, a health evaluation method based on the AMV for a TBM diversion tunnel project is proposed. Research was conducted on the structural health evaluation of the TBM diversion tunnel, and a health evaluation index system was established. The impact of the AHP and AVM method on the weight, closeness degree and health grade of each evaluation indicator was analyzed. Finally, a sensitivity analysis of various evaluation indicators was conducted, and key indicators that affect the health of the diversion tunnel structure were identified, providing a new method for the health evaluation of the diversion tunnel structures.
The rest of this article is summarized as follows: The TBM diversion tunnel structural health evaluation index system and evaluation level are established in Section 2. Section 3 provides a detailed introduction to the TBM water diversion tunnel health evaluation method proposed in this article. Section 4 provides an actual project to demonstrate the accuracy of the proposed method. Section 5 discusses the results of the case study. Finally, the conclusion drawn can be found in Section 6.
Health Evaluation Index System and Evaluation Grade of TBM Diversion Tunnel Structure
Establishment of health evaluation index system
As the operating years of the diversion tunnel increase, the state of the tunnel structure gradually tends toward a disease state. At present, some scholars have conducted relevant research on the health, safety, and risk assessment of the diversion tunnel structure. Various standards and specifications have been issued. Corresponding reference standards have been provided for the deformation of the diversion tunnel structure segments, the opening of joints, misalignment, and the stress status of steel bars. Based on relevant literature and specifications, combined with on-site monitoring and detection data of a typical cross-section of a diversion tunnel project (Pile number SD3 + 730∼SD3 + 843), a total of 12 indicators were selected for the stress, deformation, durability, and external influencing factors of the diversion tunnel structure. The TBM diversion tunnel structure health evaluation index system was established, as shown in Fig. 1.
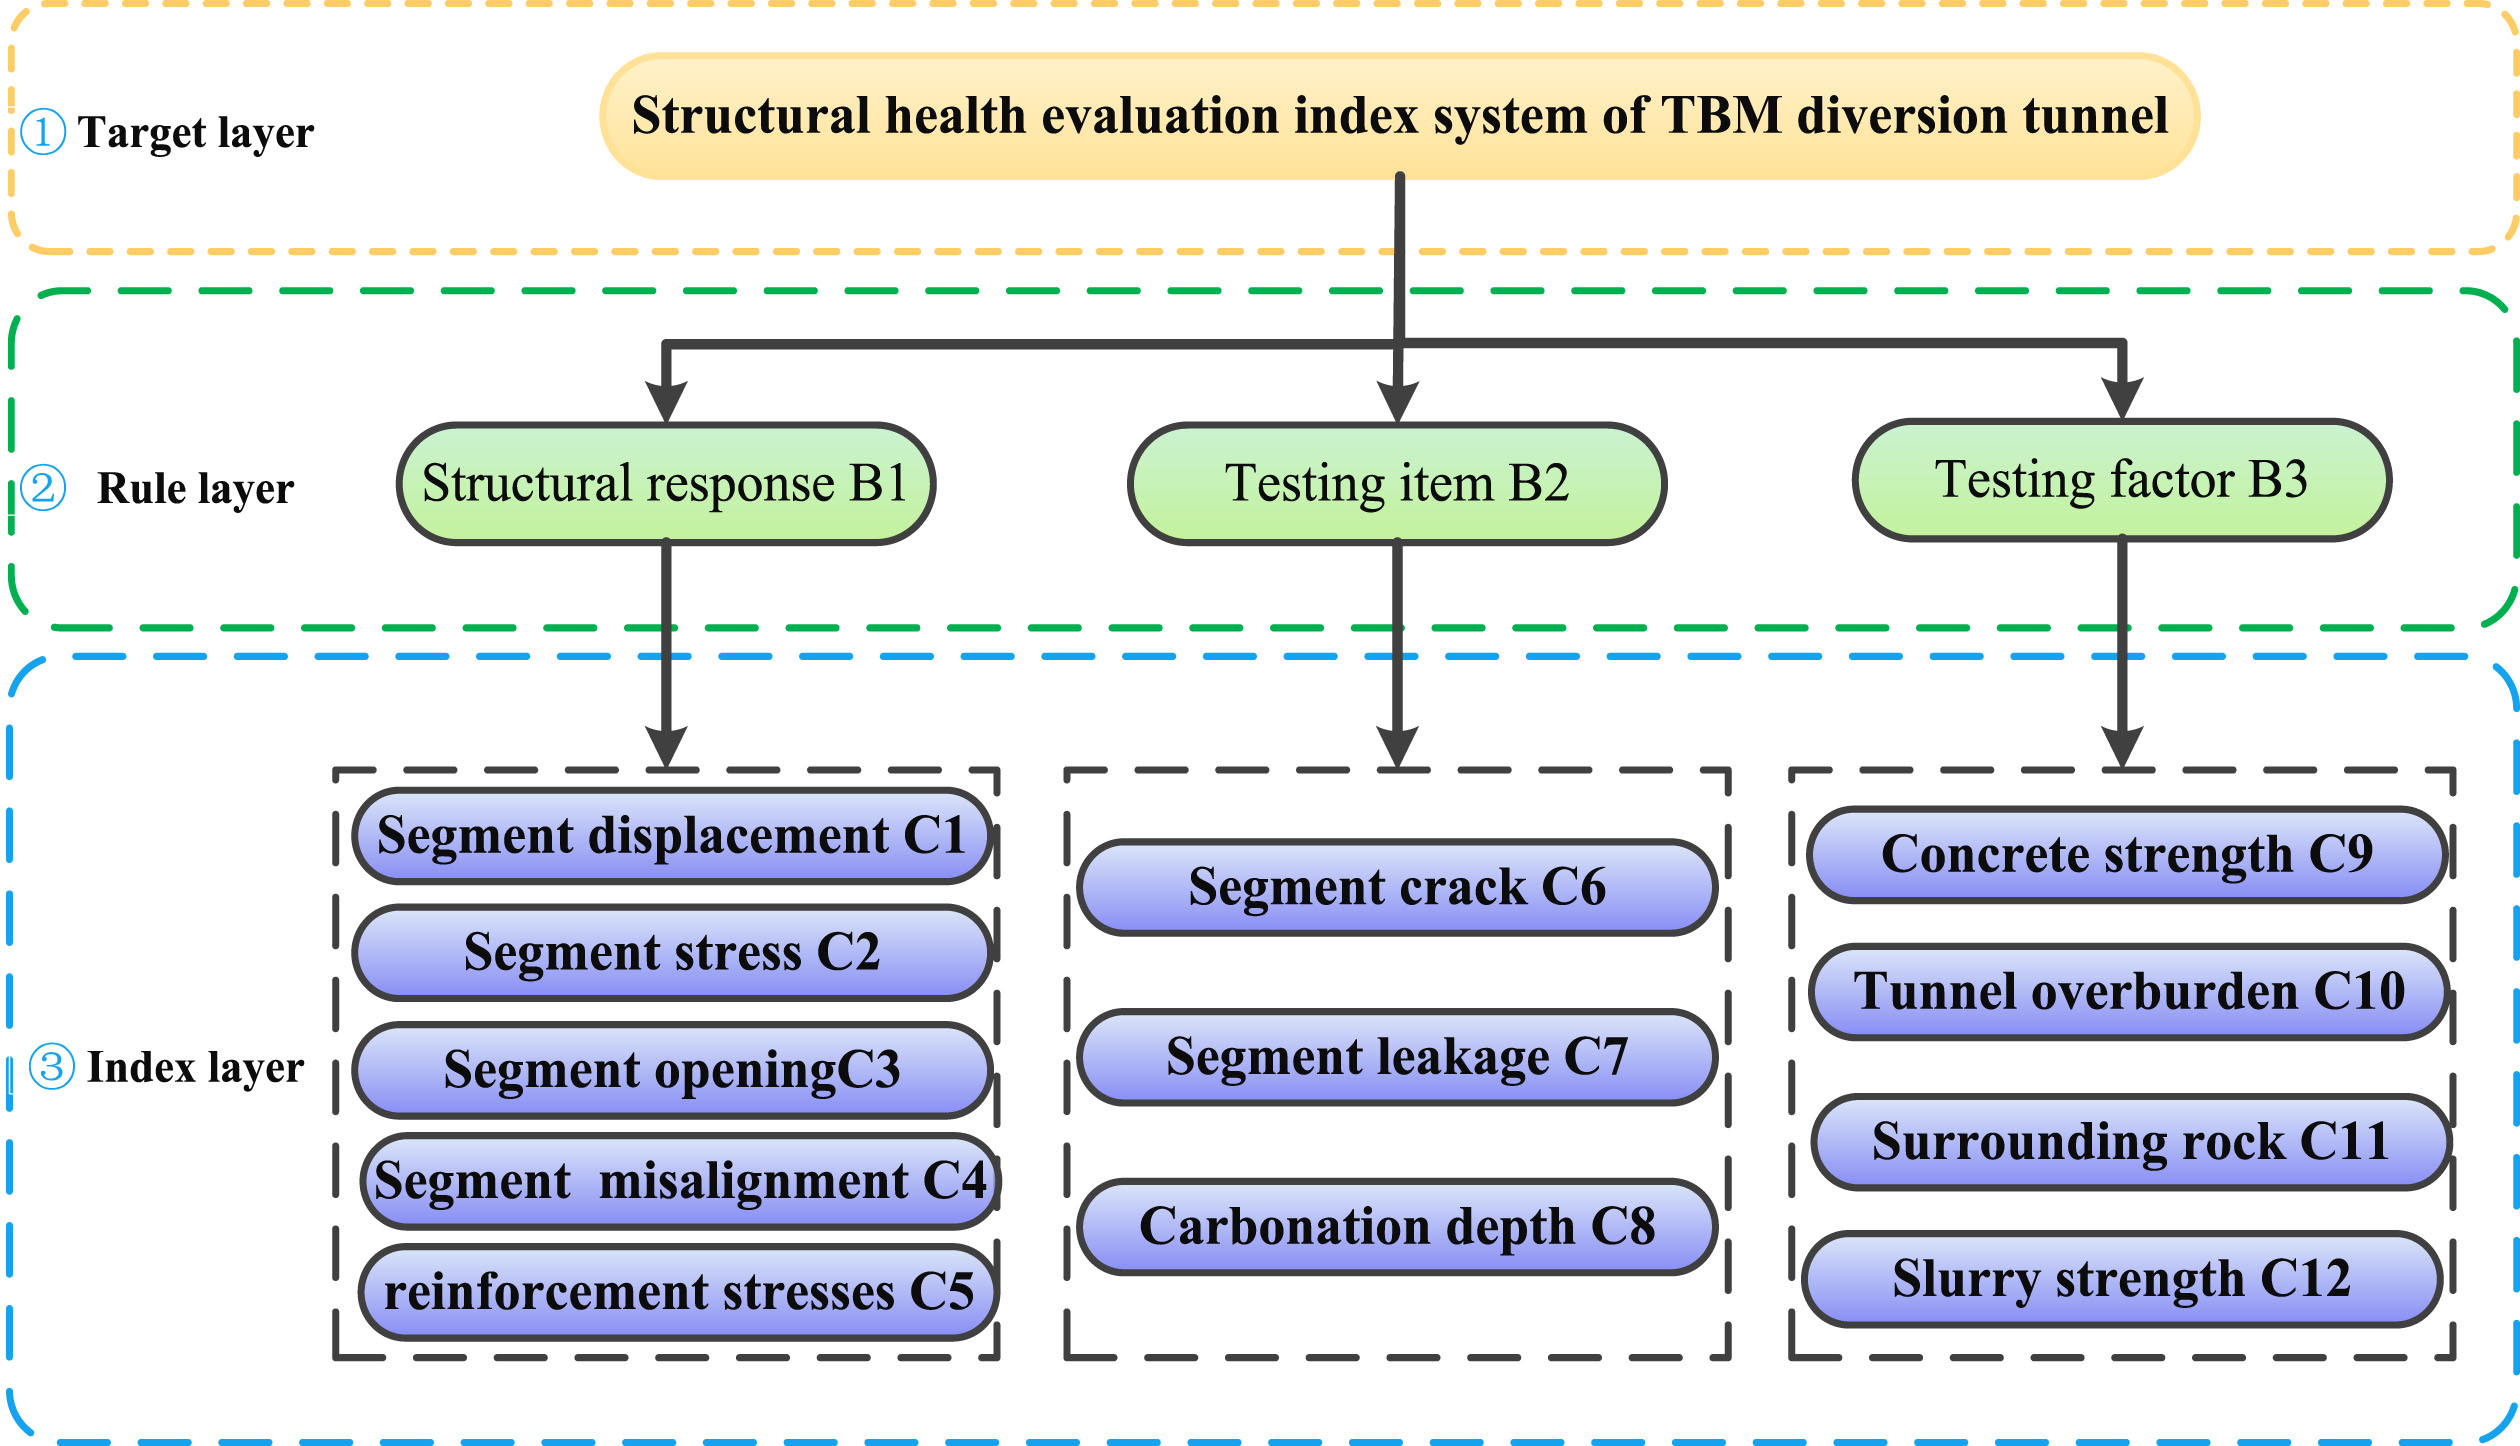
Health indicator system of TBM diversion tunnel structure.
According to the design and safety specifications related to hydraulic tunnels [27–29], combined with the evaluation standards in urban subway shield tunnel engineering, the structural health status evaluation grade of TBM diversion tunnels is divided into 5 grades, and corresponding health status evaluation standards for TBM diversion tunnels are established, as shown in Table 1.
Classification of Health Status Evaluation grades for TBM Diversion Tunnel
Classification of Health Status Evaluation grades for TBM Diversion Tunnel
To make reasonable quantitative judgments on the health evaluation indicators of TBM diversion tunnel structure, based on relevant industry standards and literature [22–29], health evaluation standards for each indicator of TBM diversion tunnel structure have been established, as shown in Table 2.
Health Evaluation Standards for Various Indicators of TBM Diversion Tunnel Structure
Matter element extension model
Extension is a comprehensive evaluation model that considers engineering-measured data [31]. Present the evaluation grade and the evaluation interval in the form of “grade, feature, data” (N, E, V, respectively). The calculation steps are as follows:
(1) Build Classic Domains
(2) Determine the joint domain of the evaluation model
Take the minimum and maximum values of each indicator in the corresponding value range of j tunnel health evaluation grades, and form the evaluation model domain matter element, as shown in Equation (2):
(3) Determine the matter element to be evaluated
Assuming there are m health indicators for the diversion tunnel to be evaluated, the formula for the t-th health indicator of the tunnel to be evaluated is as follows:
(4) Data normalization
The data values monitored by engineering generally require some form of transformation to avoid the tunnel health indicator R t being evaluated exceeding the specified limit Therefore, normalize the data intervals for R j and R t , as shown in Equation (4) and Equation (5):
AHP is a system decision analysis method that combines qualitative and quantitative analysis. This method gradually divides the whole into small factors, analyzes the impact of several factors on the whole, and ultimately forms a hierarchical structure diagram. In this hierarchical structure diagram, the elements of each level correspond to a set of relatively important criteria, which can be quantitatively evaluated to obtain the weights of each criterion, thereby determining the best choice for a solution or decision [30]. However, AHP has strong subjectivity and does not consider the error and volatility of each indicator.
The variable weight theory was first proposed by Wang, which integrates the measured data of evaluation indicators into the calculation of weights, making the weights of each indicator in the evaluation model more convincing [32]. Therefore, the variable weight theory is used to optimize the weights calculated by the AHP based on the measured data of various evaluation indicators. The basic content of variable weight theory includes: Assuming X = (x1, x2, x3, ⋯ , x
n
) is the value vector of each indicator, W = (w1, w2, w3, ⋯ , w
n
) is the fixed weight of each indicator, and S (X) = (S1 (X) , S2 (X) , S3 (X) , ⋯ , S
n
(X)) is the variable weight vector of each indicator, then the variable weight vector of each indicator W (X) = (w1 (X) , w2 (X) , w3 (X) , ⋯ , w
n
(X)) that can be expressed as:
Where S i (X) is a variable weight function, usually an exponential function based on e.
To investigate the impact of the error of various indicator data in tunnel structural health evaluation on the weight of the indicators, the above variable weight vector is determined by calculating the variable weight function and engineering measured data. The calculation formula is:
After normalizing the data indicators, the value interval of x is [- 1, 1], and when x < 0, S i (X) < 1 is a punitive variable weight function. When x > 0, S i (X) > 1 is the motivational variable weight function. The constructed variable weight function can be used to impose corresponding penalties or incentives on various indicators, as shown in Fig. 2.
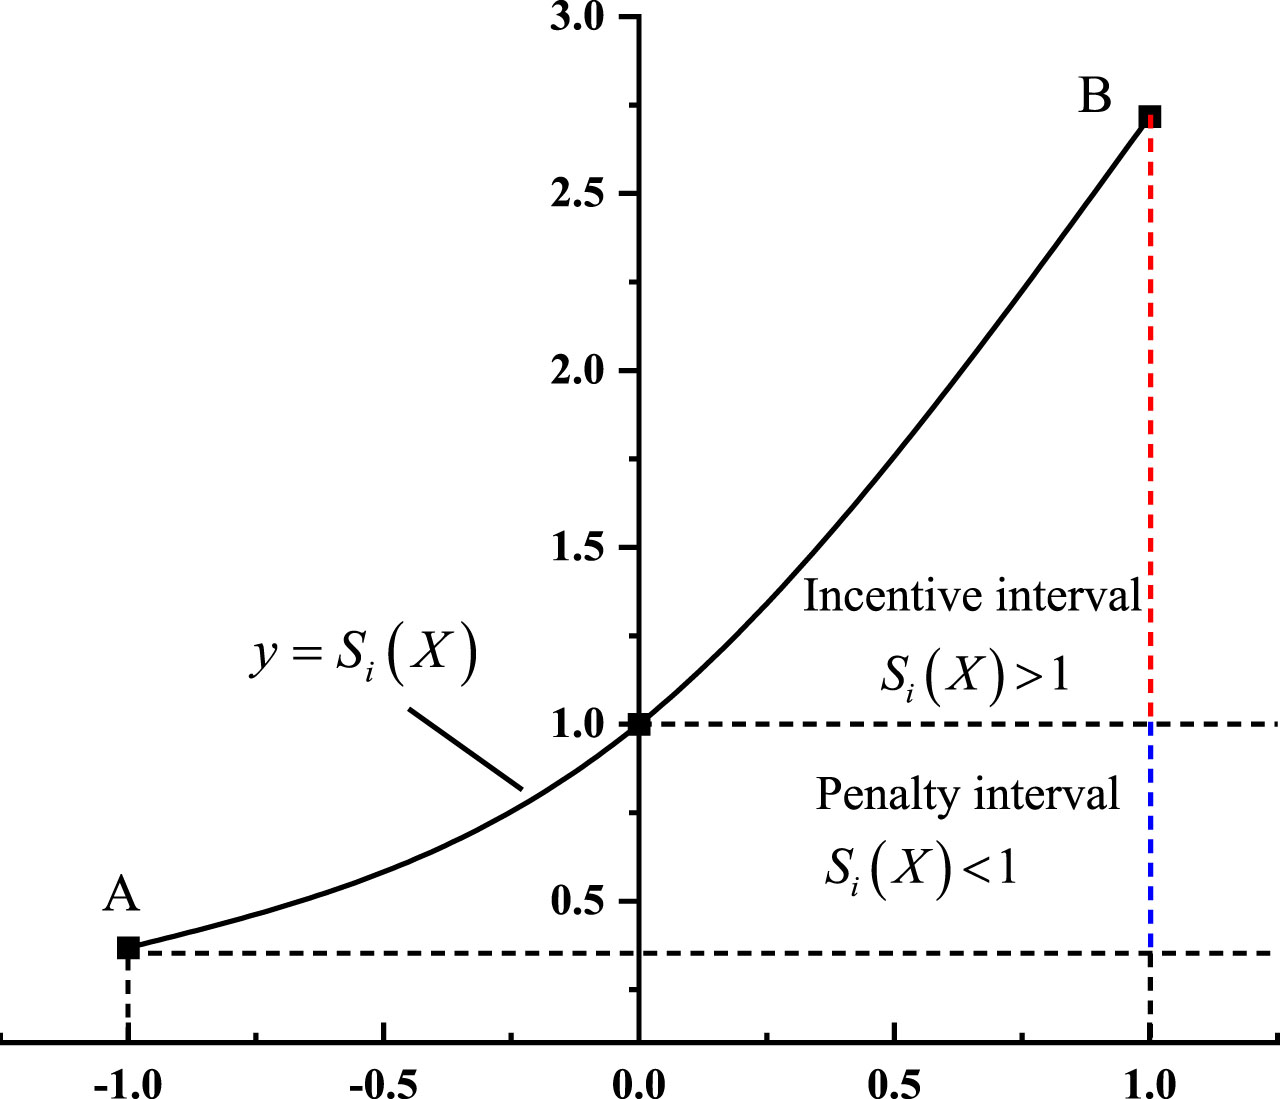
Variable weight function.
Wang et al. [33] proposed an asymmetric closeness degree instead of the maximum membership principle for the health diagnosis of in-service tunnel structures to aggregate the evaluation results and determine the health grade of tunnel structures. The asymmetric closeness degree are:
When calculating the asymmetric closeness degree, it is necessary to standardize W, placing w i first, and for any i1, i2 ∈ i n , if |i1 - i| < |i2 - i|, the corresponding w i 1 is placed before w i 2 , if |i1 - i| = |i2 - i| and i1 < i2, then row w i 1 comes before row w i 2 . Standardize the descendants into Equation (8) and obtain the corresponding N j (W, D).
To determine the health evaluation grade
Where j* is the characteristic value of the tunnel health indicator R t to be evaluated; N j (p) represents the standardized pasting closeness degree.
The TBM diversion tunnel structure health assessment process is shown in Fig. 3. Firstly, the assessment index system is constructed, and the fixed weight of each index is calculated by the AHP. Classic fields and joint domains and the matter-element to be evaluated, the variable weight theory is introduced, combined with the fixed weight of indicators and measured data, the variable weight of indicators is calculated, the closeness degree and the grade eigenvalue of the interval to be evaluated are calculated, and the safety level of the interval to be evaluated is determined according to the size of the grade eigenvalue.
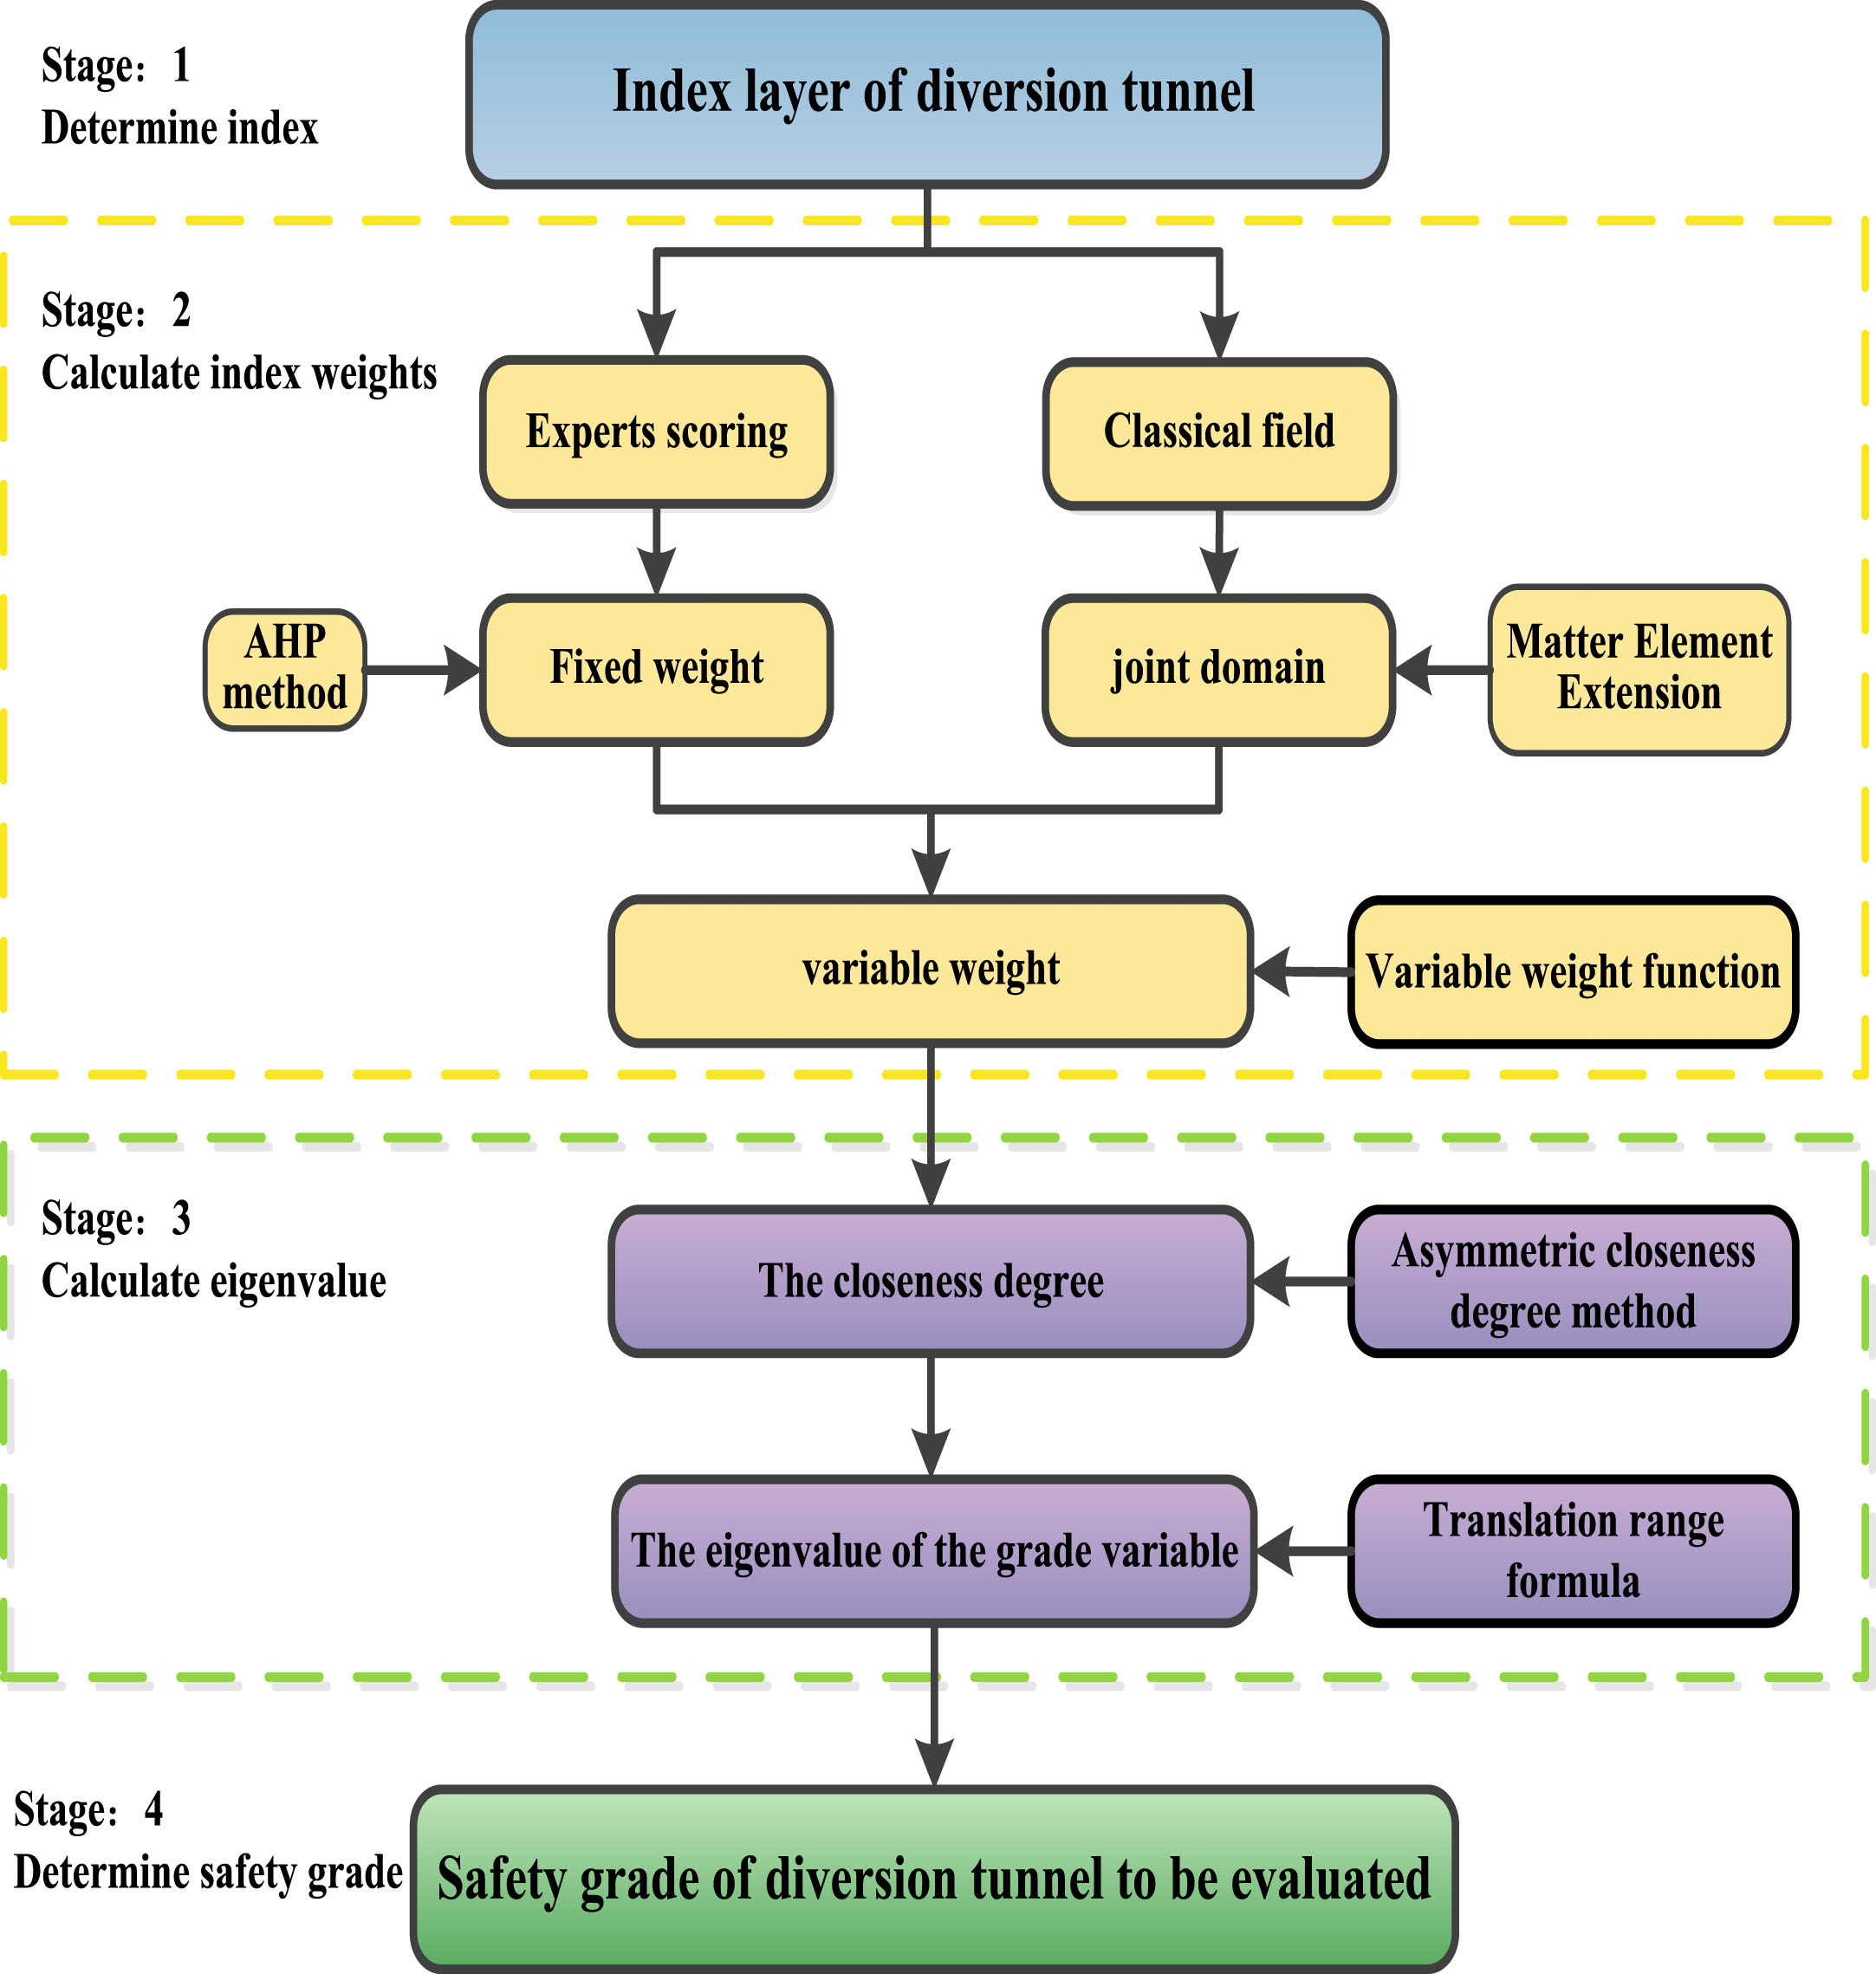
Health Assessment Process of TBM Diversion Tunnel Structure.
Project overview
Taking a diversion tunnel project in Guangdong Province as a case study. The project started construction in May 2020 and was completed in June 2021. The total length of this section is 6300 m, with an outer diameter of 4.8 m, an inner diameter of 4.3 m, and a width of 1.4 m. Figure 4 is a schematic diagram of the splicing of the diversion tunnel segments. This section mainly passes through buildings such as river channels and provincial roads, and the surrounding rock mainly passes through completely weathered and weakly weathered rock.
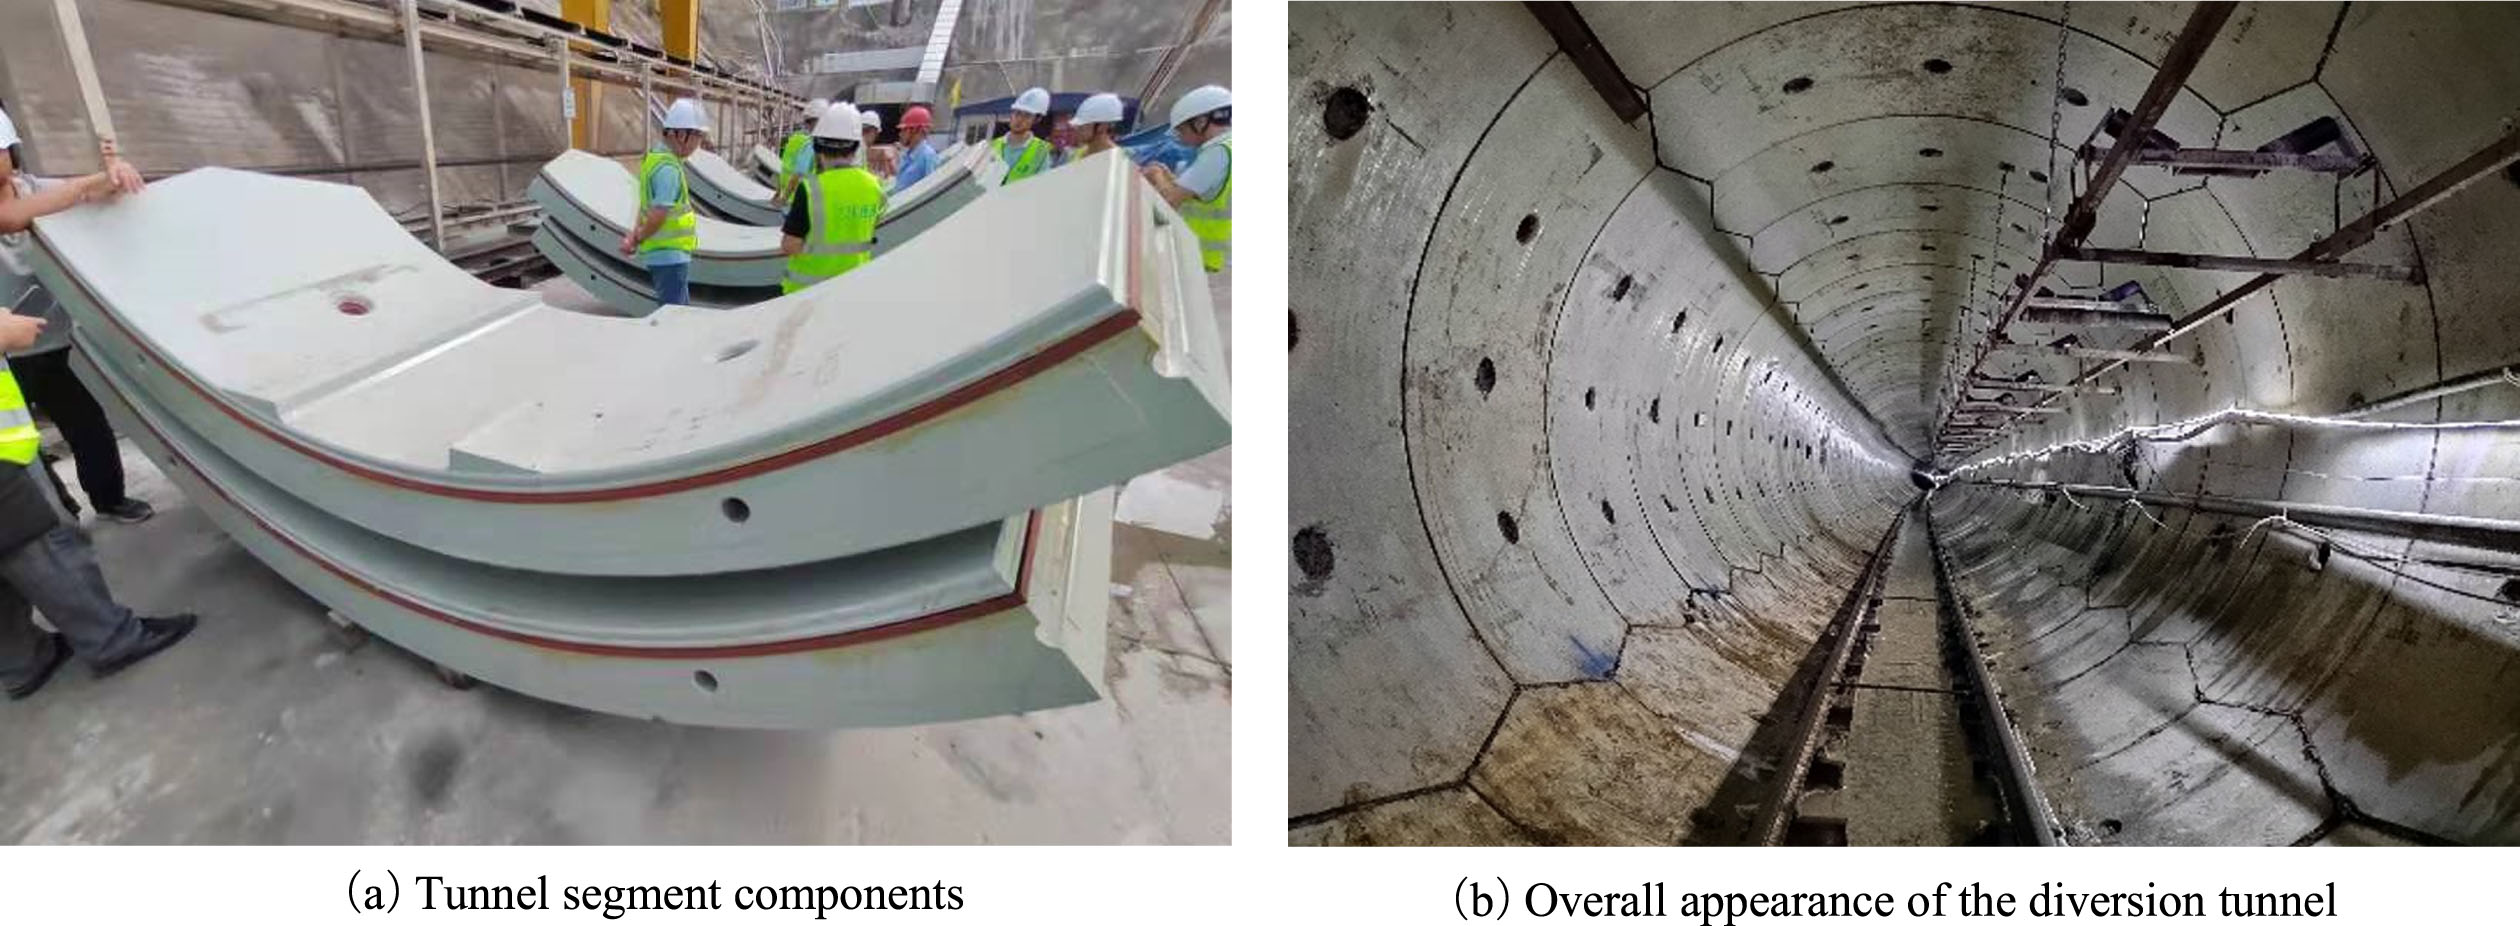
Schematic diagram of the splicing of water diversion tunnel segments.
Based on the on-site inspection of a typical cross-section of a diversion tunnel in Guangdong Province (Pile number SD3 + 730∼SD3 + 843), regular monitoring, and measured data such as tunnel structure maintenance, it was found that during the construction period, the vertical displacement of the segments in the diversion tunnel was large (as shown in Fig. 5), onecolumnand there were openings and mismatches at the joints of the segments (as shown in Fig. 6), as well as water seepage and other issues in local sections. Therefore, it is necessary to conduct a comprehensive structural health evaluation of a diversion tunnel project in Guangdong Province to ensure the normal and stable operation of the diversion tunnel. The measured results of each indicator layer are shown in Table 3.
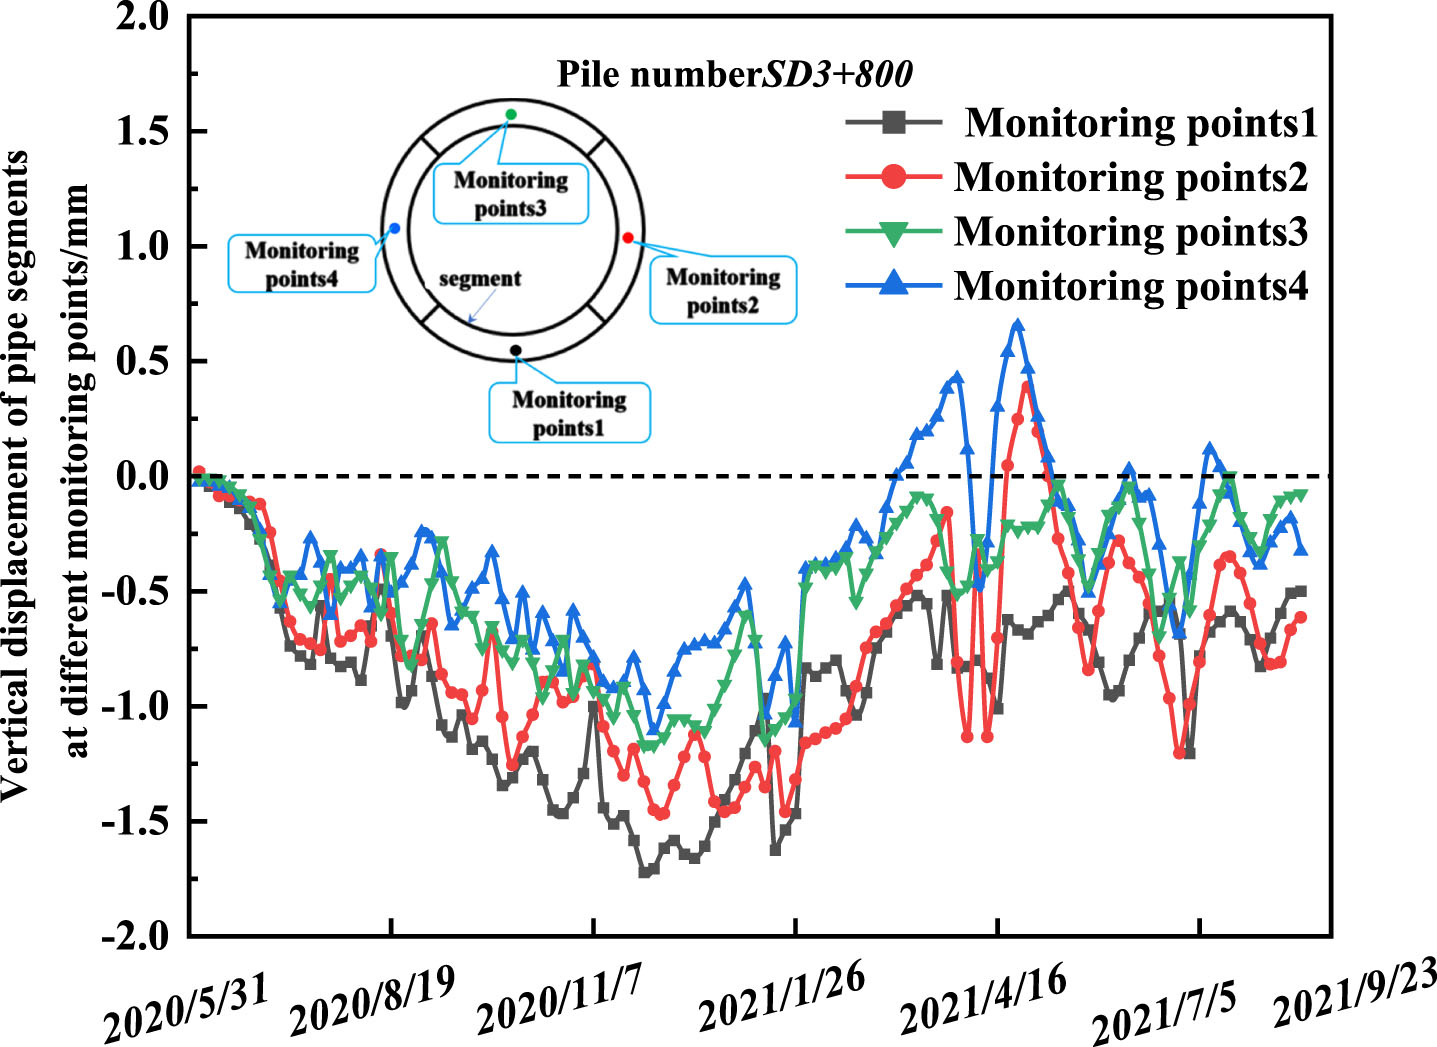
Vertical displacement diagram of segment at different monitoring points.

Deformation map of joints at different monitoring points.
Typical cross-section (Pile number SD3 + 730∼SD3 + 843) on-site monitoring and
According to the health evaluation criteria for various indicators of the TBM diversion tunnel structure in Table 2, matrices R
j
and R
p
are determined as follows:
Based on the typical cross-section of the TBM diversion tunnel project (Pile number SD3 + 730∼SD3 + 843) on-site monitoring, the detection data is used to establish the matter element matrix R
t
to be evaluated.
Based on the measured data of the diversion tunnel section (SD3 + 730∼SD3 + 843) in Table 3, the tunnel health index R
t
to be evaluated was evaluated, but some of the measured data exceeded the specified limits. Therefore, the result of normalization processing is:
Results and discussion
Determination of variable weight
Based on the actual situation of a certain TBM diversion tunnel project, using the AHP, the fixed weights of various indicators of the TBM diversion tunnel structure are determined. Then, based on the matter element extension model, the classical domain and matter element of the level and test interval are constructed. By substituting tunnel monitoring data into Equation (6), the variable weight of each indicator can be calculated. In Equation (7), the total evaluation grade of tunnel health evaluation indicators is taken as 5, the boundary value of the incentive penalty interval of the variable weight function is taken as
Weights of TBM Diversion Tunnel Structural Health Assessment Indicators
Weights of TBM Diversion Tunnel Structural Health Assessment Indicators
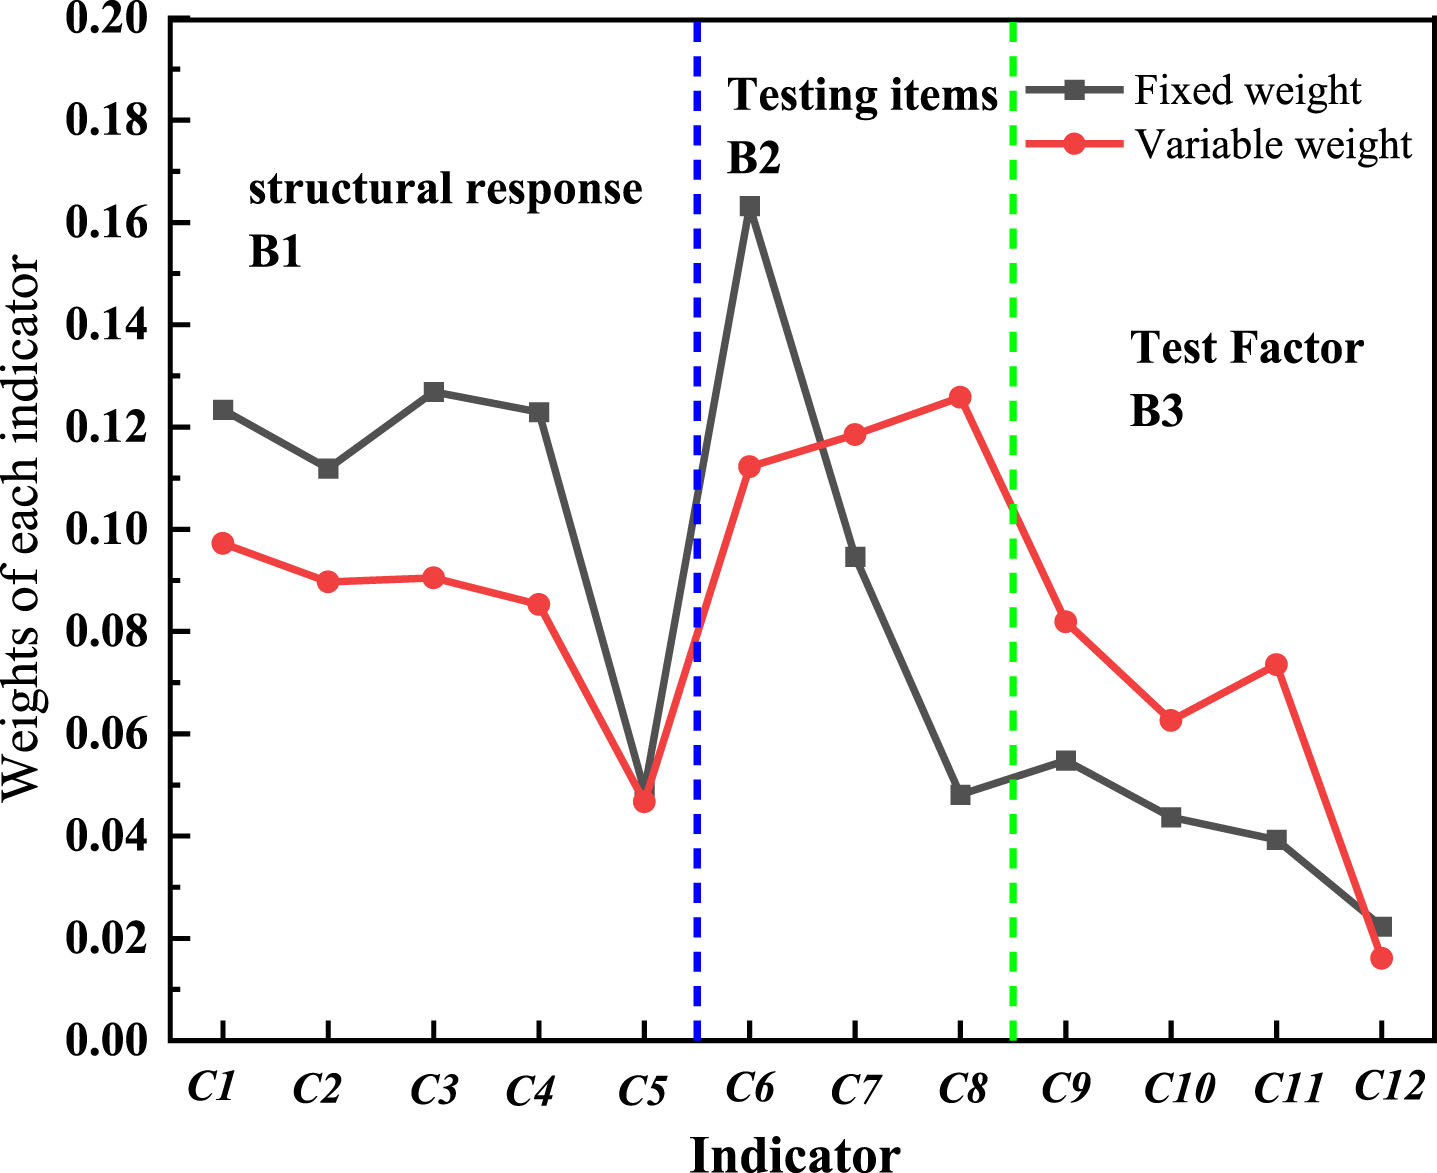
Comparison of Weights of Various Indicators for TBM Diversion Tunnel Structure.
The comparison of weights for various indicators of TBM diversion tunnel structure is shown in Fig. 7. From Fig. 7, the corresponding indicator weights obtained by using variable weight theory for indicator layers C7, C8, C9, C10, and C11 are all greater than the fixed weights obtained by AHP method, while the fixed weights of indicator layers C1, C2, C3, C4, C6, and C12 are all greater than the variable weight. The main reason for this phenomenon is that the fixed weights calculated by the AHP are only limited to expert scoring, and the variable weights are calculated based on the monitoring data of a certain section of the TBM diversion tunnel structure. Taking the indicator layer segment settlement C1 and segment leakage C7 as examples, in the typical cross-section of TBM diversion tunnel engineering (Pile number SD3 + 730∼SD3 + 843), the segment settlement is 1.711 mm, and the structural health evaluation is Grade A. So the variable weight function punishes this indicator, causing the calculated variable weight of the segment settlement to be slightly less than the fixed weight. During the construction process, the TBM diversion tunnel structure experienced slight water seepage, which had an impact on the health of the existing tunnel structure. Therefore, the variable weight function was used to motivate this indicator and increase its weight. In summary, compared to the AHP method, the improved AMV method has more advantages in the health evaluation of diversion tunnel structures.
Determining the health grade of the TBM diversion tunnel structure is an important step. According to Equation (8) to Equation (10), the closeness degree and characteristic values of the tunnel health indicators to be evaluated are calculated, as shown in Table 5.
Calculation results of the closeness degree and eigenvalues of tunnel health indicators to be evaluated
Calculation results of the closeness degree and eigenvalues of tunnel health indicators to be evaluated
From Table 5, the structural health grade of the TBM diversion tunnel is calculated using fixed and variable weights, and the characteristic values j* are 1.589 and 1.695, respectively, which are within the range of (1, 2). Therefore, the structural health comprehensive evaluation grade of typical sections of TBM diversion tunnel engineering (Pile number SD3 + 730∼SD3 + 843) is in the range of A∼B grades; The AMV method is used to calculate the eigenvalues of the TBM diversion tunnel structure, which have a high closeness degree after standardization. The comprehensive health evaluation grade is more inclined towards the B-grade basic safety state; Compared with the AHP method, the AMV method can more accurately identify high-risk indicators and implement punishment incentive measures. The evaluation results have higher credibility and are in line with the actual situation of the project.
To comprehensively reflect the structural health status of the TBM diversion tunnel, by selecting 12 measured indicators, the TBM diversion tunnel structure health evaluation index system was established. This section explores the sensitivity of each evaluation indicator in the evaluation indicator system and identifies key risk indicators. During the later reinforcement of the project, the focus should be on the changes in key risk indicators. This article adopts the principle of controlling variables, changing the measured value of one indicator while keeping the other indicators unchanged. The normalized variable index value increases by 0.2 for each calculation, while the other index values are 0.1. The variation curves of variable weight and grade characteristic values with the values of various evaluation indicators are shown in Figs. 8–9.

Curve of Variable Weight Changing with Evaluation Index Values.
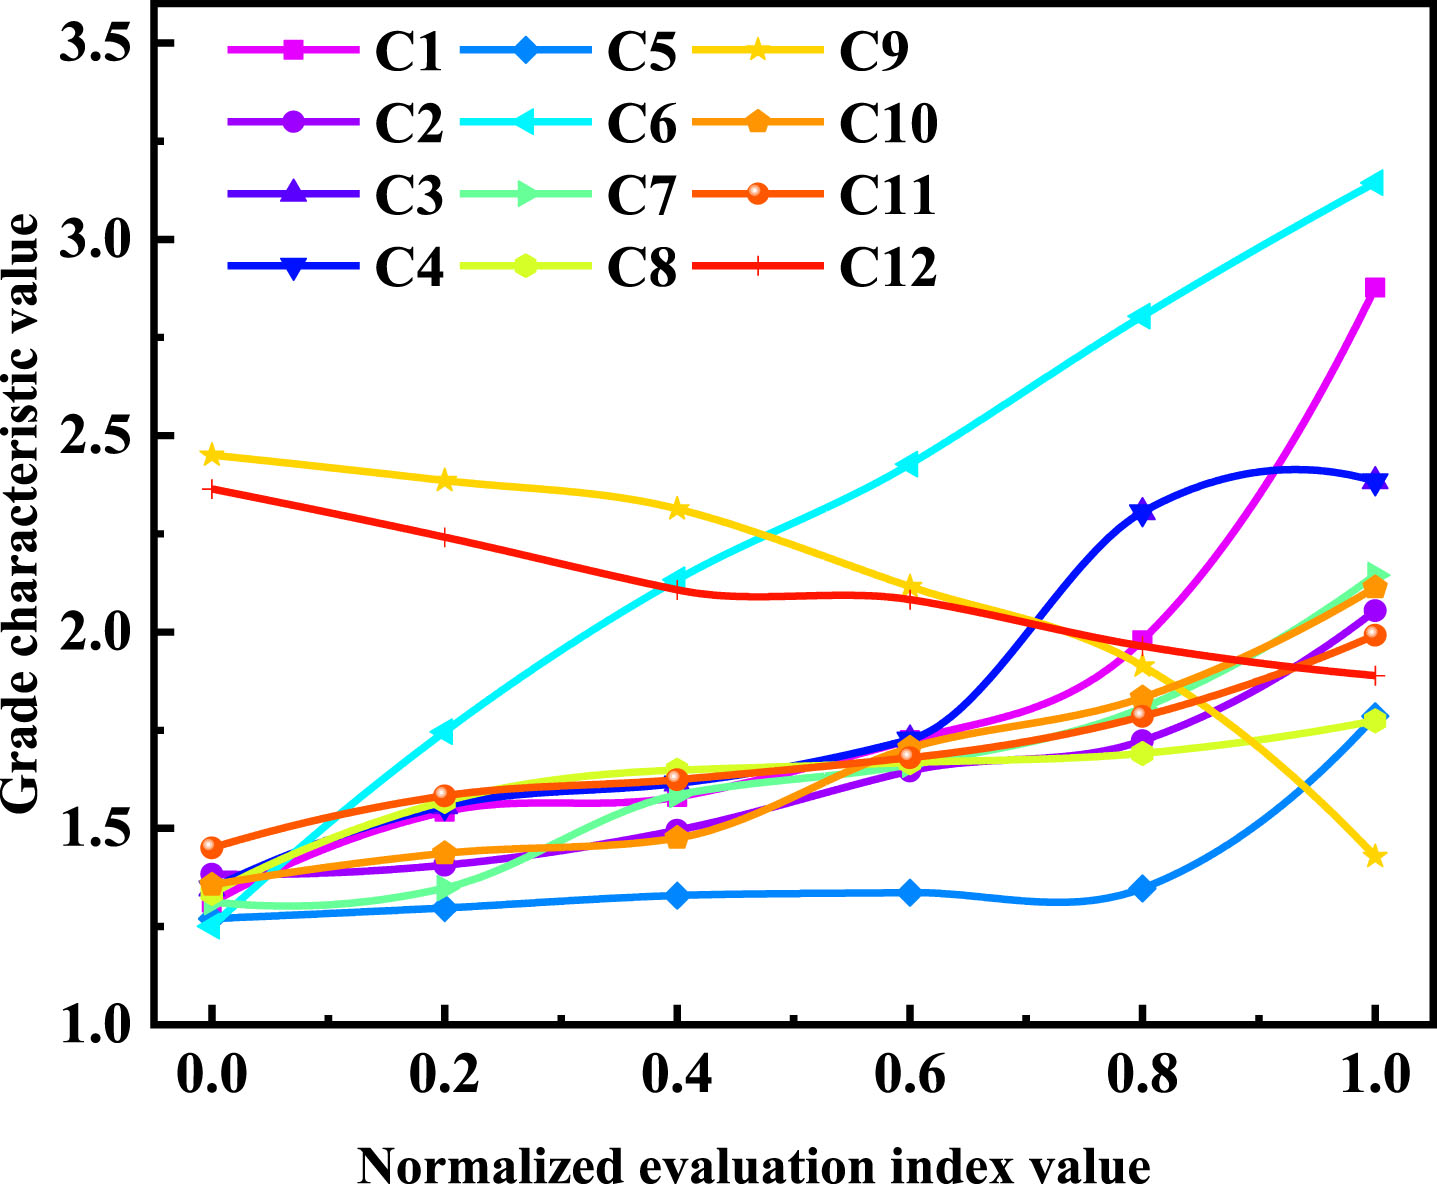
Change Curve of Evaluation Index Value and Grade Characteristic Value.
From Fig. 8, the weight values of the evaluation indicators concrete strength (C9) and slurry properties (C12) decrease with the increase of the evaluation index value, while the weight values of other indicators increase with the increase of the evaluation index value. The main reason for this phenomenon is that the larger the evaluation index values of C9 and C12, the more likely the health structure of the diversion tunnel tends to be safe. The values of each evaluation indicator are within the (0, 1) range, and the fluctuation amplitude of the indicator weight is C6 > C4 = C3 > C1 > C2 > C7 > C9 > C5 > C8 > C10> C11 > C12, respectively. The corresponding weight change amplitudes are 0.597, 0.464, 0.464, 0.451, 0.409, 0.334, 0.298, 0.179, 0.175, 0.160, 0.143, 0.122. It can be concluded that the weight values calculated by the AMV method will vary with the changes in indicator values, and the degree of weight change varies for different indicators. The weight values of the five indicators, including segment crack C6, segment misalignment C4, segment opening C3, segment settlement C1, and segment stress C2, fluctuate greatly. The variation of the surrounding rock type C11 and slurry property C12 is relatively small. As the weight values of the five indicators with larger changes gradually increase, the health status of the TBM diversion tunnel structure shows more obvious diseases.
From Fig. 9, it can be seen that except for the evaluation indicators of concrete strength (C9) and slurry properties (C12), and the grade characteristic values of all other evaluation indicators increase with the increase of indicator values. The variation range of grade characteristic values is between 0.439 and 1.893, and the fluctuation range of characteristic values of each indicator is ranked as C6 > C1 > C4 = C3 > C9 > C7 > C10 > C2 > C11 > C5> C12 > C8. The characteristic values of the four indicators, namely segment crack C6, segment settlement C1, segment misalignment C4, and segment opening C3, fluctuate significantly, while the other indicators fluctuate less. The continuous deterioration of the C1, C3, C4, and C6 evaluation indicators will lead to a decrease in the structural health evaluation grade of the TBM diversion tunnel, directly affecting the normal operation of the tunnel. When the normalized evaluation index value exceeds 0.8, the change in grade characteristic values is more obvious. Among them, the sensitivity ranking of indicators with higher volatility in characteristic values is C6 > C1 > C4 = C3, and the sensitivity ranking of indicators with lower volatility is C9 > C7 > C10 > C2 > C11 > C12 > C5 > C8. Therefore, the C1, C3, C4, and C6 evaluation indicators can directly affect the health evaluation grade of the TBM diversion tunnel structure. In the later stage of tunnel monitoring and maintenance, the evaluation indicators C1, C3, C4, and C6 should be focused on.
Based on the monitoring data of a TBM diversion tunnel project, this paper conducts a comprehensive evaluation study on the structural health of the diversion tunnel and proposes a health evaluation method based on the AMV. The variable weight of this method was compared with the fixed weight of AHP, and the closeness degree and eigenvalues calculated by the AHP and AMV method were compared. Through sensitivity analysis of each evaluation indexes, key indicators affecting the structural health of the diversion tunnel were identified, and the following conclusions were drawn: By combining the AHP, the Matter Element Extension Model, and the Variable Weight Theory, the impact of indicator changes on indicator weights was explored. Based on the AMV and AHP, a health evaluation was conducted on typical sections of TBM diversion tunnel engineering (Pile number SD3 + 730∼SD3 + 843). The results showed that variable weight is more practical and accurate than fixed weight. The structural health assessment levels of TBM diversion tunnels were calculated using AHP and AVM methods, with the grade characteristic values of 1.589 and 1.695, respectively. The diversion tunnel grade is more inclined towards B-grade basic safety status. Except for the evaluation indicators of concrete strength C9 and slurry properties C12, the variable weight values and grade characteristic values of other evaluation indicators increase with the increase of indicator values, with the variation amplitude of variable weight values and grade characteristic values respectively ranging from 0.122 to 0.597 and 0.439 to 1.893. The key indicators include “segment settlement C1, segment opening C3, segment misalignment C4, and segment crack C6”, which are sensitive to the structural health of the TBM diversion tunnel and directly affect the health evaluation level of the tunnel. In the later stage, special attention should be paid to tunnel monitoring and maintenance.
In the future, the AMV method will be improved to further enhance the precision of health assessments for the diversion tunnels. Additionally, the refined method will be extended to the health evaluation of engineering structures in other fields.
Footnotes
Acknowledgments
The research was funded by the National Natural Science Foundation of China (52279133).