
Abstract
Demand prediction for shared bicycles based on historical trip data helps bicycle management organizations plan the scheduling of bicycles. However, the current prediction methods have the following problems: (1) the bicycle trip station data hides the temporal and spatial information, which is crucial for demand prediction, and the traditional methods cannot effectively use that information. (2) each bicycle organization manages its region, and local region data cannot accurately predict the demand of the whole region. Due to the privacy trip data, organizations cannot share raw data directly, which makes it a challenge to achieve federated multi-participant analyses. To address these issues, we propose a federated learning framework for demand prediction of shared bicycles (FedCGAT). Firstly, we propose a spatio-temporal graph neural network based on an attention mechanism for feature modeling of data. Meanwhile, we propose a graph data augmentation method to eliminate noisy data and capture spatial correlations. Then, we construct an auxiliary task based on contrastive learning to assist model training, which can learn the data features fully. Finally, we conducted experiments on two real-world bicycle datasets. The experiments demonstrate that FedCCAT achieves high prediction accuracy while preserving data privacy. Compared to the best-performing baseline model on both datasets, our model achieves reductions in MAPE values of 1.67% and 1.94%, respectively.
Keywords
Introduction
Data-driven Intelligent Transport Systems (ITS) aim to enhance people’s lives through various methods of data collection and processing [1, 2]. Bicycle Sharing Systems (BSS) represent a significant component of ITS, they have been demonstrated to alleviate traffic congestion and improve last-mile connectivity with public transport [3]. With the advancement of mobile communication networks and the widespread adoption of mobile devices [4], shared bicycle usage has become more accessible, leading to a proliferation of organizations offering related services. Bike management organizations can improve bike scheduling and reduce resource wastage by collecting user journey data for bike demand forecasting. Nevertheless, due to the limited availability of data, these organizations often encounter challenges related to prediction accuracy. Moreover, accurate demand prediction on a large scale often requires data sharing among multiple organizations. Since trip data contains sensitive user information, organizations are obligated to restrict the sharing of such data. Hence, a key challenge lies in conducting joint multi-organization demand forecasting for bike sharing while ensuring the protection of user privacy.
In the early stages, the issue of bike-sharing demand prediction was approached as a time series problem. Researchers primarily investigated this using statistical modeling methods [5, 6]. In order to tackle more intricate traffic data, deep learning-based traffic prediction methods have experienced significant advancements in recent years. Researchers first tried based on Recurrent Neural Network (RNN) and Convolutional Neural Network (CNN) methods [13–15], but the accuracy is often poor due to the inability to effectively capture spatial information in complex data topologies. As an advanced deep learning technique, Graph Convolutional Network (GCN) effectively solves the difficult problem of capturing spatial information of traffic topology [7]. GCN-based methods have been effectively used in the field of traffic prediction [16–20]. Researchers have considered different realistic factors and proved the applicability of spatio-temporal graph neural networks in traffic prediction.
While GCN-based models can be effectively utilized for traffic prediction, existing methods still exhibit certain limitations. These limitations include the potential presence of noise in the graph topology, which is often overlooked by current approaches, and the insufficient consideration of deep spatio-temporal information. Consequently, these factors impact the accuracy of these methods. Additionally, existing methods tend to heavily rely on centralized training with large-scale data. However, in Bicycle Sharing Systems (BSS), extensive public travel data are typically collected by various providers, including government organizations and private companies. These trip data often contain personal information, raising potential privacy concerns in data exchange. Consequently, many organizations opt to store data locally to avoid sharing, posing a challenge for collaborative multi-organization efforts to train more effective predictive models.
To address the aforementioned issues, we propose a framework called federated spatio-temporal contrast graph attention network (FedCGAT) for demand forecasting in shared bicycle systems. Specifically, we introduce the Federated Learning (FL) technique to facilitate collaborative training among multiple organizations, enabling them to jointly train an effective demand prediction model without sharing data. We validate the effectiveness of the framework across different settings, including variations in the number of clients and data distribution methods. To ensure accurate traffic demand prediction while safeguarding user privacy, the framework integrates our proposed Contrastive Graph Attention Mechanism (CGAT) method. In CGAT, we introduce a personalized graph augmentation method to address the noise problem in traffic data. Additionally, by combining spatio-temporal attention mechanisms and comparative learning methods, CGAT achieves deep spatio-temporal information mining. In this configuration, FedCGAT enables effective joint forecasting of demand for shared bikes without compromising privacy.
The main contributions of this paper are as follows: We propose the FedCGAT framework, which safeguards the privacy of data from each bicycle management organization while allowing multiple organizations to collaboratively train more accurate demand prediction models. We propose a demand prediction method based on the Contrastive Graph Attention Mechanism (CGAT), integrated into FedCGAT. This method utilizes personalized graph augmentation to eliminate noise and combines contrastive learning methods with attention mechanisms to focus on deep spatio-temporal information, enabling each client to effectively capture data features. We validate the performance of the proposed algorithm on two real-world datasets. Through experiments conducted in diverse scenarios, we demonstrate that FedCGAT achieves satisfactory shared bike demand prediction results while ensuring data privacy protection.
The rest of this paper is organized as follows. Section 2 mainly introduces the related work. Section 3 describes the demand prediction problem of shared bicycles. Section 4 describes the CGAT algorithm’s principle and the FedCGAT framework’s design. Section 5 focuses on verifying the performance of the CGAT algorithm and FedCGAT framework. Section 6 concludes the paper.
Related work
Time series prediction methods for shared bicycle demand
Accurate travel demand prediction is a crucial way to ensure the rational operation of urban transportation systems. Researchers mainly used machine learning and time series methods in the early days. For example, Lin et al. [8] proposed a stacked model SMVP based on XGBoost for predicting traffic changes in public bicycles. Xu et al. [9] proposed a machine learning model based on hybrid edge computing, which predicts the bicycle demand at each station by constructing a regression tree.
Due to the large amount of traffic demand data and variable characteristics, traditional time series methods can no longer meet prediction accuracy requirements. In recent years, deep learning has been applied in transportation demand prediction due to its ability to handle complex nonlinear relationships better. To model complex time dependencies, Chen et al. [10] predicted each bicycle station’s real-time rental and return demand based on different architectures of RNN. Wang et al. [11] combined Long Short Term Memory Network (LSTM) and Gated Recurrent Unit (GRU) to predict the number of short-term available bicycles at docking stations. Jiang et al. [12] also proposed a bi-directional GRU method based on point-trajectory classification to infer traffic patterns from GPS trajectory data. However, these methods only focus on temporal dependence and ignore the spatial correlation between traffic sequences.
Some recent studies have converted traffic regions into a two-dimensional grid. These methods used CNN to capture spatial correlations between neighboring regions and used RNN to model spatio-temporal dependencies simultaneously. For example, Zhang et al. [13] proposed ST-Resnet, which added external factors such as weather and holiday events for spatio-temporal feature modeling. Yao et al. [14] proposed DMVST-Net, which used the CNN method to handle spatial dependencies and used the LSTM to model temporal relationships. Li et al. also [15] proposed an STMN network to predict bicycle usage, this method extracted spatial features via CNN and captured correlations on time series using LSTM.
However, the grid-based structure cannot effectively capture spatial information about station topology, and CNN cannot effectively analyze non-Euclidean structure data. When the grid granularity is inappropriate, the problem of having no stations in the grid or dividing several stations into the same grid occurs. The station-based zoning approach is more reasonable and effective than the grid-based zoning approach.
Traffic prediction method based on GCN method
The traffic region is viewed as a topological map in station-based traffic prediction. Since GCN can extract the traffic information of a region more efficiently, researchers are turning to study prediction methods based on GCN models. Yao et al. [16] proposed STGCN, which combines spectral-domain GCN with gated convolution to express the problem on a graph and build the model using the complete convolution structure, which leads to faster training and fewer parameters. Zhao et al. [17] proposed T-GCN, which combines GCN and GRU for capturing spatial and temporal dependencies, respectively. Li et al. [18] proposed DCRNN, which extends GCN to directed graphs by replacing matrix multiplication in GRU with diffusion convolution. In a recent study, Guo et al. [19] proposed a new spatio-temporal graph convolutional model to develop a spatio-temporal attention mechanism to learn dynamic spatio-temporal correlations of traffic data. Song et al. [20] paid attention to the spatio-temporal data heterogeneity and designed several model modules based on different periods.
Traffic demand forecasting based on GCN methods can capture spatio-temporal correlations relatively effectively. However, most existing methods require centralized collection of a large amount of data followed by model training. However, in practical applications, different participants have their traffic data. Since trip data contains sensitive privacy information and trade secrets among participants, the participants cannot share the raw data, which makes it challenging to collaborate among multiple participants to train robust models.
Privacy protection in intelligent transport system
In ITS, most traffic demand forecasting methods are mainly based on data-driven, and data exchange between users and organizations may reveal private information. Privacy in ITS has been a concern for researchers [24]. To protect privacy in ITS, Zhou et al. [25] proposed a privacy-preserving method for measuring the traffic flow of cyber-physical road systems, which uses Maximum Likelihood Estimation (MLE) to make predictions. Sucasa et al. [26] proposed an autonomous privacy-preserving authentication method where vehicles can hide their information using pseudonyms. Ogundoyin et al. [27] proposed a secure ITS motion analysis scheme allowing participants to generate key pairs. However, these methods only use some encryption methods to protect data security and can only partially solve the privacy protection problem. At the same time, the computational efficiency is very low when dealing with huge amounts of data.
Google first proposed Federated Learning (FL) as a decentralized machine learning paradigm [28] that can adapt well to big data scenarios. This method replaces the exchange of raw data by sharing the global model across clients. These clients can use local data to train a global model with high generalizability collaboratively. Unlike traditional decentralized machine learning approaches, FL protects sensitive data privacy and reduces communication overhead, and thus is rapidly gaining popularity in the research community. Some data processing methods have also started to integrate with federated learning. In ITS, FL has good applicability. The methods in ITS are also instructive for the optimization of federated learning [29]. Xu et al. proposed a Hessian Regularized Spatiotemporal Low Rank (HRST-LR) algorithm to solve the problem of missing traffic data [30]. Some methods have been innovatively improved based on federated learning. Xu et al. [31] built a federated parallel data platform to support dynamic data analysis and decision making. Zhang et al. [32] introduced an adjacency matrix preservation method based on differential privacy. Chen et al. [33] designed a blockchain-based federated learning framework that ensures the trustworthiness of the federated computational process. Yuan et al. [34] proposed a federated deep learning method based on a spatio-temporal long short-term network (FedSTN) and designed three network modules to predict traffic flow. Zhao et al. [35] proposed a client selection method based on reinforcement learning to select trustworthy clients adaptively for global model fusion. Chen et al. [36] proposed a malicious client identification method based on client logit features to improve the security of federatedlearning.
In summary, considering the problems and shortcomings of the existing demand prediction methods for bike sharing, we combine federated learning to conduct a study on privacy-preserving demand prediction for bike sharing.
Preliminaries
In this section, we first describe the shared bicycle demand problem for a single organization. Then, we describe the federated demand prediction problem between multiple organizations.
Demand prediction for shared bicycles in transport network
Assume the city B contains N disjoint regional stations, and the user’s trip is from a departure station to a return station. The bicycle station distribution graph can be regarded as an undirected graph G, where
Bike-sharing demand prediction is a time-series prediction problem. We define the demand of the n-th station at the t-th time step as
In the previous section, we defined the demand forecasting problem for a single organization. This section will focus on the federated demand forecasting problem for multiple organizations. We can use a federated learning approach to solve the joint demand forecasting problem. Each organization is treated as a client in a federated learning scenario. All clients train a global model collaboratively without sharing local raw data. We define the federated learning scenario as follows.
Defining the clients participating in this federated learning task, and the set of all clients is denoted as C, where C = {C1, C2, . . . , C L }, and L denotes the number of clients. Different organizations own the user trip data in different regions. The private data owned by client C i is defined as D i . The trip data of all clients are represented as D g = D1 ∪ D2 ∪ ⋯ ∪ D L , reflecting the transportation demand of the whole city at a certain time. We define the local model trained by the i-th client as M i , then the set of clients’ model is defined as M = {M1, M2, ⋯ , M L }.
We define a server trusted by all clients to collect the models uploaded by all clients in each round of communication. Then, the server fuses the global model with a specific model aggregation algorithm. Finally, the server distributes the global model to each client. Since the federated learning approach only uses the models of each client and does not use the raw data of each client, it can solve the privacy problem of the user’s data.
This paper uses the FedAvg algorithm [28] as the global model aggregation algorithm. The algorithm fuses the client models with the average weighted method, in which the server calculates the fusion weight according to the number of client samples. Then, the server uses this weight to fuse all the client’s model parameters and calculates the global model parameters. In the whole federation process, each client C
i
only performs local training to learn a local model M
i
, which can get the global M
g
after the joint training. We express the process as the Equation (2).
In this paper, we focus on two problems: the problem of demand for shared bicycles in a single organization and the problem of federated demand forecasting among multiple organizations. To solve these two problems, we propose the CGAT algorithm to solve the single-organization demand prediction and the FedCGAT framework to solve the federated demand prediction problem. In the subsequent sections, we will introduce the CGAT algorithm and the FedCGAT framework.
Bicycle sharing demand forecasting model CGAT
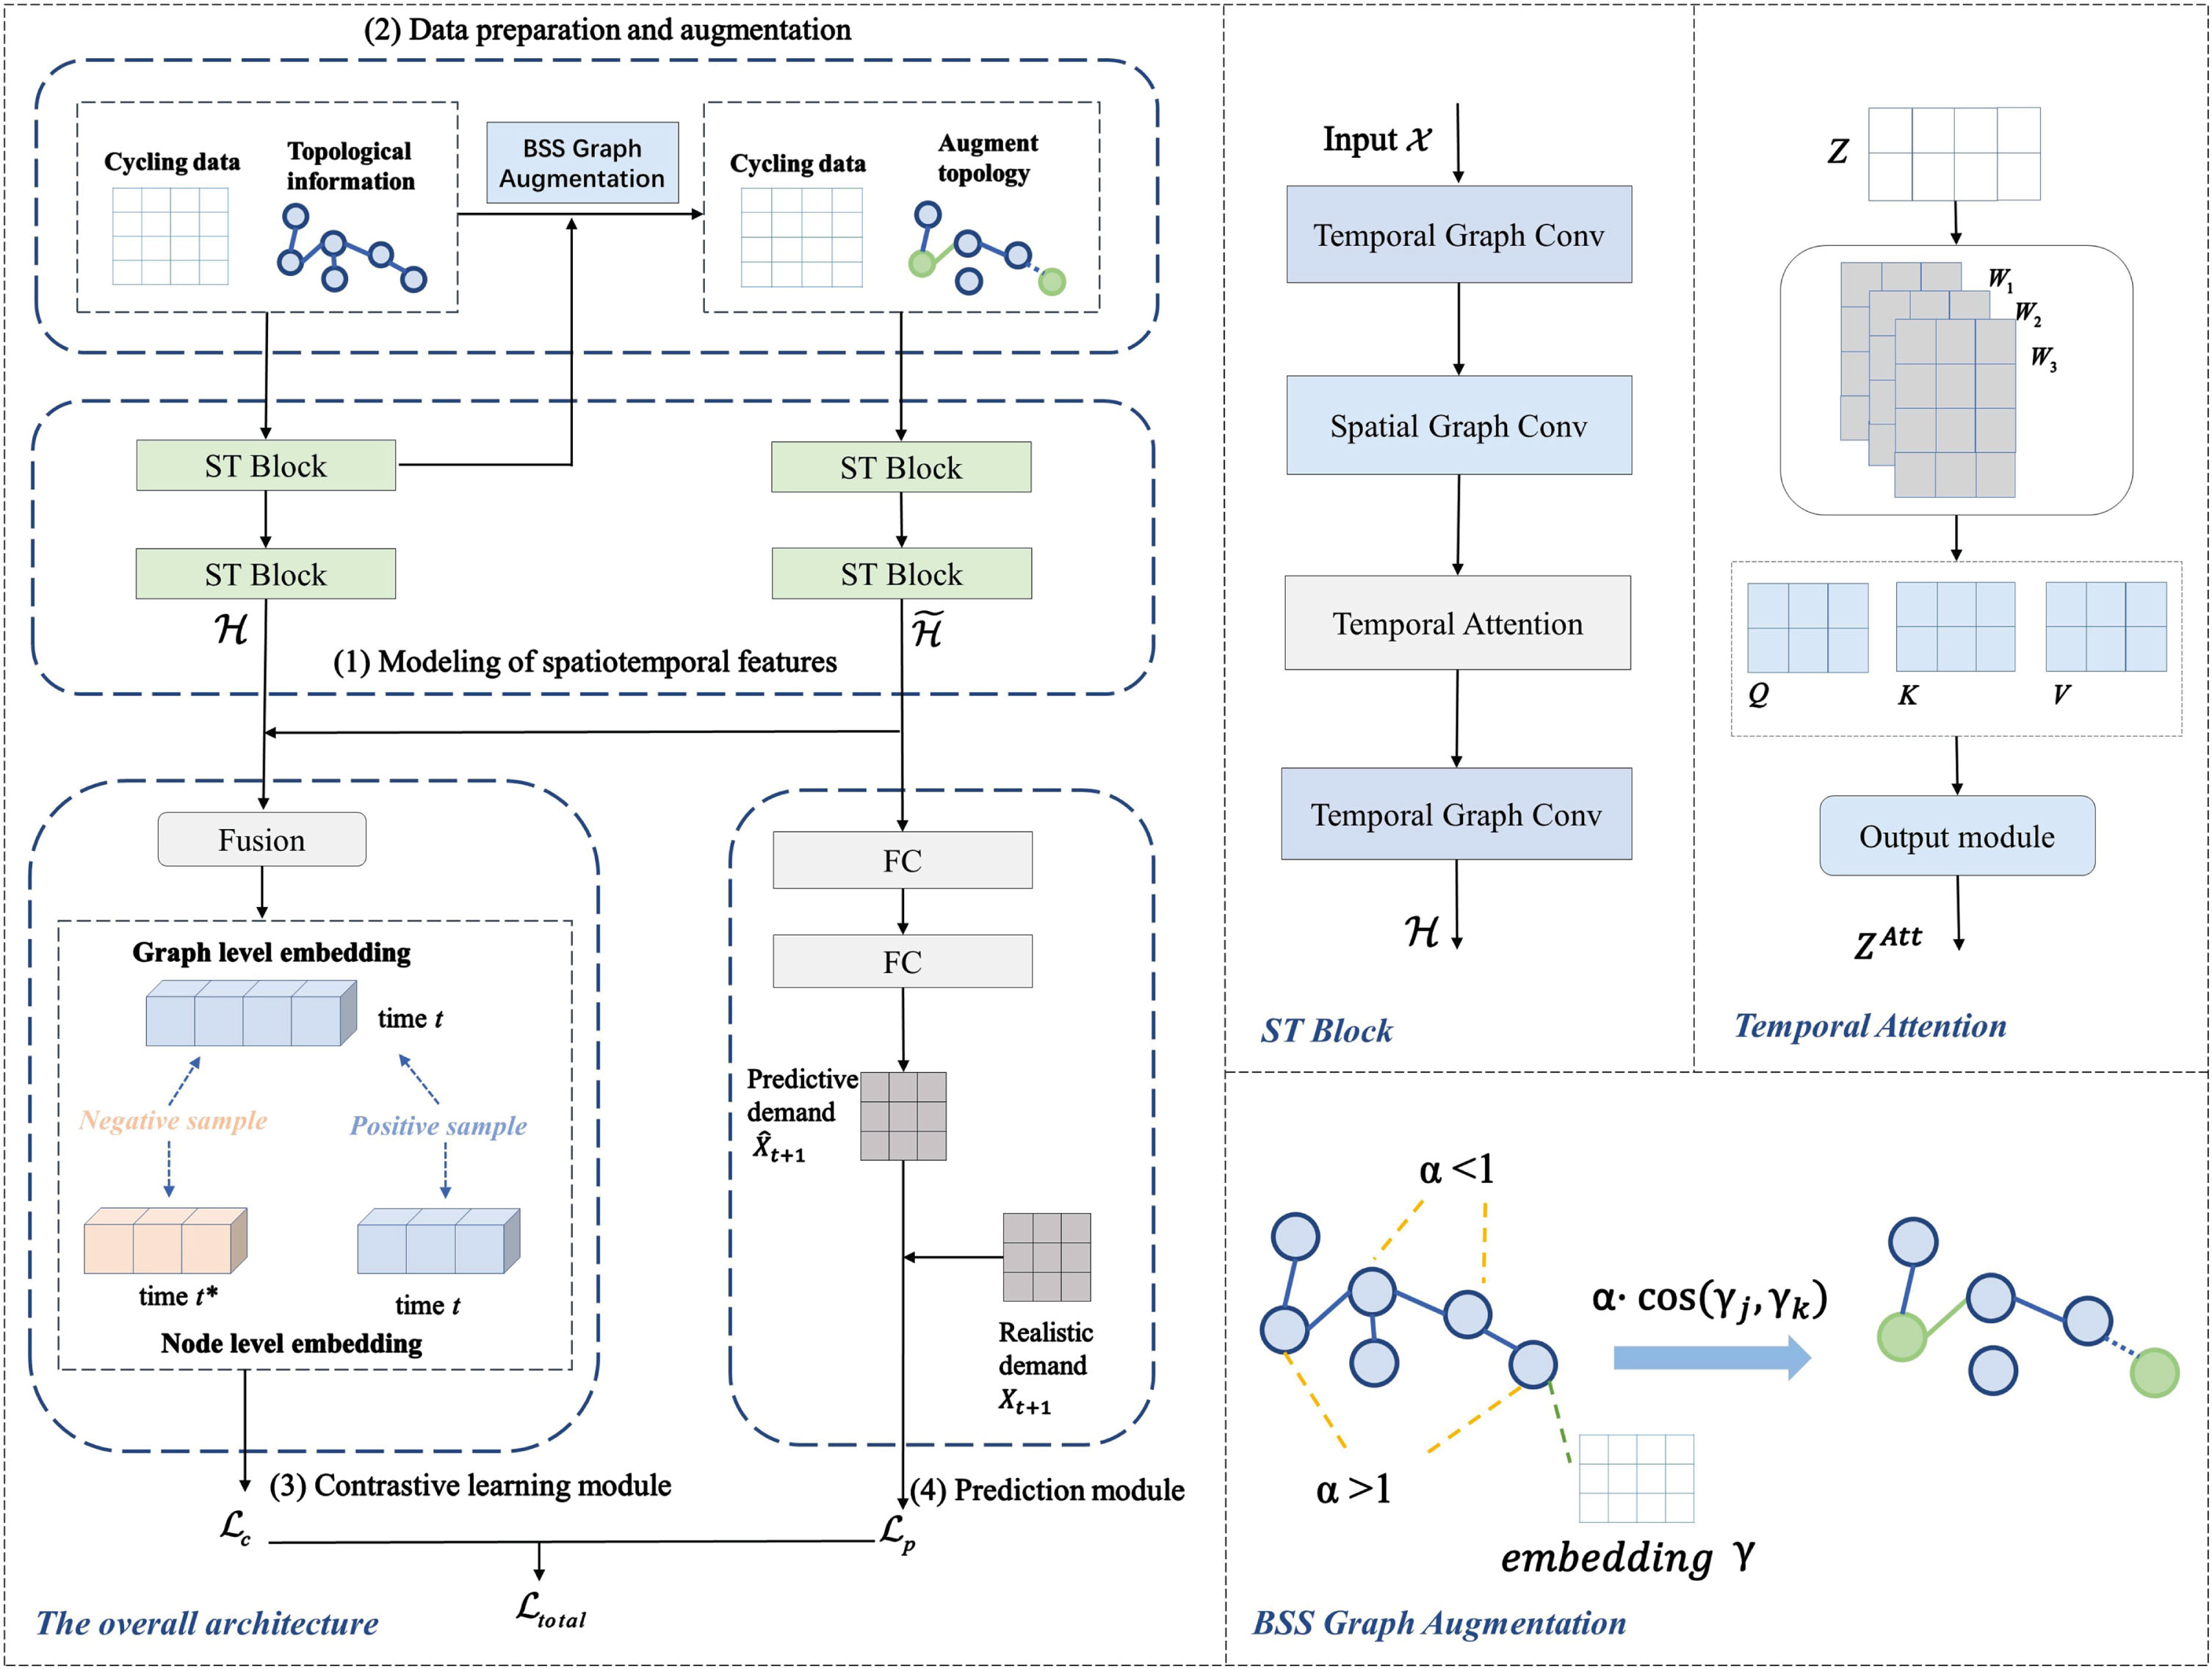
This section describes the design of the prediction CGAT algorithm and each module of CGAT. The overall architecture of the model is shown in Fig. 1.
The overall architecture of CGAT.
To model the spatio-temporal features of the data, we propose a spatio-temporal information building block ST-Block with an attention mechanism, as shown in Fig. 1(1). Inspired by [16], we design a four-layer structure, which includes the TGC temporal information coding layer, the SGC spatial information coding layer, and the TA temporal attention module. The hierarchical structure is denoted as TGC→SGC→TA→TGC. The structure uses alternating convolution to mine spatio-temporal correlations, which can capture features from both spatial and temporal domains. We also add a TA temporal attention layer to mine deep information.
Specifically, in the temporal information encoding part, the TGC layer uses a convolutional structure with a gating mechanism to capture the temporal variability of the demand, containing a causal convolution and a Gated Linear Unit (GLU). Taking as input a demand sequence of m time slices
Where
The middle layer (SGC) is a spatial graph convolution layer based on Chebyshev polynomials. It is a bridge connecting the upper and lower layers and realizes fast propagation from graph convolution to spatial state using spatial convolution. For the embedding information of the time step t, the spatial domain information fusion using the SGC module is obtained as Equation (4).
The purpose of the
Correlation between demand conditions in different time slices. We use attention mechanisms to capture temporal dynamics and adaptively assign different importance to data. Formally expressed as Equation (5).
The
There is spatial information hidden in the topology map of bike-sharing stations. On the one hand, two spatially distant stations may have similar demand patterns, and these spatial correlations cannot be obtained directly from the raw data. On the other hand, bike sharing is more suitable for people’s short trips than taxis, and each trip tends not to cross many stations. Therefore, the number of trips between two neighboring stations will be larger, which may contain potential demand correlations. However, if the difference in demand patterns between two neighboring stations is too large, it produces noisy data. To capture the potential demand correlations of nodes while counteracting the noise perturbation, we design a graph augmentation method for bike-sharing data, as shown in Fig. 1(2). We will accomplish this function in three steps described in detail below.
(1) Obtain the node demand at time t: In this step, our goal is to obtain the demand of the node. We define
Where
(2) Calculate the similarity of nodes: In this step, we will calculate the correlation between the nodes. We use the embedding value from the previous step as a feature of the nodes and then use the following improvement cosine similarity method to calculate the correlation between two nodes, for any two nodes j, k in the spatio-temporal graph, the correlation of two nodes is calculated using Equation (8).
Where α is an adjusθ parameter that responds to the potential correlation of demand between two neighboring stations, for two neighboring nodes, set α > 0; otherwise, α = 0. R denotes the demand correlation of two nodes. For two nodes j and k in the graph, the larger the value of Rj,k, the higher the demand correlation between the two nodes.
(3) Graph structure optimization: Once we have calculated the correlation coefficient value of the two nodes, we modify the graph structure based on this value. If the two nodes are not adjacent and the correlation is high (Rj,k > 0), edge ej,k is added between the nodes. If the two nodes are neighboring and the demand correlation is still small (Rj,k ≤ 0) after adding the α parameter adjustment, the edge ej,k ∈ E of the node is masked.
With the above graph augmentation method, the CGAT model not only focuses on the unique data distribution characteristics of the bicycle sharing data but also eliminates the noise effect of useless edges and captures the spatial dependency between nodes. The augmented graph can be expressed as
Contrastive learning is an essential part of self-supervised learning, and in [37], the authors used self-supervised learning methods to predict traffic flow. Inspired by [37], to fully allow the model to learn spatio-temporal features, we construct a contrastive learning task to assist in model training in this section. We will accomplish this function in the following three steps. The process is shown in Fig. 1(3).
(1) Get the node-level embedding information: The embeddings obtained for the original data and the augmented data after the second ST-Block are
Where
(2) Get the graph-level embedding information: the graph-level embedding
Where
(3) Constructing sample pairs and computing the loss function: For each client, node-level and graph-level embedding under the same time step t are selected as positive sample pairs to achieve a holistic focus on spatial demand patterns. The local and global embedding under different time steps t and t* are selected as negative sample pairs to capture the heterogeneity of demand at different time steps.
The contrastive learning assistance task for demand prediction of shared bicycles requires optimizing the following cross-entropy loss expressed in Equation (11).
Where W4 is a matrix of parameters that can be learned, and t* represents t different arbitrary time steps.
We have extracted spatio-temporal features, optimized graph structure, and obtained a contrast loss in the first three stages. In this stage, we aim to use this information to predict the demand for bicycles. Fig. 1(4) shows the demand prediction module.
We aim to output the demand for bicycles at a given moment through a predictive model. We define the problem as the Equation (12).
The
We have obtained the embedding information
We use the sum of the two losses to calculate the total loss. As shown in Equation (13), we define the loss of the prediction task as
Where
The β is a hyperparameter to adjust the weights of the two losses. The model training is performed via a backpropagation algorithm. Finally, we can get the optimal parameters of the W-matrix by minimization loss.
In this section, we integrate the CGAT algorithm into federated learning and propose a privacy-preserving demand prediction method for shared bicycles (FedCGAT). We use the FedAvg algorithm to fuse the global model on the server. The client only needs to upload the model parameters to the server without exposing the local private data. This way, multiple bike-sharing organizations can jointly train and obtain a predictive model with good results while avoiding privacy leak issues.
The overall architecture of FedCGAT is shown in Fig. 2. Given a set of clients C = {C1, C2, . . . , C L }, the global trip data is represented as D g = D1 ∪ D2 ∪ . . . D L , and the data private to each client is D i . The number of samples of each client’s data D i is denoted as S i .
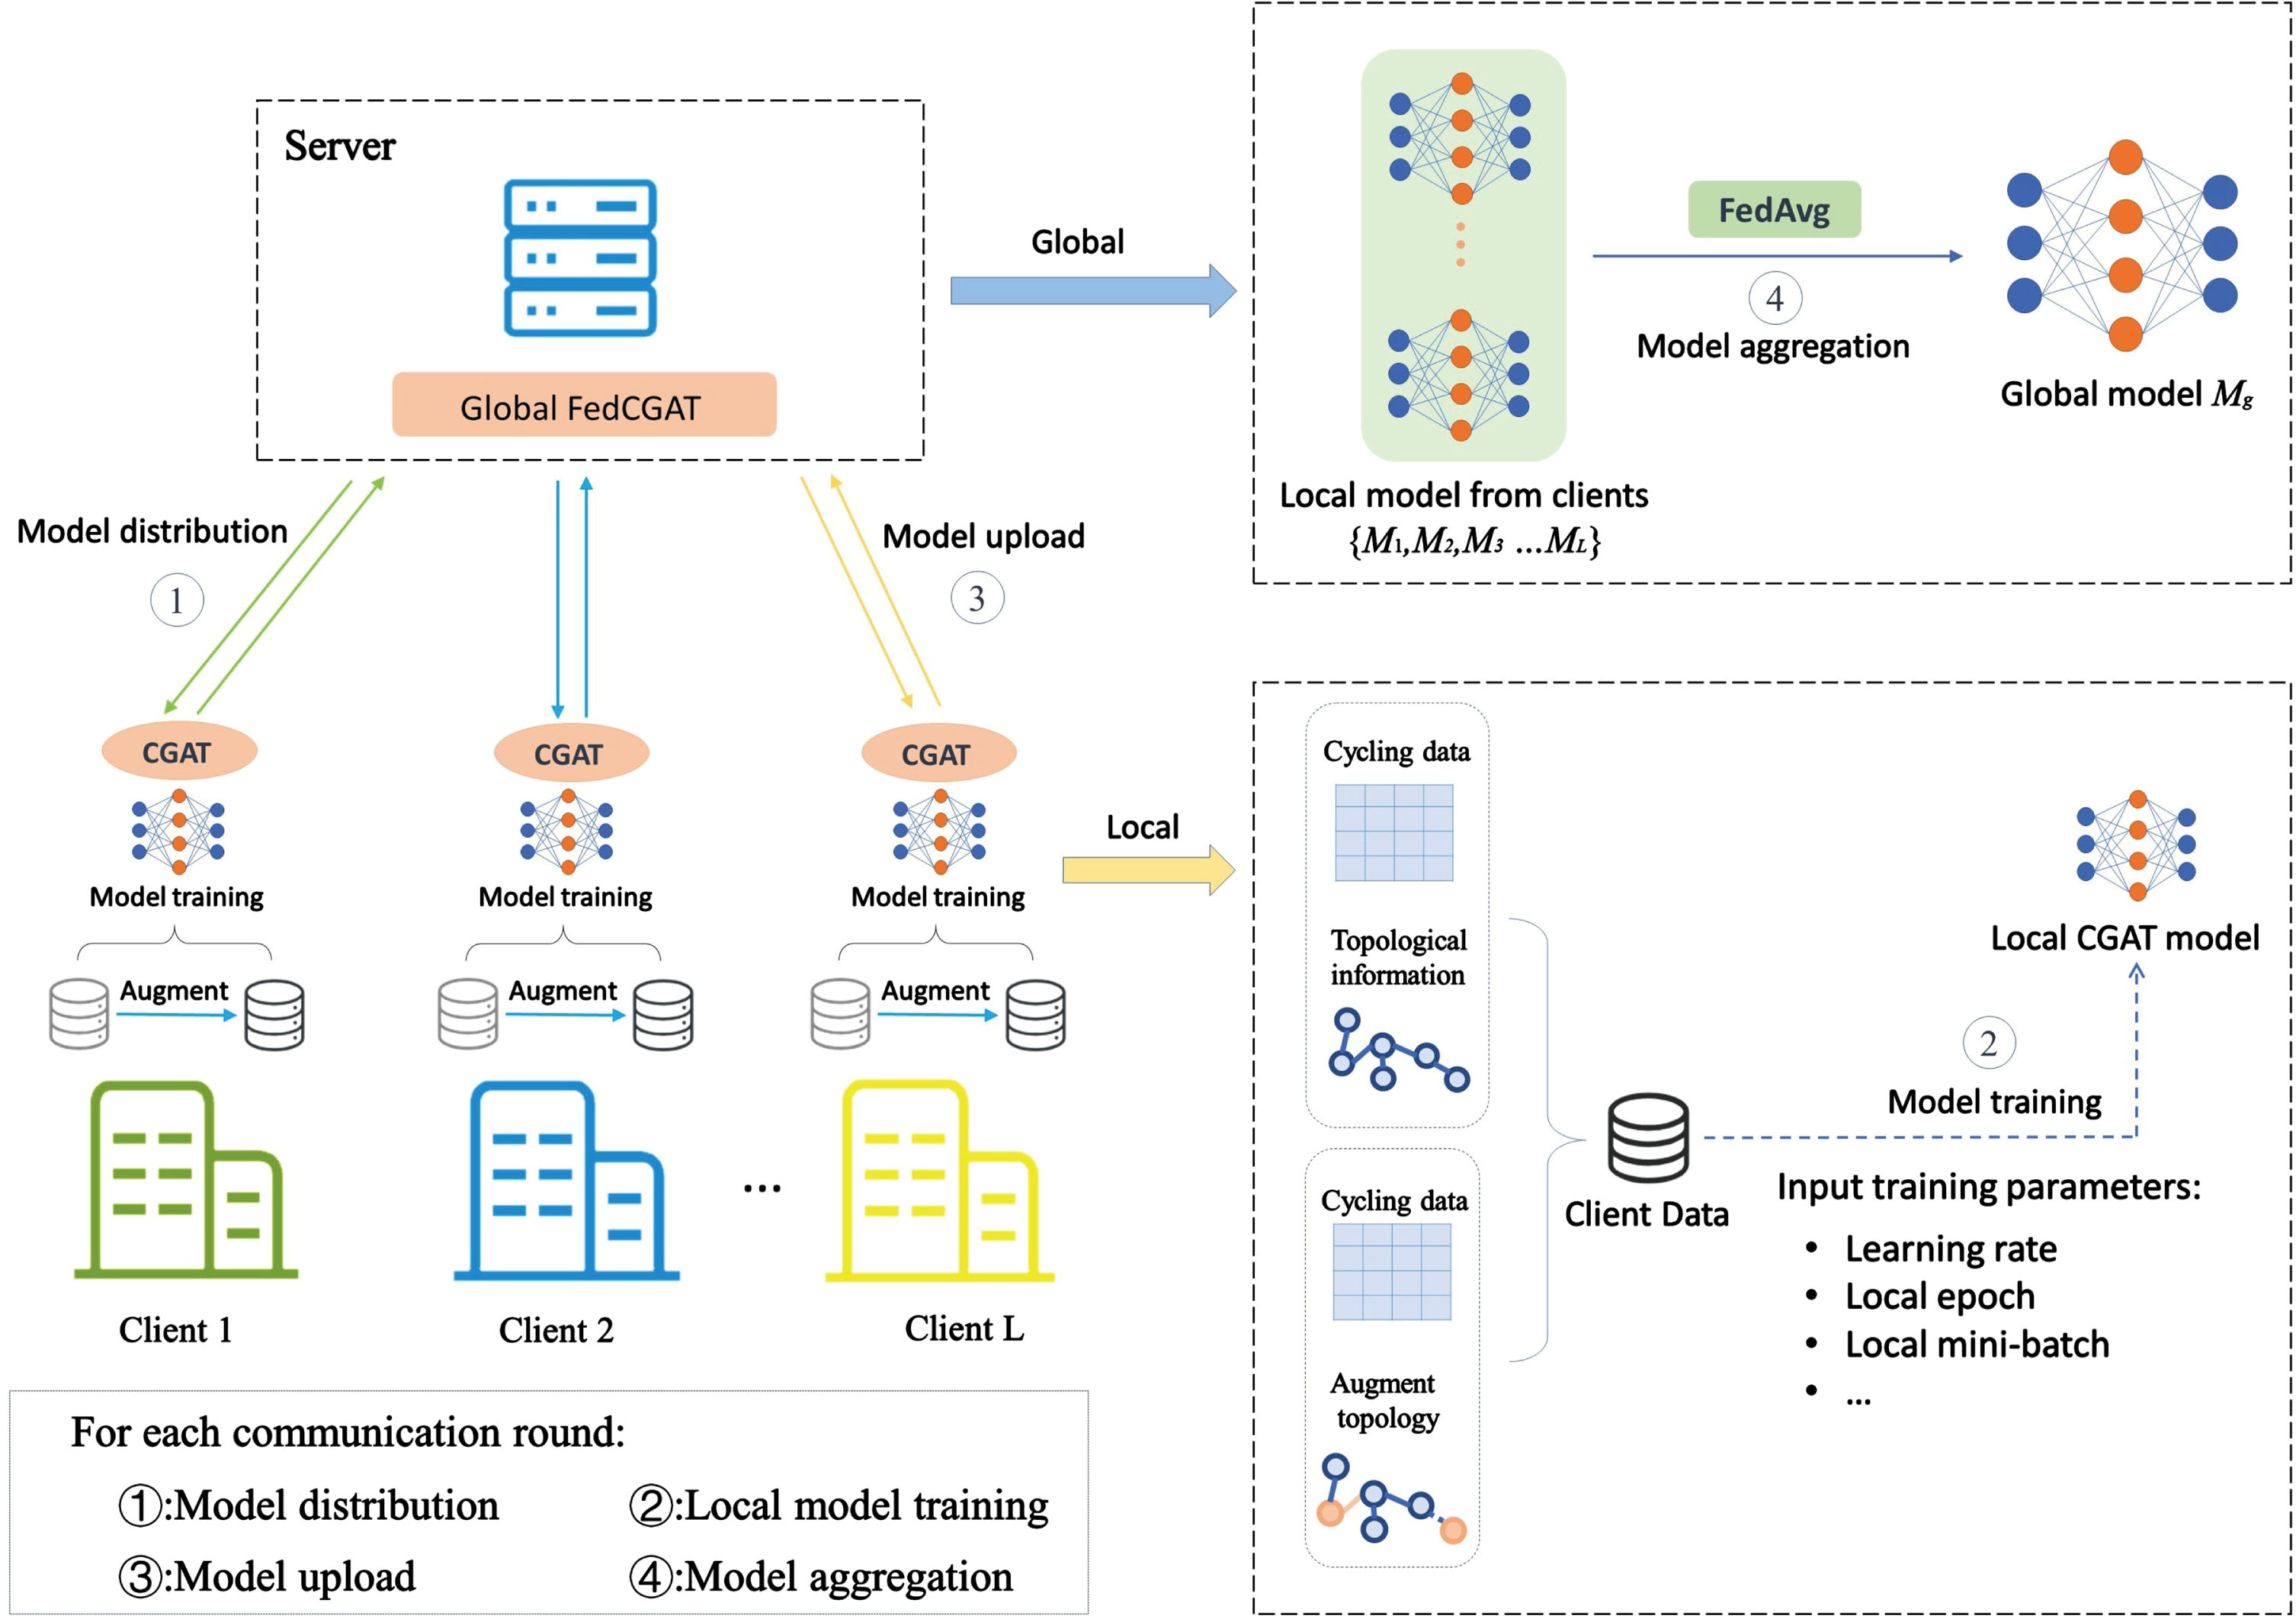
The overall architecture of FedCGAT.
For every communication round of federated learning, the client uses the most recent global model from the server to initialize the local model. Then, each client uses the local data D
i
to train the local model. We define the i-th client model at the j-th round as
After finishing local model training, each client uploads model M(j) to the server. Then, the server aggregates the received model parameters to get a new global model. The process is shown in Equation (15).
Where S
i
is the number of data samples used by a client, and S
g
is the sum of data samples of all clients, as shown in Equation (16). Specifically, as in Fig. 2 and Algorithm 1, the working process of FedCGAT includes the following four phases. Model distribution phase: The server sends the global model M(j) to each client C
i
via broadcast, with j indicating the global round it is currently in. Before the first round begins, the server will initialize a model M(0). Local model training phase: Each client C
i
uses the global model distributed by the server to initialize the local model M
i
. Then, each client uses local data D
i
to train local model Model upload phase: Each client C
i
uploads the trained model parameters Model aggregation phase: The server collects all client model parameters
1: Initialize global model parameters M(0)
2:
3: Broadcast the current global model M(j) to each client
4:
5: Initialize local model M i for the current epoch ← M(j)
6:
7:
8: Aggregate local model parameters to get the new global model
9:
Repeat the above steps in a federated task until all the communication rounds are finished. In the next section, we will evaluate the performance of FedCGAT for demand prediction of shared bicycles through specific experiments.
We use two real-world datasets and conduct a three-part experiment in this section. We first validate the performance of the CGAT algorithm and compare it with eight baselines. Then, we design different scenarios in a federated environment and verify the performance of the FedCGAT algorithm under different data distributions. Finally, we verify the performance of each module of the CGAT and FedCGAT algorithms through ablation experiments.
System configuration
Dataset description
The experiments are conducted based on two real-world bicycle-sharing trip datasets. The details are described below.
Bike share trip data includes trip duration, start station IDs, end station IDs, and time information. The detailed statistics of the dataset are summarized in Table 1.
Dataset description
Dataset description
The experiments are conducted using a workstation with Intel(R) Core(TM) i7-10700 CPU @3.80GHz, 64G RAM, and GeForce RTX 3090. The algorithms are designed based on PyTorch 1.10.0 and CUDA version 11.3 environments, and we have also developed a federated learning simulation program for federated learning experiments.
Metrics
The performance of each algorithm is verified using two metrics, Mean Absolute Error (MAE) and Mean Absolute Percentage Error (MAPE), defined as Equations (17) and (18).
Experimental configuration
In this section, we utilize CGAT for shared bike demand prediction. The experiments employ spatio-temporal convolutional kernels of size 3 for ST-Blocks. The datasets are split into training, validation, and testing sets in an 8:1:1 ratio. During training, we use the Adam optimizer for 100 epochs with a batch size of 64 and a learning rate of 0.001. Similar experimental configurations are adopted for the baseline algorithms, which will be detailed in the following section.
Baselines
The CGAT algorithm is compared to the following eight baseline methods, ARIMA [6]: It is a classical temporal prediction model. ST-ResNet [13]: It uses convolution-based and deep residual networks to model spatial and temporal attributes, respectively. STGCN [16]: It is a neural network structure consisting of spatio-temporal blocks, applying pure convolutional layers to extract spatio-temporal information from graph-structured data simultaneously. ASTGCN [19]: It designs a multi-temporal multiplexing network structure that integrates attention mechanisms with spatio-temporal convolution. STSGCN [20]: It constructs local spatio-temporal graphs that connect individual spatial graphs of neighboring time steps into one graph to extract spatiotemporal correlations. MSSTN [21]: It proposes a multi-scale spatio-temporal network for trajectory prediction using complex local and non-local correlations in the trajectory flow. SDGCN [22]: It uses a state-sharing Hidden Markov Model to capture traffic flow patterns from sparse trajectory data, and proposes a semantic-aware dynamic graph convolutional network for traffic prediction. ST-CGCN [23]: It constructs a distance matrix, a data correlation matrix and a comfort measurement matrix, and proposes method based on spatio-temporal complex graph convolutional networks.
These baselines can be classified into two categories according to the methods used. ARIMA only models the temporal dimension, while all other baseline methods model both the temporal and spatial dimensions.
Result analysis
Following the experimental configuration, the CGAT algorithm is validated on two datasets and compared with eight baseline models, and the experimental results are shown in Table 2.
Performance comparison of FedCGAT with different baselines
Performance comparison of FedCGAT with different baselines
From the experimental results, the ARIMA method based on temporal feature prediction is the least effective. ST-Resnet is based on grid structure while considering spatial features, but it lags behind most of the GCN-based methods in terms of experimental results. The experimental results show that GCN-based methods generally have better prediction results, indicating that GCN does have an advantage in capturing spatial correlation. Among the GCN-based baseline methods, SDGCN achieves the best prediction performance, probably because its dynamic perceptual network focuses on more spatial information.
Compared with the baseline algorithm, our proposed CGAT method can achieve better prediction results. Unlike other methods, CGAT reduces the noise effect based on graph enhancement method, and makes the graph network focus on deeper spatio-temporal features based on contrast learning and attention mechanism. In the experiments based on the BikeNYC14 dataset, CGAT achieves the MAE and MAPE metrics of 5.34 and 24.15%, respectively, which are reduced by 0.15 and 1.67% relative to SDGCN.
In the experiment based on the BikeNYC16 dataset, the MAE and MAPE metrics are reduced by 0.13 and 1.94%, respectively. This shows that CGAT is able to better capture the data features in the bike-sharing prediction scenarios and achieve accurate predictions.
Experimental configuration
In this section, we employ the FedCGAT framework for collaborative shared bike demand prediction across multiple organizations. The experiments involve setting the number of clients participating in federated learning to K, with three different settings (K = 4, 6, 8). For each set of experiments, we set the global communication rounds to 30, considering each completion of model aggregation as the end of one round. During each global communication round, each client conducts local training for 10 epochs using the same training configuration as in Section 5.3. The experiments in this section are conducted using the BikeNYC16 dataset, where the training set is proportionally partitioned among each client, and the Mean Absolute Percentage Error (MAPE) is used to evaluate the experimental results.
Baselines
To assess the efficacy of FedCGAT in multi-organization collaborative demand forecasting, we choose two federated learning-based predictive algorithms as baseline models.
Data distribution scenario description
In federated learning, the manner in which data is partitioned can significantly impact the performance of the global model. To simulate realistic multi-organization collaborative training scenarios, we establish different data distribution setups for experiments. As shown in Table 3, for each client number setting, we set up three data distribution scenarios, including an independent and identically distributed (IID) scenario and two non-independent identically distributed (Non-IID) scenarios. In the IID scenario, we distribute data evenly to each client. In non-IID scenarios, data distribution is relatively uneven among clients. For example, when the number of clients is 4, we set the data distribution Scenario-1 to 6:2:1:1 and Scenario-2 to 4:3:2:1.
Data distribution with different number of clients
Data distribution with different number of clients
The experimental results are presented in Table 4 and Fig. 3. It is evident that across experiments with varying client number configurations, the performance under IID distribution consistently outperforms that of the two Non-IID scenarios. This performance is attributed to the relatively favorable performance of each client’s local model under IID distribution, thereby resulting in high accuracy of the aggregated global model. In Non-IID distribution, Scenario-2 exhibits improved performance to some extent compared to Scenario-1, indicating that the uniformity of data distribution impacts the effectiveness of the global model.
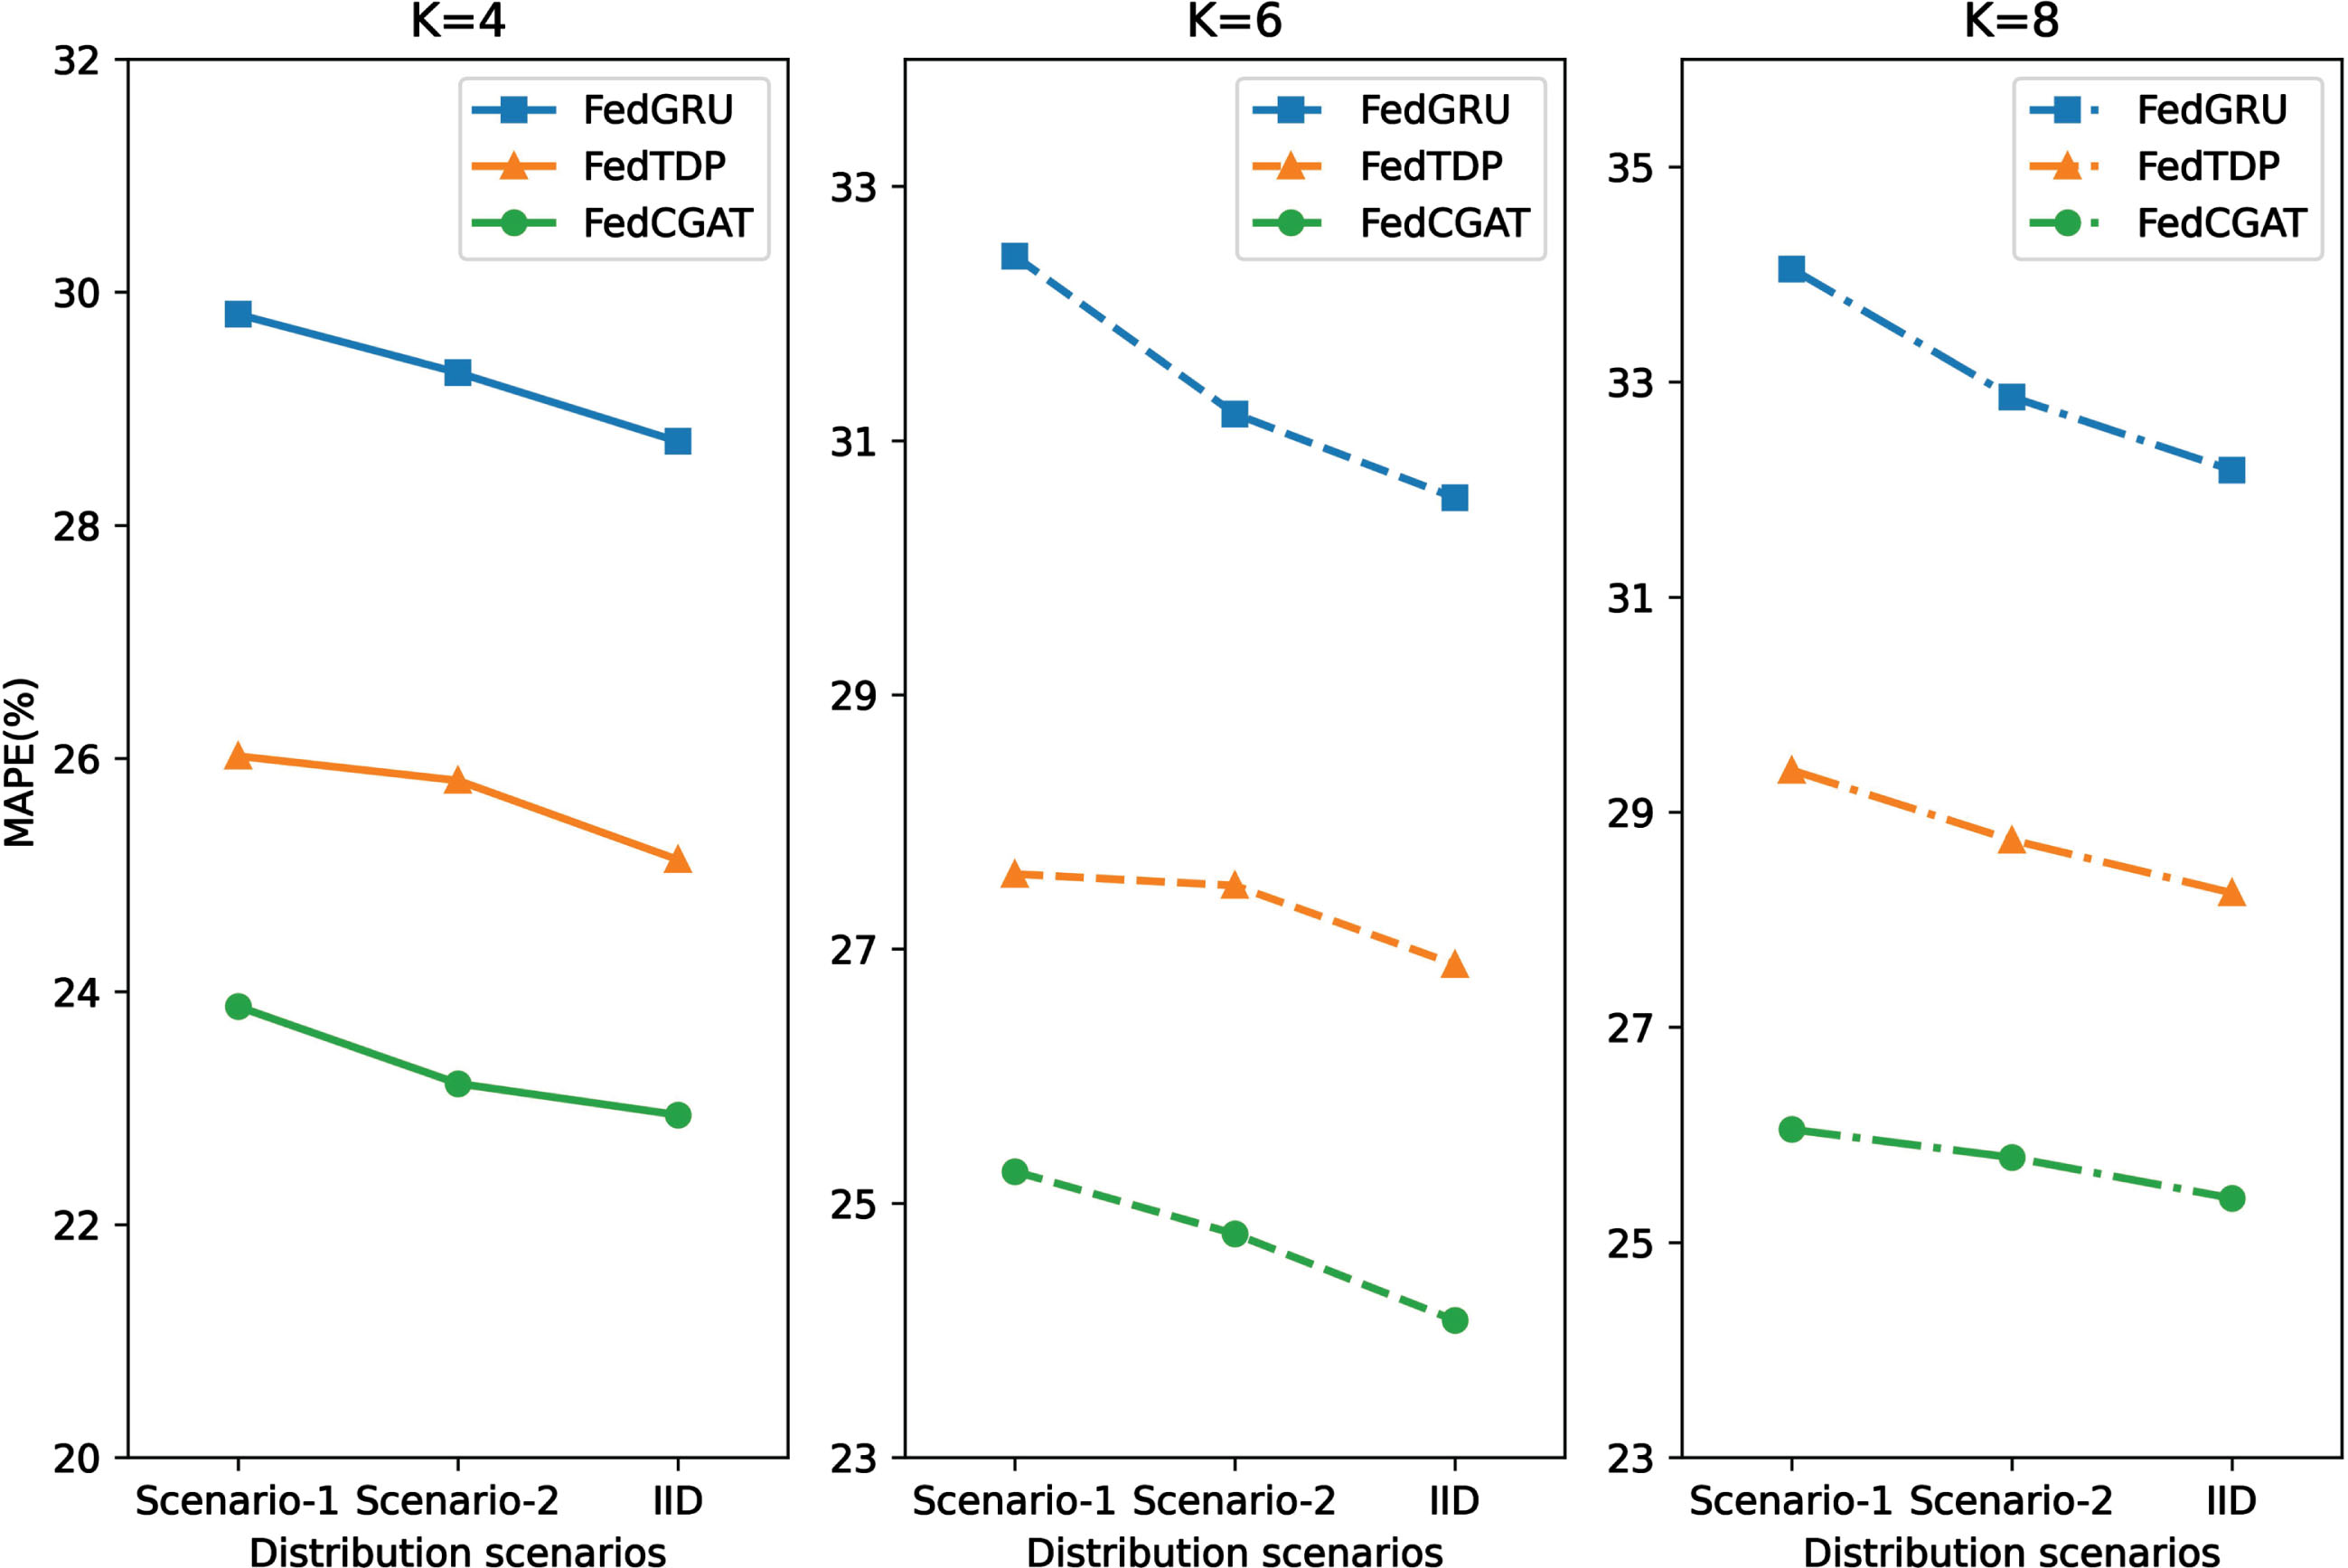
Comparison of model performance under different data distribution scenarios.
Unlike the baseline algorithms, FedCGAT empowers each client to effectively focus on the deep
spatio-temporal characteristics of their respective data, thereby ensuring prediction accuracy. As illustrated in Fig. 3, our FedCGAT consistently outperforms the two baseline algorithms across various client number settings, with reductions in the MAPE metric ranging from 2.2% to 8.0%. Specifically, for K = 4, FedCGAT achieves an MAPE value of 22.94%, surpassing the majority of baseline algorithms described in Section 5.3. This demonstrates that our approach can achieve high prediction accuracy in multi-organization collaborative demand forecasting while preserving user privacy.
As shown in Table 4, it is noteworthy that the effectiveness of all algorithms diminishes with an increase in the number of clients. In the experiment with K = 8, for instance, the MAPE value of FedGRU reaches 32.18%, failing to meet prediction requirements, whereas our FedCGAT achieves 25.41%. This decline in effectiveness can be attributed to the diminishing amount of valid data available for each client to train a valuable model as the number of clients
Comparison of FedCGAT performance in different scenarios
Increases. Additionally, the likelihood of errors during model uploading also escalates. In future work, we will look at how to mitigate the impact of these issues on experiments effect.
Effect of different modules on the performance of CGAT
In the ablation experiments, we perform experiments on the CGAT algorithm and the FedCGAT framework separately, and we verify the impact of each module in the algorithm by eliminating the key modules. The CGAT algorithm consists of two main modules: the prediction module based on the graph-contrast attentional mechanism (V1) and the graph-data enhancement module (V2). We eliminate these two modules separately to perform ablation experiments. At the same time, we also eliminate these two modules in the FedCGAT framework separately to perform the experiments. A detailed description of each version of the algorithm is given below. FedCGAT: A demand forecasting method for shared bikes based on federated spatio-temporal graphical attention networks in Section 4.2. FedCGAT-V1: This variant removes the temporal attention mechanism module of the ST-Block and experiments with it in a federated scenario. FedCGAT-V2: This variant removes the graph augmentation approach for bike-sharing data and experiments in a federated scenario. CGAT: The plain CGAT model without federated learning is described in Section 4.1. CGAT-V1: This variant removes the temporal attention mechanism module of ST-Block and uses all data in one client experiment. CGAT-V2: This variant removes the graph augmentation approach for the bike-sharing data and uses all the data in a single client experiment.
The experimental results are shown in Table 5. With the validation results on both datasets, FedCGAT and CGAT consistently outperform their respective variants. In addition, the metrics of CGAT are always better than that of FedCGAT. The non independent and identically distributed problem of the data across clients leads to decreased global model accuracy. Therefore, the accuracy of the global model of FedCGAT is lower than that of the model trained using raw data. Although there is accuracy degradation in the global model, our proposed framework does not require sharing raw data among the participants, which is essential for each participant. A comparison of the MAPE metrics shows that the V2 variant is generally worse than the V1 variant, which means that the graph attention module (V2) has a greater impact on model performance. In summary, the designed sub-modules positively impact performance improvement and are more effective for modeling in federated scenarios.
Comparison of ablation tests
Comparison of ablation tests
In this section, we use three metrics, the number of model parameters (Params), the number of floating-point operations (FLOPs), and the time required for each training epoch of the model to evaluate the computational amount of the model [39].
Params refers to the number of parameters that need to be trained in model training, which can be used to measure the size of the model and reflect the complex complexity of the computational space. FLOPs represents the number of floating point operations per second, which can be used to measure the computational complexity of an algorithm. The smaller the value, the lower the computational complexity required. In addition, the time required for each training round of the model can also reflect the resources required for model training. By comparing the three indexes, the calculation and practicability of the model can be evaluated.
Table 6 shows the model computation information for CGAT and its variants, compared to the SDGCN with the best prediction from the baseline algorithm. It can be found that the computation amount of the CGAT variant decreases relative to the CGAT, which is due to the reduction of some computation steps in the model with the removal of the modules. Compared with SDGCN, the FLOPs value of CGAT is reduced by 94.21M, which consumes less computing energy. Meanwhile, combined with the modelprediction effect shown in Fig. 4, it can be found that the MAPE value of CGAT is reduced by 1.94% compared with SDGCN, indicating that our model has better prediction effect while occupying fewer resources.
Comparison of model complexity
Comparison of model complexity
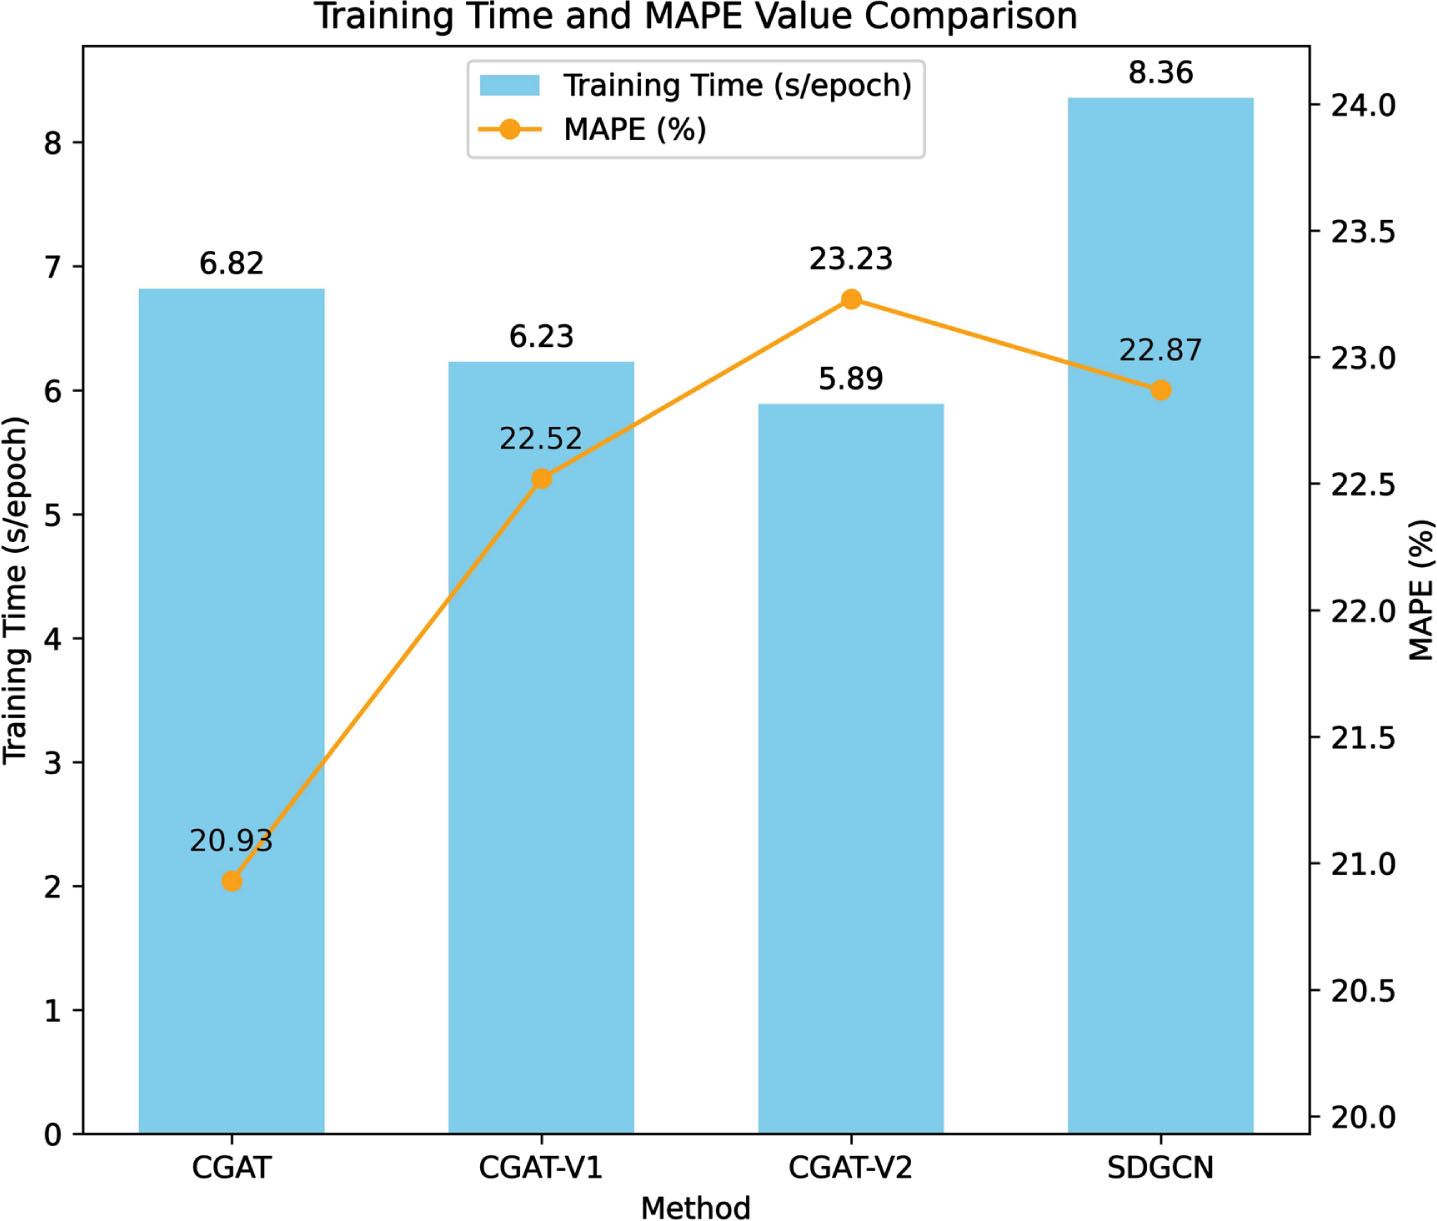
Training time and MAPE value comparison.
In this paper, we propose the FedCGAT framework, which enables collaborative data analysis across multiple organizations while protecting data privacy. At the same time, the framework can also allow the organizations in each region to realize more accurate demand predictions. To address the problem of shared bicycle demand prediction in a single organization, we propose a contrastive graph attention (CGAT) method. We first extract spatio-temporal features of the bicycle data using spatio-temporal convolution and graph attention mechanisms. Then, we design a graph data augmentation method to eliminate noisy data and further capture spatial correlations. Finally, we use an auxiliary task based on contrastive learning to help model training, which can fully learn spatio-temporal features. We conduct experiments on two real datasets and simulate different data distributions in the federated scenario. The experiment shows that the FedCGAT framework can maintain good prediction performance while protecting data privacy.
In our future work, we will optimize the performance of the FedCCAT algorithm in federated scenarios involving a large number of clients. Concurrently, we will investigate methods to ensure the performance of demand prediction models in the presence of missing traffic data. Additionally, the issue of data integrity in distributed scenarios has been scarcely addressed in existing research, we will strive for innovation in this regard.
Footnotes
Acknowledgment
This research was supported by the National Natural Science Foundation of China (No. 62072469).