
Abstract
With the aim of exploring neutron techniques for the non-destructive detection of hydrogen in embrittled steel, three sets of steel samples were studied with neutron scattering: Ni coated, Cd coated, and Cr coated. Each set contained a non-embrittled or low-hydrogen concentration reference and one or two embrittled and high-hydrogen concentration samples. It is observed that the incoherent scattering, when normalized by the intensity of the Bragg peak, is significantly higher for high-hydrogen concentration or embrittled samples than in the reference. Although the difference is small, this represents a non-destructive technique of detecting hydrogen embrittlement. Neutron radiography, and inelastic or small-angle scattering could not distinguish between embrittled and reference samples.
Keywords
Introduction
Modern industry uses many parts made from high-strength steel alloys. These high-quality materials have an Achilles’s heel: when hydrogen somehow becomes dissolved in the alloy, it may lead to sudden failure, known as “hydrogen embrittlement” [9]. Many steel alloys are to some degree susceptible to hydrogen embrittlement [5]. The hydrogen can be introduced during the service life of the component, due to corrosion [28], but it can also be a remnant of the processing, for example electroplating. During the plating, some hydrogen is unavoidably introduced into the steel [23] and this must be removed by a thermal anneal (bake) within a short time span following the plating [10]; this protocol avoids hydrogen embrittlement and constitutes “normal” processing practice. For off-normal practice, the bake is delayed or absent. How much delay can be tolerated? Is it possible to recover the piece? Only if it can be established reliably that the piece contains neither hydrogen (at least, below a certain threshold) nor damage induced by hydrogen in the interim. While this situation requires study into the mechanism of embrittlement [8] and ways to circumvent it [7], there is also need for non-destructive testing of high strength steel for hydrogen embrittlement.
Thermal neutrons are well suited to detect hydrogen in alloys such as high strength steel. The incoherent scattering cross section of hydrogen (80.3 b [21]) is much larger than that for the other elements making up the iron based alloy, the next largest being the one for Ni (5.2 b), Cr (1.83 b) and Fe itself (0.4 b) where 1 b = 1 barn = 100 fm2. Therefore, several neutron based techniques come to mind as possible non-destructive methods of detecting hydrogen in steel. Neutron tomography has been used successfully to image hydrogen filled blisters in iron [11], but the samples had been loaded to an extent that the blisters were visible with the naked eye. Neutron radiography [12, 25, 26] is already widely used to obtain spatially resolved images of bulk samples with applications in, e.g. fuel cells, hydrogen storage, batteries, and engine components [24]. As we will report here, neutron radiography does not appear sensitive enough to detect the small amount of hydrogen involved in embrittlement.
Elastic neutron diffraction resembles x-ray diffraction but with some important differences. In the context of hydrogen detection in steel parts, one such difference is the large sensitivity or cross section of neutrons to hydrogen [22], and the large penetration depth in a solid material such as steel which permits characterization of large diameter samples. For steel alloys containing NbC nanoclusters, small angle neutron scattering (SANS) using a pinhole camera could distinguish between hydrogen charged and hydrogen-free alloys and establish that the hydrogen is preferentially absorbed by the NbC nanoclusters [20]. Similarly, in steel alloys containing VC precipitates, analysis of hydrogen charged alloys by SANS showed that the hydrogen is absorbed preferentially by the VC clusters [18].
Inelastic neutron scattering reveals excitations such as phonons. Since vibrational states involving hydrogen typically occur at higher energies than phonons involving only metal atom movements, inelastic scattering can provide information on hydrogen-metal alloys [6]. Both Bragg peak and phonon spectra are examples of coherent scattering, but incoherent scattering also occurs and is indicative of deviations from the perfect crystal lattice or its excitations, such as point defects, extended defects, impurities, or elements with multiple isotopes or multiple spin states with different scattering cross sections. The incoherent scattering of thermal neutrons is relatively easy to measure, at least if one has a neutron source, monochromator, and diffractometer running, because it is the incoherent scattering that gives rise to the background signal in between the Bragg peaks.
Here, we report on incoherent neutron diffraction and – briefly – on two other neutron scattering techniques, namely inelastic neutron scattering and small angle scattering (although not quite in the SANS angular range). While the intensity of inelastically scattered neutrons was too low to reach meaningful statistics in a reasonable time frame, we found the incoherent diffraction was slightly but significantly enhanced in embrittled samples.
Samples and methods
Sample preparation
Three sets of cylindrical samples were used, about 6 mm in diameter and 8 to 15 mm long. The cylindrical samples were made from air-melted AISI 4340 [19] martensitic steel. They were quenched and tempered at a low temperature in order to reach an ultimate tensile strength above 1600 MPa. The cylinders were cut from stress-test samples that had previously been tested for yield strength and all values were between 1550 and 1625 MPa. The microstructure was analyzed and showed a lath martensite sized 1-2 μm by 5-10 μm. We have not characterized the carbide phases but because of the low temperature tempering, carbide particles should be at most a few nanometer in diameter. A more detailed description of the micostructure and mechanical properties of the samples including optical and electron miscroscopy can be found in ref. [15]. Two samples were Cd coated by electroplating (plating currents and times were 10 mA/cm2 for 10 minutes, 30 mA/cm2 for 60 minutes, and 400 mA/cm2 for 4 hours for Cd, Ni and Cr layers, respectively), and one of the Cd coated samples (Cd-ref) had been baked and was not found to be embrittled whereas the other (Cd-embr) had not been baked and was found to be embrittled. Two other samples (“Ni-ref-5” and “Ni-embr-30”) were coated with Ni (the coating was only applied over 60–70 % of the cylinder’s length) and had been electrochemically loaded with different amounts of hydrogen, 5 and 30 ppma as determined by thermal desorption spectroscopy on different samples from the same lot [1]. The low concentration sample was not embrittled whereas the other was found to be embrittled. Cr coated samples (“Cr-ref”, “Cr-embr-200”, and “Cr-embr-1000”) were prepared, like the Cd coated ones “as coated” and “baked” where the “as coated” samples was found to be embrittled but the “baked” ones were not. The hydrogen content of the Cr samples, before the bake, was ≈ 200 and 1000 ppma, as determined by thermal desorption spectroscopy [1]. Note that “ppma” refers to “atoms per million atoms” averaged over the entire sample; since most hydrogen is concentrated in the deposited protective layer [2, 17], the actual local concentration can be much higher. Note also that some metallurgical publications use “ppm” by weight rather than per atom. Sample properties are summarized in Table 1 but see also [2–4, 14].
Overview of samples used for the neutron studies
Overview of samples used for the neutron studies
Neutron analysis was performed at the McMaster Nuclear Reactor (MNR). MNR is a 5 MW open pool reactor, with a peak thermal neutron flux of
Service provided by nray services inc (sales@nray.ca)

White beam neutron transmission images of four samples (false colour online). The dashed white lines in panel B indicate where some individual linescans were taken.
Neutron radiography
The raw images, scanned with 2400 dpi resolution, corresponding to four cylinders are shown in Fig. 1, panels (A) to (D). These are false-colour images with the (negative) grey scale converted to colour (low counts mean high transmission).
A visual inspection of the images shown in Fig. 1 already yields some useful information. The Ni coated samples appear uniform in the vertical direction, in spite of the Ni coating not covering along the entire length of the sample. The Ni coated steel is apparently indistinguishable from uncoated steel in neutron radiography. The Cd samples show a distinct thin vertical edge on both sides, corresponding to strong neutron absorption as the neutron pass at glancing angle through the edge of the Cd coated cylinder. As well, the background appears uniform in each of the four images, even close to the edge of the samples. A more quantitative analysis of the images of Ni coated samples is shown in Fig. 2, which shows “linescans”, the intensity along lines drawn horizontally or vertically across the images, and averaged over several neighbouring lines.
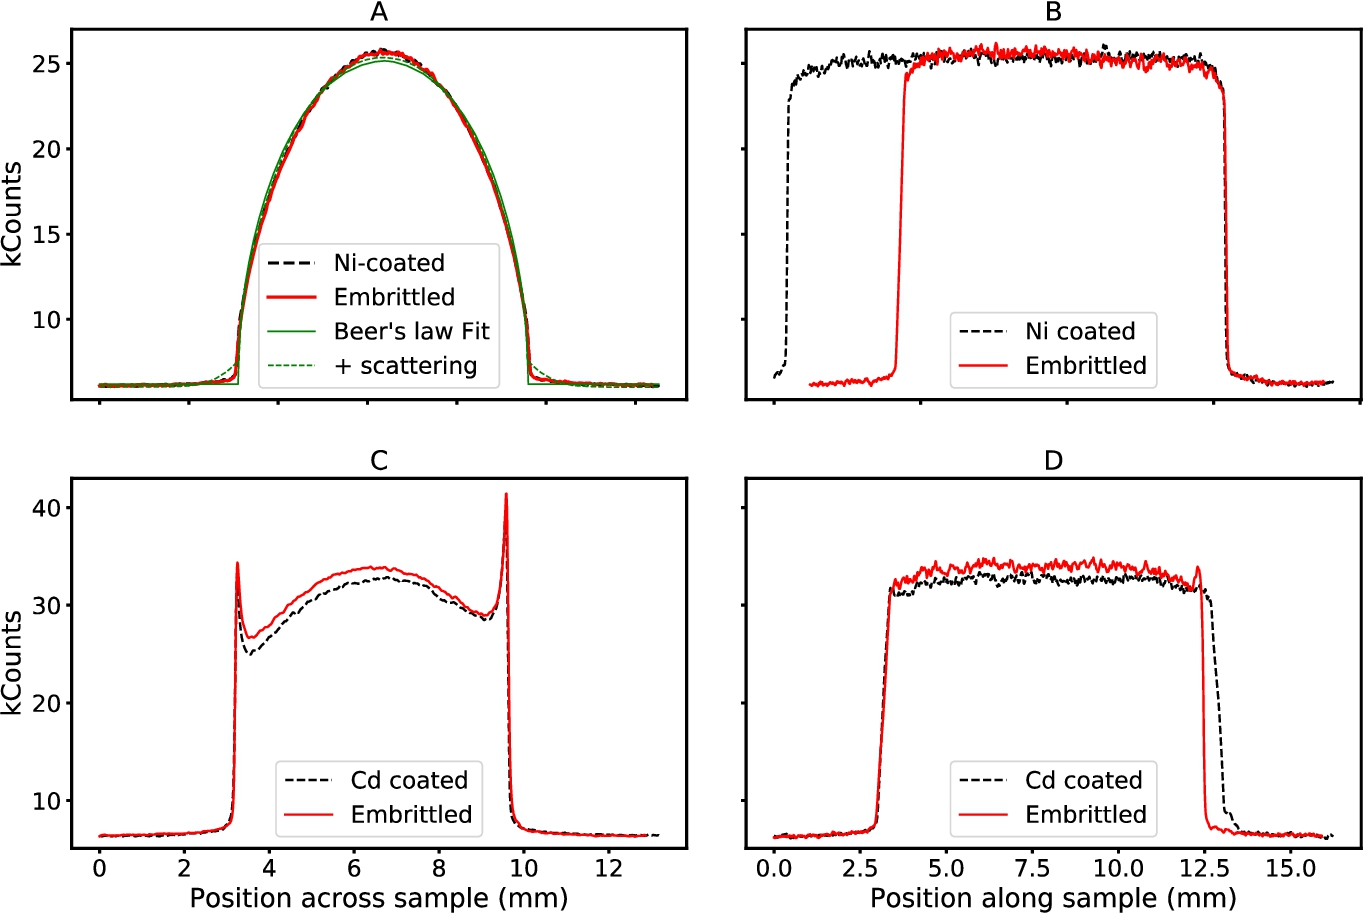
Linescans of the images shown in Fig. 1 (Colour online). Dashed black lines: “good” samples, not embrittled. Solid red lines: embrittled samples. Ni coated in the top row, Cd coated in the bottom row; The left panels A and C depict scans across the cylindrical samples (corresponding to a horizontal direction in Fig. 1), and panels B and D are vertical scans along the length of the cylinders. The thin green lines in panel A are fits; the solid line is Beer’s law convoluted with the position dependent thickness of the cylinder in transmission and the dashed line includes some broadening from scattering.
The two curves shown in Panel A (note that an offset of 200 counts, corresponding to a lateral variation in neutron intensity of about 1% was applied to adjust the baseline of the two curves) show a nearly constant background and an inverted somewhat parabolic looking curve. The shape of this curve is due to a combination of factors: since neutrons pass across the cylinder in a direction perpendicular to the cylinder axis, the path length varies from zero to the cylinder diameter and back to zero as the position across the sample increases. The thin solid green line in panel A of Fig. 2 is a fit convoluting this path length with the Beer-Lambert law describing transmission as a function of thickness [27]. The dashed thin green line is a similar fit, but includes some position-dependent broadening expected from neutron scattering. Since the incident neutrons are not mono-energetic and because the samples contain a number of atomic species, we have assumed a simple Gaussian broadening rather than one characterized by a series of Legendre functions [16]. The broadening was considered to be proportional, both in intensity and in width, to the neutron path length through the sample as longer path lengths also correspond to larger distances between point of scattering and detector (the samples were placed directly in contact with the image plates). If a significant amount of neutron scattering by hydrogen was taking place, the reduced transmission would be visible by a higher count for the solid line, especially near the onset of the parabolic shape, and neutrons scattered away would be counted outside of the samples outline so that the solid red line just beside the cylinder would fall below the dashed line. There is no significant difference visible between the dashed black line and the solid red one, neutron radiography cannot distinguish between the “good” and the embrittled Ni coated sample. The data shown in Panel B, measured along the length of the cylinders, has the same characteristics: no significant difference is evident either within or just without the sample, leading to the same conclusion. For the Cd coated samples, The curves as shown in Panels C and D are different, the “bat’s ears” seen in Panel C (corresponding to the light edges visible in the two right panels of Fig. 1) are due to strong neutron absorption in the Cd layer. While there are significant differences between the dashed black curve and the solid red one, this is most likely due to a small non-uniformity in the thickness of the Cd layer; if such a large difference were due to hydrogen, it would have been visible in Panels A and B as well.

(Colour online) Neutron diffraction intensity normalized by Fe(110) Bragg peak intensity versus

(Colour online) Intensity of the Fe(110) Bragg peak for the Ni coated samples versus sample orientation angle η. Monitor counted to 75 kCounts. Error bars are 1σ and calculated from counting statistics. Solid red circles and solid red line: embrittled sample. Open black circles and dashed black line: reference sample. Horizontal dashed lines indicate mean over all orientations.
The diffraction pattern for the Ni coated samples, normalized to Bragg peak intensity, is shown as a function of
For most scattering angles, the solid red circles (30 ppma H) are above the open black circles (5 ppma H), in other words the incoherent scattering is more pronounced for the sample containing more hydrogen. Since hydrogen absorbed in the crystal lattice is both a crystal imperfection and an impurity and because of its relatively large incoherent scattering cross section, its presence should increase the incoherent scattering intensity. The
Texture scans
It is not yet safe to conclude that the hydrogen containing samples exhibit higher incoherent scattering, because the scans shown in Fig. 3 were measured for one particular sample orientation, and therefore the presence of pronounced texture, either in the Bragg peak or in the incoherent portion of the spectrum, can falsify the result. Therefore, texture scans were measured for both the Bragg peak and the incoherent signal. The next two figures show examples of such scans. Figure 4 shows the intensity of the Bragg peak (at 66°) for the Ni-coated samples.

(Colour online) Intensity of the incoherent scattering (I incoherent ) normalized to the intensity of the Fe(110) Bragg peak (IFe(110)) for the Ni coated samples versus sample orientation angle η. Error bars are 1σ and calculated from counting statistics. Solid red circles and solid red line: embrittled sample. Open black circles and dashed black line: reference sample. Horizontal dashed lines indicate mean over all orientations.
Intensity of incoherent signal, normalized by Fe(110) Bragg peak and averaged over texture scans
The small variation of the Bragg peak intensity with η indicates that there is a relatively small orientation and texture effect present in both samples. As well, since the open black circles (5 ppma sample) are consistently above the solid red ones (30 pmma sample) it may be concluded that the difference in Bragg peak intensity as seen in
Next the incoherent intensity was measured versus sample orientation angle η and an example is shown in Fig. 5.
There are again small variations indicating some texture effects but nevertheless the solid red circles (30 ppma sample) are all above the open black circles (5 ppma sample). (NB, before normalization for sample size / Bragg peak intensity, the relative intensities are inverted.)
The normalized total intensities for the Fe(110) Bragg peak, the Ni(200) Bragg peak, and the incoherent intensity, averaged over all η angles measured, are reported in Table 2. Uncertainties correspond to
The small angle region of the scattering intensity measured for the two Cd coated samples is shown in Fig. 6. There is no discernible difference between the embrittled and the non-embrittled sample. Since other work using SANS has shown that hydrogen is absorbed preferentially in NbC [20] or VC [18] nanoclusters, the absence of a significant difference is perhaps surprising. However, our use of a normal diffraction set-up rather that a dedicated small-angle instrument (the signature reported in [20] and [18] was located at 0.01–0.1 Å−1, just on the edge of our accessible range), and the strong neutron absorption in the Cd layer, are all factors making it more difficult to detect a difference. In AISI 4340 steel, hydrogen is suspected to segregate at or near dislocations [13] but this too would give a signature just at or just below the edge of the angular range accessible with our instrument. We have not further explored small angle scattering.
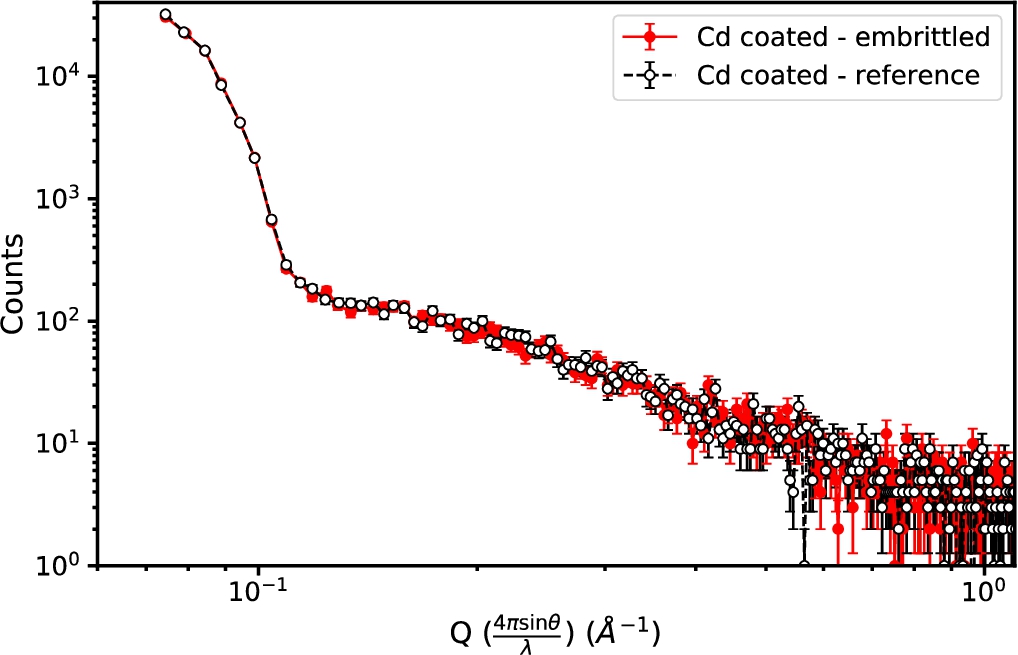
Small angle region of

Inelastic scattering at three different configurations. Solid symbols: embrittled sample (Ni-Emb-30), from top to bottom: blue circles,
The increased incoherent scattering in hydrogen containing embrittled relative to non-embrittled samples suggests that inelastic scattering may be a reliable way to distinguish between hydrogen-free non-embrittled and hydrogen containing embrittled steel. Figure 7 shows, for three values of
Conclusion
In conclusion, we have explored the use of neutron techniques for the non-destructive detection of hydrogen in embrittled steel. Three sets of cylindrical samples were studied, Ni, Cd, or Cr coated. Analysis by neutron radiography, small-angle or inelastic neutron scattering could not distinguish embrittled samples from low-hydrogen concentration non-embrittled samples. However, the incoherent scattering, normalized by the main Bragg peak intensity, was slightly but significantly (at least 5σ) enhanced in all embrittled samples. Texture scans revealed the enhancement to be essentially independent of sample orientation.
Footnotes
Acknowledgements
It is a pleasure to acknowledge our industrial partners Safran, Bell Helicopter and Héroux-Devtek for providing material and technical support. This work was supported by the Fonds de recherche – Nature et technologies (FRQNT) and the Natural Sciences and Engineering Research Council (NSERC, CRDPJ 463599-14) via the Consortium for Research and Innovation in Aerospace in Québec (CRIAQ, DPHM-601). Use of the MAD beamline at the McMaster Nuclear Reactor is supported by McMaster University and the Canada Foundation for Innovation.