



Abstract
BACKGROUND:
The Workforce Investment and Opportunity Act increased focus on State Vocational Rehabilitation Agency (SVRA) service priorities for several applicant subpopulations, such as transition-age youth, workers receiving subminimum wages, and workers with competitive and integrated employment.
OBJECTIVE:
This study examines state variation in outcomes for applicants in four different employment statuses at application similar to the subpopulations affected by WIOA, and identifies SVRAs with consistently strong outcomes.
METHODS:
We used VR administrative data on cases closed during fiscal year 2014 to calculate the percentage of VR applicants who received services and the percentage of VR service recipients who were employed at program exit. Regression analysis controlled for applicant subpopulation, SVRA, and other characteristics. Results were reported as marginal effects and presented graphically.
RESULTS:
There was more variation across SVRAs in the share of applicants receiving services than in the share employed at program exit. Variation was particularly large for students not employed at application. Eight SVRAs were in the highest quartile on both outcomes for one or more subpopulations.
CONCLUSIONS:
The findings are a first step towards better understanding the mechanisms that drive the relative success of some SVRAs and facilitating the sharing of best practices throughout the VR program.
Keywords
Introduction
The vocational rehabilitation (VR) program, which provides services and supports to people with disabilities who want to work, is funded using federal and state dollars but administered at the state level by state VR agencies (SVRAs). The program serves a heterogeneous population of individuals who apply for assistance with overcoming various barriers to employment. For example, some applicants may already be working, others might be unemployed, and yet others might be students. Because SVRAs administer the program, they likely vary in the ways in which they serve applicants with different employment statuses at application, and by their success in helping applicants achieve employment outcomes. With recent legislation poised to change how SVRAs provide services to certain types of applicants, these existing SVRA-level differences are of particular interest.
The Workforce Investment and Opportunity Act (WIOA), passed in 2014, adjusted VR service priorities to increase focus on several applicant subpopulations, including transition-age youth (who are often students), workers receiving subminimum wages, and workers with competitive and integrated employment. As SVRAs assess whether and how to change their service provision model to comply with WIOA, evidence on what works will likely play a role in informing these changes. For example, some SVRAs may serve particular subpopulations in ways that result in relatively stronger program outcomes, offering an opportunity for the VR program and other SVRAs to learn about best practices.
This study seeks to identify SVRAs that have relatively strong outcomes for subpopulations based on their employment status when seeking VR services. We used administrative data from all VR cases closed in fiscal year 2014 to examine two key VR program outcomes—the percentage of VR applicants who received services and, among those who received services, the percentage of applicants who were employed when they exited the program. We considered these outcomes for four applicant subpopulations—applicants employed for pay in an integrated setting without need of supports, applicants with other types of paid employment, students not employed, and those who were neither students nor paid workers at application. We selected these applicant subpopulations because they reflect VR applicant groups that will likely be affected by provisions in WIOA. For both outcomes, we generated statistics for each applicant subpopulation and SVRA before assessing the relative performance of SVRAs.
Our analysis shows that outcomes varied widely, both across SVRAs for the same applicant subpopulation as well as within SVRAs for different applicant subpopulations. Outcomes were substantively different across applicant subpopulations, which could be due to differences in VR service receipt but likely involve other factors as well, such as variation in employment barriers and facilitators across groups. There was more variation across SVRAs in the share of applicants receiving of services than in the share employed at program exit. We identified a group of SVRAs for which both outcomes were either in the first or fourth quartile of the outcome distribution. Numerous SVRAs in which both outcomes were in the highest quartile of the outcome distribution were located in the southern region of the United States.
These findings have implications for WIOA and VR policy because they highlight that substantive outcome differences exist and identify which SVRAs have the relatively better outcomes for certain subpopulations. This information could be a first step to better understand the mechanisms that contribute to the relative success of some SVRAs and facilitate the sharing of best practices from those agencies throughout the VR program, thus ultimately improving SVRA compliance with WIOA and promoting successful outcomes for VR clients.
Background
The VR program provides supports and services to people with disabilities who want to work. In fiscal year 2014, 578,488 eligible applicants applied for VR services (Rehabilitation Services Administration, 2016). Application to the program is voluntary and most VR applicants eventually receive services, some after encountering lengthy wait times (Honeycutt & Stapleton, 2012). VR serves a heterogeneous population with different employment barriers. Consequently, the services an agency provides might differ substantively across applicant subpopulations, in part because membership in a given subpopulation may be correlated with specific barriers to employment. As a result, applicant subpopulation may be correlated with VR service outcomes including the likelihood of applicants receiving services or exiting the program employed.
The VR program is a federal-state partnership. The program is administered federally by the U.S. Department of Education’s Rehabilitation Services Administration (RSA) and at the state level by 80 SVRAs. Twenty-six states and the District of Columbia have a single “combined” agency that services all VR applicants in the state or district (RSA, 2013). The remaining 24 states and the 5 U.S. territories divide their VR resources between two agencies: an agency for the blind (“blind agency”) that exclusively serves people with significant visual impairments and a general agency that services all other applicants. The federal government provides the majority—roughly 80 percent—of VR program funding. Because VR program administration occurs at the state level, there are reasons to expect differences in VR outcomes by SVRA. These differences are likely driven by variation in SVRA administration and service provision, such as the ways in which SVRAs prioritize applicants, the intensity with which SVRAs provide services, and the types of services SVRAs offer. Additionally, state- and local-level factors not directly tied to program administration but linked to program outcomes, such as available job opportunities and state labor force traits, may affect the likelihood of applicants’ success.
WIOA, which was signed into law on July 22, 2014, included several provisions that affected the VR program. Perhaps most notably, WIOA specifies a greater role for VR in providing services to transition-age youth—that is, youth ages 14 to 24 who are transitioning into the adult workforce. WIOA specifies that at least 15 percent of each state’s VR funding allocation go toward pre-employment transition services for transition-age youth. In addition to the pre-employment transition services, WIOA included several other provisions that affected other subpopulations of (and sometimes all) VR applicants. For instance, WIOA placed further restrictions on paying some workers subminimum wages and encourages SVRAs to develop stronger links with employers. WIOA’s other provisions that affected VR included: required agreements between VR and state Medicaid and intellectual and developmental disability agencies; updates to employment type definitions; identification of competitive integrated employment as the optimal outcome; additional roles and requirements for other workforce agencies in regard to serving people with disabilities; and new data and performance reporting requirements (Hoff, 2016).
At the core of our analysis is understanding how well SVRAs were serving the applicant subpopulations that WIOA will most affect. The applicant subpopulations we chose for the analysis (and described in the next section) represent subpopulations likely to be affected by WIOA provisions. If we can identify SVRAs that have served certain VR applicant groups particularly well, then there may be opportunities to engage those SVRAs, identify the program components that might be driving each SVRA’s relative success, and share that information nationally with other SVRAs adjusting their resources to comply with WIOA. There may also be opportunities within SVRAs to examine how each agency served different applicant groups and apply (to the extent possible) best service delivery lessons across applicant groups. Hence, our analysis is poised to help identify and disseminate best VR practices for certain applicant subpopulations.
Previous studies have found differences in the ways in which SVRAs serve applicants and have identified factors at the applicant, VR, and state levels that influence service outcomes. For example, Stapleton, Honeycutt, and Schechter (2010) found SVRA-level variation in the demographic, disability, and educational characteristics of applicants who complete services. Other work has found that VR applicant employment outcomes vary by applicant characteristics such as race and ethnicity (e.g., Muachofi, Boyles, & Khaliq, 2009). Additional studies have confirmed that state-level economic and VR program factors such as the unemployment rate and available VR resources also play a role in determining applicant service and employment outcomes (e.g., Honeycutt, Thompkins, Bardos, & Stern, 2014;Nord, Hewitt, & Nye-Lengerman, 2013).
However, limited information exists about the extent to which (1) SVRAs provide services differently to applicants when they seek services or (2) outcomes differ by applicants’ employment status when they seek services. One recent study by Chiu et al. (2015) compared service receipt patterns among VR applicants with diabetes by their employment status at application and found differences between groups in the types of services received. That analysis, however, focused only on applicants with diabetes and did not examine state- or agency-level variation in outcomes.
Methods
Data
The data for this analysis came from two sources: the RSA-911 (public use) file for fiscal year 2014 and the American Community Survey (ACS). The RSA-911 file for a fiscal year contains applicant-level data reported by SVRAs for all VR cases closed during that fiscal year. Currently, the RSA-911 files only describe closed VR cases. The RSA-911 fiscal year 2014 file provided the data needed to create applicant demographic, primary disabling condition, VR service receipt, and outcome variables. Our analysis sample includes all VR cases that closed for any reason (other than death) during the 2014 federal fiscal year (that is, October 1, 2013, through September 30, 2014) in 49 states or the District of Columbia. The sample excludes cases from New York because RSA-911 data for the state lacked key variables needed for the analysis. We also excluded cases from U.S. territories because their experiences with funding, infrastructure and other factors may be unique and therefore less applicable to other SVRAs.
Because the RSA-911 public use files do not contain identifiers, we cannot determine the number of analysis sample members who experienced multiple closures of VR cases during the fiscal year. This issue is important because if correlation at the VR client level is significant, then studies should control for it as part of the analysis. However, evidence from Mann et al. (2016), which used RSA-911 files with identifiers, suggests that few people in our sample are represented by multiple records in the data.
We used “employment status at application” as recorded in the RSA-911 file to group the applicant sample into four groups that are linked to WIOA’s VR provisions. These groups were applicants who: (1) were employed for pay in an integrated setting without need of supports, (2) who had another type of paid employment, (3) were students not employed, and (4) were neither students nor paid workers at application.1 We selected these groups because each will likely be affected by WIOA provisions. Applicants employed in an integrated setting without supports could be affected by a stronger emphasis under WIOA on VR and employer relationships or identifying competitive integrated employment as the optimal outcome, which many of these applicants have and want to maintain. Applicants with other types of paid employment might be affected by, among other provisions, WIOA’s new limitations on the use of subminimum wages. Students not employed mostly consist of transition-age youth, who likely will receive additional attention and resources from VR because of WIOA. Applicants who are neither students nor paid workers might also be affected by WIOA provisions, though the link between composition and specific WIOA VR provisions is stronger for the other groups.
Our analysis focused on two outcomes derived from the RSA-911 file that are central to the VR program.
The percentage of applicants who received services is important to SVRAs because it reveals the percentage of individuals who actually received services among those who initially requested assistance to overcome their disability-related employment barriers. Applicants can exit the program before receiving services for several reasons, such as being ineligible for the program, refusal to comply with VR, inability to be contacted, no longer desiring services, or exiting after being placed on a waitlist for services. Whatever the reason for early program exit, the measure helps SVRAs assess the number of people who actually received services among those who applied for services.
The other outcome—the percentage of those who exited the program employed among those who received services—has long been viewed as the best available metric for the percentage of cases that closed successfully, making it a critically important program outcome. We constructed both outcomes from the “type of closure” variable in the RSA-911.
In addition to RSA-911 data, we also used data from the ACS to account for differences in population characteristics at the state and local level that could affect SVRA client outcomes. The ACS is a nationally representative survey of the United States population collected annually by the United States Census Bureau. The addition of applicant ZIP code to the 2014 RSA-911 files enabled us to link ZIP code-level statistics from the ACS to VR applicant records in the RSA-911 file. To our knowledge, this is the first study to link the RSA-911 to other data by ZIP code.
Descriptive statistics
Of the 537,734 cases that closed in fiscal year 2014 across all SVRAs for reasons other than death, about one in three individuals were employed when they applied for VR services; 75,558 (14.1 percent) were working for pay without supports and 11,881 (2.2 percent) were working in other types of paid employment (Table 1). Just fewer than one in five 91,287 cases (17.0 percent) were students not employed at application. The majority (345,201, or 64.2 percent) were neither students nor paid workers when they applied for VR services.
Composition of the sample, by employment status at application
Composition of the sample, by employment status at application
Notes: Statistics created using data from the RSA-911 file. The sample includes all VR cases with complete records (i.e., had no missing values for demographic variables) that were closed administratively in fiscal year 2014. The sample excludes cases from New York’s general agency due to missing data. All values are percentages unless otherwise noted. Cells with ‘.’ Have insufficient cases for analysis.
Although our ultimate focus is on differences across SVRAs, we examined applicant subpopulations to understand their characteristics at application, as those may affect the likelihood of receiving services and closing with employment. Examining the age distribution at application across applicant groups, we find that relative to the other groups, students were much more concentrated in younger ages (Table 1). Turning to the racial distribution, the share of Blacks was smaller within the two employed groups (16.4 and 17.5 percent) than within the group of students not employed and the group of individuals who were neither students nor employed (22.5 and 27.8, respectively). Unsurprisingly, students at application had the lowest levels of educational attainment, and older working-age adults were more likely than transition-age youth applicants to be high school graduates or have some postsecondary education.
The condition distribution varied substantively across applicant subpopulations, suggesting the barriers each subpopulation faced in attaining competitive employment may be quite different. For example, nearly half of student applicants (45 percent) had a primary impairment related to learning, whereas nearly a third of applicants who were neither students nor paid workers (31 percent) had a primary impairment related to mental health. The mean values of the ZIP code-based variables (which describe population density, level of education, disability prevalence, and income) were rather consistent across groups.
Applicants who were in other paid employment or were neither students nor paid workers at application were more likely (relative to the overall sample and other subpopulations) to have received Supplemental Security Income (SSI) or Social Security Disability Insurance (SSDI) benefits at application (Table 1). About 16 percent of all sample cases represented individuals who were SSDI beneficiaries (but not SSI recipients) at application. A slightly higher percentage (17 percent) had the opposite benefit receipt pattern—they were SSI recipients but not SSDI beneficiaries. Concurrent beneficiaries—those receiving SSI and SSDI benefits—accounted for three percent of all cases. This finding is consistent with the idea that individuals receiving SSI or SSDI benefits are often less likely to engage in substantive employment activity for fear of losing their cash and health benefits.
The analysis employs regression models and marginal effects to examine the role of state variation in VR applicant outcomes across different employment statuses at application. For each outcome, we estimated a separate regression model for each applicant group. We estimated separate models for blind and general or combined SVRAs.
We modeled the outcomes – whether applicants received services, and whether service recipients exited with employment (both of which are binary variables) – using logistic regressions. The logistic regression models had the following basic functional form:
After estimating each logit model, we estimated SVRA-level marginal effects. Marginal effects computations use the underlying estimated model to predict how an outcome would have varied with a unit change of a certain factor. For this analysis, we were interested in how outcomes for each applicant group varied by SVRA. Consequently, for each outcome and applicant group, we computed a SVRA-level marginal effect. The marginal effect results we report can be interpreted as the percentage of sample members of a group who would have achieved the outcome if all of them had received services from a certain SVRA (but keeping all other individual factors constant).
To better understand and compare SVRA-level variation in outcomes for each employment status at application group, we plotted SVRA marginal effect estimates for both outcomes on a graph. We present a series of figures, one for each of the applicant subpopulations, with one observation in each figure for each SVRA. In each figure, the horizontal axis shows the share of applicants in that group who would have received services if all of them had applied to a specific SVRA. The vertical axis shows the share of the group who would have exited the program with employment after receiving services if all of them had received services from a specific SVRA. In other words, each axis shows predicted outcome values for all members of the sample if the only characteristic that varied for them was the SVRA to which they applied.
In each figure, the solid horizontal and vertical lines identify median SVRA outcome values; the dotted horizontal and vertical lines mark the 25th and 75th percentile SVRA values. SVRAs in the upper right quadrant of the solid lines are agencies with above-median performance on both measures, whereas SVRAs in the bottom right quadrant are those with below-median performance on both measures. For our discussion, “high” indicates SVRAs with outcomes at or above the 75th percentile, and “low” indicates those with outcomes at or below the 25th percentile.
We technically do not need to use statistical inference to understand the proximity of our parameter estimates to the population parameters because we analyze the entire VR population during the analysis period. Nevertheless, we follow convention, reporting standard errors and significance levels.
Despite using rigorous methods to understand SVRA variation in service outcomes for different employment statuses at application, this study has several limitations. The models estimated in this study to predict VR outcomes capture correlations rather than causal relationships between applicant subpopulations and outcomes, and between SVRA service delivery and outcomes. This is because the model is not designed to control for differences between applicant groups, and also does not control for factors that could not be observed in the data but that could affect applicant outcomes, including selection into VR services and non-SVRA features of applicants’ state and local environments. Instead, this study is designed to identify correlations and patterns worthy of further study.
In this section, we present findings for general and combined SVRAs by employment status at application. Because general and combined SVRAs serve the vast majority of VR applicants, we only discuss analysis results for those agencies in the main text. However, for those states that have one, blind agencies are an integral part of the VR program. Consequently, in Table A1 in the appendix we report aggregate results for blind agencies. Tables A2, A3, and A4 contain the analysis results numerically by employment status at application for all SVRA types—general, combined, and blind.
We begin by presenting aggregate statistics that summarize differences in outcomes across applicant groups and then present differences across SVRAs for each of the subgroups of interest.
Summary of SVRA-level findings
Averaging across SVRAs, the mean percentage of applicants who received services and the mean percentage who exited with employment were highest for the employed applicant subpopulations and lowest for applicants who were neither students nor paid workers (Table 2). About two thirds of employed applicants received services, a level similar to student applicants, compared with slightly more than half of applicants who were neither students nor paid workers. More than three quarters of the employed subpopulations were employed when they exited the program.2 However, about half of applicants who were neither students nor paid workers were employed when they exited the program, as were slightly more than half of student applicants. Median values followed the same patterns between subpopulations.
Distribution of outcomes across general and combined SVRAs (N = 50)
Distribution of outcomes across general and combined SVRAs (N = 50)
Notes: Statistics created using data from the RSA-911 file and aggregated across SVRA-level outcomes (with each SVRA having equal weight in the calculations). Unless noted otherwise, The sample includes all VR cases from 49 states with complete records (i.e., had no missing values for demographic variables) that were closed administratively in fiscal year 2014. The sample excludes cases from New York’s general agency due to missing data. All values are percentages unless otherwise noted. State abbreviations are in parentheses.
Of the applicant subpopulations, students not employed experienced the greatest variation in outcomes between SVRAs, as measured by the interquartile range. Measuring variation by the overall range between minimum and maximum SVRA values also identifies students as having the most differences in exits with employment. However, by this measure, the subpopulation in paid employment without supports has the greatest variation on service receipt.
In this section, we take a closer look at SVRA-level outcomes to identify SVRAs with relatively high or low outcomes for each applicant subpopulation, as shown in the referenced graphical tables.
For applicants employed for pay in an integrated setting without need of supports, several SVRAs had relatively high or low values for both outcomes (Fig. 1). Three SVRAs—Arkansas, DC, and Mississippi—had predicted values in the top quartile for both outcomes, and three other SVRAs—Colorado, Hawaii, and Ohio—had values in the bottom quartile for both outcomes. Of all SVRAs, South Carolina was the top SVRA for the share of applicants receiving services among this subpopulation but ranked below the median for the share who exited with employment. Delaware’s share of this subpopulation exiting with employment was highest but was close to the median in terms of service receipt.
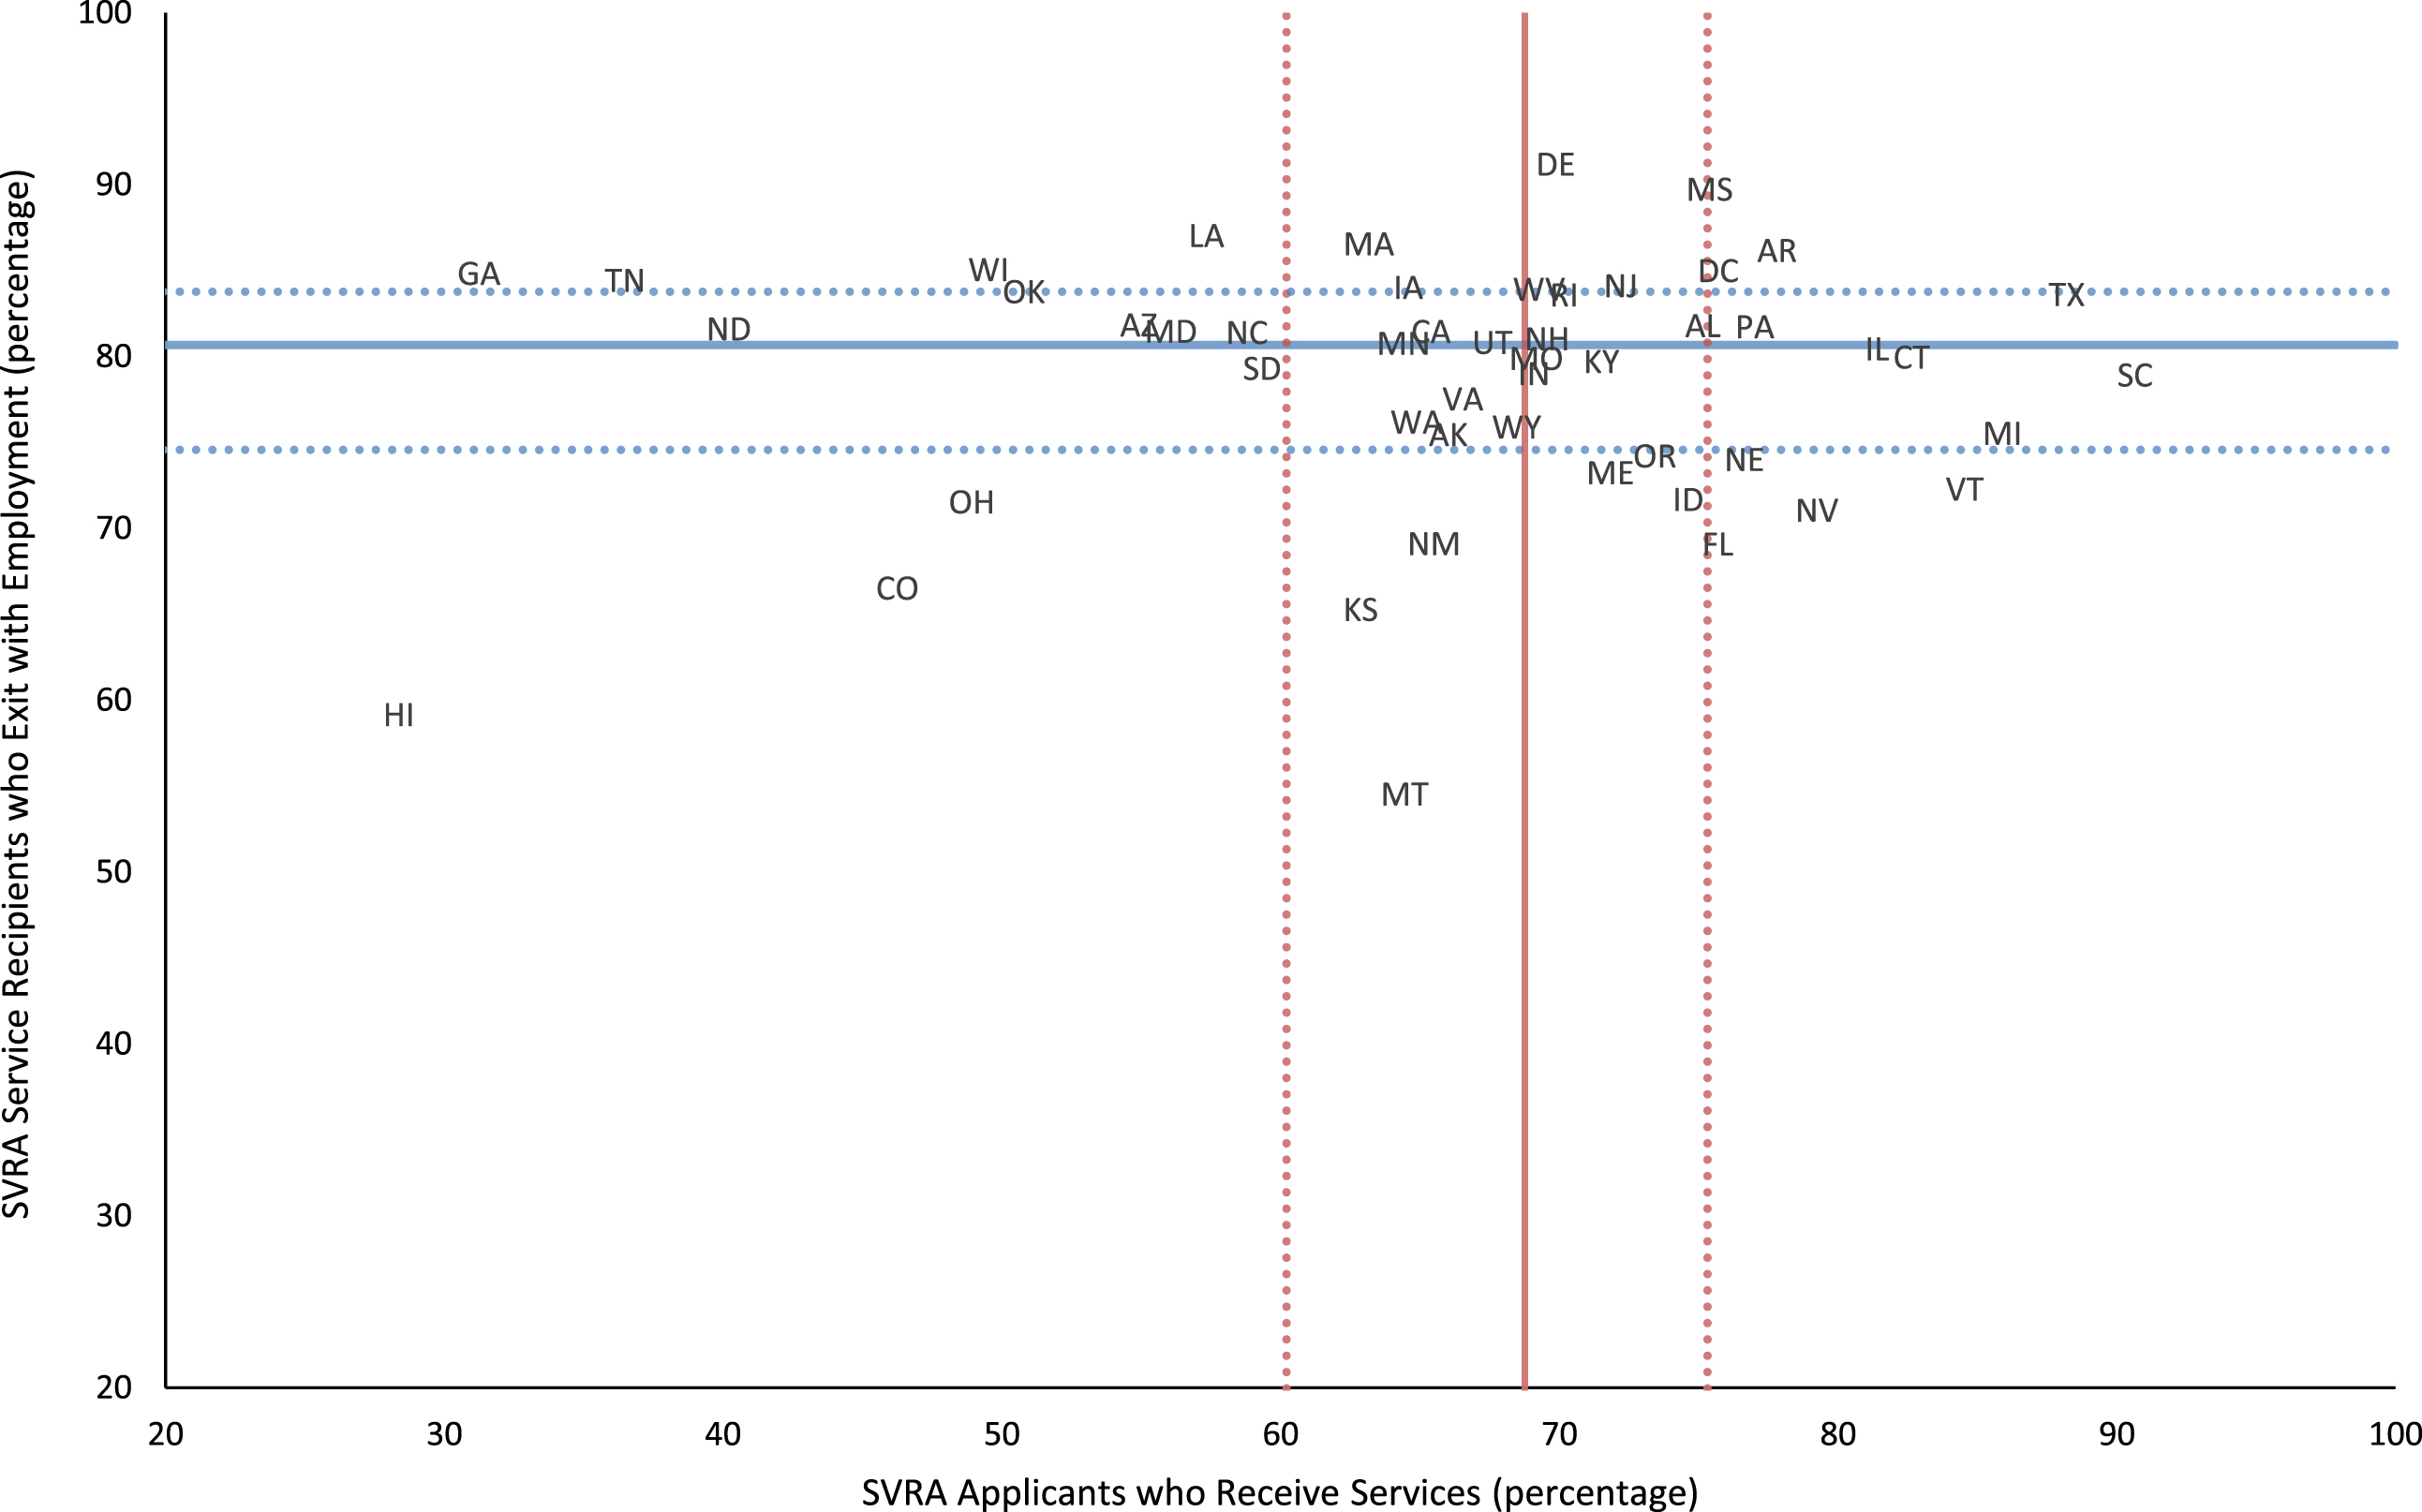
SVRA variation in outcomes for applicants employed for pay in an integrated setting without need of supports. Notes: Among those employed for pay in an integrated setting without need of supports at the time of application to general or combined SVRAs, this exhibit compares the percentage of applicants who receive SVRA services to the percentage of service recipients who exit with employment. Each point represents the percentage of applicants to a general or combined SVRA who receive services (horizontal axis) and the percentage of applicants to that SVRA who receive services and exit with employment (vertical axis). Solid lines represent medians, and dotted lines represent 25th and 75th percentiles.
For applicants with other types of paid employment, fewer SVRAs had relatively high values than low values on both outcomes (Fig. 2). Alabama, Mississippi, and Vermont had values in the highest quartile on both outcomes, in contrast to five SVRAs—Colorado, Hawaii, New Mexico, North Dakota, and Ohio—with predicted values in the lowest quartile on both outcomes. South Carolina was the top SVRA for service receipt for this subpopulation, but the state ranked just above the median for exits with employment. Georgia had the highest share of this subpopulation exiting with employment but fell well below the median on service receipt.
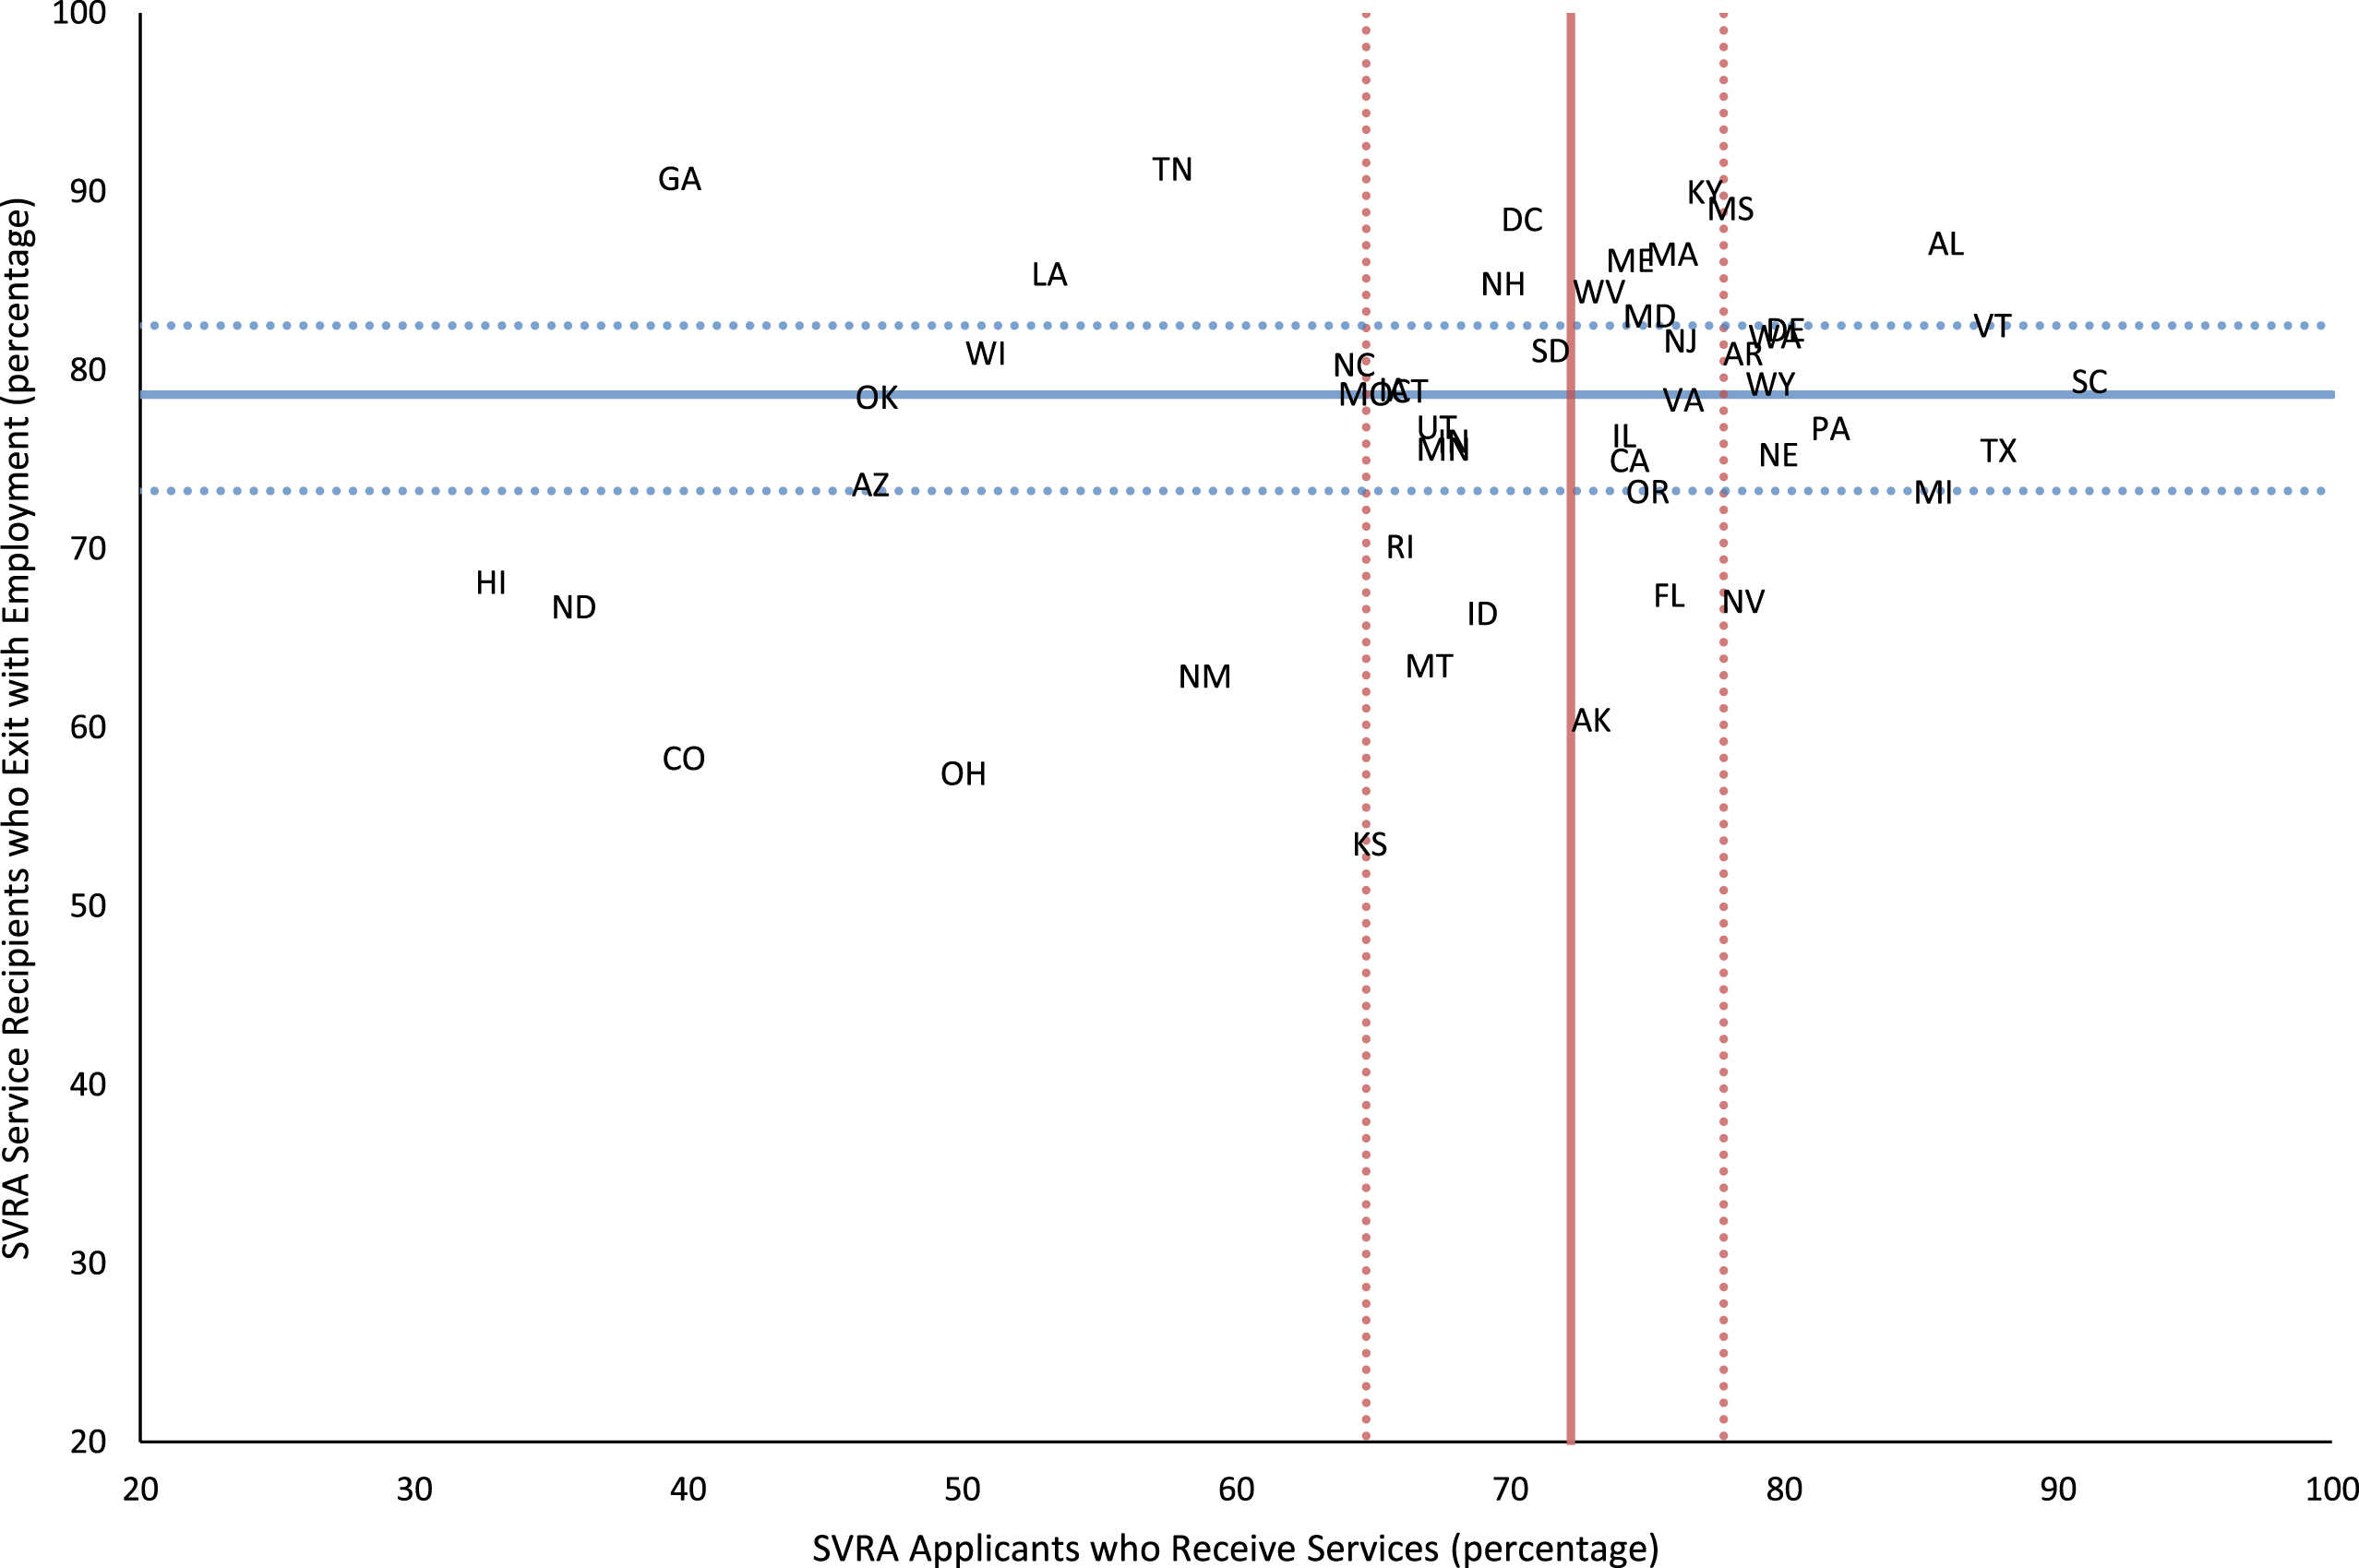
SVRA variation in outcomes for applicants with other types of paid employment. Notes: Among those with other types of paid employment with supports at the time of application, this exhibit compares the percentage of applicants who received SVRA services to the percentage of service recipients who exited with employment. Each point represents the percentage of applicants to a general or combined SVRA who received services (horizontal axis) and the percentage of applicants to that SVRA who received services and exited with employment (vertical axis).
For students not employed applicants, two SVRAs (Alabama and Delaware) were in the highest quartile for both outcomes, whereas DC, Hawaii, Maine, and New Hampshire had values in the lowest quartile for both outcomes (Fig. 3). Michigan was the top SVRA for service receipt for this subpopulation, but fell below the median on exits with employment. Washington had the largest share exiting with employment but was just above the median for the share who received services.
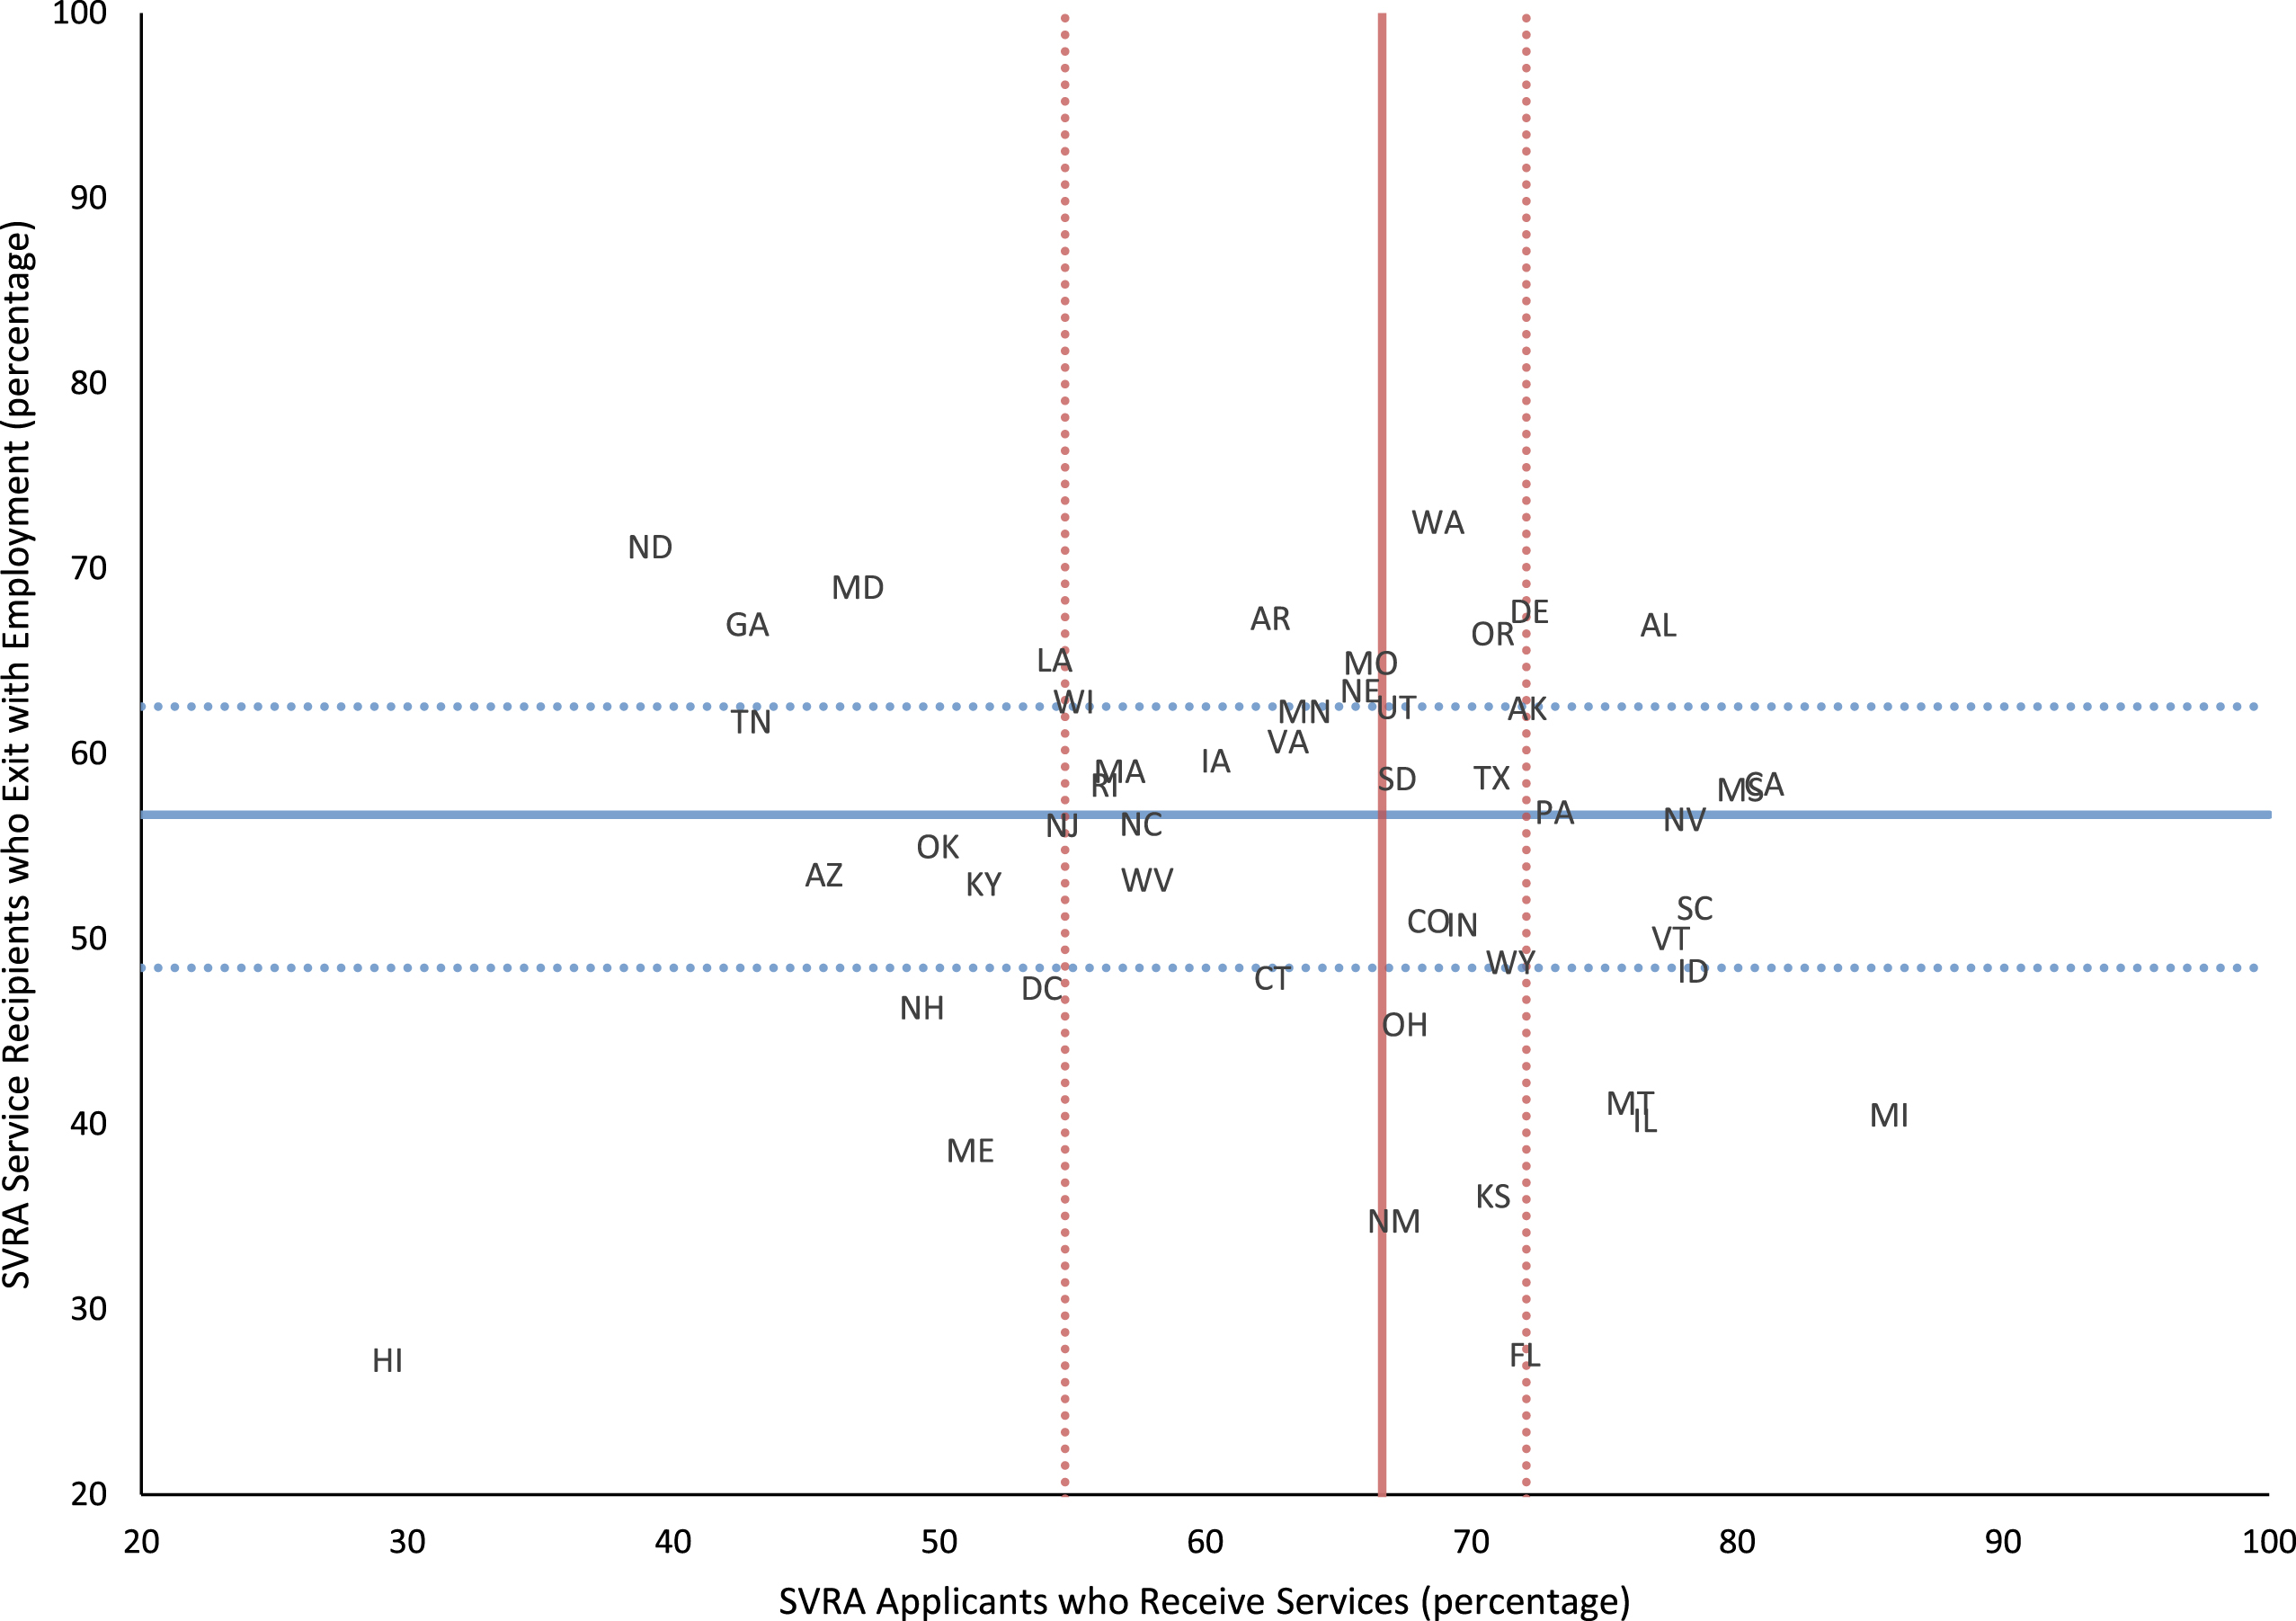
SVRA variation in outcomes for applicants who were students not employed. Notes: Among student applicants who were neither students nor paid workers, this exhibit shows the percentage of applicants who received SVRA services compared to the percentage of service recipients who exited with employment. Each point represents the percentage of applicants to a general or combined SVRA who received services (horizontal axis) and the percentage of applicants to that SVRA who received services and exited with employment (vertical axis).
For applicants who were neither students nor paid workers at application, more SVRAs had high values than low values on both outcomes (Fig. 4). Alabama, Mississippi, Texas, and Virginia had values in the highest quartile on both outcomes, and two SVRAs—Colorado and Hawaii—had predicted values in the lowest quartile on both outcomes. Of all SVRAs, South Carolina had the highest result for service receipt for this subpopulation but was only around the median for exits with employment. Alabama was the top SVRA for exits with employment for this subpopulation, and, as mentioned, was in the top quartile for service receipt to this group.
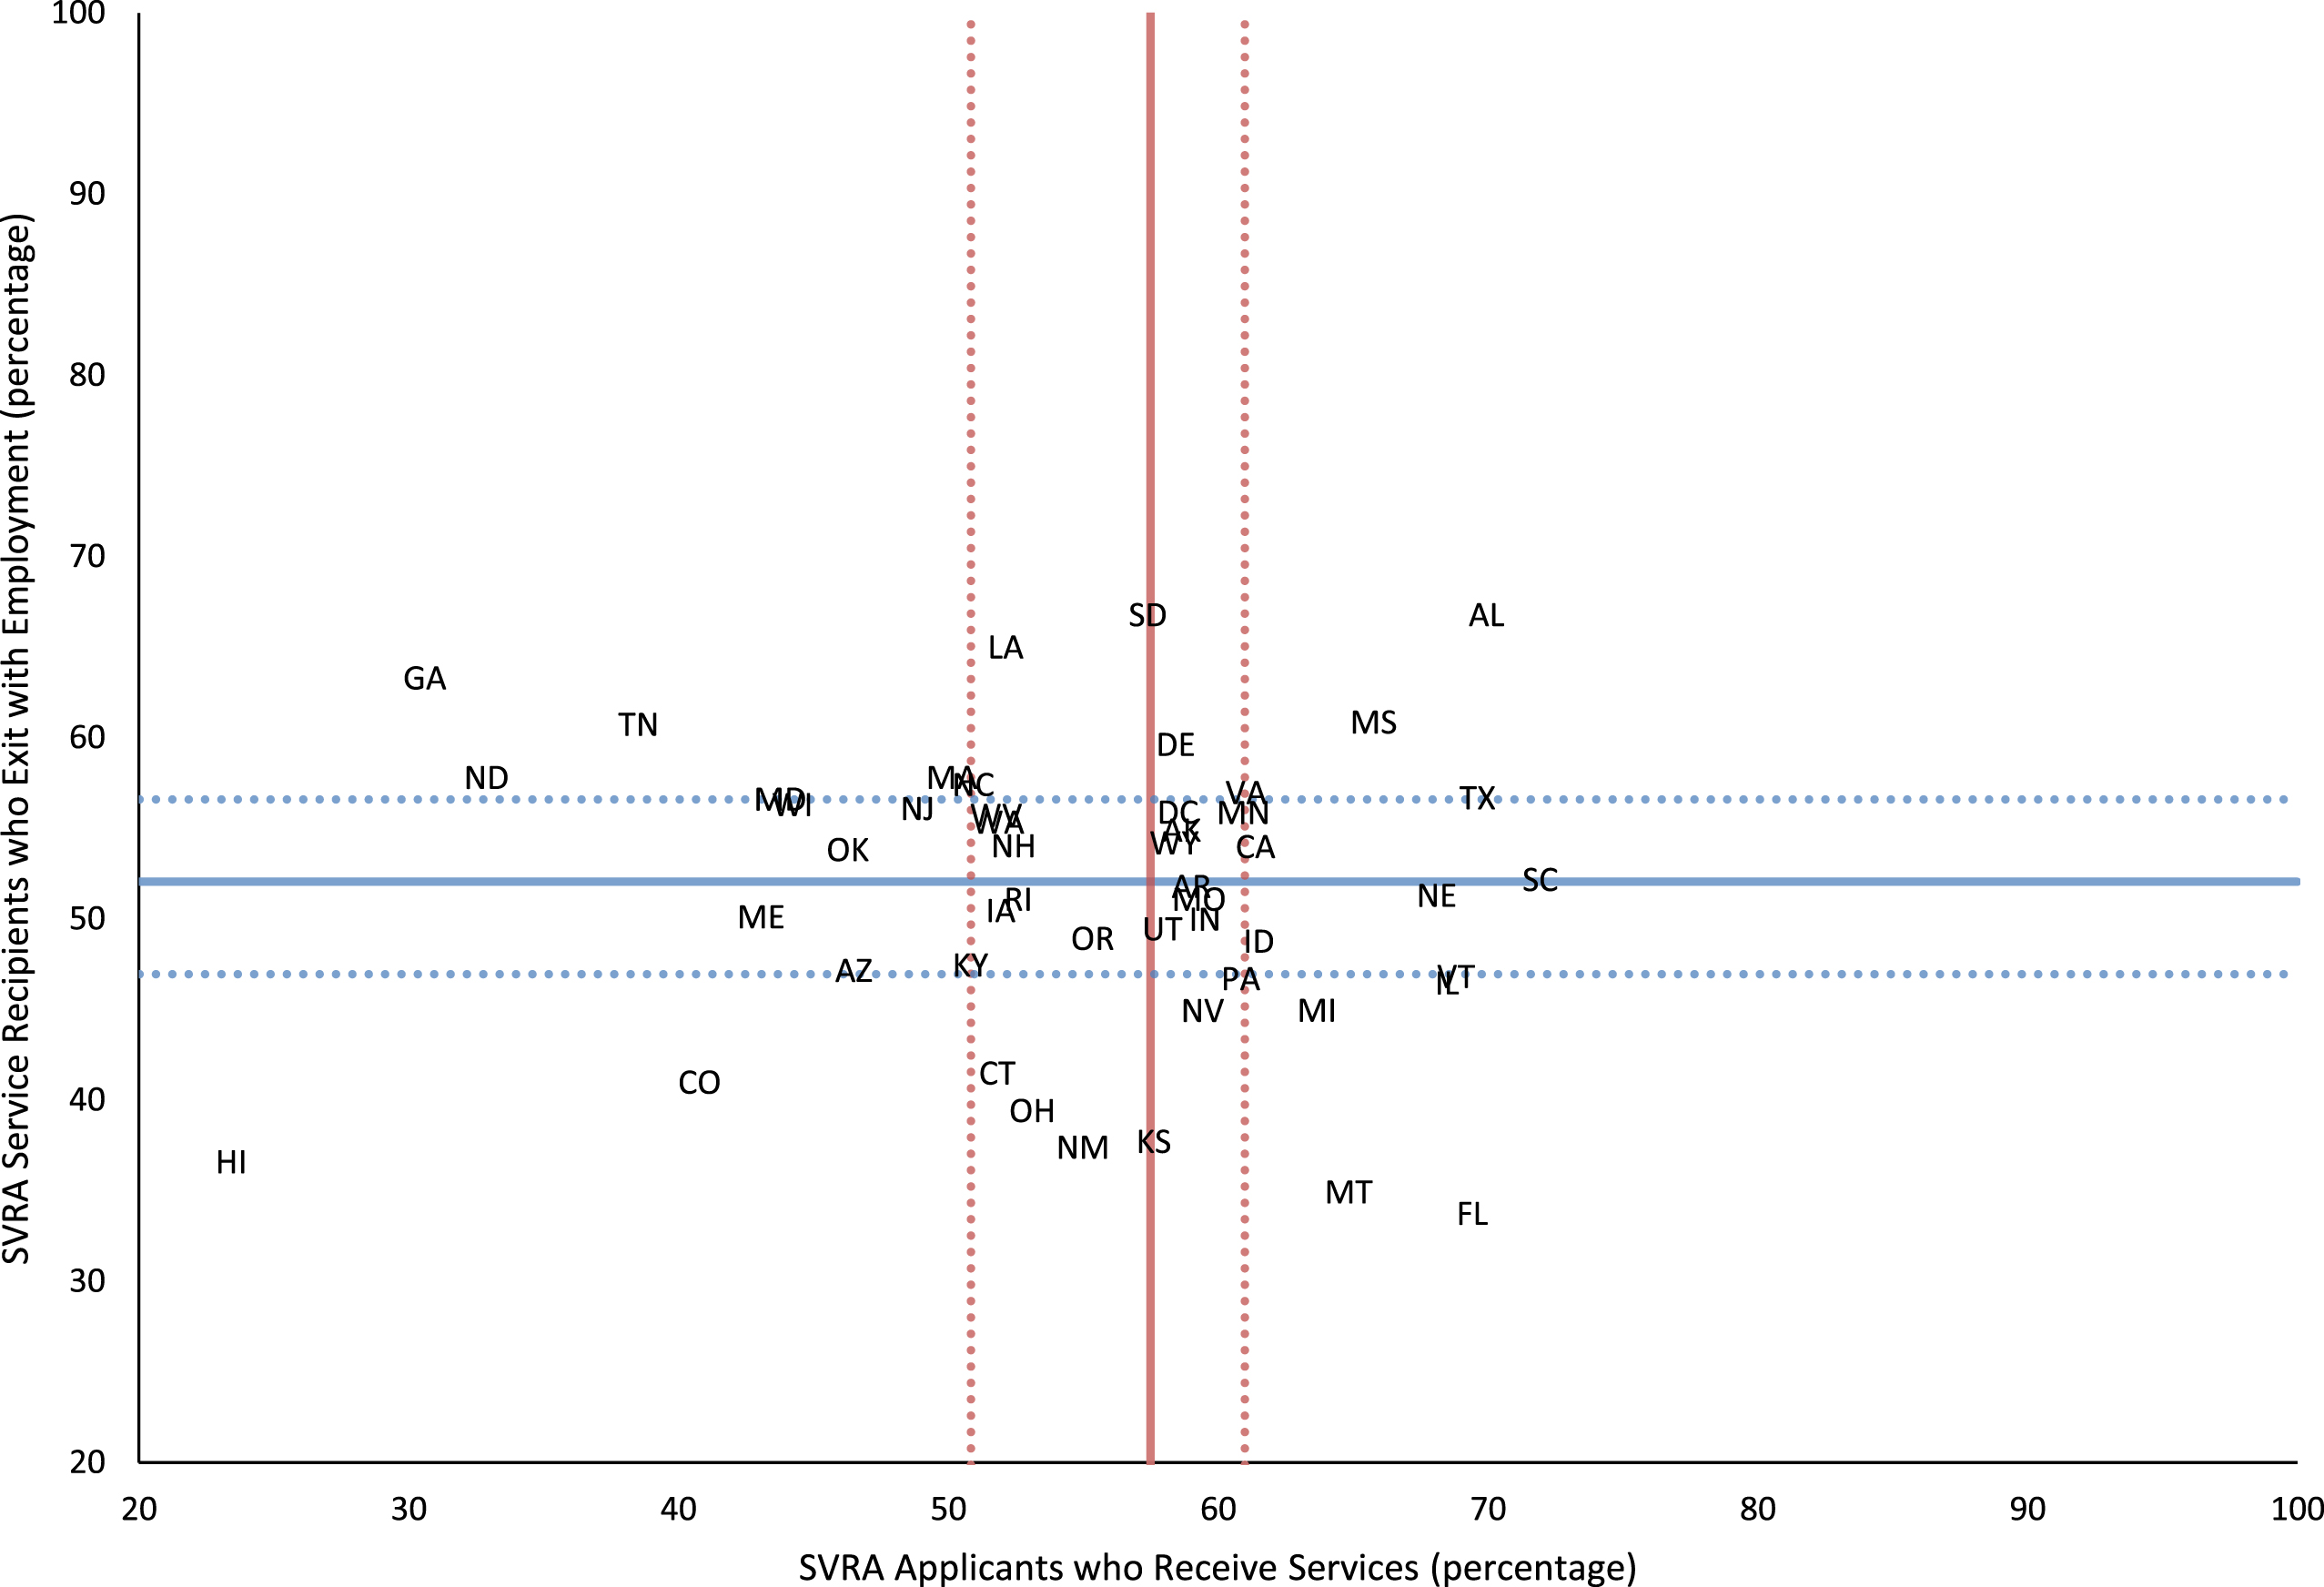
SVRA variation in outcomes for applicants who were neither students nor paid workers. Notes: Among those who were neither students nor paid workers at application, this exhibit shows the percentage of applicants who received SVRA services compared to the percentage of service recipients who exited with employment. Each point represents the percentage of applicants to a general or combined SVRA who received services (horizontal axis) and the percentage of applicants to that SVRA who received services and exited with employment (vertical axis).
Table 2 (as well as Fig. 1–4) shows a broad range of outcome values across agencies and employment status at application groups. Across applicant groups, there was more variation in the outcome regarding receipt of services than in the outcome regarding employment status at program exit. However, within each applicant group, SVRAs’ receipt of services varied more than employment status at program exit. Reviewing both outcomes across SVRAs, some applicant groups had consistently better outcomes relative to the other groups, likely reflecting the substantive differences in employment barriers and facilitators across groups.
The broad outcome ranges are likely due to a variety of factors, some of which may not be related to the ways in which SVRAs provide services. For example, the distribution of impairments among applicants, the distribution of available jobs in a state, the distribution of an SVRA’s referral sources, or individual-level characteristics such as follow-through with services or employment barriers or facilitators could influence outcomes. Non-SVRA service provision factors could also affect each employment status at application group differently. For example, a state’s decision to frequently refer students in secondary or postsecondary schools for VR services might affect the size and composition of that SVRA’s student applicant pool relative to other SVRAs. However, it is likely that at least part of the differences we observed were due to variation in SVRA service provision, which could vary across agencies and within agencies by employment status at application.
The results of our analysis reveal several SVRAs whose outcomes were consistently among the highest (or lowest) performers (Table 3). Eight SVRAs (Alabama, Arkansas, Delaware, District of Columbia, Mississippi, Texas, Vermont, and Virginia) were in the highest quartile on both outcomes for one or more applicant subpopulations, whereas eight SVRAs (Colorado, DC, Hawaii, Maine, New Hampshire, New Mexico, North Dakota, and Ohio) were in the lowest quartile for one or more applicant subpopulations on both outcomes.
General and combined SVRAs in which both outcomes are in the highest or lowest quartile
Notes: The two outcomes described in this table are (1) the percentage of applicants who received services and (2) among those who received services, the percentage of those who were employed at program exit. The label “highest” indicates SVRAs in the top quartile on both outcomes. The label “lowest” indicates SVRAs in the bottom quartile on both outcomes. This table only shows SVRAs that achieved the first or fourth quartile on both outcomes, out of 49 general and combined agencies.
For a few SVRAs in the southern United States, both outcomes were in the highest quartile across multiple applicant subpopulations. Except for the outcome regarding employment at program exit for the student applicant category, all outcomes for Mississippi’s SVRA were in the highest quartile. Alabama’s SVRA had a similar result—except for the paid employment without supports category, all outcomes were in the fourth quartile. For four other southern SVRAs—Arkansas, DC, Texas, and Virginia—both outcomes were in the highest quartile for one applicant group. The Vermont and Delaware SVRAs were the only non-southern SVRAs in which both outcomes were in the highest quartile for an applicant group.
There were no clear regional patterns among SVRAs in which both outcomes were in the lowest quartile across multiple employment status categories. For all outcomes we measured across all employment status categories, Hawaii’s SVRA was in the lowest quartile. Both outcomes in Colorado’s SVRA were in the lowest quartile for all applicant groups except students. Both outcomes for Ohio’s SVRA were in the lowest quartile for the two subpopulations who were employed at application. Both outcomes for five other SVRAs—DC, Maine, New Hampshire, New Mexico, and North Dakota—were in the lowest quartile for one applicant group.
The regional concentration in the South of SVRAs with benefit receipt and employment outcomes in the highest quartile is worth further study. Regional patterns in the South for outcomes among people with disabilities are present in other areas of the literature, such as child SSI payment receipt and young adult outcomes (Hemmeter, Mann, & Wittenburg, 2017; Wittenburg et al., 2015). However, few have documented or explored the mechanisms creating regional patterns in VR outcomes. Most likely, a combination of factors contributed to what we found. Regional employment and education trends might be helping to create state applicant pools with a relatively large number of applicants who can greatly benefit from VR services. It could also be that SVRAs in this region are adopting service provision policies and practices that are driving the outcome trends we observed. Whatever the causes, they are worth understanding because they may have policy implications for SVRAs in the South or throughout the United States.
Our study identified regional patterns and outlying outcomes trends among some SVRAs. Gathering qualitative information about the mechanisms that drive both inter- and intra-agency variation in outcomes would be helpful for understanding the sources of the variation we observed but would be costly and time consuming if it involved all SVRAs. A more efficient strategy is to focus on documenting the practices of those agencies within the states that our study found to be high and low performing. With that information, we should be able to help SVRAs in the age of WIOA learn from one another and disseminate practices associated with desirable outcomes.
Conflict of interest
None to report.
Footnotes
Appendix
Predicted exit with employment after receiving services, by SVRA and employment status at application
| Paid employment without supports | Other paid employment | Students not employed | Neither students nor paid workers | |||||
| Mean | SD | Mean | SD | Mean | SD | Mean | SD | |
| Alabama general or combined | 61.6 | 0.54 | 75.8 | 0.69 | 51.1 | 0.38 | 47.5 | 0.38 |
| Alaska general or combined | 48.8 | 0.65 | 45.0 | 0.94 | 45.5 | 0.89 | 31.9 | 0.39 |
| Arizona general or combined | 47.2 | 0.88 | 34.9 | 1.36 | 25.4 | 0.30 | 22.0 | 0.22 |
| Arkansas general or combined | 67.5 | 0.67 | 64.8 | 0.68 | 41.1 | 0.78 | 30.3 | 0.30 |
| California general or combined | 52.2 | 0.67 | 55.7 | 1.21 | 48.3 | 1.20 | 33.5 | 0.36 |
| Colorado general or combined | 29.6 | 0.75 | 21.1 | 0.44 | 35.7 | 0.73 | 16.5 | 0.22 |
| Connecticut general or combined | 68.8 | 0.90 | 53.3 | 0.84 | 30.1 | 0.78 | 21.0 | 0.20 |
| Delaware general or combined | 63.1 | 0.49 | 65.2 | 1.75 | 49.0 | 0.58 | 34.7 | 0.21 |
| District of Columbia general or combined | 64.4 | 0.97 | 61.4 | 1.41 | 23.7 | 0.77 | 32.5 | 0.54 |
| Florida general or combined | 46.2 | 1.08 | 47.6 | 1.41 | 18.3 | 0.37 | 20.7 | 0.28 |
| Georgia general or combined | 26.7 | 0.68 | 39.1 | 0.89 | 26.4 | 0.34 | 17.4 | 0.25 |
| Hawaii general or combined | 24.2 | 1.67 | 35.6 | 3.24 | 10.9 | 0.51 | 12.7 | 0.58 |
| Idaho general or combined | 55.5 | 0.51 | 46.5 | 0.80 | 40.5 | 0.67 | 30.8 | 0.36 |
| Illinois general or combined | 67.2 | 0.41 | 57.8 | 0.93 | 31.0 | 0.30 | 34.1 | 0.22 |
| Indiana general or combined | 53.3 | 1.03 | 50.4 | 0.70 | 35.6 | 0.69 | 29.3 | 0.15 |
| Iowa general or combined | 56.3 | 1.90 | 52.5 | 1.58 | 36.6 | 0.52 | 25.6 | 0.33 |
| Kansas general or combined | 37.6 | 0.47 | 31.0 | 0.71 | 26.3 | 0.49 | 20.9 | 0.15 |
| Kentucky general or combined | 57.4 | 0.64 | 70.1 | 0.74 | 28.3 | 0.60 | 24.0 | 0.23 |
| Louisiana general or combined | 53.6 | 0.44 | 48.7 | 0.60 | 35.1 | 0.65 | 35.7 | 0.18 |
| Maine general or combined | 54.6 | 0.73 | 62.7 | 1.55 | 20.1 | 0.49 | 20.6 | 0.23 |
| Maryland general or combined | 48.5 | 0.96 | 64.2 | 0.99 | 31.8 | 0.59 | 26.4 | 0.27 |
| Massachusetts general or combined | 56.0 | 0.91 | 67.4 | 1.26 | 33.9 | 0.50 | 29.1 | 0.28 |
| Michigan general or combined | 70.1 | 0.95 | 66.7 | 0.98 | 38.5 | 0.69 | 29.6 | 0.36 |
| Minnesota general or combined | 50.6 | 0.78 | 49.3 | 1.05 | 39.2 | 0.43 | 33.9 | 0.35 |
| Mississippi general or combined | 67.8 | 1.00 | 68.9 | 1.37 | 48.0 | 0.65 | 40.6 | 0.61 |
| Missouri general or combined | 55.1 | 0.29 | 51.2 | 0.49 | 42.3 | 0.72 | 30.7 | 0.25 |
| Montana general or combined | 33.8 | 0.59 | 42.4 | 0.81 | 33.0 | 0.86 | 24.1 | 0.37 |
| Nebraska general or combined | 58.9 | 0.50 | 61.7 | 0.97 | 40.6 | 0.69 | 38.1 | 0.51 |
| Nevada general or combined | 58.5 | 0.73 | 54.5 | 1.05 | 44.2 | 0.44 | 27.8 | 0.30 |
| New Hampshire general or combined | 58.0 | 1.02 | 61.4 | 1.76 | 23.1 | 0.39 | 29.3 | 0.44 |
| New Jersey general or combined | 61.9 | 0.52 | 64.5 | 0.82 | 30.2 | 0.67 | 28.4 | 0.27 |
| New Mexico general or combined | 44.1 | 0.64 | 35.1 | 0.95 | 23.2 | 0.51 | 20.0 | 0.20 |
| New York general or combined | . | . | . | . | . | . | . | . |
| North Carolina general or combined | 45.8 | 0.47 | 49.3 | 0.81 | 33.0 | 0.61 | 28.4 | 0.21 |
| North Dakota general or combined | 34.1 | 0.90 | 30.6 | 1.77 | 28.1 | 0.46 | 18.8 | 0.36 |
| Ohio general or combined | 32.5 | 0.42 | 26.0 | 0.61 | 30.8 | 0.72 | 20.1 | 0.19 |
| Oklahoma general or combined | 44.3 | 0.51 | 38.9 | 1.03 | 29.6 | 0.66 | 24.5 | 0.19 |
| Oregon general or combined | 56.6 | 0.66 | 56.8 | 0.73 | 47.3 | 0.84 | 26.9 | 0.33 |
| Pennsylvania general or combined | 62.1 | 0.42 | 61.7 | 0.62 | 41.1 | 0.44 | 27.7 | 0.27 |
| Rhode Island general or combined | 58.1 | 0.57 | 46.7 | 1.47 | 32.9 | 0.57 | 25.0 | 0.44 |
| South Carolina general or combined | 74.9 | 0.46 | 77.2 | 0.69 | 40.1 | 0.57 | 38.1 | 0.30 |
| South Dakota general or combined | 44.9 | 0.79 | 59.6 | 1.25 | 39.2 | 0.60 | 36.7 | 0.41 |
| Tennessee general or combined | 35.0 | 0.95 | 56.2 | 1.24 | 25.4 | 0.43 | 24.3 | 0.26 |
| Texas general or combined | 75.8 | 0.82 | 67.7 | 0.87 | 41.8 | 0.73 | 40.4 | 0.30 |
| Utah general or combined | 53.9 | 1.06 | 51.8 | 1.78 | 41.9 | 0.57 | 28.1 | 0.42 |
| Vermont general or combined | 64.0 | 0.82 | 75.9 | 0.92 | 40.1 | 0.62 | 35.0 | 0.37 |
| Virginia general or combined | 52.7 | 0.68 | 61.2 | 0.96 | 38.8 | 0.40 | 36.3 | 0.19 |
| Washington general or combined | 48.3 | 0.49 | 66.5 | 1.16 | 48.6 | 0.88 | 27.1 | 0.22 |
| West Virginia general or combined | 57.8 | 0.60 | 62.3 | 0.98 | 30.2 | 0.58 | 27.7 | 0.28 |
| Wisconsin general or combined | 42.3 | 0.67 | 41.8 | 1.17 | 34.1 | 0.59 | 23.2 | 0.20 |
| Wyoming general or combined | 50.6 | 0.81 | 63.0 | 1.00 | 34.5 | 0.47 | 30.8 | 0.43 |
| Arkansas blind | 72.7 | 1.14 | 65.5 | 1.84 | 26.7 | 1.01 | 51.0 | 0.65 |
| Connecticut blind | 89.4 | 0.42 | 89.0 | 0.68 | 41.9 | 1.46 | 48.9 | 1.15 |
| Delaware blind | 82.1 | 0.73 | . | . | . | . | 29.2 | 0.37 |
| Florida blind | 72.0 | 1.11 | 67.8 | 1.36 | 24.2 | 0.78 | 25.5 | 0.35 |
| Idaho blind | 65.4 | 1.23 | . | . | 32.5 | 2.02 | 50.8 | 0.69 |
| Iowa blind | 71.0 | 0.78 | . | . | 16.7 | 0.82 | 43.7 | 0.80 |
| Kentucky blind | 72.2 | 1.01 | 54.0 | 2.43 | 33.2 | 1.32 | 51.4 | 0.55 |
| Maine blind | 62.0 | 1.22 | 54.5 | 1.58 | 19.8 | 0.90 | 55.0 | 1.00 |
| Massachusetts blind | 78.3 | 0.73 | 78.5 | 1.55 | 21.5 | 1.02 | 37.8 | 0.62 |
| Michigan blind | 60.8 | 0.75 | 36.7 | 1.05 | 12.1 | 0.82 | 25.3 | 0.60 |
| Minnesota blind | 71.9 | 0.59 | 46.3 | 1.25 | 26.8 | 1.02 | 25.4 | 0.48 |
| Missouri blind | 75.6 | 0.61 | 85.7 | 0.75 | 44.2 | 1.47 | 35.5 | 0.75 |
| Nebraska blind | 67.5 | 0.47 | . | . | 31.4 | 1.34 | 26.1 | 0.63 |
| New Jersey blind | 74.3 | 1.16 | 74.7 | 1.15 | 34.1 | 1.49 | 32.4 | 0.45 |
| New Mexico blind | . | . | . | . | 12.5 | 0.74 | 9.2 | 0.35 |
| New York blind | 84.2 | 0.73 | 90.4 | 0.49 | 27.6 | 1.32 | 37.8 | 0.89 |
| North Carolina blind | 67.1 | 1.07 | 71.3 | 1.59 | 34.3 | 1.64 | 36.8 | 0.54 |
| Oregon blind | 56.6 | 0.75 | . | . | 31.6 | 1.41 | 41.7 | 0.62 |
| South Carolina blind | 73.6 | 1.16 | 78.6 | 1.32 | 11.4 | 0.72 | 31.6 | 0.59 |
| South Dakota blind | 59.4 | 0.84 | . | . | . | . | 46.8 | 0.48 |
| Texas blind | 91.1 | 0.74 | 90.2 | 0.80 | 35.0 | 1.63 | 54.0 | 1.03 |
| Vermont blind | 71.3 | 0.54 | 78.1 | 1.52 | 16.5 | 1.55 | 54.9 | 0.71 |
| Virginia blind | 59.1 | 1.09 | 64.8 | 1.82 | 21.4 | 0.94 | 22.2 | 0.27 |
| Washington blind | 57.2 | 0.67 | 53.6 | 1.37 | 26.7 | 1.12 | 23.1 | 0.42 |
Notes: Statistics created using data from the RSA-911 file. The table reports statistics for 49 general or combined agencies and 24 blind agencies. The sample includes all VR cases with complete records (i.e., had no missing values for demographic variables) that were closed administratively in fiscal year 2014. The sample excludes cases from New York’s general agency due to missing data. Using the margins command in Stata, we estimated predicted effects from the parameter estimates of logistic and negative binomial regressions. The binary outcome estimates predicted the percentage of the sample that would have achieved an outcome if all sample members in a certain state VR agency had a certain employment status at application. Cells with ‘.’ have insufficient cases for analysis.
Acknowledgments
The authors would like to thank Xiao Barry for programming support and Jody Schimmel Hyde and Todd Honeycutt for helpful comments.
Funding for this study was provided by the Research and Training Center on Employment Policy and Measurement at the University of New Hampshire, which is funded by the National Institute for Disability, Independent Living, and Rehabilitation Research, in the Administration for Community Living, at the U.S. Department of Health and Human Services (DHHS) under cooperative agreement 9ORT5037-02-00. The contents do not necessarily represent the policy of DHHS and you should not assume endorsement by the federal government (EDGAR, 75.620 (b)).