
Abstract
BACKGROUND:
The Vocational Rehabilitation (VR) program provides support and services to people with disabilities who want to work.
OBJECTIVE:
Approximately one-third of eligible VR customers are employed when they exit the program. The remainder either exit without ever receiving services or without employment after receiving services. In this study, we explore how customer characteristics and VR services predict these outcomes.
METHODS:
We examined VR case level data from the RSA-911 files. Machine learning techniques allowed us to explore a large number of potential predictors of VR outcomes while requiring fewer assumptions than traditional regression methods.
RESULTS:
Consistent with existing literature, customers who are employed at application are more likely to exit with employment, and those with mental health conditions or low socioeconomic status are less likely to exit with employment. Some customers with low or no earnings at application who are not identified in prior studies are more likely than others to have poor program outcomes, including those with developmental disability who are under 18, customers without developmental or learning disabilities, and customers who do not receive employment or restoration services.
CONCLUSIONS:
VR counselors and administrators should consider implementing early, targeted interventions for newly identified at-risk groups of VR customers.
Introduction
The Vocational Rehabilitation (VR) program offers tailored supports for people with disabilities in obtaining and retaining employment so they can be economically self-sufficient. The VR program provides employment-focused services and supports that are often not available through other disability support programs. VR administrative data indicate that approximately one-third of eligible VR customers who applied for services in 2014 were employed when they exited the program, but the remainder either exited without ever receiving services or without employment after receiving services.
Because most VR customers exit without employment, we sought to identify the types of customers who might be more likely to experience undesirable outcomes. Several factors likely affect the probability of exiting the VR program without employment, including applicant characteristics, agency-level characteristics, the availability of suitable services, and the local job market. If VR counselors and administrators were able to identify customers at high risk of exiting without employment at the beginning of their VR experiences, they could use this information to develop programs or tailor services differently for these groups of applicants.
In this study, we analyzed VR program data using machine learning (ML) techniques to explore how customer characteristics and VR services predict outcomes. We focused on two key VR outcomes—employment and service receipt status at program exit. Rather than using models developed by researchers based on theory or known relationships between outcomes and covariates, ML techniques rely on algorithms to build models for outcomes based on patterns in existing data. ML is well suited to answer our research questions because it allows us explore a larger number of potential predictors than we could with more traditional regression methods while also requiring fewer assumptions regarding the relationships between these predictors and outcomes (Goldstein et al., 2017). ML can also identify groups of applicants who are at the greatest risk of poor VR outcomes. This paper addresses two research questions: At the time of application to VR, what customer characteristics (such as demographic characteristics, employment, or public funding source) are most important in predicting customers’ status at program exit, and are there previously unidentified groups of customers who are most likely to exit without achieving employment? Among customers who receive services, which factors (including services received) are most important in predicting whether the customer will exit the program with employment?
Background
The VR program provides support and services to people with disabilities who want to work. Eligible applicants must have a physical or mental impairment that impedes work and potentially benefit from services. VR services range from the provision specialized equipment and transportation to work to the provision of supported employment experiences. Application for VR services is voluntary, and services are tailored to meet a customer’s employment barriers and goals. A survey of VR applicants conducted in 2014 revealed that the majority of applicants were motivated to work but faced a variety of employment-related barriers, including: lack of requisite skills, difficulty finding a job, lack of adequate accommodations, and health problems that make work difficult and require time-consuming health care (Eckstein, Sevak, and Wright, 2017).
The program is a federal state partnership: state VR agencies administer the program with oversight from the Rehabilitation Services Administration (RSA) in the U.S. Department of Education. Approximately 80% of VR funding is federal, with the remainder provided by state governments. In the 2016 federal fiscal year, VR provided services to 972,000 customers throughout the United States (U.S. Department of Education, 2017). States either have one VR agency that serves everyone (a combined agency) or two, with one serving blind applicants and another serving all other applicants. If a state VR agency (SVRA) does not have enough resources to serve all eligible applicants, it must prioritize serving people with the most significant disabilities.
VR tracks applicant progress through several process milestones. When someone applies for VR services, SVRA staff determine whether the applicant is eligible for the program. Occasionally, this determination requires having the applicant undergo a trial work experience to consider whether the applicant has the capacity to work. Eligible applicants are either placed on a waitlist (if SVRA resources are limited) or assessed for services. After assessing a customer’s employment goals and barriers, a VR counselor drafts an individualized plan for employment (IPE) that describes the services the SVRA can provide for the customer to achieve his or her employment goals. VR services start after the customer agrees to and signs the IPE. For customers who receive services, the VR counselor records the employment characteristics of customer when he or she exits the program.
Signing an IPE and employment status at program exit are key VR milestones. The percentage of eligible applicants who sign an IPE is a good proxy for how many eligible applicants receive VR services. Because VR’s purpose is to offer employment services for people with disabilities, knowing which eligible applicants eventually receive VR supports is important. Employment status at program exit is the most basic measure of whether an SVRA was successful in the customer achieving his or her employment goals. The measure (as captured in SVRA administrative data) records whether a customer was employed for 90 days before program exit. The Workforce Innovation and Opportunity Act (WIOA) of 2014 requires several additional outcome measures in addition to employment status at program exit. Nevertheless, employment status at program exit was the primary measure of VR program success before WIOA and remains an important focus for SVRAs.
If VR counselors and administrators knew what customer characteristics at application were correlated with these key program milestones, they could allocate additional time and resources toward at-risk applicant groups through targeted programs or additional counselor resources for certain applicants.
Multiple previous studies have used regression analysis and other techniques to measure these correlations and found that both applicant- and agency-level characteristics are correlated with VR outcomes. In particular, previous research has found strong positive correlations between employment (both at and after VR exit) and employment status or education level at application (Honeycutt et al., 2017; Martin et al., 2020). There is also evidence that postsecondary education-related VR services are positively correlated with competitive employment at program exit (Gilmore et al., 2001).
Sociodemographic characteristics are also correlated with VR outcomes. Gonzalez et al. (2011) used a data mining method to predict VR outcomes using RSA-911 data and found that receipt of public support (including Supplemental Security Income [SSI] or Social Security Disability Income [SSDI]) was the most predictive of VR outcomes—customers who did not receive any public support at application were more likely to exit with employment (Gonzalez et al., 2011). There is also a large body of literature documenting racial and ethnic disparities in VR. Relative to white applicants, non-white VR applicants have lower acceptance rates, receive fewer services when accepted, and are less likely to exit VR with a successful employment outcome (Awsumb et al., 2020; LeBlanc et al., 2008; LeBlanc and Smart, 2007; Martin, 2010; Rosenthal et al., 2005)
Finally, there is variation in VR outcomes across state agencies and over time, suggesting that agency-level characteristics and geographic variation in the labor market and policy environment affect the experiences VR customers. Individuals who apply to state VR agencies for which applicant demand exceeds agency resources are less likely than other applicants to receive services and to exit with employment (Honeycutt et al., 2015, 2017). Variation in counselor experience and training might also account for a portion of the variation in employment outcomes—recent work suggests that counselors with master’s degrees in rehabilitation counseling were more likely than counselors with different training to have clients with competitive employment outcomes at program exit (Mackay et al., 2020).
Materials and methods
Our study builds on previous work by using recently developed techniques in data science to measure correlations between individual characteristics and outcomes with greater precision and flexibility. It also allows for the discovery of previously unexplored interactions between individual applicant characteristics and VR services. If our analysis finds new correlations between applicant characteristics and IPE signings or program exits with employment, these findings might provide VR counselors and administrators with information to craft policies that target and assist applicants who might be more likely to have poor program outcomes.
Data
Our analysis relied on VR case-level administrative data—the RSA-911 Case Service Report. These data contain information on customer characteristics at application, VR services received, and employment status at program exit. SVRAs regularly report this information to RSA. RSA-911 files from before July 2017 contain only information on cases closed during a certain year. After July 2017, the data include both active and closed cases on a quarterly basis. Service information might be incomplete for customers who close after July 2017; that is, the quarterly data might include only service information for services received during the quarter. About 86% of customers in the analysis sample closed prior to the RSA-911 reporting change.
We limited our analysis to customers who applied and were found eligible for VR services at general or combined agencies in 2014 and closed no later than June 2019. 1 We exclude customers who exited the program because of ineligibility and any who receive services from agencies outside of the 50 United States and the District of Columbia. VR applicants can be found ineligible for a variety of reasons, including having a disability of such significance that VR services would not be of benefit or having no disabling condition nor impediment to employment. Focusing on applicants from a single year—no matter when their case closed—avoids bias because case closures in a single year are not representative of a cohort of applicants. Our analysis sample contains 490,225 cases from application year 2014, which represents approximately 87% of all applicants from that year. 2
All exiting customers fall into one of three mutually exclusive outcome categories: (1) those who exited VR before receiving program services, (2) those who exited VR after receiving services (signing an IPE) but without employment at program exit, and (3) those who exited VR with employment. Approximately one-third of the sample (34.8%) was employed at program exit, with the remainder either exiting the program after signing an IPE but without an employment outcome (29.6%) or exiting without having received VR services (35.6%).
We considered a wide set of customer characteristics as candidate outcome predictors. These predictors are observed at VR application and include age; gender; race and ethnicity; education level; disabling condition; sources of public funding (such as Supplemental Security Income (SSI), Social Security Disability Insurance (SSDI), and Temporary Assistance for Needy Families (TANF)); health insurance coverage; VR referral source; and employment.
A subset of our analysis used VR services as predictors. We grouped VR services into eight categories: Diagnosis and evaluation. Education: Education services include college-level training from junior, community, or four-year colleges. Employment: Employment-related services include assistance with job search, job placement, and short- and long-term supports. Transportation and maintenance: Maintenance is monetary support provided for those expenses such as food, shelter, and clothing that are in excess of normal expenses and that are necessary for receipt of VR services. Pre-employment transition services (pre-ETS): Pre-ETS include job exploration counseling, work-based learning experiences, counseling on training or educational opportunities, workplace readiness training, and instruction on self-advocacy. Restoration: restoration services include diagnosis and provision of rehabilitation technology.
3
Training: Job training services include occupational training, on the job training, apprenticeships, basic academic or literacy training, disability skill training,
4
Other services. Analysis sample summary statistics for customer characteristics and services are presented in Tables 12, respectively.
Characteristics of 2014 VR applicants
Characteristics of 2014 VR applicants
Note. Source is RSA-911 data for customers who applied for VR services in calendar year 2014, were found eligible, and exited the program no later than June 30, 2019. The sample included 490,225 cases.
Services received among customers who had a signed IPE
Note. Source is RSA-911 data for customers who applied for VR services in calendar year 2014, were found eligible, and exited the program no later than June 30, 2019. The sample included 315,870 cases.
We used ML techniques to explore the predictive relationship between customer characteristics and the probability of falling into one of the three outcome groups. For example, logistic regression assumes any particular variable will increase or decrease the odds of an outcome by the same multiplicative amount, regardless of any other characteristics. This assumption can be relaxed by including interactions between predictors (e.g., disability type interacted with gender), but the analyst has the responsibility to specify these interaction terms before estimating the model. With many predictors, every decision to include or exclude a particular interaction term represents another assumption made by the analyst (Westreich et al., 2010). In contrast, ML methods do not require such assumptions.
The two ML modeling approaches used in this study—classification and regression trees (CART) and random forests (RF)—both consider every possible interaction between predictors by default. Thus, the relationships that the model identifies as important are selected through data-driven criteria, not researcher assumptions. Though econometric approaches informed by theory have value (such as specifying known relationships between variables and outcomes), ML methods are more likely than traditional regression approaches to reveal previously unknown or unexplored relationships between predictors and outcomes.
A key limitation of many ML techniques (including CART and RF) relative to regression techniques is that relationships between predictors and outcomes cannot generally be expressed in terms of a single number such as a regression coefficient, which can make the output less interpretable than standard regression-based approaches. Various strategies have been developed to draw substantive conclusions from these models including regression tree figures for CART models and a back-of-the-envelope marginal effect estimation for RF, both of which we employ to interpret our ML results. We discuss these techniques in more detail below.
Analysis phases
We divided the analysis into two distinct phases, each corresponding with a research question. Both phases attempt to understand which predictors are associated with VR outcomes but focus on different parts of the VR service path: In the first phase, we examined how customer characteristics at application are related to status at program exit. Receipt of specific types of VR services, such as job training or transportation, are not considered. We define customers’ exit status as falling into one of three groups: (1) exiting without receiving services, (2) exiting after receiving services but without employment, and (3) exiting after receiving VR services and with employment. We include all VR applicants that meet our study criteria in this phase of the analysis. In the second phase, we explored how customer characteristics at application and types of services received are associated with status at program exit. This analysis necessarily excludes all customers who exited the program without signing an IPE and therefore considered two program exit outcomes: (1) exiting after receiving services but without employment and (2) exiting with employment.
Modeling approach
For each phase, we fit two ML models: a CART model and an RF model. Below, we briefly describe these models and how they address the research questions.
Classification and regression trees
CART (Breiman et al., 1984) is a machine learning approach that relies on recursive partitioning of the data. A decision rule identifies the predictor that best separates the data into groups with average outcomes that are most dissimilar. The two groups are then further partitioned based on other predictors, with the process repeating until meeting a stopping condition. The resulting sequence of decisions is commonly visualized as a “tree” structure, where the expected outcome for any customer can be found by following his or her path from the top of the tree to the terminal node (“root”).
CART models are relatively simple to understand and visualize (Hastie et al., 2009). The most important predictors usually appear at the top of the tree, revealing the most prominent patterns between predictors and outcomes. The tree also serves to stratify the analytic sample into subgroups—defined by predictors—that have similar outcomes within the group. A common criticism of CART models is they are highly variable—small random variation in the data can change the structure of tree. Hence, CART models are most common in cases where the primary concern is producing output that is easy to interpret, rather than having the highest degree of predictive accuracy.
Random forest
Random forest (Breiman, 2001) modeling addresses some of the shortcomings of CART models, particularly the robustness of the tree structure and the resulting predictions. An RF model fits many trees, each of which includes a small amount of random variation. This random variation comes in two forms. First, each tree is fit to a sample of the full data set. Second, at each potential split in the trees, the model only considers a random subset of the predictors. The approach delivers more robust predictions by averaging the results across all the trees. Our RF implementation fits 500 trees, with all tuning parameters—the number of potential predictors that are considered at each split, as well as the stopping rule—optimized using cross-validation. 5
Though RF models are more robust than CART trees, they are not as easily interpretable because it is difficult to visualize multiple trees. We used two techniques to extract interpretable results from the RF models:
Missing data
Several variables in the RSA-911 data have missing values. For some variables, the missingness is relatively uncommon and is randomly dispersed throughout the dataset. However, for six variables in our sample, the missingness is due to changes in RSA reporting requirements. Specifically, two variables (state marketplace insurance coverage and pre-ETS) were missing for cases that closed prior to the July 2017 reporting changes, and four variables (repeat closure, employment at application, weekly hours worked at application, and weekly earnings at application) were missing for all cases that closed after July 2017. Fourteen percent of the analysis sample closed after July 2017.
For our models to handle both the systematic missingness (due to the reporting changes) and random missingness, we used a multiple imputation procedure. More specifically, we used a procedure known as multiple imputation with chained equations (van Buuren & Groothuis-Oudshoorn 2011), creating five imputed datasets. Each variable was imputed using an algorithm that is appropriate for its variable type: predictive mean matching for continuous variables, logistic regression for binary variables, and multinomial logistic regression for categorical variables. Unless otherwise indicated, all results presented below are averaged across the five imputed data sets. The key assumption that our procedure makes is that the relationship between the variables with missing and non-missing values does not change before and after July 2017. We think this is a reasonable assumption for our data.
Results
In the following sections, we describe findings for both phases of our analysis. We first explored the relationships between customer characteristics observed at application and VR outcomes. Second, we restricted our sample to customers who had a signed IPE and included service categories as predictors along with customer characteristics. For each phase, we present marginal effects (MEs) of selected binary predictors on each of the three outcome categories (Figs. 13) and regression tree results (Figs. 24). We show MEs for binary predictors in the top 10 most important predictors from the RF model in the top panels of Figs. 24 and other selected binary predictors in the bottom panels.

Marginal effects of selected predictors on three VR outcome categories. Note. Source is RSA-911 data for customers who applied for VR services in calendar year 2014, were found eligible, and exited the program no later than June 30, 2019. The sample included 490,225 cases. This figure presents marginal effects in percentage points for selected candidate predictors from an RF model. The marginal effect for each predictor is calculated by fixing the value of that predictor to “1” for every observation and predicting the outcome for each observation, then fixing it to “0” and again predicting the outcome for each observation, and finally calculating the average difference between the two predictions. For each predictor, the MEs on the three outcome categories will sum to zero.

CART model results. Key: A = Exited with IPE, no employment; B = Exited with IPE, no employment; C = Exited with employment. Note. Source is RSA-911 data for customers who applied for VR services in calendar year 2014, were found eligible, and exited the program no later than June 30, 2019. The sample included 490,225 cases. This figure presents the results from a CART model that identifies the predictor that best separates the data into groups with average outcomes that are most dissimilar. The two groups are then further partitioned based on other predictors, with the process repeating until meeting a stopping condition. This tree is truncated for simplicity. Each node of the tree represents a split in the sample based on the predictor listed and shows the proportion of the sample with the corresponding characteristics that fall into each of the three outcome categories: (1) exiting VR without receiving services, (2) exiting VR after receiving services but without employment, and (3) exiting VR with employment. The percentage at the bottom of each node is the proportion of the analysis sample that has the set of characteristics associated with that node.

Marginal effects of selected predictors on exiting with employment among customers who received an IPE. Note. Source is RSA-911 data for customers who applied for VR services in calendar year 2014, were found eligible, received an IPE, and exited the program no later than June 30, 2019. The sample included 315,870 cases. This figure presents marginal effects in percentage points for selected candidate predictors from a Random Forest model. The marginal effect for each predictor is calculated by fixing the value of that predictor to “1” for every observation and predicting the employment outcome for each observation, then fixing it to “0” and again predicting the outcome for each observation, and finally calculating the average difference between the two predictions.
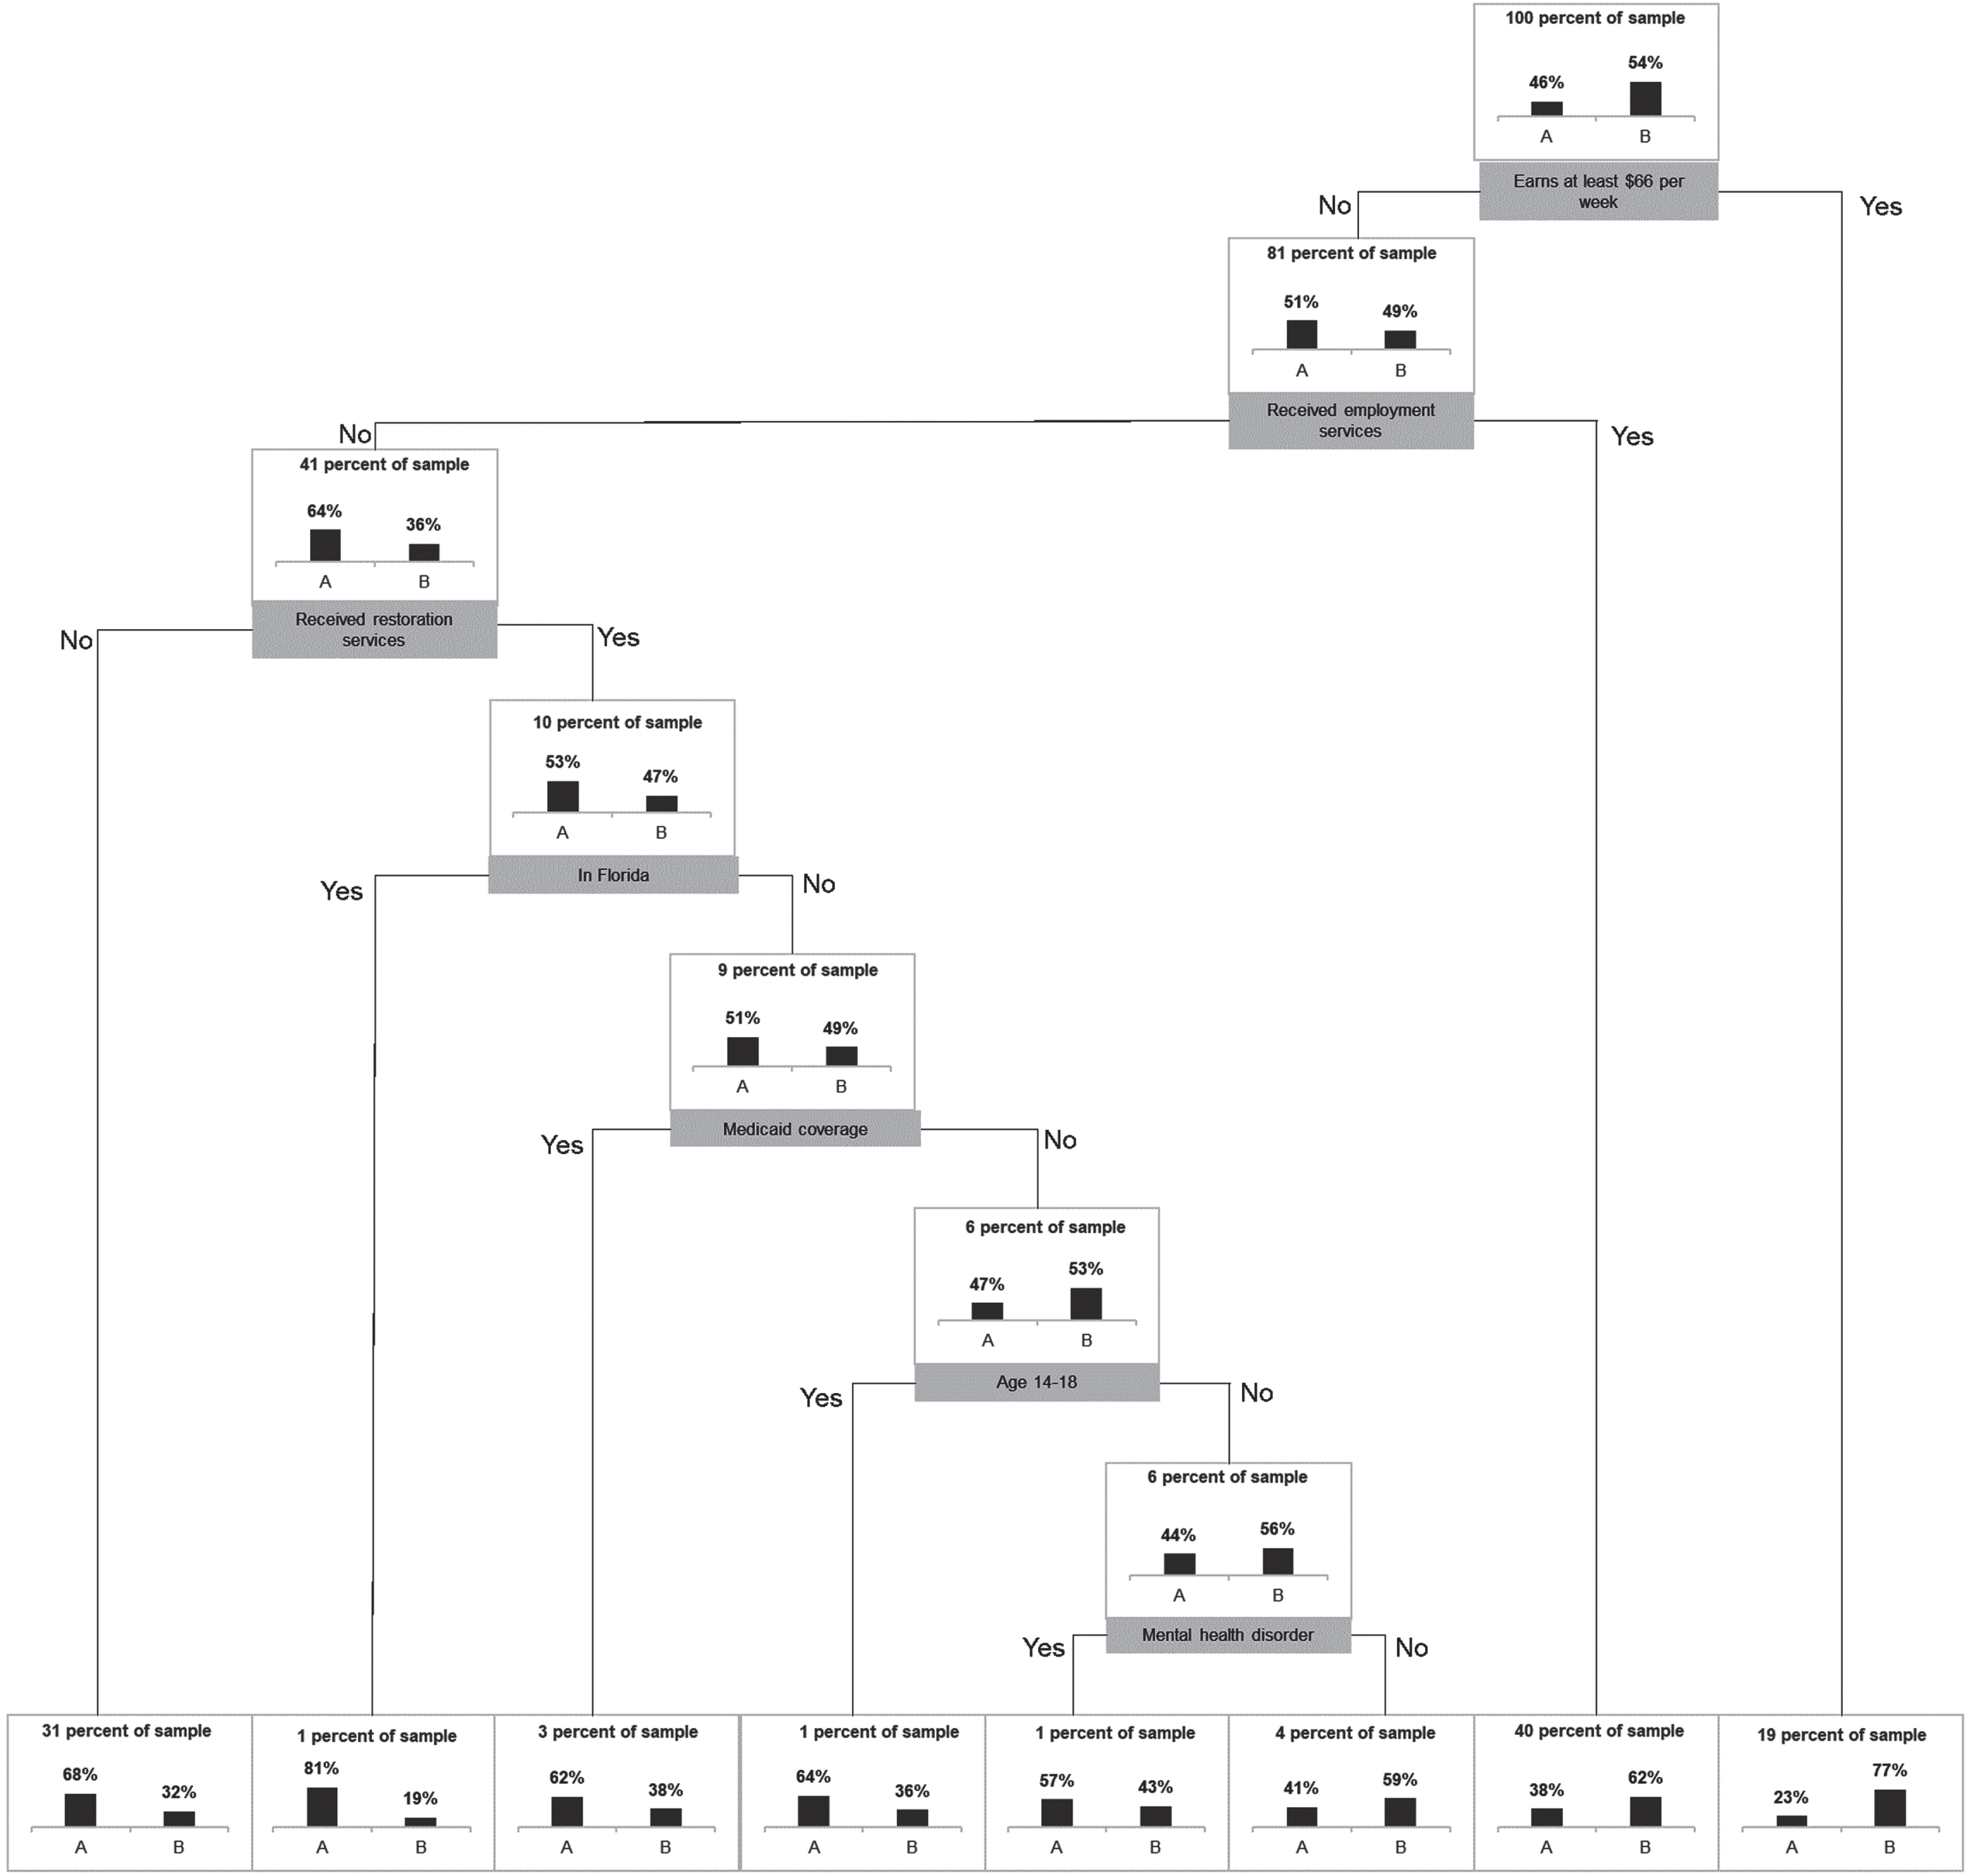
CART model results among customers who received an IPE. Key: A = Exited with IPE, no employment; B = Exited with employment. Note. Source is RSA-911 data for customers who applied for VR services in calendar year 2014, were found eligible, received an IPE, and exited the program no later than June 30, 2019. The sample included 315,870 cases. This figure presents the results from a CART model that identifies the predictor that best separates the data into groups with average outcomes that are most dissimilar. The two groups are then further partitioned based on other predictors, with the process repeating until a stopping condition is met. This tree is truncated for simplicity. Each node of the tree represents a split in the sample based on the predictor listed and shows the proportion of the sample with the corresponding characteristics that fall into two outcome categories: (1) exiting VR after receiving services but without employment, and (2) exiting VR with employment. The percentage at the bottom of each node is the proportion of the analysis sample that has the set of characteristics associated with that node.
Importance and marginal effects of individual predictors
Several customer characteristics were associated with a substantially lower probability of exiting VR without a signed IPE. Customers who were competitively employed at application were 14.3 percentage points (pp) less likely than unemployed customers to exit without receiving an IPE (Fig. 1). Customers employed in non-competitive environments at application—such as community rehabilitation programs or occupational workshops—were also less likely than unemployed customers to exit without receiving an IPE (-5.4 pp). Customers with developmental disabilities, those with a learning disability, and those with mental health conditions were less likely than customers with other disabling conditions to exit VR without signing an IPE (-11.1 pp, - 5.2 pp, and - 3.7 pp, respectively). Customers with privately purchased health insurance coverage were less likely (–3.9 pp) to exit without a signed IPE than others. SSI payments, Medicaid coverage, and non-white race were all associated with modest increases in the probability of exiting VR without an IPE. All marginal effects for these characteristics were below two percentage points.
Among the variables associated with lower probability of exiting VR without a signed IPE, some were also strongly positively associated with employment at exit whereas others are more associated with exiting without employment. Customers who were competitively employed at application were 5.3 pp more likely than others to exit with employment but are also 8.9 pp more likely to exit after an IPE without employment (Fig. 1). Customers who were employed in supported, non-competitive environments at application were also slightly more likely to exit with employment (2.3 pp). Customers who were not employed because they were students at application were 3.2 pp more likely than unemployed customers to exit without employment and slightly less likely to exit with employment. Customers with developmental disabilities were much more likely than others to exit with employment (9.4 pp). Customers with mental health conditions were more likely than others to exit after an IPE without employment (5.8 pp), and less likely to exit with employment (–2.1 pp). SSI payment receipt at application is negatively associated with employment at program exit (–3.9 pp).
Groupings of predictors and their relationships with VR outcomes
Earnings at application is the predictor that best separates the sample into groups with different outcome rates. Figure 2 presents the results of the CART model, with more impactful predictors appearing closer to the top of the tree. Earnings of at least $53 per week most strongly predicted program exit with an employment outcome. Among VR customers who earned more than $53 per week, 58% exited with an employment outcome, whereas 30% of those who earned below $53 per week did. The tree branches more among customers who earn less than $53 per week at application (including those with no earnings), who are unlikely to be competitively employed but has no further branching among those earning at least $53 per week.
Customers who earn less than $53 per week at application are further divided by CART into groups by disabling condition and age. Those who have a developmental disability are more likely than those who do not to exit with employment (40% vs. 29%) and they are less likely to exit without receiving an IPE (26% in this group vs. 40% among low earners without a developmental disability). The CART splits this group further by age. Those who are older than 18 are more likely than customers ages 14 to 17 to exit with employment (41% vs. 36%) and more likely to exit without receiving an IPE (27% vs. 22%). Those ages 14 to 17 are less likely than the average customer to exit without signing an IPE (22% vs. 36%) and much more likely to exit after receiving services without employment (42% vs. 30%), while closing with employment is about the same (36% vs. 35%).
Low earners without a developmental disability are further divided by learning disability and age. Customers without a learning disability are most likely to exit without receiving an IPE (43%) and least likely to exit with employment (26%). Customers with a learning disability are less likely to exit without receiving an IPE, but roughly equally likely to exit with and without employment. Those age 18 or younger are roughly equally likely to exit without employment after an IPE (39%) or exit with employment (37%), while those older than 18 are roughly equally likely to exit with employment (36%) or to exit without an IPE (35%).
Customer characteristics at application and services received
Importance and marginal effects of individual predictors
Though employment-related characteristics remain important predictors among customers who received an IPE, four service categories displace customer characteristics in the list of the most important predictors of employment (Fig. 3) Employment-related services—including assistance with job search, job placement, and short- and long-term supports—were the most predictive of employment status at program exit within the group of customers who received services. Specifically, employment at program exit was 21.3 pp more likely among customers who received employment-related services. Other service categories that positively predicted employment included transportation and maintenance and job training services, which include on the job training, apprenticeships, basic academic or literacy training, disability skill training, job readiness training, and other miscellaneous training. The relationship between service receipt and outcomes might reflect the true impact of particular service types on employment, but they might also reflect unobserved characteristics of customers who receive these services.
Disabling condition, public support at application, and source of insurance coverage are not in the top 10 predictors from the RF model, but their relationships with VR outcomes are similar to the first phase. Those with a developmental disability are 2.3 pp more likely to be employed than other customers whereas customers with a mental health condition are 6 pp less likely to exit with employment. Customers who received SSI payments at application are 6.8 pp relatively less likely to exit the program employed (Fig. 3). Medicaid insurance coverage is negatively correlated with employment at program exit, whereas private sources of coverage (employer sponsored and other private coverage) were positively associated with employment at program exit.
Groupings of predictors and their relationships with VR outcomes
Like the previous analysis, the CART divides customers who received an IPE first in terms of weekly earnings at application. Earnings of at least $66 per week strongly predict an employment outcome: 77% of VR customers who earned more than $66 per week exited with an employment outcome, while among lower earners the proportion was 49% (Fig. 4) The tree branches more among customers who earn less than $66 per week at application, but has no further branching among those earning over $66 per week indicating that among customers with a signed IPE, those who were employed and earning at least $66 were much more likely to exit with employment than others regardless of their service mix and other characteristics.
Customers who earn less than $66 per week at application and receive employment services are more likely than average to exit with employment (62%) in the tree in Fig. 4. Customers who earn less than $66 and who do not receive employment services are less likely than the whole group to exit with employment services except for a small group of customers who receive restoration services, which include diagnosis and provision of rehabilitation technology; do not live in Florida; are older than 18; and do not have a mental health conditions. This specific group of customers is slightly more likely than the whole group to exit with employment (59% vs. 54%).
Discussion
We applied ML methods to case-level VR administrative data to explore the relationship between VR customer characteristics, service receipt and outcomes. The flexibility of the CART and RF models allowed us to explore relationships without making assumptions about the nature of those relationships.
Our findings highlight the strong link between employment status at application and positive program outcomes, which is consistent with prior findings (Honeycutt et al., 2017; Mann et al., 2017; Martin et al., 2020;) that employment at application is highly correlated with employment at VR exit. Customers who are employed at application are more likely to exit with employment, and employment at application is such a strong predictor of VR outcomes that no other customer characteristics or services are very important predictors for these customers. Being employed at application is likely to signal several individual characteristics that are not directly observable in the RSA-911 files, but that are strong predictors of employment. We suggest four potential explanations for the strong link between employment at application and successful VR outcomes, though this is not an exhaustive list. First, employment at application indicates that the applicant is able to work and is employable. Second, being employed likely signals a strong motivation to work, which would be reinforced by the receipt of appropriate VR services. Third, applicants who are employed might be able to keep the same job while receiving VR services. Finally, applicants who have worked might require less intensive or more commonly available services and supports than those who have not worked.
Among customers who are not employed or earn little at application, employment-related services including paid and unpaid work experiences and job supports nearly double the probability of exiting with employment and no other services or customer characteristics are very important when employment-related services are provided. In the absence of employment services, restoration services also appear to improve the odds of exiting the program employed. Combined with the strong, positive association between employment at application and employment at program exit, our results indicate that work experience is the best predictor of good VR outcomes. Work experiences and job supports appear to improve outcomes regardless of other customer characteristics or services and should be considered first among customers who apply for VR services without employment.
Though common VR services—such as paid work experiences and transportation—are likely to benefit customers with mental health conditions and developmental disabilities (Moore et al., 2002; Noel et al., 2017), we find customers with mental health conditions experience relatively poorer VR outcomes than other customers do. This finding aligns literature that suggests customers with mental health conditions have needs that are not adequately met by VR (Kress-Shull, 2000; Leech and Holcomb, 2000), even after accounting for customer characteristics and services received. For example, some may experience poorly managed physical health problems that present barriers to work (Gao et al., 2020) and some may experience barriers to employment stemming from lack of awareness and accommodation for psychiatric disabilities and inclusivity in the workplace (Dong et al., 2021). Though people with mental health conditions historically have low rates of employment, they are often motivated to work and can succeed when they receive helpful services (Drake et al., 2009). The VR program could consider adopting specific processes or even dedicated staff to serve applicants who experience work limitations due to mental illness.
Like Gonzalez et al. (2011), we find disparities in VR success rates for low socioeconomic status (SES) applicants (Gonzalez et al., 2011). We found private health insurance coverage was predictive of positive VR outcomes, whereas Medicaid coverage at application was predictive of poor VR outcomes. Medicaid coverage is available to low income adults and to many SSI recipients and is therefore an indicator that the applicant is poor and/or severely disabled. SSI receipt, another indicator of low SES and severe disability, is also a negative predictor of employment at VR program exit, and weakly positively associated with exiting without an IPE. Counselors should be vigilant for application information that suggests a customer might be from a low-income household including SSI payment receipt, Temporary Assistance for Needy Families receipt, and Medicaid coverage. These customers might need more support or longer VR service spells to overcome the effect of fewer resources and support at home than other applicants, and they are likely to face multiple challenges that affect their ability to find and maintain employment including food insecurity (Fleming et al., 2020). Prior work also suggests that they might especially benefit from work experiences and job supports (Trenz et al., 2020).
Along with confirming well-understood relationships between certain customer characteristics and VR outcomes, our ML approach revealed interactions between predictors and outcomes that suggest a more nuance than individual marginal effects convey. Some customer groups who are not employed at application and are not identified in prior studies are more likely than others to have poor program outcomes. Though developmental disability is predictive of employment at program exit holding all other characteristics constant, we find that applicants with that condition who are also low earners and under 18 are no more likely than the average applicant and less likely than older applicants with the same characteristics to exit VR employed. Older customers with developmental disabilities might simply be more ready to enter the workforce than school-aged customers. However, awareness of the age disparity among customers with developmental disabilities could allow counselors to provide more tailored training services to younger customers with developmental disabilities, for example recent work suggests that customers with intellectual disabilities benefit most from specific employment-related services including job counseling and occupational training (Young et al., 2021).
Customers with low earnings at application and who have neither a developmental nor a learning disability are a large group (54% of the analysis sample) and are also the most likely group to exit VR without a signed IPE. While the group without developmental or learning disabilities is not monolithic, the ML model results reveal that its members have very different VR outcome rates than their counterparts with those conditions. At the program level, administrators should consider what makes customers with developmental and learning disabilities more likely to receive VR services than others and how other groups of applicants might be better served. For example, agencies could consider broadening their offerings of purchased services to accommodate a wider range of needs.
Conclusion
It is beyond the scope of this study to determine why certain groups of applicants experience a disparity in VR success, however the findings of this study and its predecessors could inform future qualitative research on the VR program and its applicants. RSA or individual agencies could conduct surveys or focus groups of applicants, current customers, and individuals who recently exited VR to document gaps in services or the eligibility determination process. Input from counselors who work directly with applicants should also be collected—counselors have insight into both the needs of customers in at-risk groups as well as the availability of resources to serve those customers well.
Footnotes
Acknowledgments
None to report.
Conflict of interest
The authors declare that they have no conflict of interest.
Ethical declaration
Ethical approval was not sought for the present study because it used publicly available microdata.
Funding
Funding for this study was provided by the Research and Training Center on Disability Statistics and Demographics at the University of New Hampshire, which is funded by the National Institute for Disability, Independent Living, and Rehabilitation Research in the Administration for Community Living at the U.S. Department of Health and Human Services (DHHS) under cooperative agreement 9ORTGE0001. The contents do not necessarily represent the policy of DHHS, and the reader should not assume endorsement by the federal government (EDGAR, 75.620 (b)).
Informed consent
Informed consent was not sought for the present study because it used publicly available secondary data.
We exclude customers who exited the program because of ineligibility and any who receive services from agencies outside of the 50 United States and the District of Columbia.
“Rehabilitation technology means the systematic application of technologies, engineering methodologies, or scientific principles to meet the needs of, and address the barriers confronted by, individuals with disabilities in areas that include education, rehabilitation, employment, transportation, independent living, recreation, home and vehicular modification, other assistive devices including, but not limited to hearing aids, low vision aids and wheelchairs.” (![]() )
)
“Disability-related augmentative skills training includes but is not limited to orientation and mobility; rehabilitation teaching; training in the use of low vision aids; Braille; speech reading; sign language; and cognitive training/retraining.” (![]() ) job readiness training, and other miscellaneous training.
) job readiness training, and other miscellaneous training.
Cross-validation is a procedure used to test the RF model and detect issues including overfitting and bias. It involves repeatedly splitting the sample into two groups and running the RF analysis on one of the two groups. The results of the model are checked against the second sample, or “validated.”