
Abstract
Nowadays, there is a large volume of time series data, which generates by different parts of the healthcare domain such as hospitals, medical organizations, and health centers. Time series event-based prediction (TsEP) has recently become an active research trend in the healthcare domain, which is widely served outcome of it by the healthcare decision-makers. Actually, a valid and reliable prediction can play an important and key role in the society for forewarning crisis and supporting health management. Hence, the main motivation of this paper is to offer an enhanced hybrid model to the TsEP in healthcare, which is named TsEP-TC. TsEP-TC contains three components (TC) that combines relevant concepts to weighting, fuzzy logic, and metaheuristics in the TsEP problem. Experimental results indicate that TsEP-TC can provide the superior performance in comparison to the previous prediction models in the healthcare and biomedical domains. Additionally, TsEP-TC model can be introduced as a useful way for handling the complex and uncertain behaviors of time series and fuzzy events predicting in healthcare.
Introduction
In the real-world, data mining techniques are widely used to uncover new biomedical and healthcare knowledge for clinical and administrative decision making as well as generate scientific hypotheses from large experimental data, clinical databases, and/or biomedical literature [1]. Also, there is a vast potential for data mining applications in healthcare such as the evaluation of treatment effectiveness, healthcare management, customer relationship management, and detection of fraud and abuse [2].
The time series event-based prediction (TsEP) can pose as a significant category of data mining applications in the healthcare that uses an important class of temporal data objects, namely time series data. In the last decade, the TsEP problem has become an active research trend, which has attracted particular attention of health managers, healthcare decision-makers and has initiated various researches in this field.
A time series is a collection of observations made chronologically. It is defined as “a collection of random variables indexed according to the order that they are obtained in time” [3].
An event in a time series is defined as the occurrence of variation in data-points over a time span that is of particular interest to a user and follows particular temporal patterns. In the other definition, an event is considered as an important occurrence that its importance is dependent on event application in the applied areas [4].
For example, sudden change of migrations number, mortalities, and births can lead to occurring fall population event or increase population event in a univariate time series. For other instances, in a healthcare time series, an event may be signified by occurring concurrent variations in a multivariate time series (e.g., heart and kidney diseases).
The ultimate goal of TsEP is to predict target event and user-interest in a time series; the user specifies the target event that needs to be predicted (e.g., incidence, diabetes). In fact, the TsEP can discuss as the special kind of predictive data mining, which typically employ data mining techniques and soft computing methodology to detect specific temporal patterns and to predict future target events in unseen time series data [5]. The outcome of the TsEP operation can serve by healthcare decision-makers for supporting health management and addressing the possible critical situations in the society.
The general approach to solve a prediction problem is based on the solution of a suitable function approximation problem [6, 7, 8]. In fact, a prediction problem can be solved by synthesizing the function that links the current sample to be predicted to a suitable set of past ones [9]. So far, different models have been presented in the field of analysis and forecast time series [10]. In this context, linear-nonlinear hybrid models [11], quantile regression models [12], sentinel surveillance network [13], and seasonal autoregressive integrated moving average (SARIMA) models [14, 15] are some interesting researches in recent years. Lately, the topic of TsEP is widely used for supporting decision making, managing the possible critical situations, forewarning crisis, and so on by managers in different domains [16, 17, 18, 19]. In fact, reliable events prediction can introduce as the key step to providing rapid control actions, managing the health, reducing the treatment costs, addressing wait time of the patient, assigning hospital resources and advices to the patients, and etc.
On the one hand, the volume of performed research is few regarding the TsEP problem in the healthcare and biomedical fields; the most of the current prediction models are incapable in the correct analysis of the time series behaviors and exact forecast of events due to the data nature (e.g., large in data size, high dimensionality, lack of access to data source, nonlinear relationships in the series) in the healthcare systems. On the other hand, in the real-world, the need for prediction (forecasting) has increased in line with management effort to reduce the dependence on situations, which are uncertain and critical [20].
Therefore, the main goal of this paper is to propose an enhanced hybrid model to the TsEP problem, which named TsEP-TC. The proposed hybrid model contains three fundamental components weighting, fuzzy logic, and metaheuristics. Two major tasks are performed in order to predict events in this model that indicate the used general methodology is based on time series analysis and detect different patterns in order to label different events. In fact, time series analysis are used to forecast the values of the future observations or to discover nonlinear relationships among data-points to detect an event of interest. TsEP-TC can be capable for overcoming to some of drawbacks in the conventional prediction models and enhancing the performance of the prediction model in a healthcare system. Furthermore, the TsEP-TC can introduce as a helpful tool for fuzzy events predicting in healthcare.
The rest of the paper is organized as follows: Section 2 gives a glancing look at the proposed hybrid model then explains the used methodology with detail for TsEP-TC. In Section 3, an empirical analysis is provided for the proposed hybrid model. The performance of TsEP-TC model is compared with those of other prediction models in the Section 4. The complexity analysis of the proposed hybrid is provided in the Section 5. Section 6 concludes the current research with some conclusions and future possible directions.
TsEP-TC: The proposed hybrid model
An enhanced hybrid model is proposed to the TsEP problem in healthcare and biomedical fields, which contains three components (TC): weighting, fuzzy logic, and metaheuristics; it is named the TsEP-TC. This section is structured into two main parts, which the first part introduces components of the proposed hybrid model at a glance. Then, the second part explains the used methodology in the TsEP-TC model in detail.
A glancing look at TsEP-TC model
The proposed hybrid model contains weighting, fuzzy logic, and metaheuristics components.
Weighting
In previously published resources, weighting process has been performed on multivariate time series, as a technique of feature selection for demonstrating the key role of some of the features in representation more accurate results when clustering task [21, 22]. In this research, other applications are introduced to the weighting concept as the first component of the TsEP-TC model. Two applications are considered to the weighting component in the TsEP-TC model; the first, assigning weight to series-points based on temporal separation of points; the second, assigning weight to series-points based on spatial separation of points.
As literature reveals [3], a time series is a collection of observations made chronologically. Hence, there are temporal ordering in data-point of a time series data set, which indicate the different value of each data-point in making predictive models. This difference value is considered by assigning different weights to data-point based on temporal separation of points in the TsEP-TC model. For example, for predicting the monthly number of influenza cases, data-point relevant to the two months of the recent year have the major role in the construction of prediction model and offering the better prediction results in comparison with data-point relevant to the other months. From the other point of view, the data’s value for other months cannot be ignored when making prediction models because ignoring of the data’s value for other months leads to performance reduction of prediction model. Therefore, this problem is resolved by the first application of weighting in this study.
So far, various standard functions have been presented for measuring the similarity between two data being compared like Euclidean distance (ED), manhattan distance, Minkowski distance, Mean dissimilarity, Root mean square dissimilarity, Peak dissimilarity, Dynamic time-warping distance (DTW) [22]. In this section, a new similarity measure is proposed by using the second application of weighting, which is based on spatial separation of points. On this basis, weighting component assigns higher value to the series-points in situations that event is occured within those points. In fact, different weights is assigned to the data-point regards to event occurrence or lacking event occurrence on those. For this purpose, if the obtained change rate for
Fuzzy logic
There are challenges such as lack of access to patient’s data or difficulty access to patient’s data; incomplete data; chaotic, complex, and uncertain behaviors of time series data and missing values that complicate TsEP problem in the healthcare domain. Hence, fuzzy logic is considered as the second component of TsEP-TC model because the use advantage of the fuzzy logic is in processing imprecision, uncertainty, vagueness, semi-truth, or approximated and nonlinear data in order to address those challenges. In fact, the ability of fuzzy logic can be employed for handling imprecise and inconsistent data in the real-world problems; it is suitable for a wide variety of applications [23]. Nowadays, there are the new theories of soft computing such as fuzzy logic, neural networks and some of other methods, which can be used for the support of prediction problems. Fuzzy logic is an approximate reasoning and decision making under uncertainty situations that it can be used as a solution for modeling uncertain and chaotic behaviors in a time series data. The second component of TsEP-TC model is applied for three different applications: (1) fuzzy clustering: this case uses an enhanced algorithm of clustering for fuzzy predicting events in a healthcare system; it classifies data-points into several clusters due to extracted temporal feature(s) that can be characteristic of event occurrence. Each cluster indicates interested events, and each data-point is the member of several clusters with different membership degrees. (2) nonlinear modeling: an enhanced network of neuro-fuzzy is performed to compute the nonlinear patterns. (3) optimization process: this case employs a fuzzy control for dynamic adjustment of speed threshold in the proposed model and presents more accurate prediction results.
Metaheuristics
There are significant factors like proper approximating parameters in the linear and nonlinear models, efficient estimating the order of the statistical predictors (e.g. models of linear regression, autoregressive integrated moving average (ARIMA), SARIMA, and etc.), correct adjusting membership function’s parameters in the soft computing-based techniques that used in the current study such as an enhanced neural network, the optimum weighting, and determining membership degrees for fuzzy predicting event in the TsEP-TC model. The mentioned factors have the key and an important role for enhancing the performance of the predictive model in the current research, thus the third component, metaheuristics are performed for reaching those factors and obtaining to the better prediction results. Metaheuristics can be used to enhance the performance of a data mining algorithms by employing the optimization process, are able to provide better results and become a promising research trend in healthcare in recent years [21]. Optimization is a process to find an optimum solution or close to the optimal solution with regard to specified objective or objectives. Since every metaheuristic algorithm has its distinguishing features, there is no metaheuristic algorithm that can fully replace the other [24]. Furthermore, select a suitable algorithm and special-purpose is difficult due to the diversity and multiplicity of metaheuristic algorithms. Hence, in the current research, optimization algorithm of fuzzy adaptive turbulence particle swarm (FATPSO) [25] is performed for reaching to the important factors and improving the performance of the proposed prediction model. The main motivation for using the FATPSO algorithm is high-speed convergence, memory usage for the maintenance of good solution’s knowledge by all particles, and necessity using fuzzy control for dynamic adjustment of threshold speed. FATPSO is a version modified of particle swarm optimization (PSO) and a fuzzy logic-based system to tune adaptively the velocity threshold that can prevent premature convergence very effectively. PSO algorithm is mainly inspired by social behavior patterns of organisms that live and interact within large groups. Also, general optimization objective is considered minimizing the error of event prediction in order to enhance the performance of the prediction model.
The used methodology in TsEP-TC.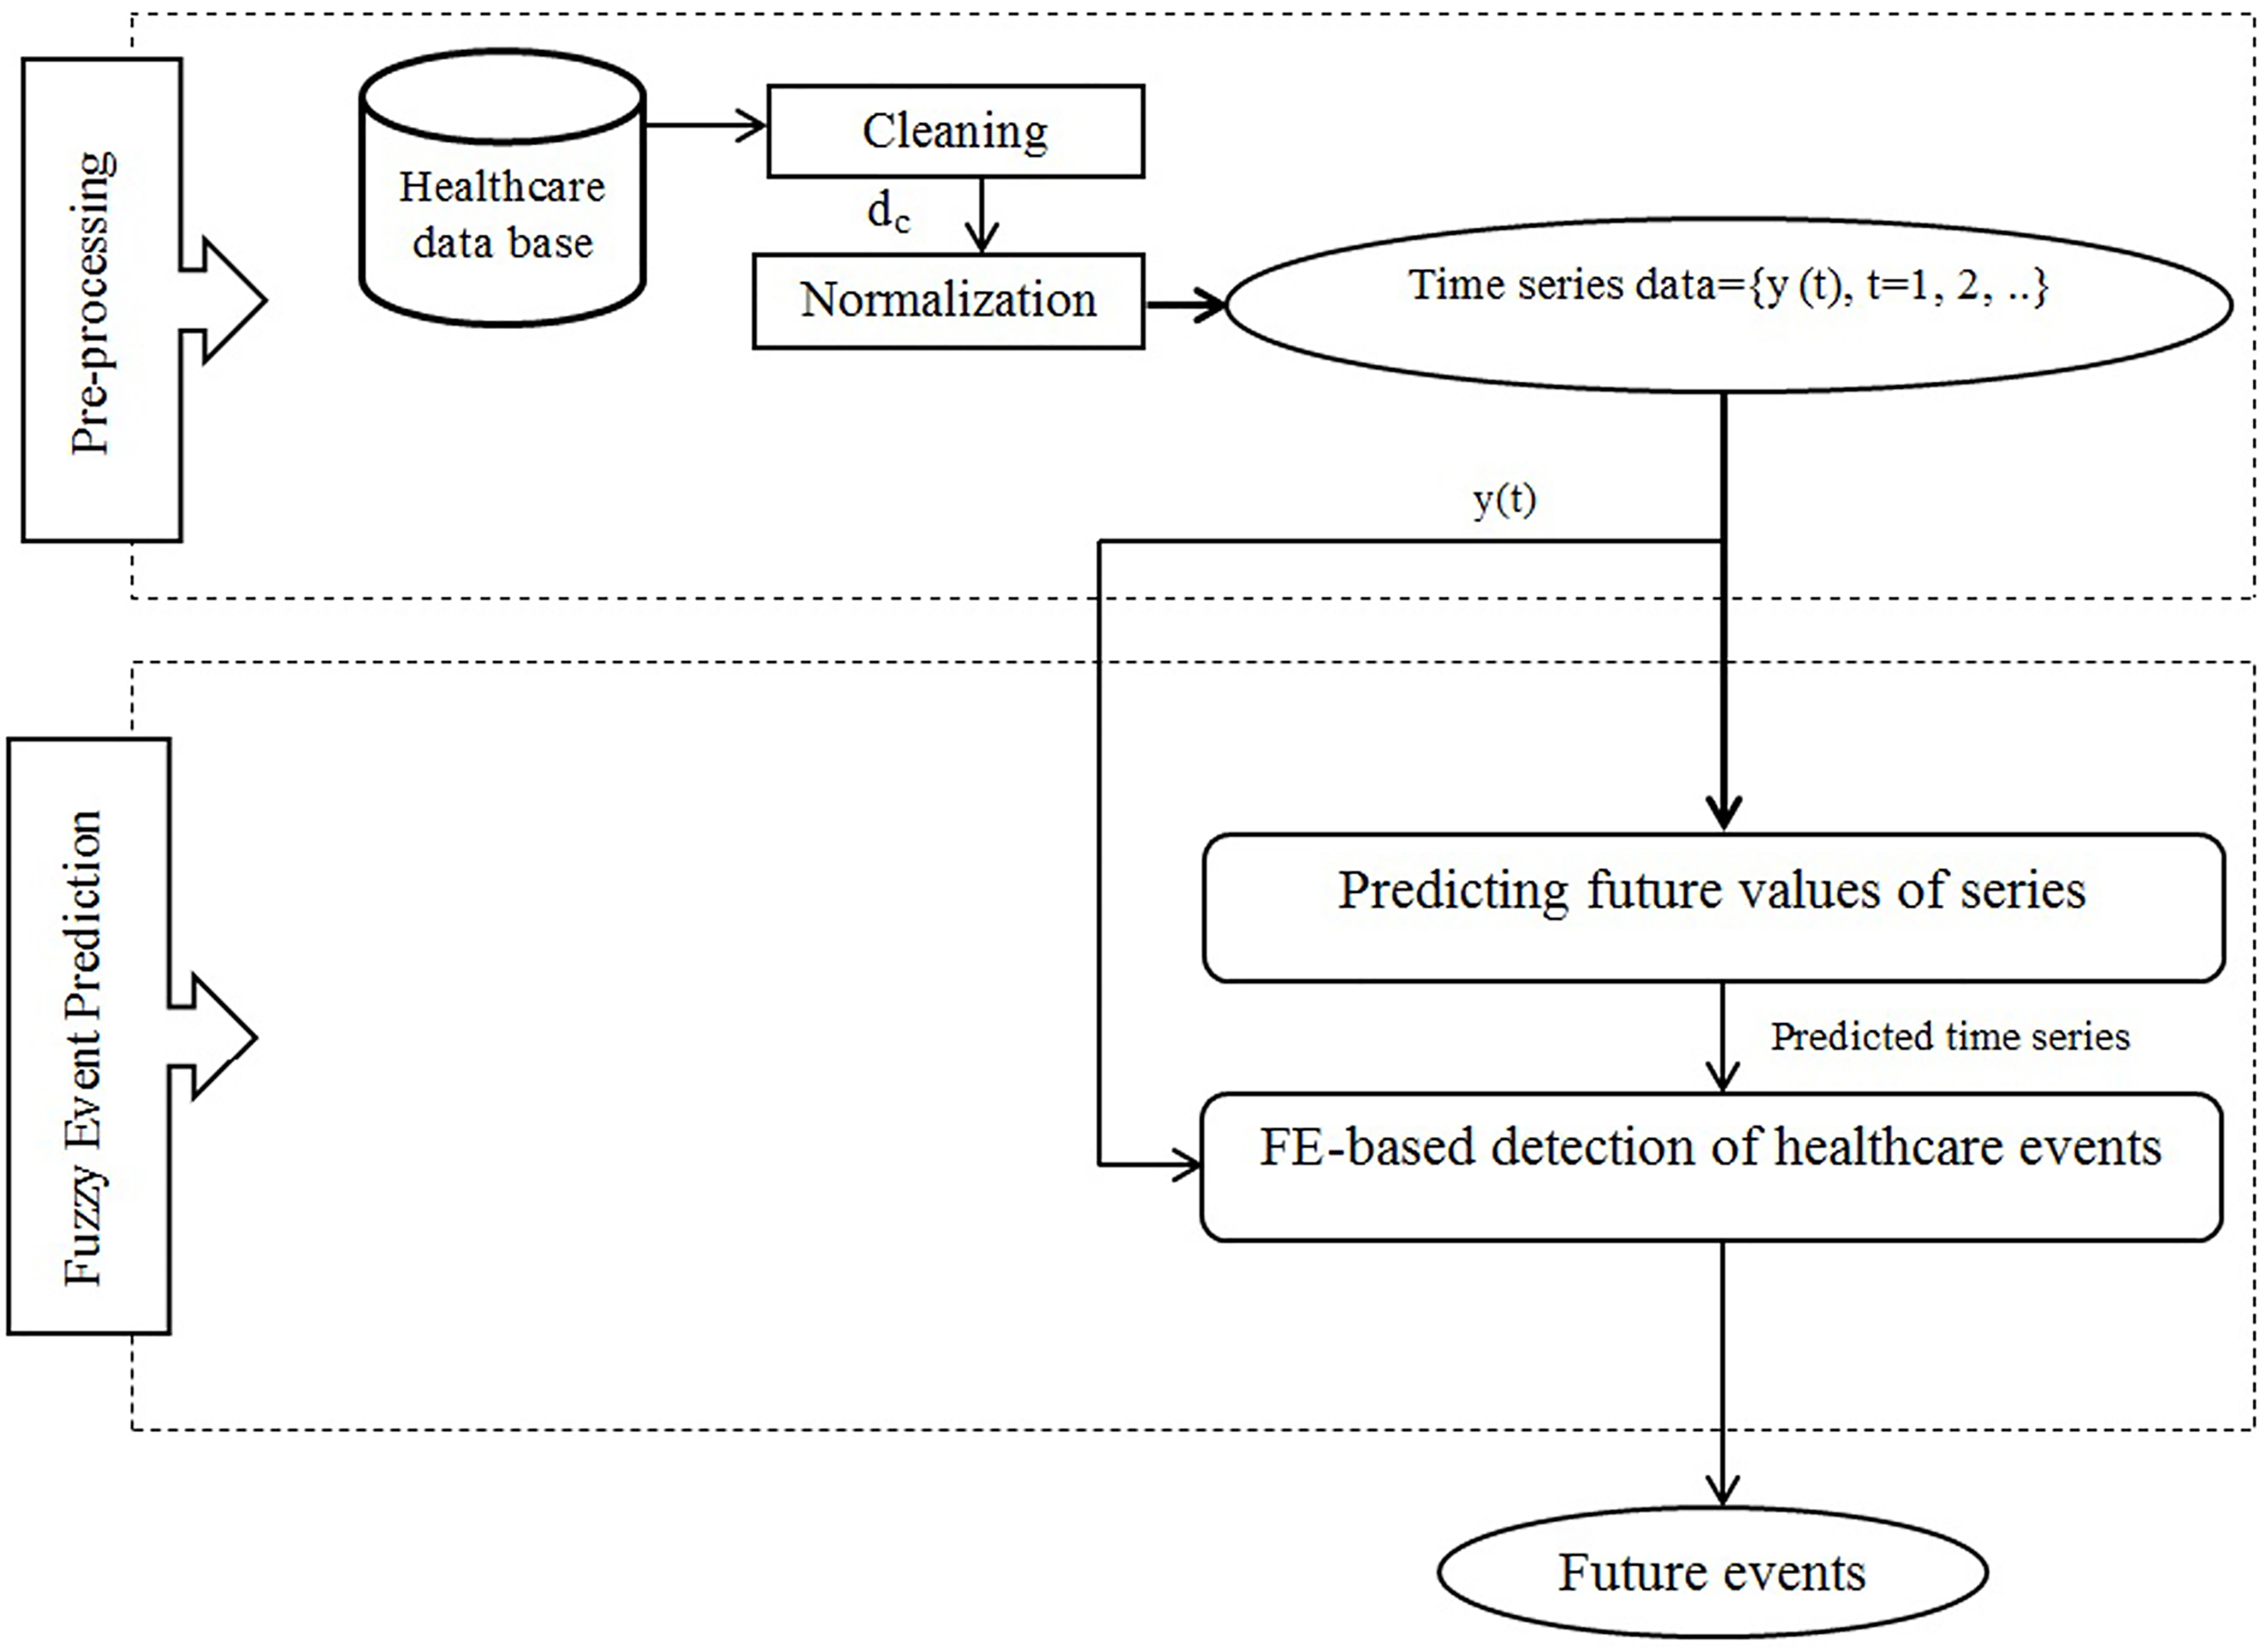
The used methodology in TsEP-TC consists of two main stages as shown in Fig. 1; the stages are explained in detail as follows.
Pre-processing
The first stage of the TsEP-TC is pre-processing, which is performed in two steps; the first step investigates used data sets in the current study to find missing and outlier values; the second step normalizes data range. Data sets are retrieved from the time series library in the healthcare field. The first step of the pre-processing stage, cleaning has replaced missing values with the average value of the variable concerned then has found outlier values by the standardized score
In this step, outlier data will be removed. Where
This stage comprises two major steps: predicting future values of data-points and FE-based detection of healthcare events. Below, the steps of the second stage are expressed in detail.
2.2.2.1. Predicting future values of series
This step is illustrated in the flowchart shown in Fig. 2, which explained as below:
i) Estimating linear pattern using wpo-based ARIMA: In this section, a model of wpo-based ARIMA (wpo: weigh and parameter optimization) is presented for estimating the linear pattern of data. ARIMA model has dominated on different practical areas in prediction problems for more than half a century [26, 27]. An ARIMA (
Predicting future values of data-points.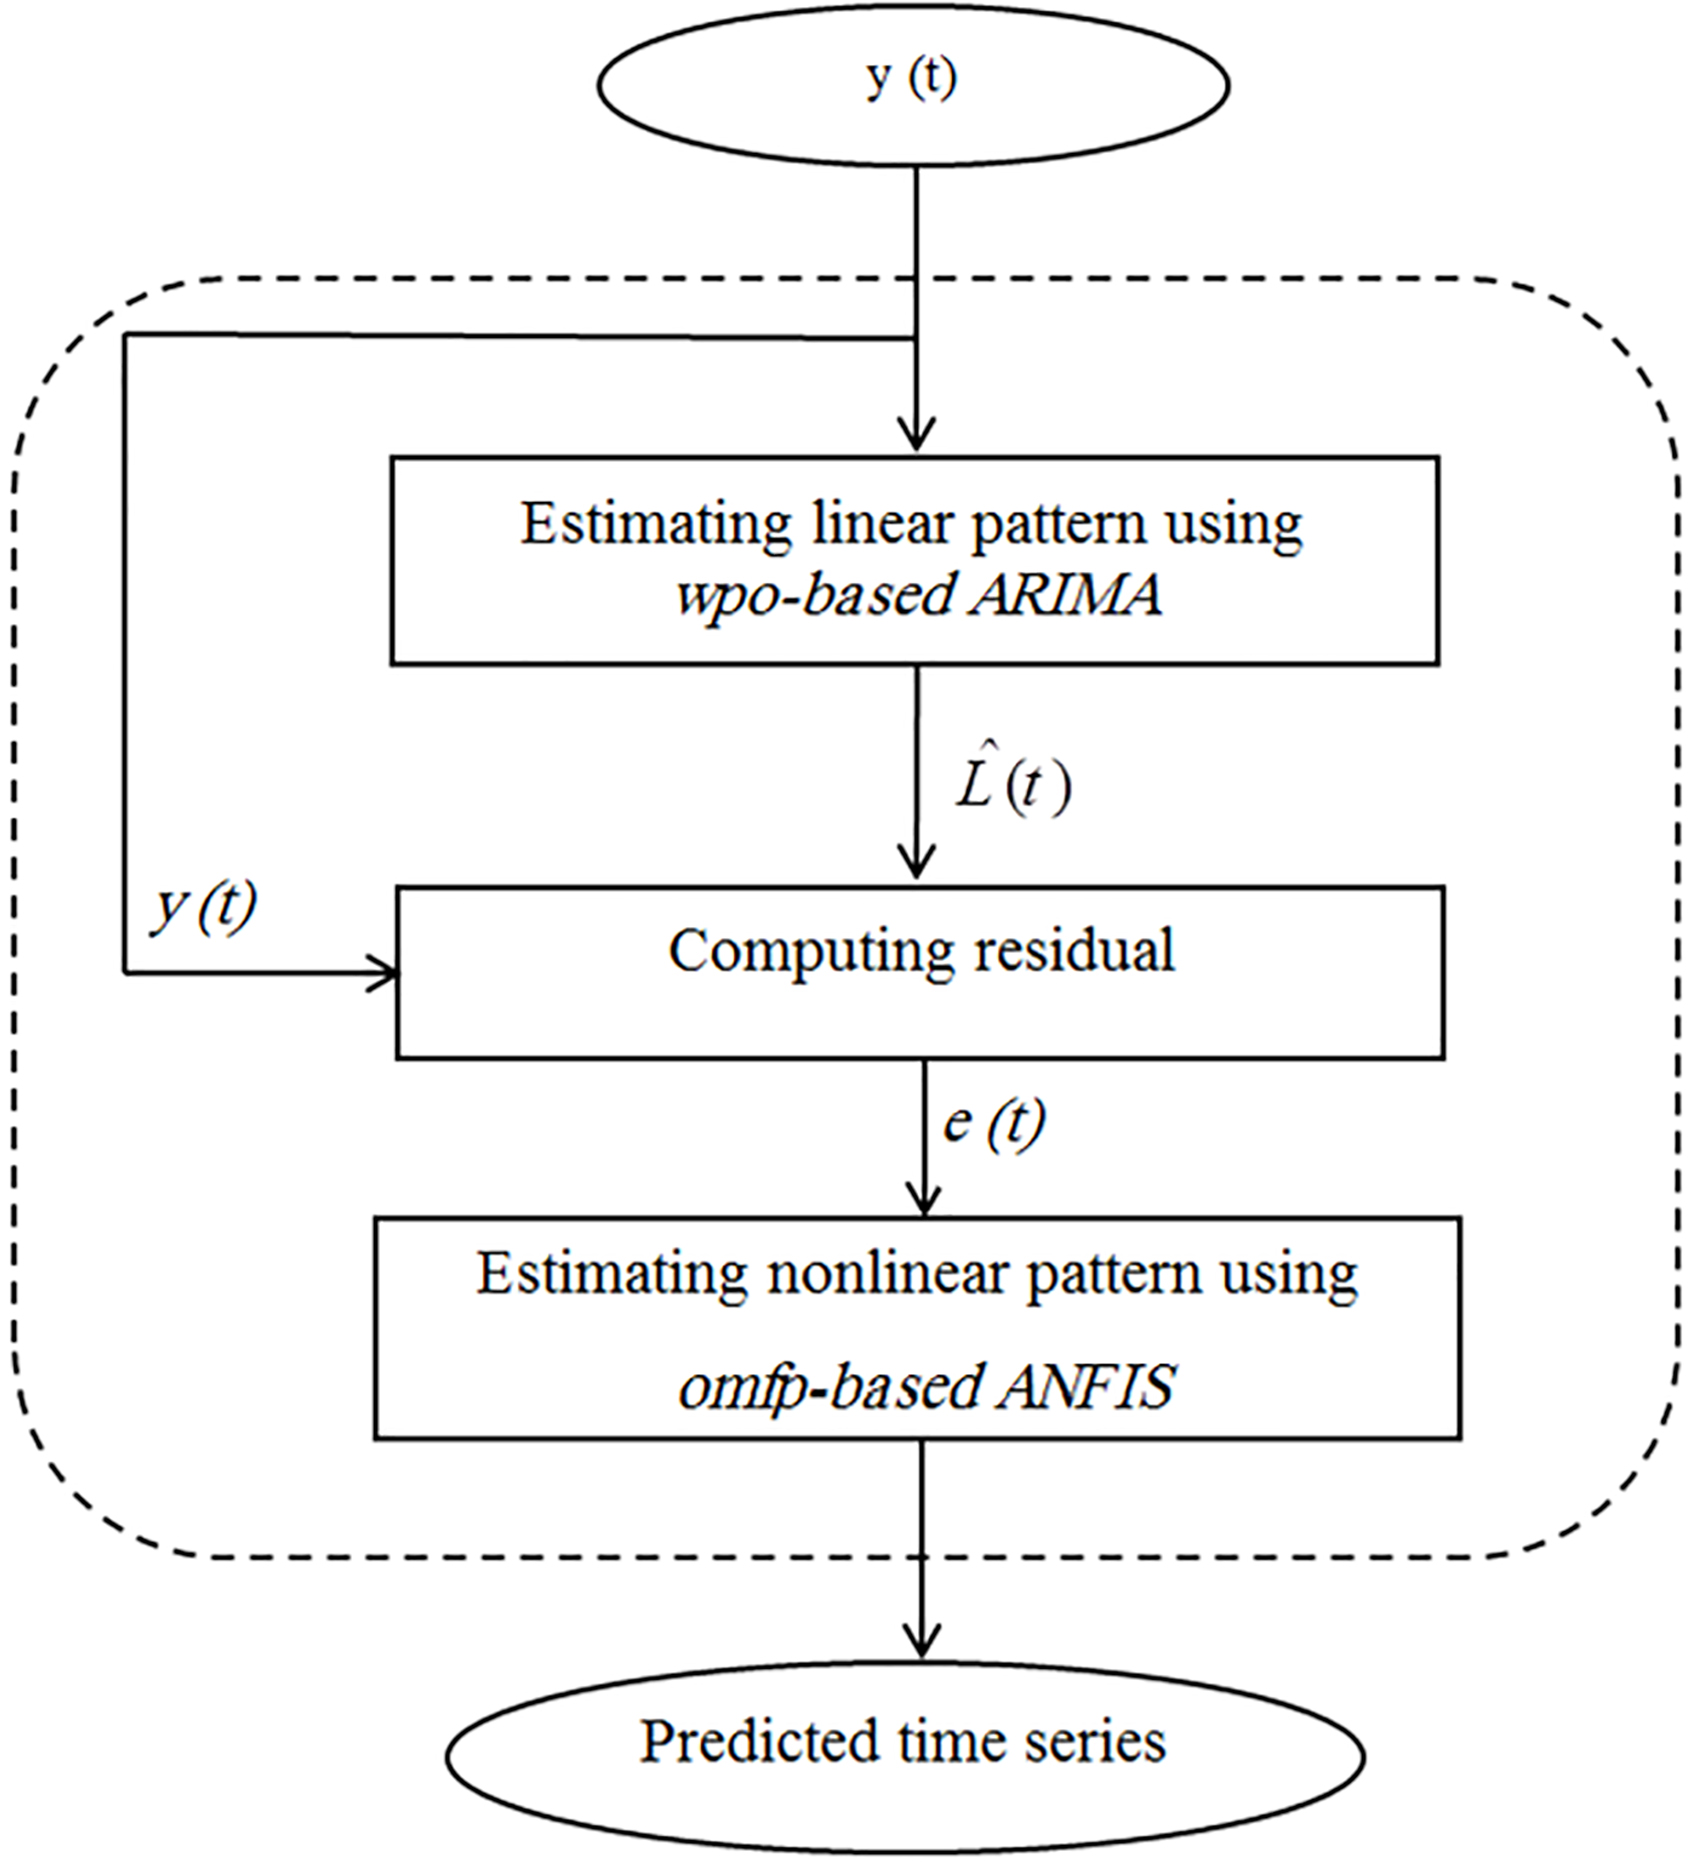
The flowchart of wpo-based ARIMA model in TsEP-TC.
Where
As is seen in Fig. 3, at first, the order of the basis predictor model, ARIMA model is initialized by autocorrelation and partial autocorrelation graphs of data. For this purpose, the confidence level of autocorrelation coefficients (95%) is computed for autocorrelation and partial autocorrelation functions (ACF and PACF, respectively) as follows:
The proposed algorithm for optimizing weight assignment.
Where
As is shown in Fig. 4, optimum weights are assigned to the data-points of series using FATPSO according to MSE criteria for each particle of swarm then the output of the algorithm passed to the next step.
The proposed algorithm for optimizing parameters of the weighted ARIMA.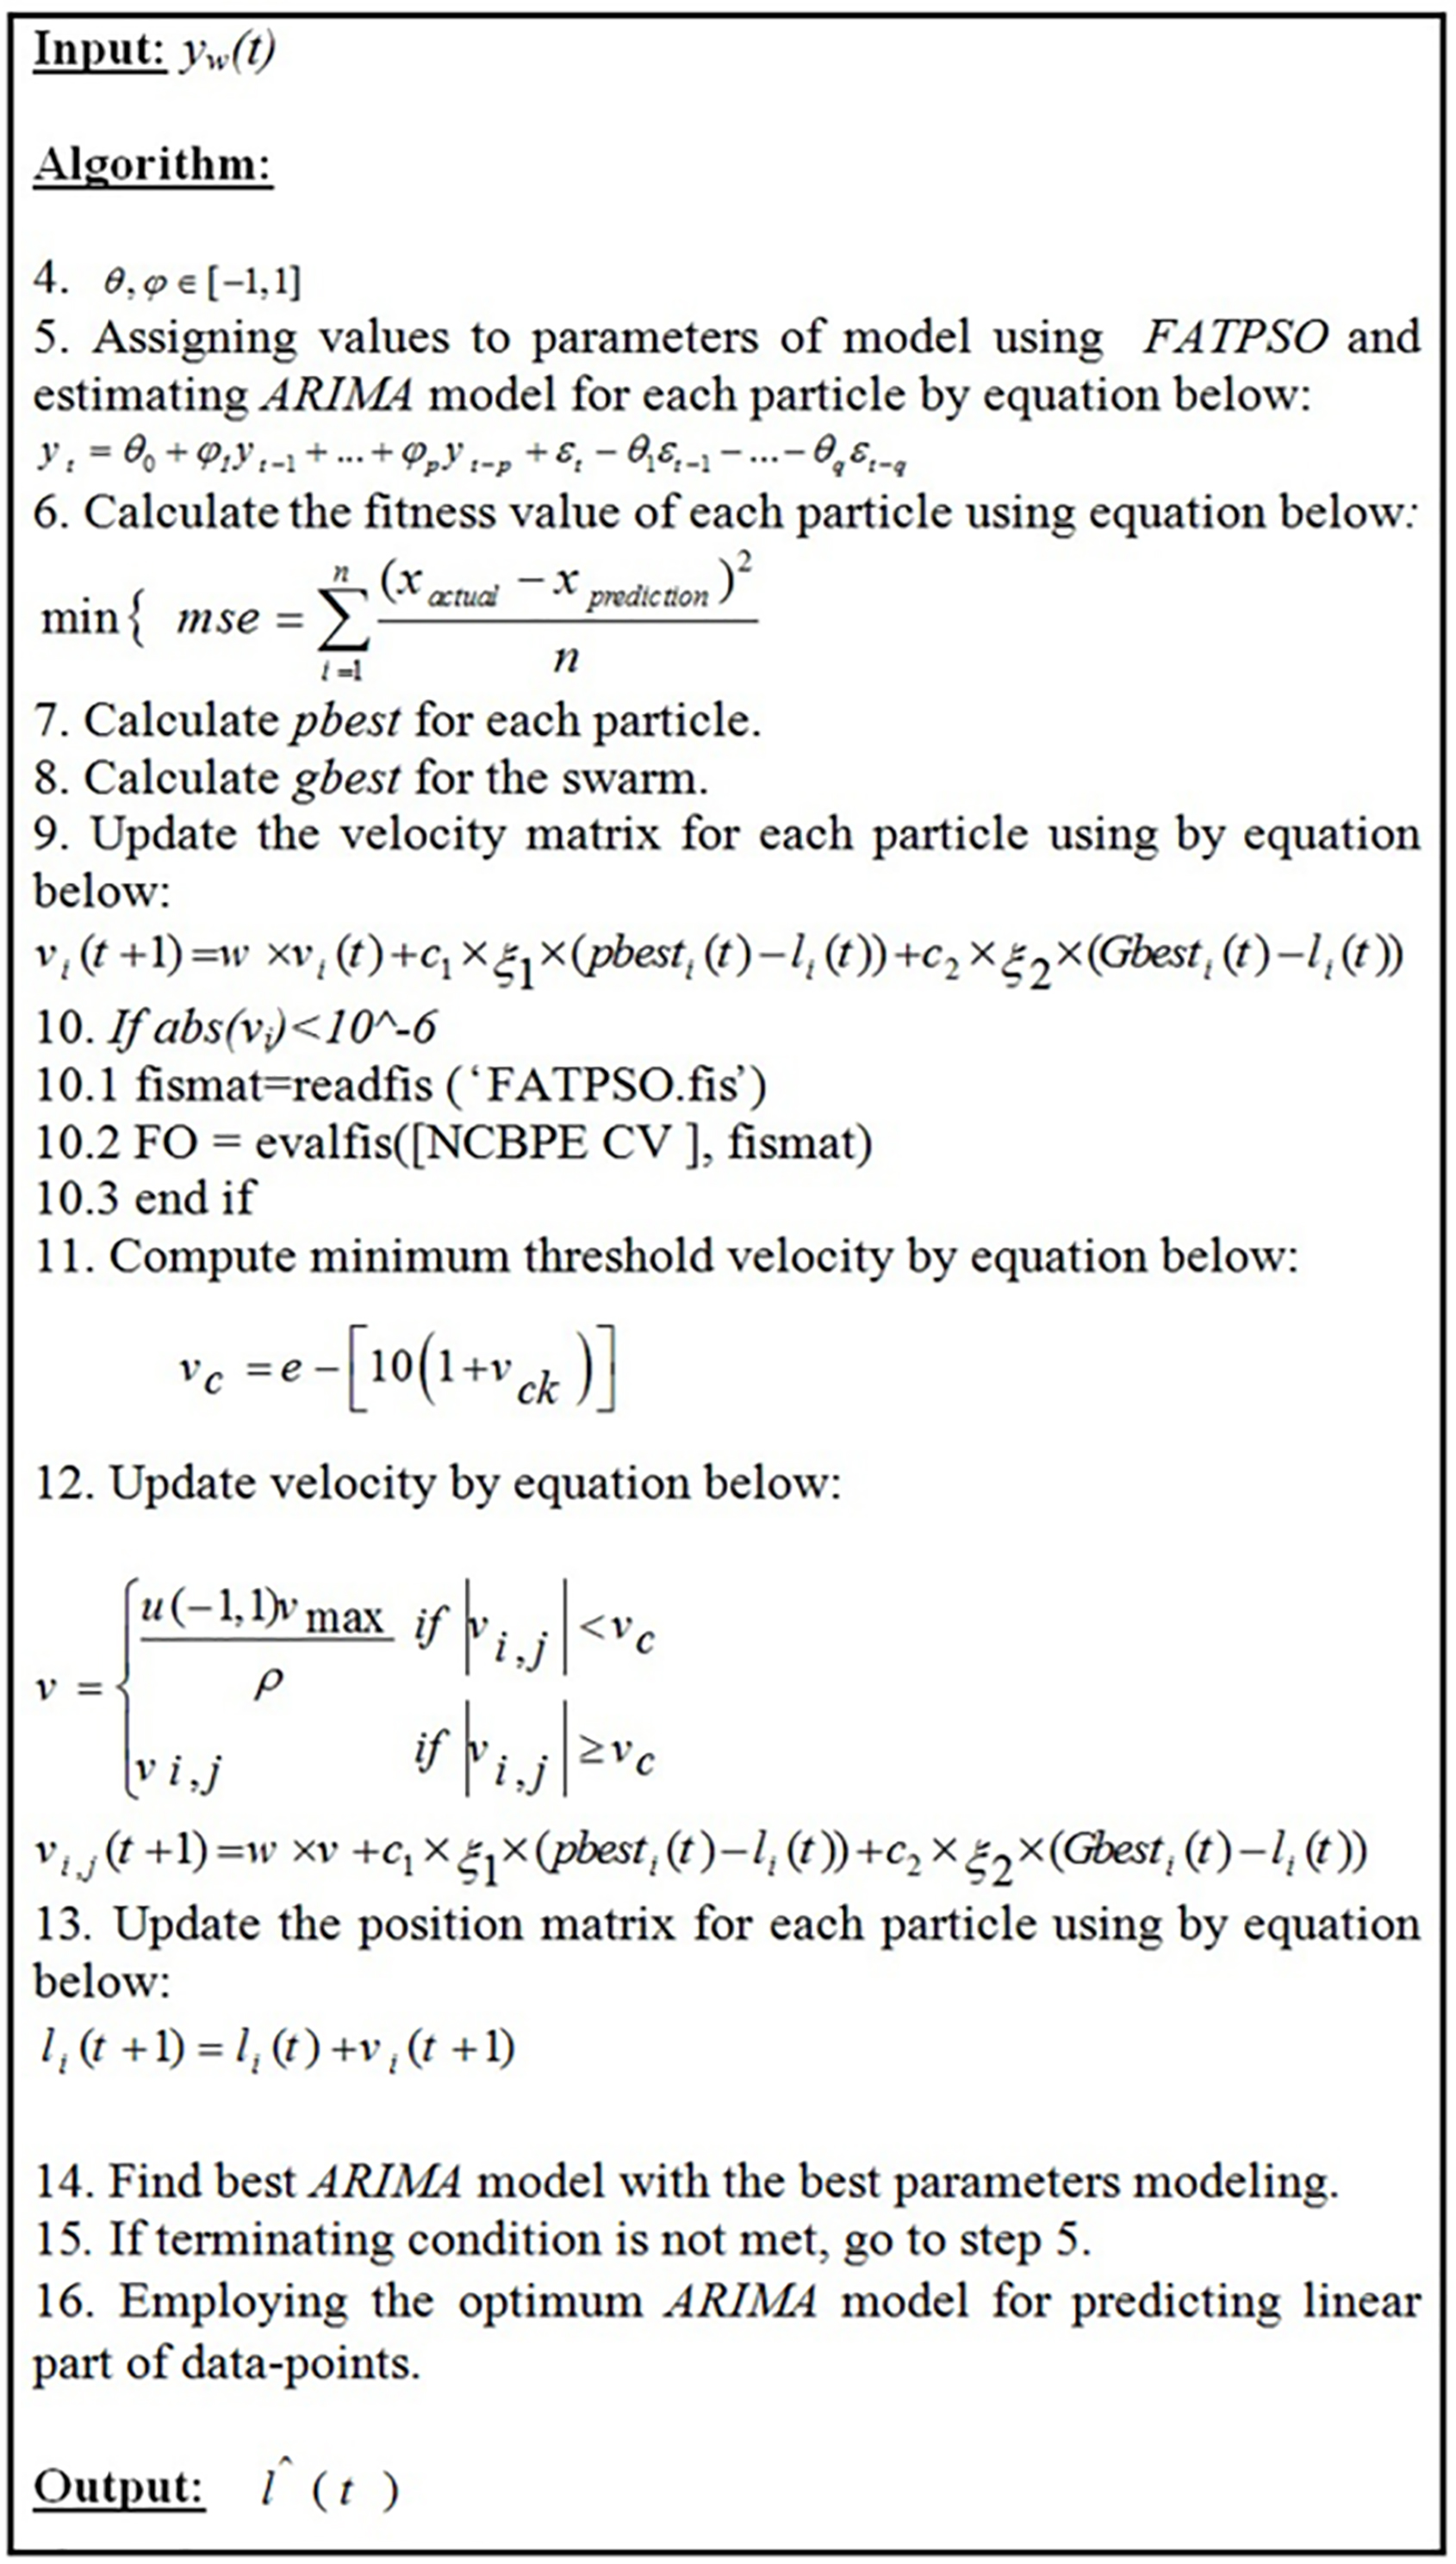
In the next step, wpo-based ARIMA model is performed to optimize parameters of the weighted ARIMA model, which is illustrated in Fig. 5. In this algorithm, lines 1, 2, and 3 are similar to the proposed algorithm for optimizing weight assignment (see lines 1 to 3 in the Fig. 4). As Fig. 5 indicates, the proposed algorithm finds the best ARIMA model using FATPSO according to MSE criteria; the identified model includes the best parameters of linear modeling (
ii) Computing residual: In this part, the model error of wpo-based ARIMA (residual) is attained by subtracting the actual quantity of forecasted quantity as follows:
Where
iii) Estimating nonlinear pattern using omfp-based ANFIS: There are nonlinear patterns in residuals of wpo-based ARIMA model that shows necessity using nonlinear models for obtaining more accurate results in the prediction process. Hence, a model of omfp-based ANFIS (omfp: optimization of the membership functions’ parameters) is offered for estimating the nonlinear pattern of data in this section, which its flowchart is depicted in the Fig. 6. ANFIS is abbreviation of Adaptive Neuro Fuzzy Inference System.
It can be said that the main motivation using omfp-based ANFIS for estimating nonlinear patterns is based on the fact that the model has considerable success in handling the nonlinear relationships among the data in the different practical fields. Furthermore, given that ANFIS training only by using traditional algorithms such as back propagation may lead to sticking in local minima, the omfp-based ANFIS can take advantage of the third component, metaheuristics for enhancing efficiency.
The equations of the ANFIS structure with two inputs and two linguistic labels for each input are as follows:
Where
Estimating nonlinear pattern using omfp-based ANFIS.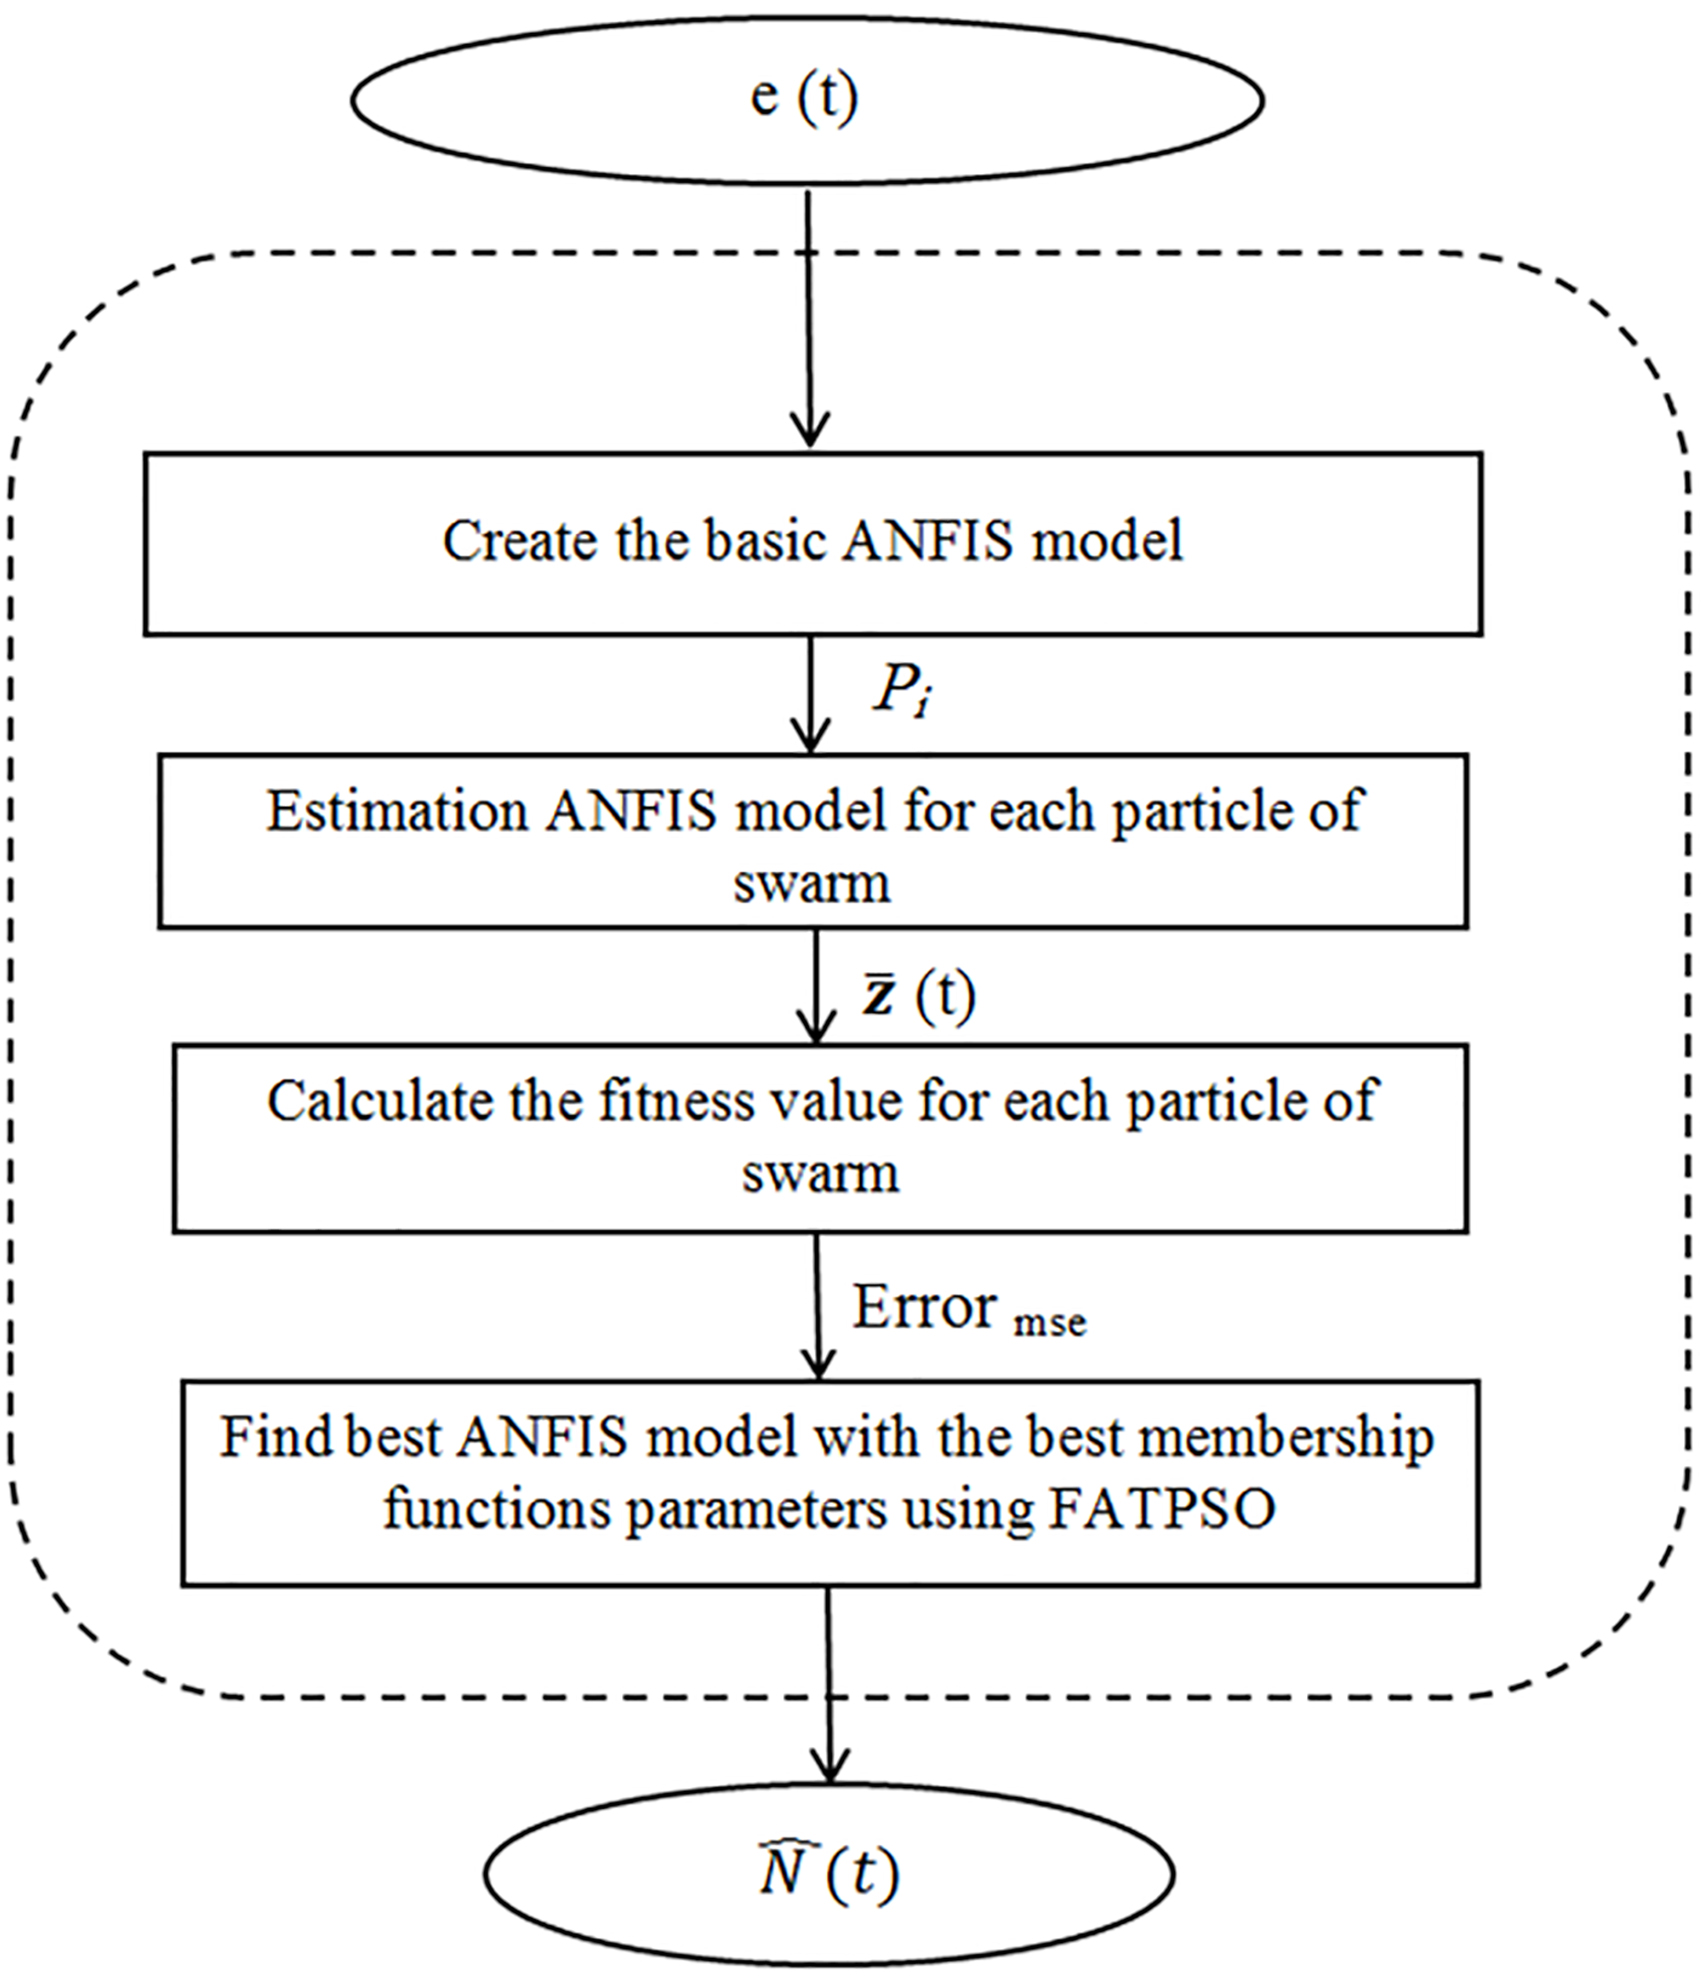
2.2.2.2. FE-based detection of healthcare events
The proposed algorithm to the FE-based detection of healthcare events (FE: feature (s) extracted) is depicted in Fig. 7.
FE-based detection of the healthcare events.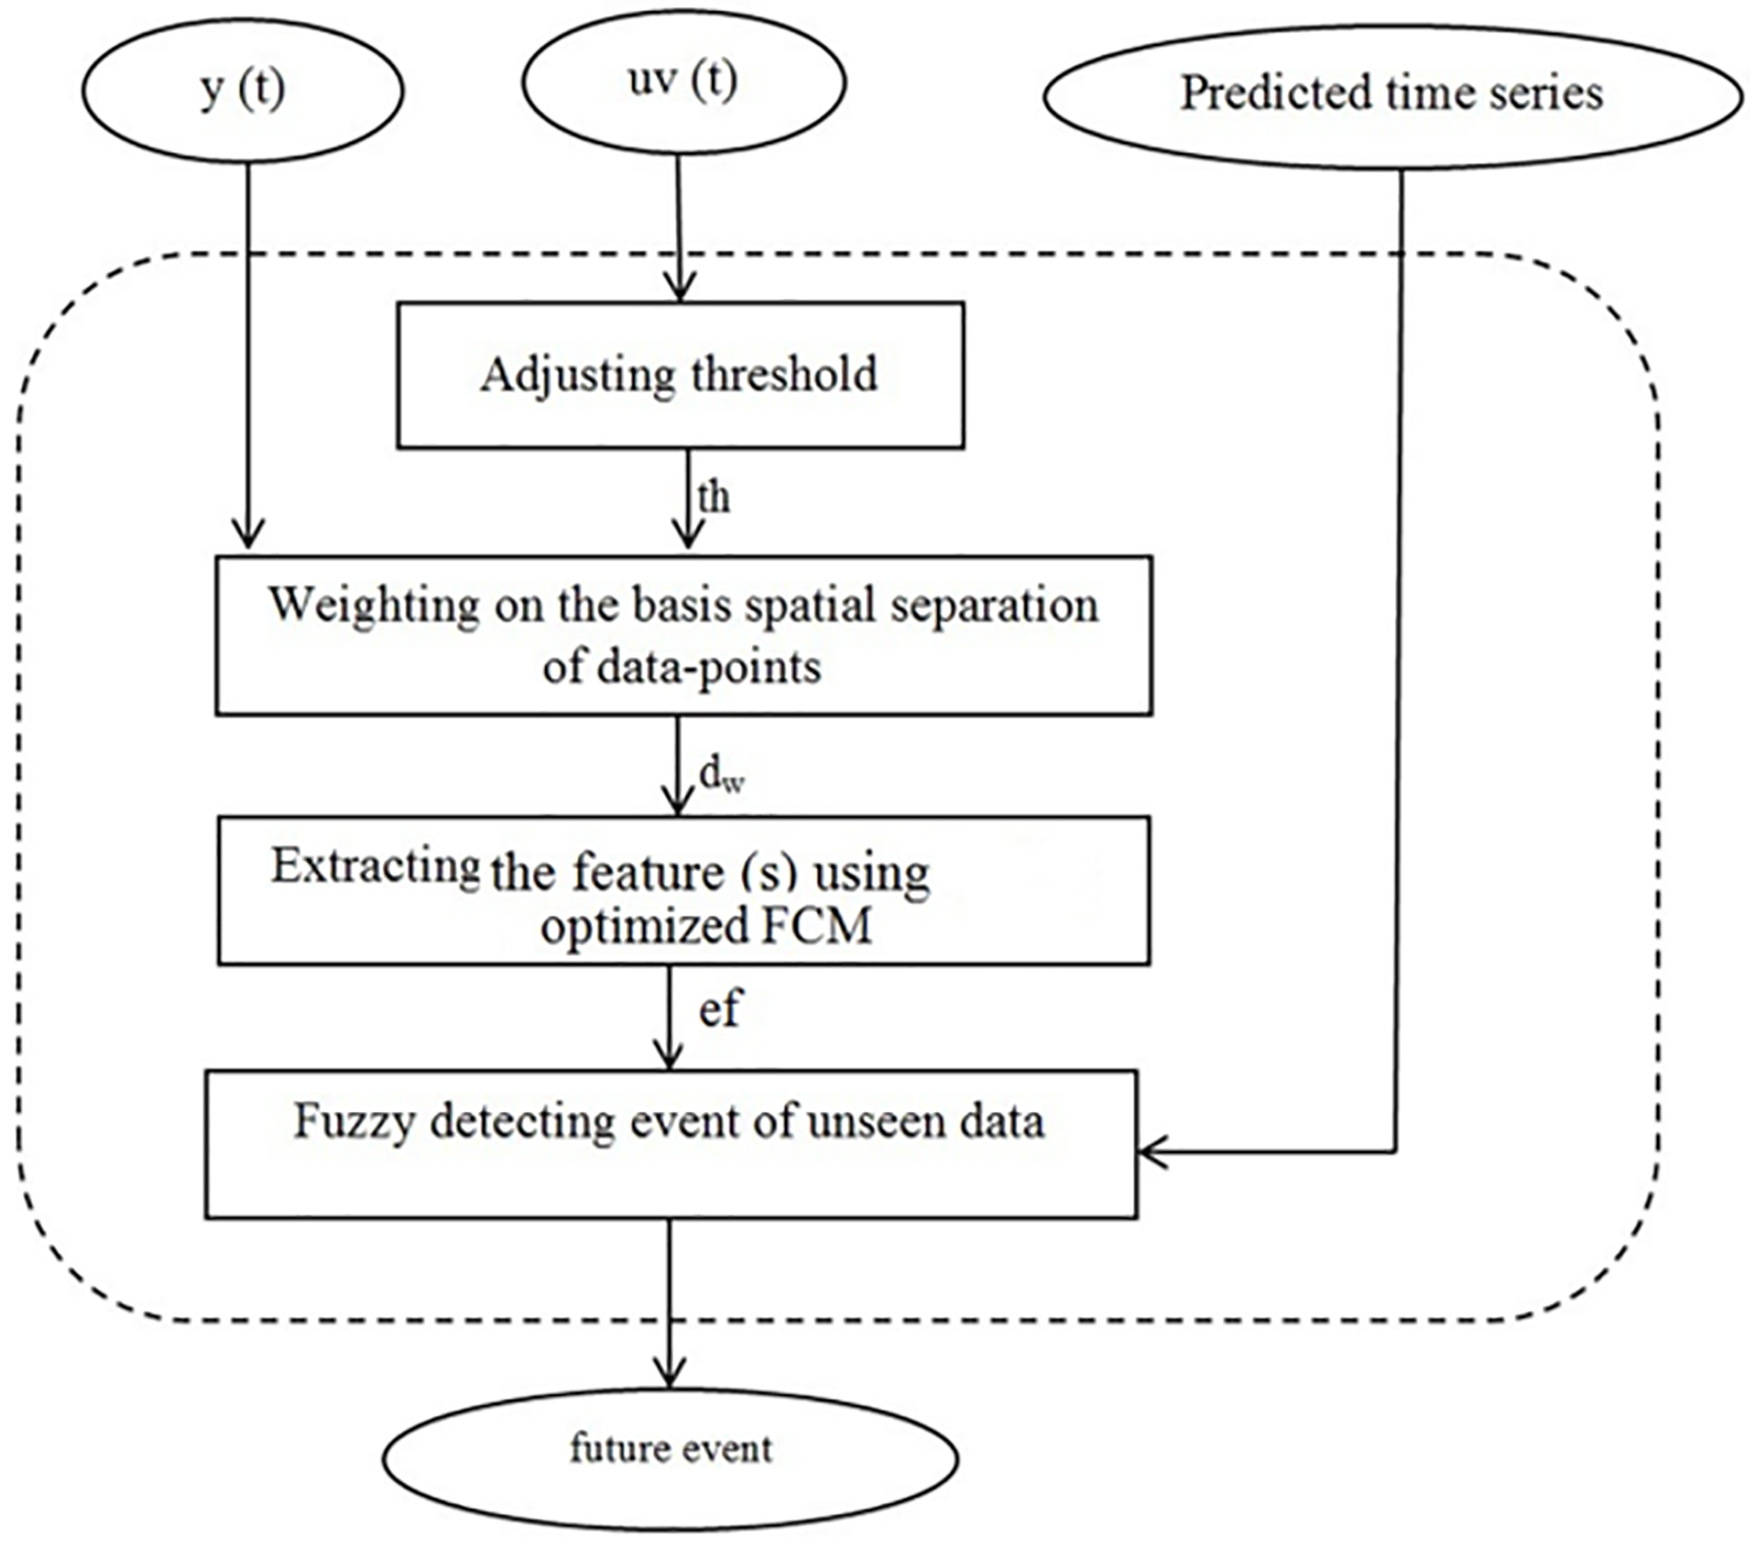
Weighting on the basis spatial separation of data-points.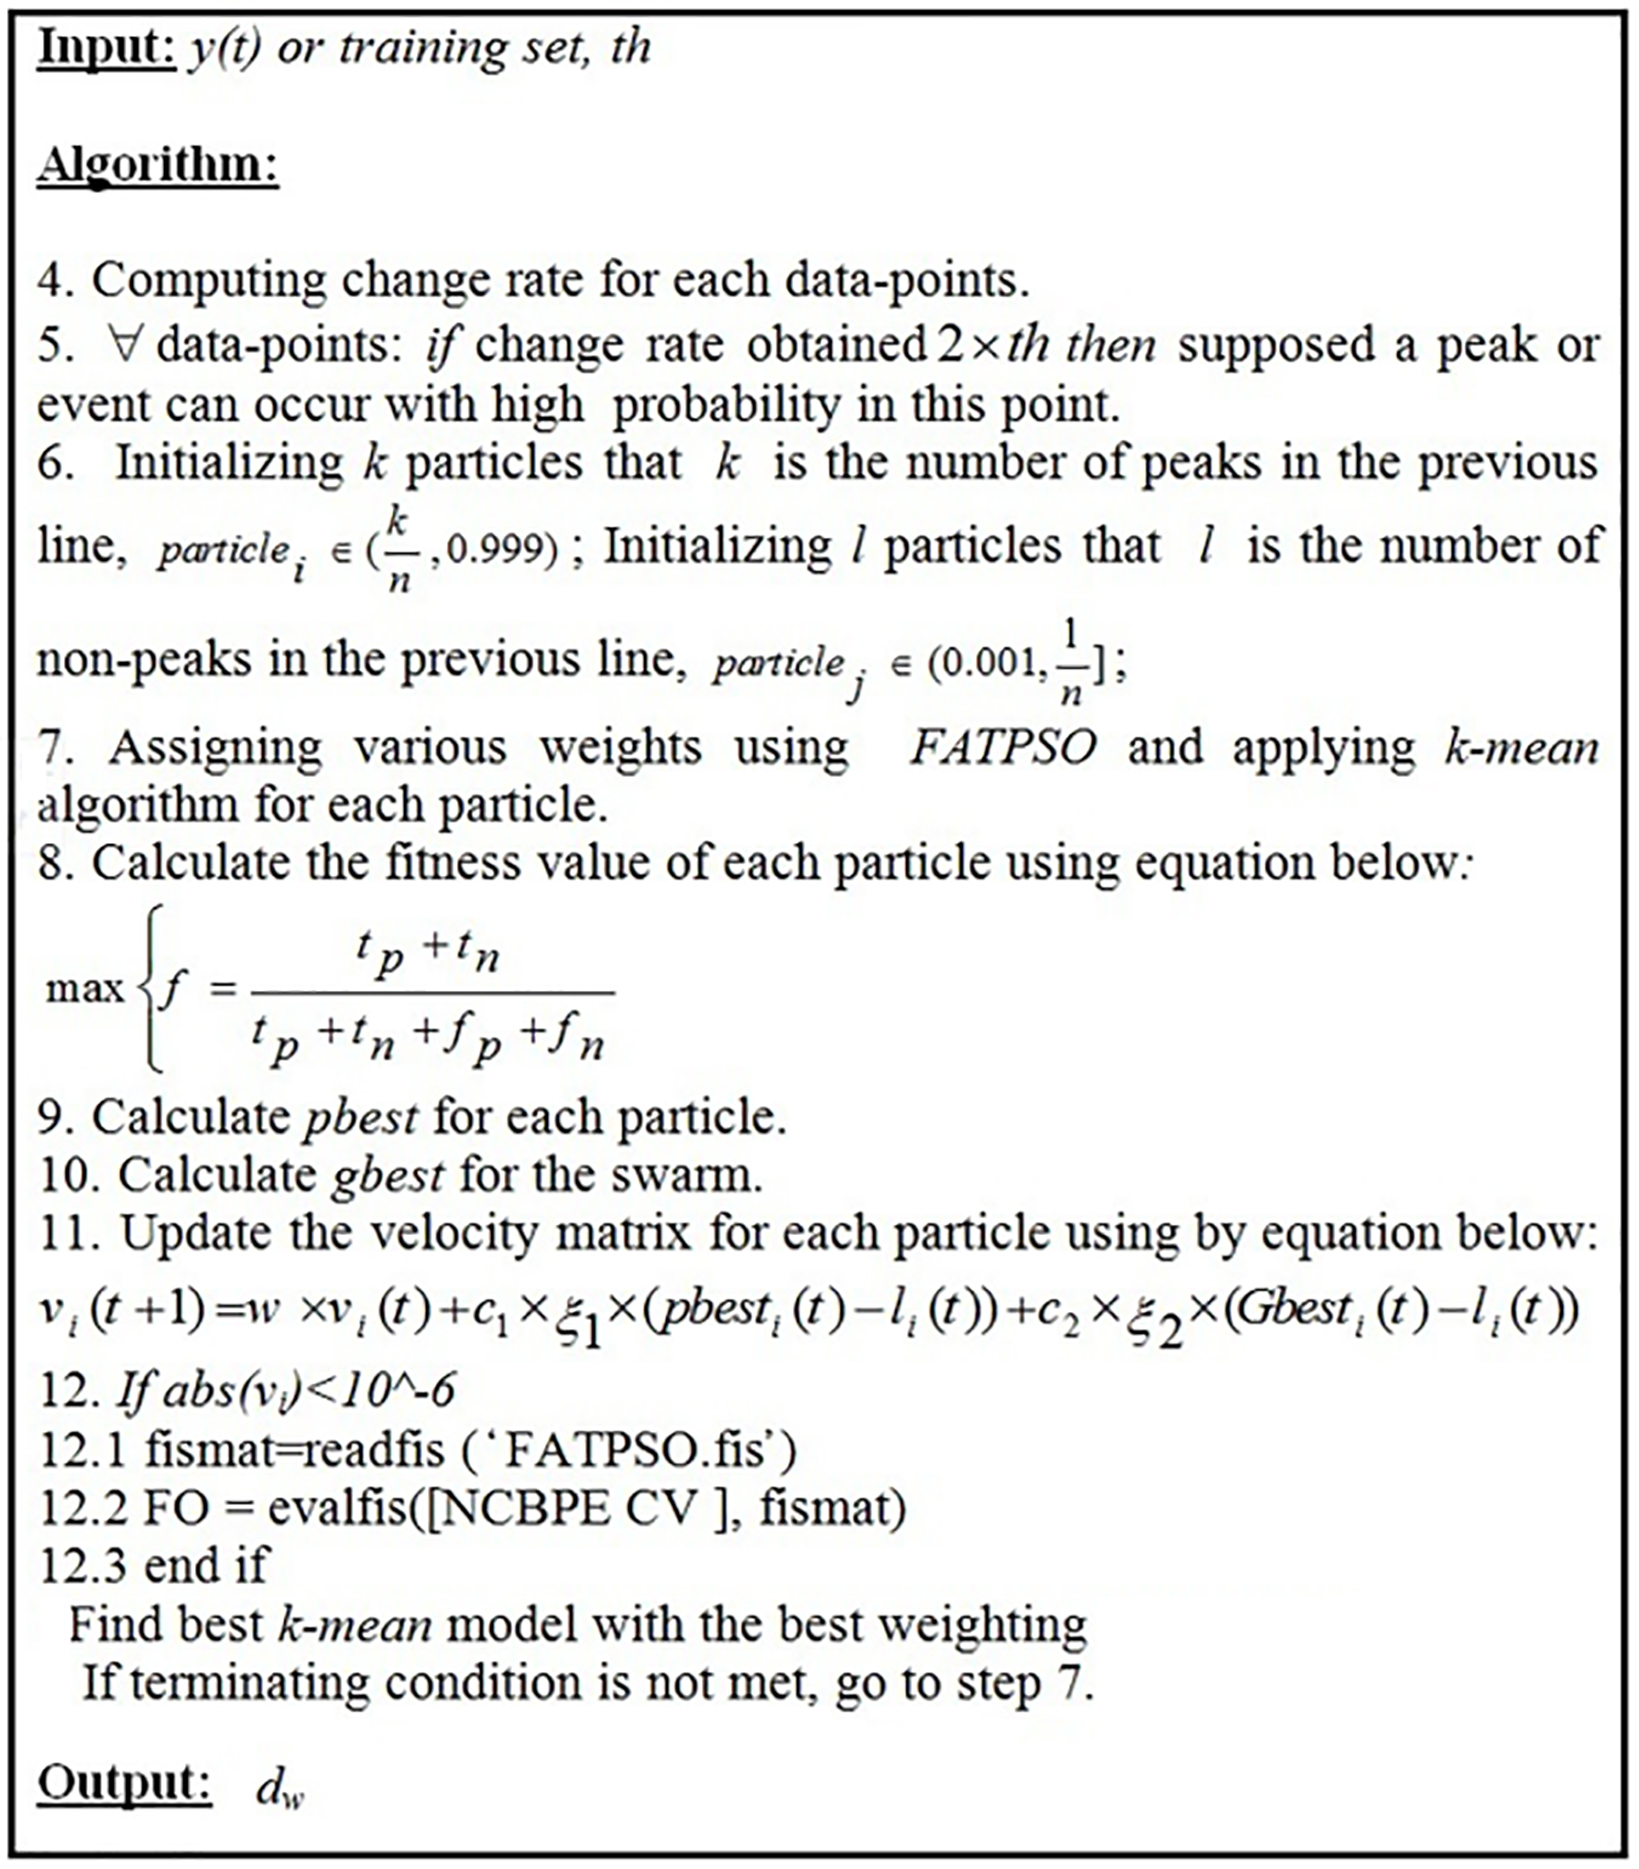
1) Adjusting the threshold: At first, statistically-derived threshold (s) is defined for identifying the qualitatively significant change from time series data and abstracting time series into events. For this purpose,
The defined threshold is employed in the next steps for weighting points of series according to the spatial separation of points.
2) Weighting on the basis spatial separation of data-points: In this step, the first component of the TsEP-TC is employed in order to the data-points weighting based on spatial separation of points. Then the third component is used to optimize weighting process using FATPSO. The presented algorithm is depicted in the Fig. 8. In this algorithm, lines 1, 2, and 3 are similar to the proposed algorithm for optimizing weight assignment (see lines 1 to 3 in the Fig. 4); the rest of the algorithm is clarified in Fig. 8.
Extracting the feature (s) using optimized FCM.
Data-points weighting based on spatial separation of points can serve as a new similarity measure in computing distance, which is obtained as follows:
Where
3) Extracting the feature (s) using optimized FCM: In this section, the significant and important goal is considered to find feature (s) of data-points that event occur in those. Actually, this feature can help to the optimum pattern identification that serves for fuzzy event detecting in the next step. For resolving this problem, a fuzzy modeling is performed in this study, named the optimized FCM as the algorithm of it is shown in the Fig. 9. In this algorithm, lines 1, 2, and 3 are similar to the proposed algorithm for optimizing weight assignment (see lines 1 to 3 in the Fig. 9).
The main motivation for using the optimized FCM is the high flexibility of the fuzzy models in the patterns identifying due to the improper distribution of data, chaotic and complex behavior of data-points, which can make a difficulty in the exact identifying hidden structures and rules.
There are two significant features in the optimized FCM. The first, optimized FCM focuses on producing various feature (s) using the new fuzzy version of PSO, namely FATPSO that is characteristic of an event. Each
4) Fuzzy events detecting of unseen data: Fuzzy modeling can be very useful for fuzzy events detecting the from data-points that there are complex and imprecise relationships between those. Any system consisting of vague and ambiguous input variables may contribute to an ultimate effect. The fuzzy modeling possibility and its degree of effect due to the ambiguous input variables can be considered as a powerful tool for event detecting that is difficult representation of those by accurate conventional models of mathematical. Actually, the ability of fuzzy logic [29] to handle imprecise and inconsistent data made it suitable for a wide variety of applications. In this step, an event has detected by applying FCM and the analysis of FE-based cluster as its algorithm is shown in the Fig. 10.
As is observed on Fig. 10, the output of the previous step,
Statistical characteristics of NYB and MTB
Fuzzy detecting event of unseen data.
This section comprises the four main parts: used data sets; evaluation measures; test method; and results and discussion.
Used data sets
The experiments were performed on the NYB and MTB data sets, which are collected from the time series data library and World Health Organization (WHO). Those are well-known data sets that used for the experiments in the some of the previous researches [11, 30]. NYB dat aset refers to the total number of the monthly births in New York City for the period of January-1946 to December-1959. MTB data set refers to the monthly total number of people who suffer from a certain disease, such as Malaria, Tuberculosis during the period 1997–2010. Statistical characteristics of the used data are shown the in Table 1.
Evaluation measures
In the current study, mean square error (MSE), root mean square error (RMSE), mean absolute error (MAE) and prediction accuracy (PA) are considered as evaluation measures of the proposed hybrid model. Mentioned measures have been used in the valid resources of previously published for evaluating the performance of prediction models [11, 30], which are computed as follows:
Where
Description of PA notations
The test purpose of the proposed model is verifying the efficiency of the TsEP-TC model based on the mentioned measures in the previous subsection. The used test approach in this research is similar to the employed test methods in the literature [11, 12, 13, 30]. Used data sets divided into train and test sets; 70% of data are used as train and 30% as a test set and the metrics of the previous subsection are used to examine the model’s efficiency. Each test is performed 20 times and average of results finally is reported for 20 running. All the experiments of the present research are performed in Matlab R 2015b on a personal computer a dual-core processor with 2.53 GHz of clock frequency and 4 GB of RAM.
Autocorrelation graphs in the NYB and MTB data sets.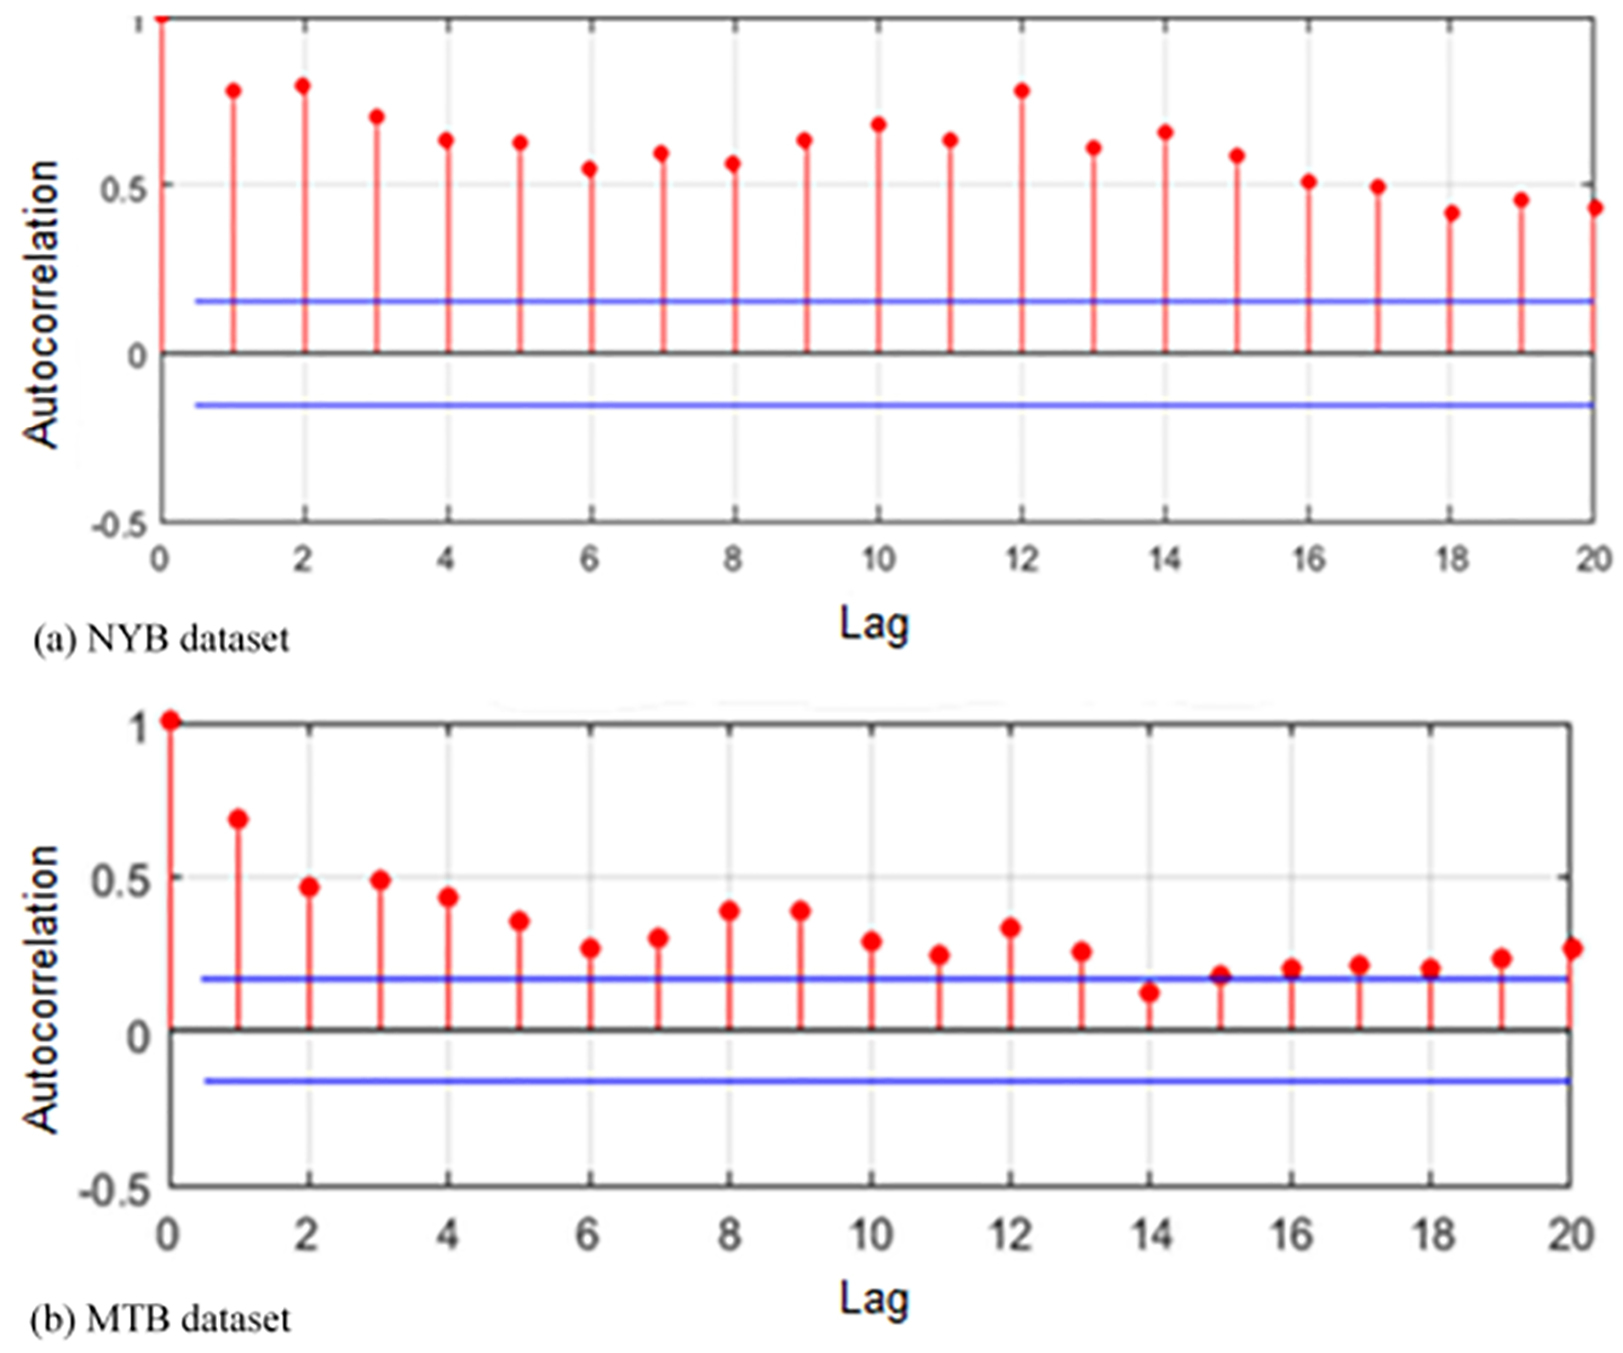
Partial autocorrelation graphs in the NYB and MTB data sets.
In this subsection, the presented models in the previous section are implemented; several experiments are carried out for analyzing the efficiency of the proposed hybrid model; evaluation results have reported to providing fair comparing the TsEP-TC model and the previouse models in terms of performance.
At first, the basis ARIMA model is identified by using ACF and PACF graphs for NYB and MTB data sets. ACF and PACF graphs are depicted in Figs 11 and 12, respectively.
ACF graph in the NYB and MTB data sets (after applying differencing on data).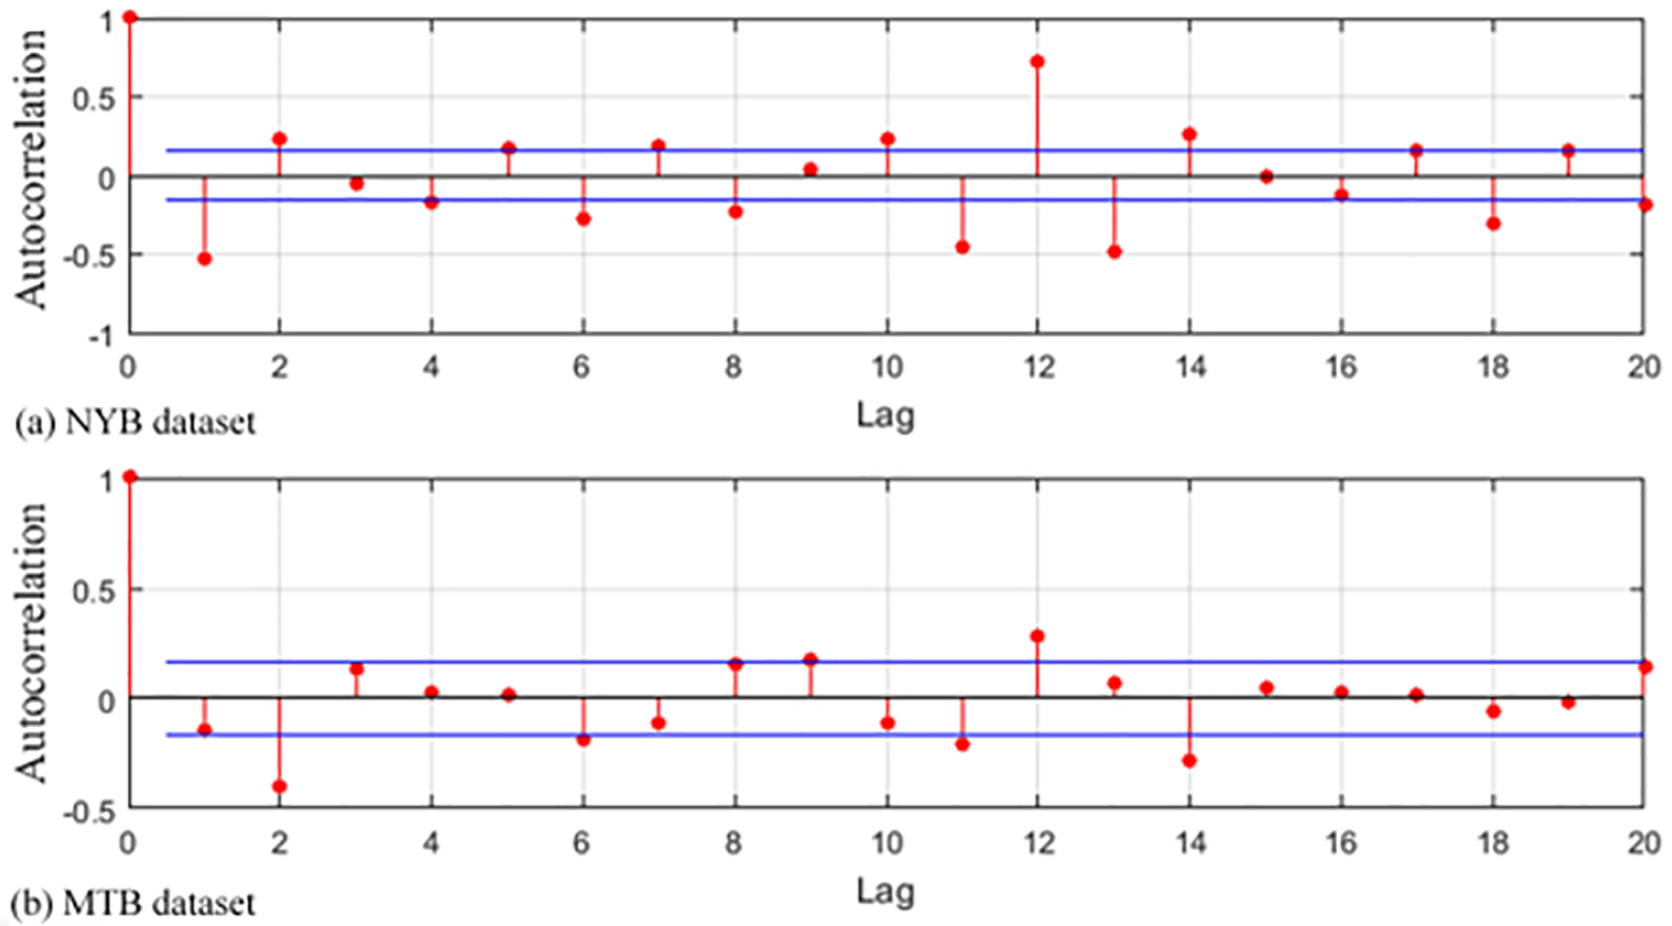
PACF graph in the NYB and MTB data sets (after applying differencing on data).
The autocorrelation of a time series
Determining AR and MA order
As is observed in Fig. 13, the sample ACF of the differenced series decays more quickly. By looking at the ACF and PACF graphs of the differenced series, AR and MA order can tentatively identify that are needed. If the ACF of the differenced series displays a sharp cut off due to the obtained
The best model is preferred as the basis model by comparison of various models in terms of performance (ARIMA (
In this part, an experiment is designed to investigate the efficiency of the prediction model that identified in the previously step against data set weighting and optimizing parameters. For this purpose, each data set is divided into
Comparing performance of the wpo-based ARIMA by varying the number of partitions.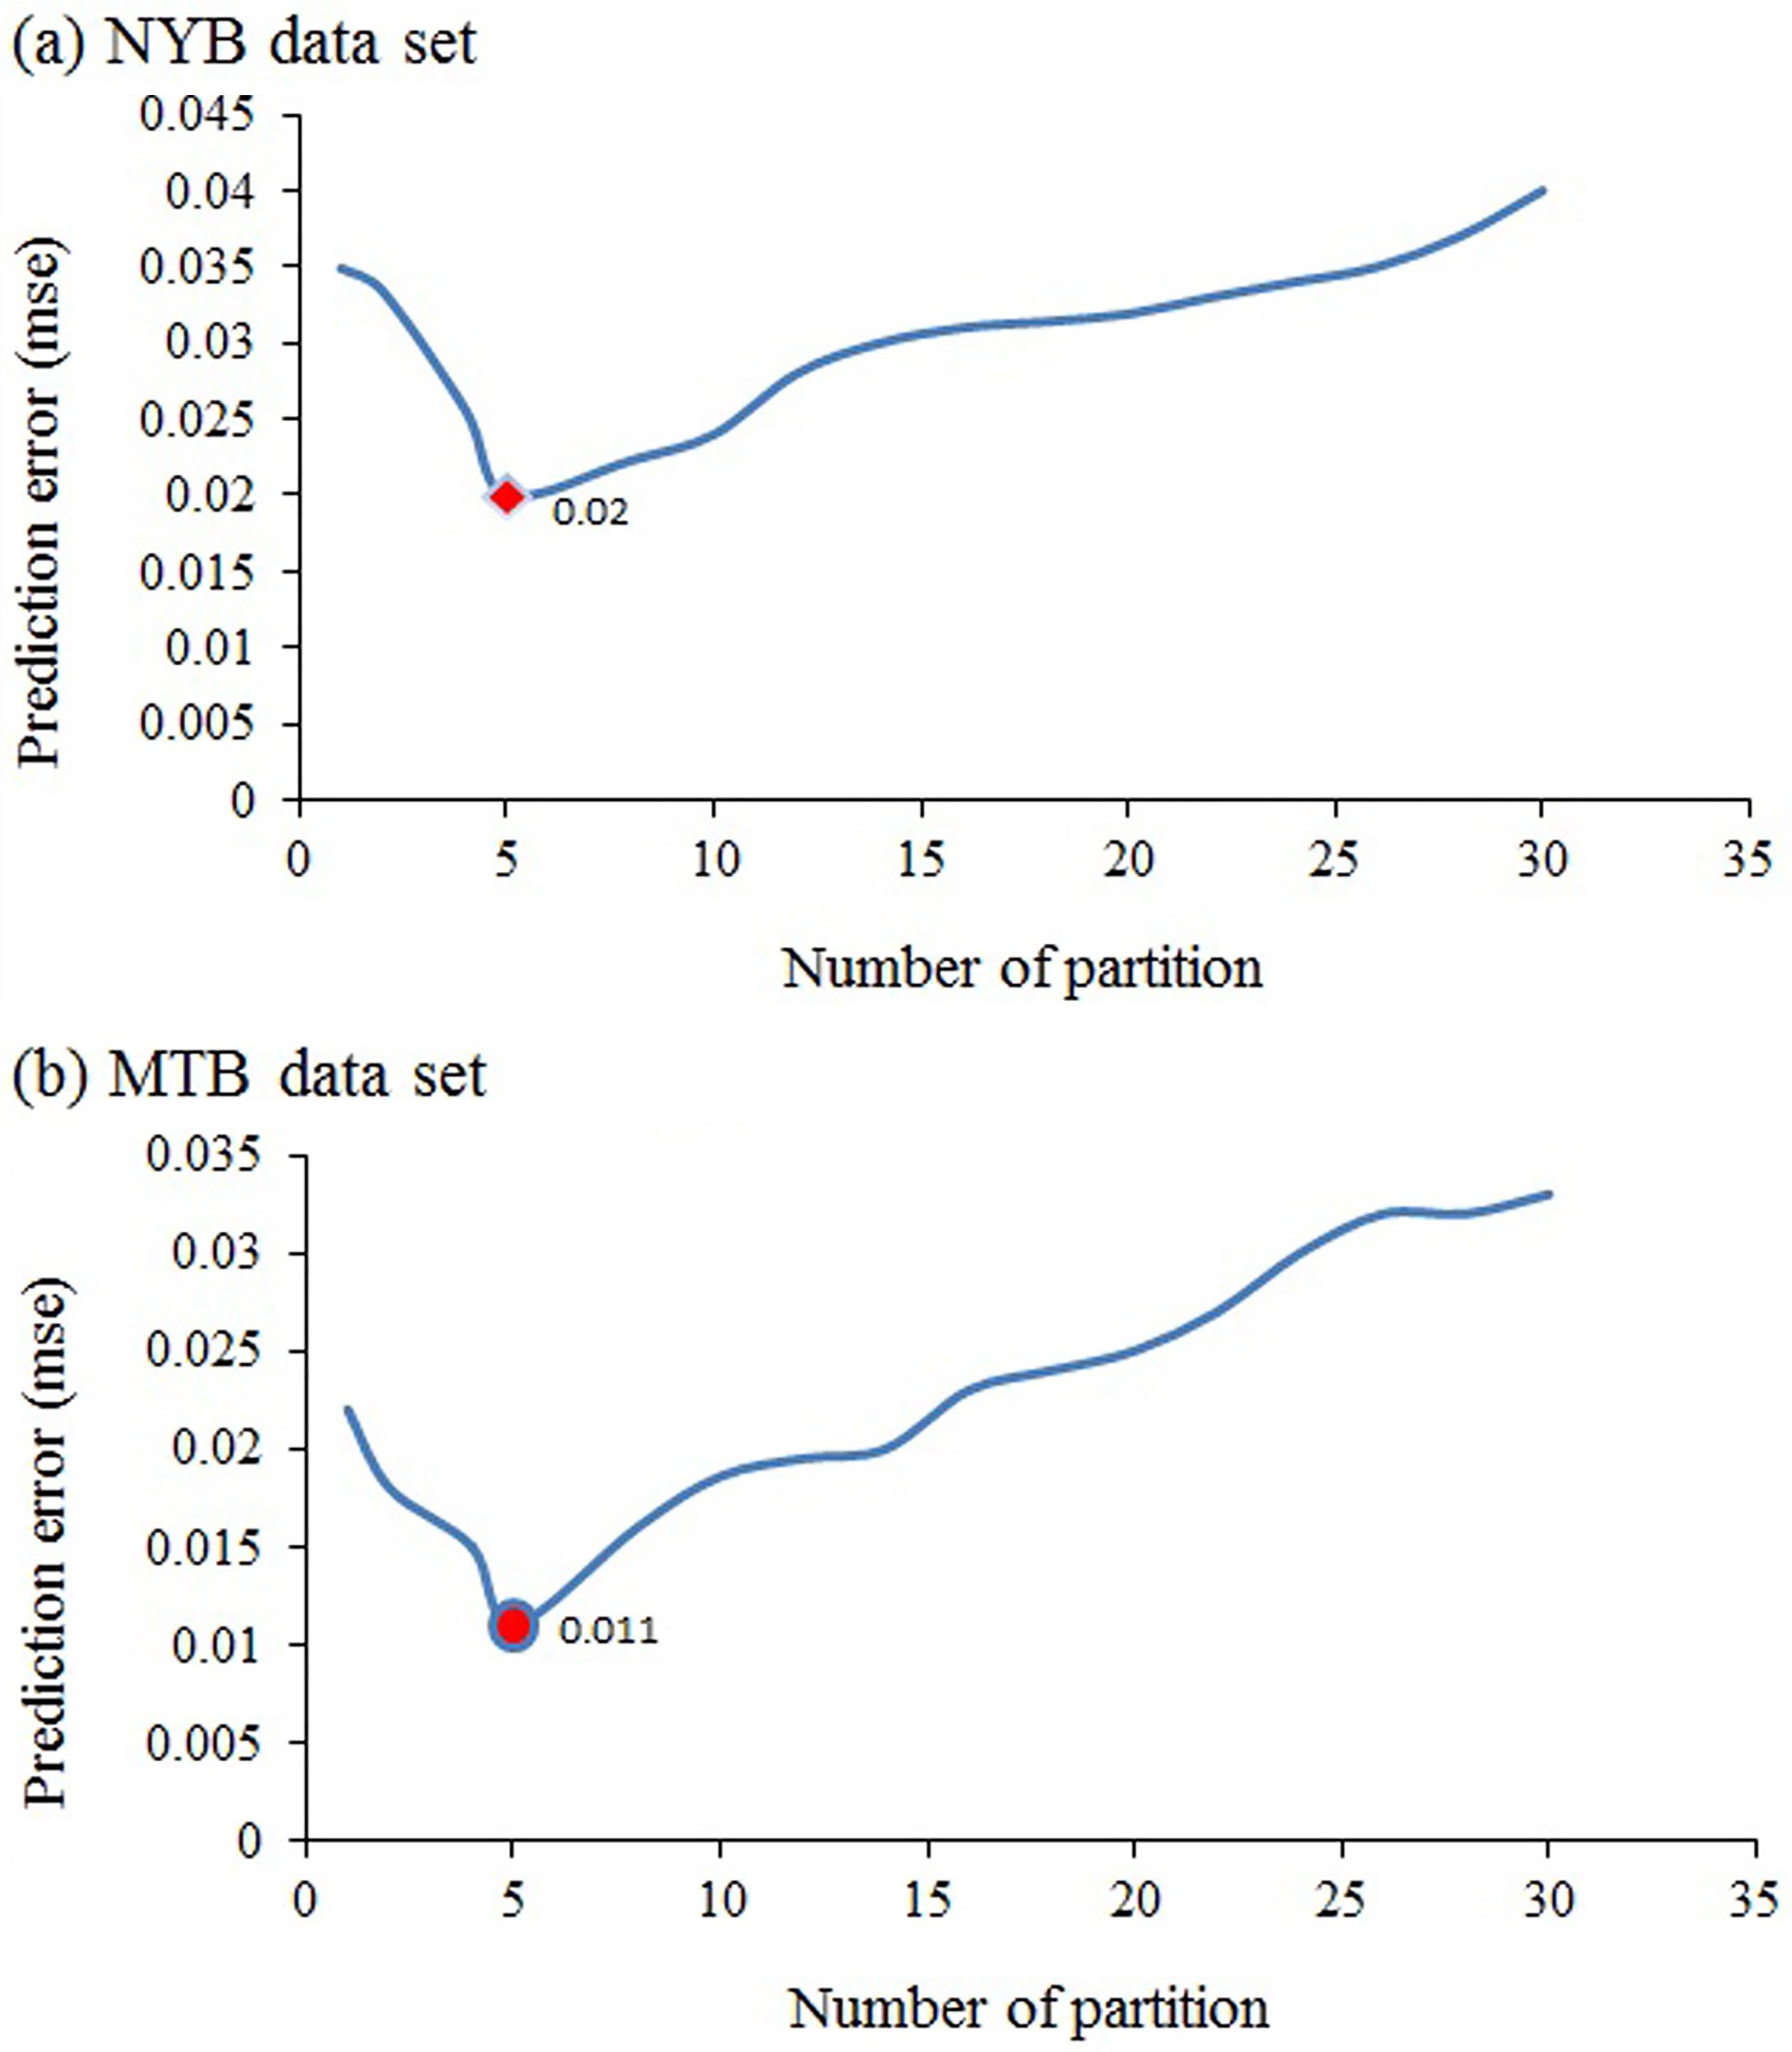
As is shown in Fig. 15, data-points are weighted under different partitioning by applying wpo-based ARIMA and predition error of model is computed for each type of partitioning.
As is inferred from Fig. 15, the lowest prediction error is reported under situations that data sets are divided in to 5 partitions. By comparing prediction error of model when number of partitions is considered 5 and 20, we can infer that prediction error significantly increases when number of partitions considered 20. In fact, the main reason for this error increase is the number of partitions and the assigned weight to each point in the implemented model. The increase of the prediction error after adding partitions number is clear and reasonable because increasing the number of partitions lead to the value reduction of the assigned weight to points in lesser partition due to the proposed algorithm for the series weighting. Consequently, these points may be ignored in the modeling process that the mentioned problem can cause the growth of prediction error.
Comparing the performance of the wpo-based ARIMA and basis ARIMA models.
Analyzing the efficiency of the TsEP-TC in terms of the first and third aspects
Analyzing the efficiency of the TsEP-TC in terms of the second aspect
In the following, a comparison is performed between wpo-based ARIMA and basis ARIMA models in order to investigate significant role of applied components on the basis ARIMA model in the performance improvement of it, which results are shown in Fig. 16. By comparing experiment results, we can infer from Fig. 16 that the better performance is presented by wpo-based ARIMA model in both data sets, which is logical. Because there are difference in the performed sterategy by wpo-based ARIMA model in comparison to basis ARIMA for predicting future value of series. In the other word, the performance of the prediction model is increased when applied weighting and metaheuristics components by wpo-based ARIMA.
For the NYB data, it can be concluded from Fig. 16 that the improvement of MAE achieved by the wpo-based ARIMA model over the basis ARIMA model was 0.025 (15.3%). Similarly, for MTB data, the achieved improvement by wpo-based ARIMA model was 0.017 (16.5%) in terms of MAE criterion. So, it can be used as a proper model for estimating linear patterns in this research.
At present, the other experiment is designed that analyze the efficiency of the proposed predictive model due to the three aspects: measuring the similarity function, the performed model for predicting future values of series, and the offered approach for detecting events. Evaluation results are reported in Tables 4 and 5.
By comparing results reported in Tables 4 and 5, we can derive that accuracy of the event detection increases when the Euclidean function has employed as measuring similarity function in comparison to DTW function in the current study.
In the next experiment, the role of the presented similarity measure (dis) is evaluated for improving the accuracy of event detection in unseen data which experiment results are given in Table 6.
Comparing accuracy of event detection
As Table 6 shows, by comparing distance functions 1, 2, and 3, it is observed that accuracy increases, when the function 1 (dis) is performed as measuring similarity function in the problem of the event detection in both data sets, which seems logical. Since this function takes advantage the first component of TsEP-TC model, namely weighing points of series due to the spatial separation of those. Improving predicting especially time series predicting accuracy is an important yet often difficult task facing decision-makers in many areas.
Hence, the influence of the performed model for reliable predicting future values of series is investigated as the second aspect of efficiency evaluation that comparing models 1, 2, 3, and 4 indicate the priority of the model 4 in terms of efficiency for NYB and MTB data sets. It is reasonable because model 4 take advantages of three components, weighting, fuzzy logic, and metaheuristics in the part of predicting future values of series. On the other hand, model 4 is a hybrid model that both theoretical and empirical findings have indicated [27] that integration of different models can be an effective way of improving upon their predictive performance, especially when the models in combination are quite different. As is seen in Table 5, comparing results obtained by models 1, 3, and 4 for NYB data set show that the improvement of MSE achieved by the model 4 over the model 1 was 75% and 25% was in compared to the model 3. Also, by comparing results of models 1, 3, and 4, it can be seen that MSE measure of model 4 has improved 62% in compared to the model 1 and 18% over the model 3 for MTB data set.
Comparing the prediction models of series in terms of performance.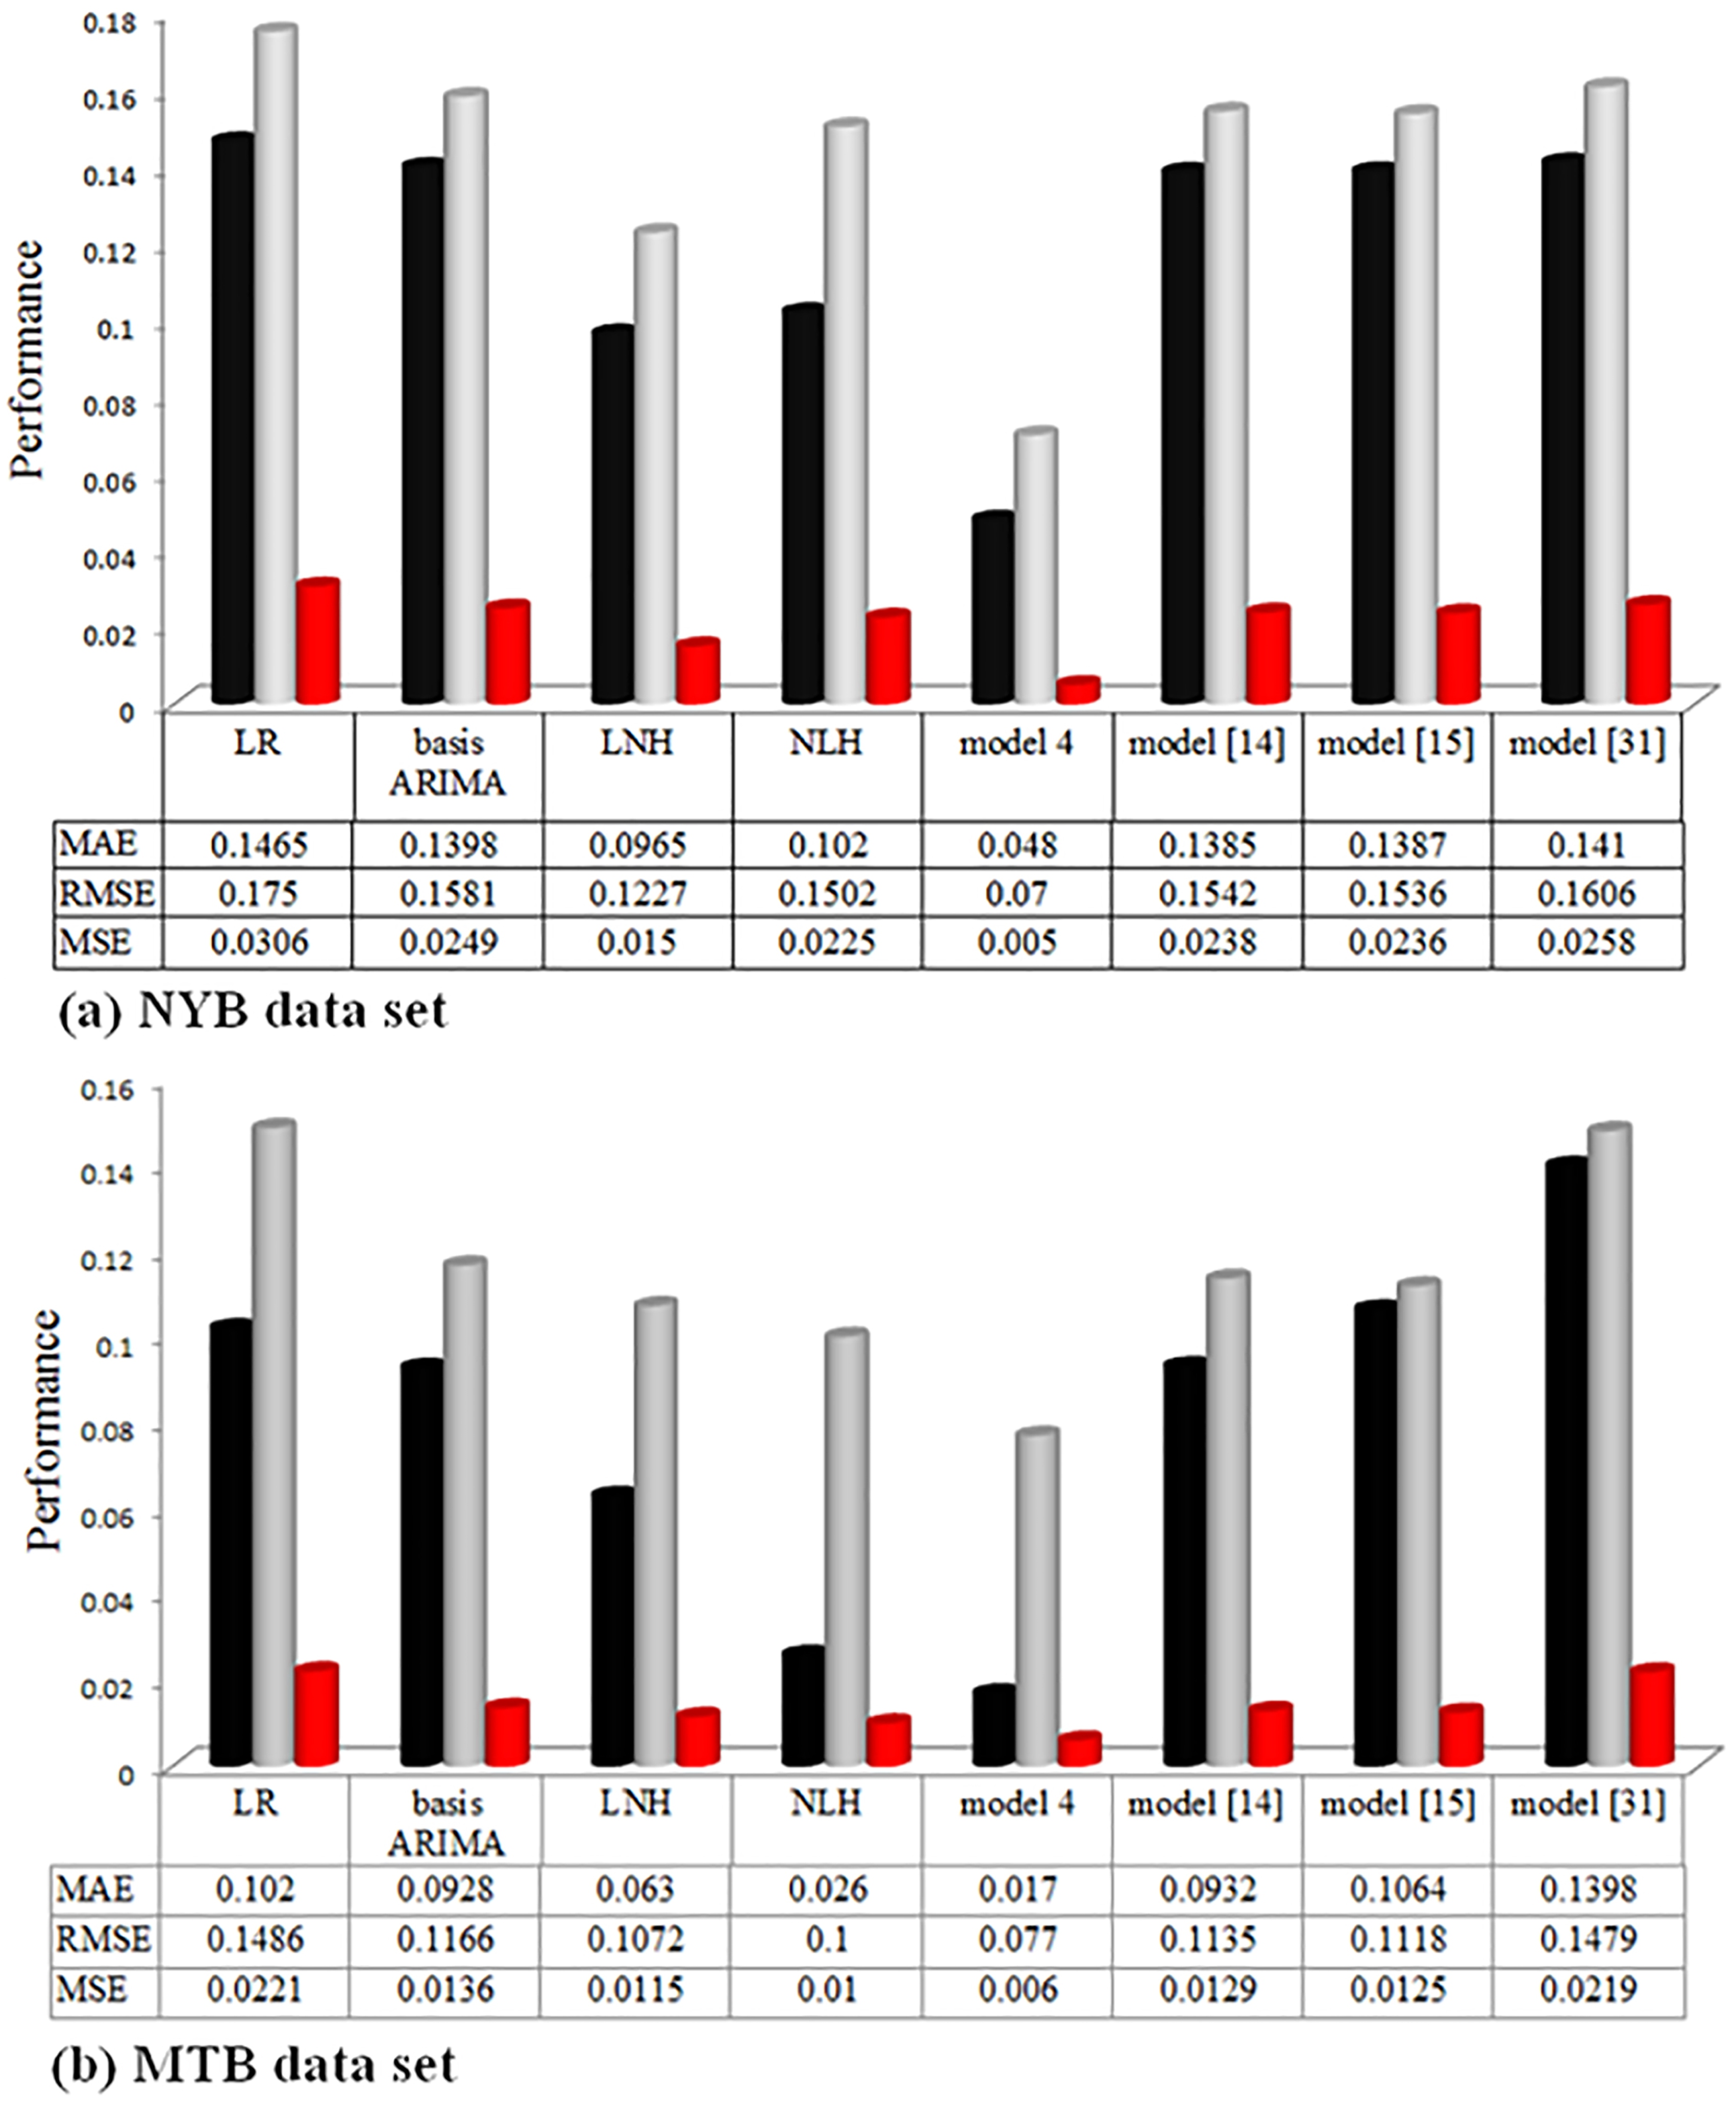
On the other side, for both the tested data sets, results in Table 5 show that the performance is enhanced when the weighting component has applied on the basis ARIMA in the process of data modeling. It can be inferred that the main reason for this performance enhancement is data-points weighting based on temporal separation of each point and assigning various values to the series-points.
In this section, the predictive capabilities of TsEP-TC model are compared with some of other models. The performance comparison is conducted with the LR, basis ARIMA, LNH, NLH (nonlinear-linear hybrid) models [11, 30], and the presented models in [14, 15, 31] as these models are conventional and well-known for predictive problems with time series data in the healthcare field. Also, there is act likeness between those and acts of the TsEP-TC model. Hence, the mentioned resources can provide a possibility to compare the efficiency of the TsEP-TC model to other the mentioned models. We point out that the efficiency of TsEP-TC model is compared from two aspects that include: comparing the performed models for predicting series in terms of performance and comparing the approaches of the event detection in terms of accuracy.
Characteristics of the performed approaches and comparative analysis of those
Characteristics of the performed approaches and comparative analysis of those
In this section, the provided performance by LR, basis ARIMA, LNH, NLH, model 4, and the presented models in [14, 15, 31] is investigated for various indicators like MSE, RMSE, and MAE. Evaluation results are reported in Fig. 17.
As is depicted in the Fig. 17, the results of quite poorly have provided by the LR model for NYB and MTB data sets in the performance indicators, which is reasonable due to limitations of this model in the process modeling of the nonlinear relationships of data-points.
On one hand, in the real-world problems, future situations must be predicted by using a few volume of data over a short span of time while LR requires a large amount of historical data for reaching to the more accurate results. On the other hand, it can be said that the accuracy of prediction depends not only on the model but also on the characteristics of data [30], while the characteristics of data have ignored in the LR model when modeling relationships of data-points. Hence, the lowest performance is given by LR model in comparison to other models. Also, it is observed in Fig. 17 that the lowest error is offered by model 4 in the indicators of performance for both data sets in comparison to other models that is logical due to taking advantages of three components in the act of series prediction. By comparing model 4 and LR, it can conclude that MAE criterion has improved 67% and 71% for NYB and MTB data sets, respectively. Results of Fig. 17 are given insufficiency of basis ARIMA model in the processing complex and nonlinear relationships of data-points in the real problems of prediction; the MAE criterion of the basis ARIMA model is greater in comparison to model 4 for NYB and MTB data sets. As is seen in Fig. 17, the performances of LNH and NLH models are improved in comparison to basis ARIMA and LR models, which this seems reasonable because integrating linear and nonlinear models (LR and Neural networks), increases the performance of the predictive model. Although, results in Fig. 17 show that while applying LNH and NLH models alone can improve the forecasting performance over the LR and basis ARIMA models but model 4 provides the better results in terms of performance in comparison to LNH and NLH models. Comparing model 4 and LNH, it is concluded that prediction error reduces, the performance has improved by model 4 54% and 68% in terms of MAE for NYB and MTB data sets, respectively. For the NYB data set, the improvement of the achieved MSE by the proposed model over the LNH model was 67% and 75% over the NLH model. Also, it is inferred from Fig. 17 that the improvement of MSE achieved by the proposed model over the LNH model was 53% and 45% over the NLH model for MTB data set.
By comparing the performance indicators in the Fig. 17, it can be concluded that the lowest error is provided by model 4 in comparison to the presented models in [14, 15, 31] for both data sets because the model 4 includes the concepts relevant to the presented components. Also, the empirical results are demonstrated that improvement of the MAE criterion by model 4 over model [14] was 63.2%, over model [15] was 65.8%, and over model [31] was 75.11% for NYB data set. Similarity, for MTB data set, improvement of the MAE criterion by model 4 over model [14] was 68.21%, over model [15] was 63.25%, and over model [31] was 71.01%.
At the end, as a result, it can be said that model 4 has been higher the performance than other compared models, which proves the excellence of the performance by model 4 for predicting future values of series in the TsEP-TC.
Comparing detection approaches of the event in terms of accuracy
In this section, approaches of the event detection are evaluated in terms of accuracy. For this purpose, characteristics of each approach are clarified in Table 7; PA is obtained as efficiency indicator for each approach in NYB and MTB data sets then the comparative analysis of PA are shown in Table 7.
As Table 7 shows, PA indicator has improved by TsEP-TC and TsEP-TC had the best efficiency between nine kinds of the performed approaches in both data sets, which is obvious because TsEP-TC takes advantages of three components (weighting, fuzzy logic, and metaheuristics) in the predicting future values of series and detecting events. In addition, it is obvious from Table 7 that approach 1 has the least PA for NYB and MTB data sets. By comparing approaches 1, 2, 3, and TsEP-TC, it can be concluded that PA indicator is increased when TsEP-TC is applied to the act of time series event-based prediction in both data sets, which is rational. The reason is that approaches 1, 2, and 3 have performed linear models such as LR, basis ARIMA, and weighted ARIMA models as predictive models in the prediction act of series, which there are data and algorithmic limitations in these models.
Therefore, using the mentioned linear models reduced the performance of the predictive models in the prediction part of future series value. This problem can lead to the accuracy reduction of event detection in the predicted time series, while TsEP-TC is applied a hybrid model to predict future values of data-points, namely model 4.
The comparative analysis of experiments result demonstrates that the model 4 is very effective in order to offer the better results in the part of the data-points prediction, which is logical. Since it integrates linear and nonlinear patterns and uses the concepts of three components in this field.
Also, approaches 1 and 2, and 3 are carried out basic
The most of the time series event-based detectors analyse the time series itself and detect different patterns in order to label different events. But, the suggested idea in approaches [16, 17, 18] are not based on patterns analysis in a single time series. Hence, the model prediction type of series is not mentioned for these approaches in Table 7. In comparing approaches [16, 17, 18], and TsEP-TC, empirical results show accuracy improvement of event detection by TsEP-TC in comparison to these approches for NYB and MTB data sets. As it can be seen in the Table 7, PA indicator by approach [19] is reported lower than the obtained PA by TsEP-TC. It is clear from Table 7 that approach [19] has applied ARMA model to predicting future values of series. Experiments result are shown that prediction error of ARMA model is high in comparison to model 4 in the prediction part of future series value. This problem can lead to accuracy reduction of events detection.
In general, the results of the current research prove that the TsEP-TC can provide more accurate and reliable outcome in the TsEP problem than that other approaches. Hence, TsEP-TC model can greatly reflect predictive capabilities for time series event-based prediction in the healthcare field. Also, it can be useful to fuzzy predict events from unseen data in the healthcare.
Complexity analysis
As is reported in the previouly section, empirical results are demonstrated that the proposed hybrid reduces prediction error and improves accuracy of events detection in comparison to the other TsEP models for both data sets. In this section, a theoretical analysis is briefly provided for the time complexity of the proposed hybrid. The big-O notation represents a theoretical analysis upon which we can compare two or more algorithms.
In this research, an ultimate goal is considered to predict events with acceptable accuracy in the healthcare time series. Given the research goal, the proposed hybrid includes three fundamental components that its use increase computational complexity, the run time and enhances efficiency of prediction model. In fact, we suffer the costs of this three components, the combination of those, and the combination of the linear-nonlinear models in order to reach the more accuracy in the results presentation in the TsEP problem.
In the most of prediction models, we need that historical data have used to construct a predictive model. Hence, it can be said that the required time is based on the number of series-points in the basis model, which is
Conclusions and future possible directions
In this paper, we have proposed an enhanced hybrid model called TsEP-TC for event prediction in the healthcare time series, which comprise three basic components: weighting, fuzzy logic, and metaheuristics. What makes current research differed from previously performed studies is to take concurrently advantages of the mentioned components for the performance enhancement of the TsEP system and fuzzy event prediction. As a resulting, it can be said that the proposed hybrid approach has two profits: application and algorithmic that make a major contribution to the healthcare and biomedical fields:
Application: our findings demonstrate that the TsEP-TC can be introduced as a strong and helpful tool for the TsEP problem regards to the data nature in the field of under study and the vital role of reliable prediction in the health management of society. Algorithmic: the proposed hybrid model can efficiently handle chaotic, complex, and uncertain behaviors in data-points and model nonlinear relationships between those. Experimental results of the tested data sets reveal the superiority of the TsEP-TC in terms of performance over the previous prediction models. Besides strongness of the proposed hybrid model, there are some weaknesses that remain to be resolved. Hence, some of the future directions are listed as follows:
Literature reveals that the efficiency of prediction models depends not only to choose an appropriate model but also on the other internal and external factors like data characteristics, problems of economic, cultural, political, and etc. These factors could have an impact direct to offering the better prediction results. Hence, in the future, we will present a more accurate model, which apply various factors to improve an efficiency of the prior forecasting models. In this paper, the proposed hybrid model is used for predicting one-step-ahead. Hence, to investigate the proposed hybrid model for predicting multiple-steps-ahead can report as a future research.