Cricket is the second most popular sport ever. It is generally played in three different standard formats namely, test-cricket, one-day cricket, and twenty-twenty cricket (T-20). The T-20 format has been gaining popularity day by day due to its small window of play-time and adventurous materialization. It has become a sport of million dollars. In this scenario researchers are proposing automated and prompt data mining techniques for predictions of various aspects related to T-20 matches. In this paper, a data mining approach has been presented that takes into account the match historical statistics, the real-time match scenario, and predicts the innings-wise score and final score. Suitable mathematical models has been proposed for the purpose of generating the analytical outputs. The proposed scheme is validated through experimental evaluations. Satisfactory rate of accuracy has been obtained that outperforms the other state-of-the-art schemes while compared. The overall rate of accuracy thus obtained is 94% which is a good figure when we are considering the real time data.
At the beginning of a match, a coin tossing is performed between the two teams. The team winning the toss has the right to give its choice, either to bat first or to bowl first.
2
Functionality
The functionality of any team is to win the match. The team bowling first () is to put all its effort to limit the score by the opponent team, similarly the team that is batting first () has the objective to score as many runs as possible during the 20 valid overs. This is all about the functionalities in the 1 innings. During the 2 innings, the total score made by has to be chased by by putting all efforts in its bating. During this, which is the bowling team has to limit the opponent. There are eleven players (wickets) in each team and two players have to be present on the bating pitch at a time.
3
Runs
Runs can be scored in many ways. The two players present on the pitch have to run from one wicket end to the other after a player on the striking end hits the ball delivered by the bowler of opponent team. They have to secure their wicket boxes. To stop the run scores, the opponent players would field the ball. A general representation has been shown in Fig. 1. Another way of scoring the runs is to hit the ball out of the boundary of the playground. If it goes out of the boundary with out a single drop, then the score is a direct six, or else it is a four. Apart from this, extra runs are also counted pertaining to the nature of improper balls like no ball, wide ball and other improper actions like over-through, bye, leg bye etc.
4
Loss of wicket
The batting team have eleven players to bat with. The batsmen currently playing on the pitch may face dismissal in several ways. These may be bowled out, leg before wicket (LBW), caught by any player from opponent etc.
5
Pool
In a match of T-20, the total of twenty overs and the total of eleven players for a particular team are the pool. The pool get exhausted gradually as the match proceeds.
6
Target
If has bated initially, the total score made by this team has to be chased by the opponent (). Thus target for is not less than score + 1.
7
Sub-innings
There are two innings each of 20 overs in a match. Let’s segment the total of 20 overs into four sub-innings (each of five overs) for the purpose of ease of computation. Let the sub-innings are denoted as . and are the score made and wickets lost by a team in a specific sub-innings . Thus, at the end of an innings, total score is and total wickets lost is .
Cricket is not only a sports, rather it is similar to a community in the Indian sub-continent. It is being played in three different formats namely test match, OD match (one day), and T-20. The test match format comprises of a time window of five long days, the OD match takes a time window of 100 overs (in one over six valid balls are delivered and played) The Indian subcontinent cricket is a popular sports played by 16 countries. The gaining popularity of T-20 matches are drawing the attention of many researchers in the domain of data mining. Prediction of numerous parameter values has been a challenging task so far in this context. There have been a number of agencies working towards this approach along with a deployment of huge amount of financial resources [1, 2, 3, 4]. A comprehensive survey on twenty-one different articles about sports data mining has been presented in [5]. So far, handful of techniques have been proposed for prediction of different aspects in the game of football [6, 7, 8], however the number of techniques proposed for crickets is quit a few with respect to that available in football. In [9], an two-phase integrated scheme has been proposed. Each of the phase is responsible for prediction of the outcomes for two of the total innings of a cricket match. They have used Naive Bayes classifier for the purpose. They have proved this method to be better than the linear regression model. In [10], they have presented a mining technique for tracking the sports activities of players. Using the same, they are readily analyzing the inhibit health deficiency of sportsmen and providing required resolutions through further activities and nutrition information. Similarly, association rule mining scheme has been successfully used for data analytics of the Indian cricket team data. In [11], an integrated platform has been presented in the name of SnapShot that visualize sports data and provide intelligence in putting shots in games like ice-hockey. They have used a heat mapping strategy for the same.
Related works
In [12], a scheme has been proposed for mining association rules using principal component analysis (PCA). This is exclusively for cricket matches. They have proposed a framework for establishing correlations between pieces of cricket statistics with frequent patterns. This framework is meant to help in making and improving coaching strategies. In [13], the same association rule mining has been implemented for strategic planning for teams during ICC-2015. Several decisive parameters like match-venue, toss output, rank order of a batsman, strike-rate, and score-economy has been analyzed. In [14], performance data mining has been presented for the cricket team of New-Zealand. It takes into consideration all the historical data pertaining to the New-Zealand versus other teams starting from the year 1975. In [15], a combined approach of few of the modern classification techniques has been analyzed for the prediction of ODI cricket outcomes. Naive Bayesian, Support Vector Machines (SVM), and Random Forest (RF) have been used for the purpose.
Proposed work
It has been learned from the literature that there has been a need of a proper prediction scheme especially for the T-20 cricket matches. This has to be performed in real time, even, during the live match. In this context, the proposed work makes an attempt to analyze and effectively implement an ensemble of classifiers for clustering based prediction. The efficient Pearson metric has also been used for better result. The work is explained in a sequence in the subsequent subsections in detail.
Modeling the T-20 match
The general parameters associated with the match have been presented in Table 1 along with their brief descriptions.
General overview of a typical cricket pitch layout.
Formulation of the problem
The exact problem considered in this work is mainly a two-fold as given below:
For a sub-innings , to predict the subsequent sub-innings scores, and
To predict the winner for the match.
The prediction of score is carried out using several features as discussed below in subsequent subsections. For the purpose, the old match statistics are considered along with the real time scores (from the current match being played). Finally, a comparison is made between the total score and predicted score .
Old_Stats
Five different features are considered for each individual team in this proposed model of old statistics of so far completed matched. They are discussed below:
Mean Score (): This is the average runs made out of the total old matches excluding the current match being played. This refers to the runs scored if the team opted bating first only. It can be mathematically computed as .
Mean Wickets (): This is the average number of wickets (players lost) out of the total old matches excluding the current match being played. It can be mathematically computed as .
Mean Chase (): This is the average runs made out of the total old matches excluding the current match being played. This refers to the runs scored if the team had performed bating second only. It can be mathematically computed as .
Difference of Total Dismissal (): This is the difference of total number of times a team has been dismissed all out to that of the number times it has dismissed its opponent team. This value can be either a positive or a negative value, or can be zero as well.
Average Strike Rate (): This is the average of all the strike rates made by all the players of the team.
Current_Stats
From the statistics of the current match being played, a total of three features are considered for the model. They are discussed below:
Pair of Strike Rate (Strike): As there are two batsman at any instance of time on the pitch, so, this value refers to the sum of the strike rates of this pair of players that is computed from their performance in the current match only. This value most often shows a fluctuating trend throughout the match.
Required Run Rate (RR): For the team bating first, the required run rate has been set as the normal value of one run per ball (that is 6.00). For the team chasing a score (bating second) the required run rate is computed as , the value in the denominator is 20 which is nothing but the total number of overs.
Difference in Run Rate (DRR): This is the difference between the actual run rate to that of the required run rate for the current over of the current match being played.
Proposed algorithm
The proposed algorithm attempts to predict the future score for the team currently batting and also the winning probability of each of the team.
The algorithm uses the old stats and the current stats for the purpose. It utilizes the -NN (-nearest neighbor) technique. A random sub-group of the features are chosen for predicting the score for a particular sub-innings through the bagging-ensemble method [16]. The purpose of utilizing the -NN is to do an approximation of the current sub-innings situation to that of a similar sub-innings from the old matches. The distance metric used here is the Pearson distance [17, 4] which has been proved to be an efficient metric for establishing correlations. The value for here taken is 4 which has been decided based on pilot experimentation.
PREDICT()[1] Input feature sets {Old_Stats, Current_Stats} Each sub-innings ; Each classifier from the ensemble Update
Pilot experiment using clustering
The -means clustering algorithm has been proved to be an efficient unsupervised scheme till date for most of the pattern grouping tasks. In our case also we have used the same for the grouping of similar innings data patterns. These data patterns from previous match statistics are taken together to form several clusters based on overall performance. Let, the dataset be denoted as that is a matrix containing the innings informations row-wise (let a row be denoted as ). The clustering is done as usual way by taking four random means. Here, there have been four samples taken as the mean samples keeping in mind the innings performance. These are High, Moderately High, Draw Situation, and Low. As this is unsupervised, the patterns, at successful completion of the algorithm, will automatically be falling in their respective clusters among these four. For simplicity, the clustering algorithm is described in Algorithm 3.4.
Pilot_Clustering()[1] Input innings collection matrix {} with samples. Randomly pick four non-identical clusters as the means for four clusters (). Each sample Computer the distance between with and record the mean with whom the distance of is smallest. Assign to the recorded cluster. Recompute the mean of the modified cluster as, , where is the total number of samples in that cluster.
For choosing a suitable cluster for a test sample the Pearson distance measure has been used because, this distance metric measures the correlation between two non-ordinal variables. The distance correlation (between variables and ) can be given by the formula:
where,
and,
and,
To note, and are the row-mean and column-mean for the row and column respectively.
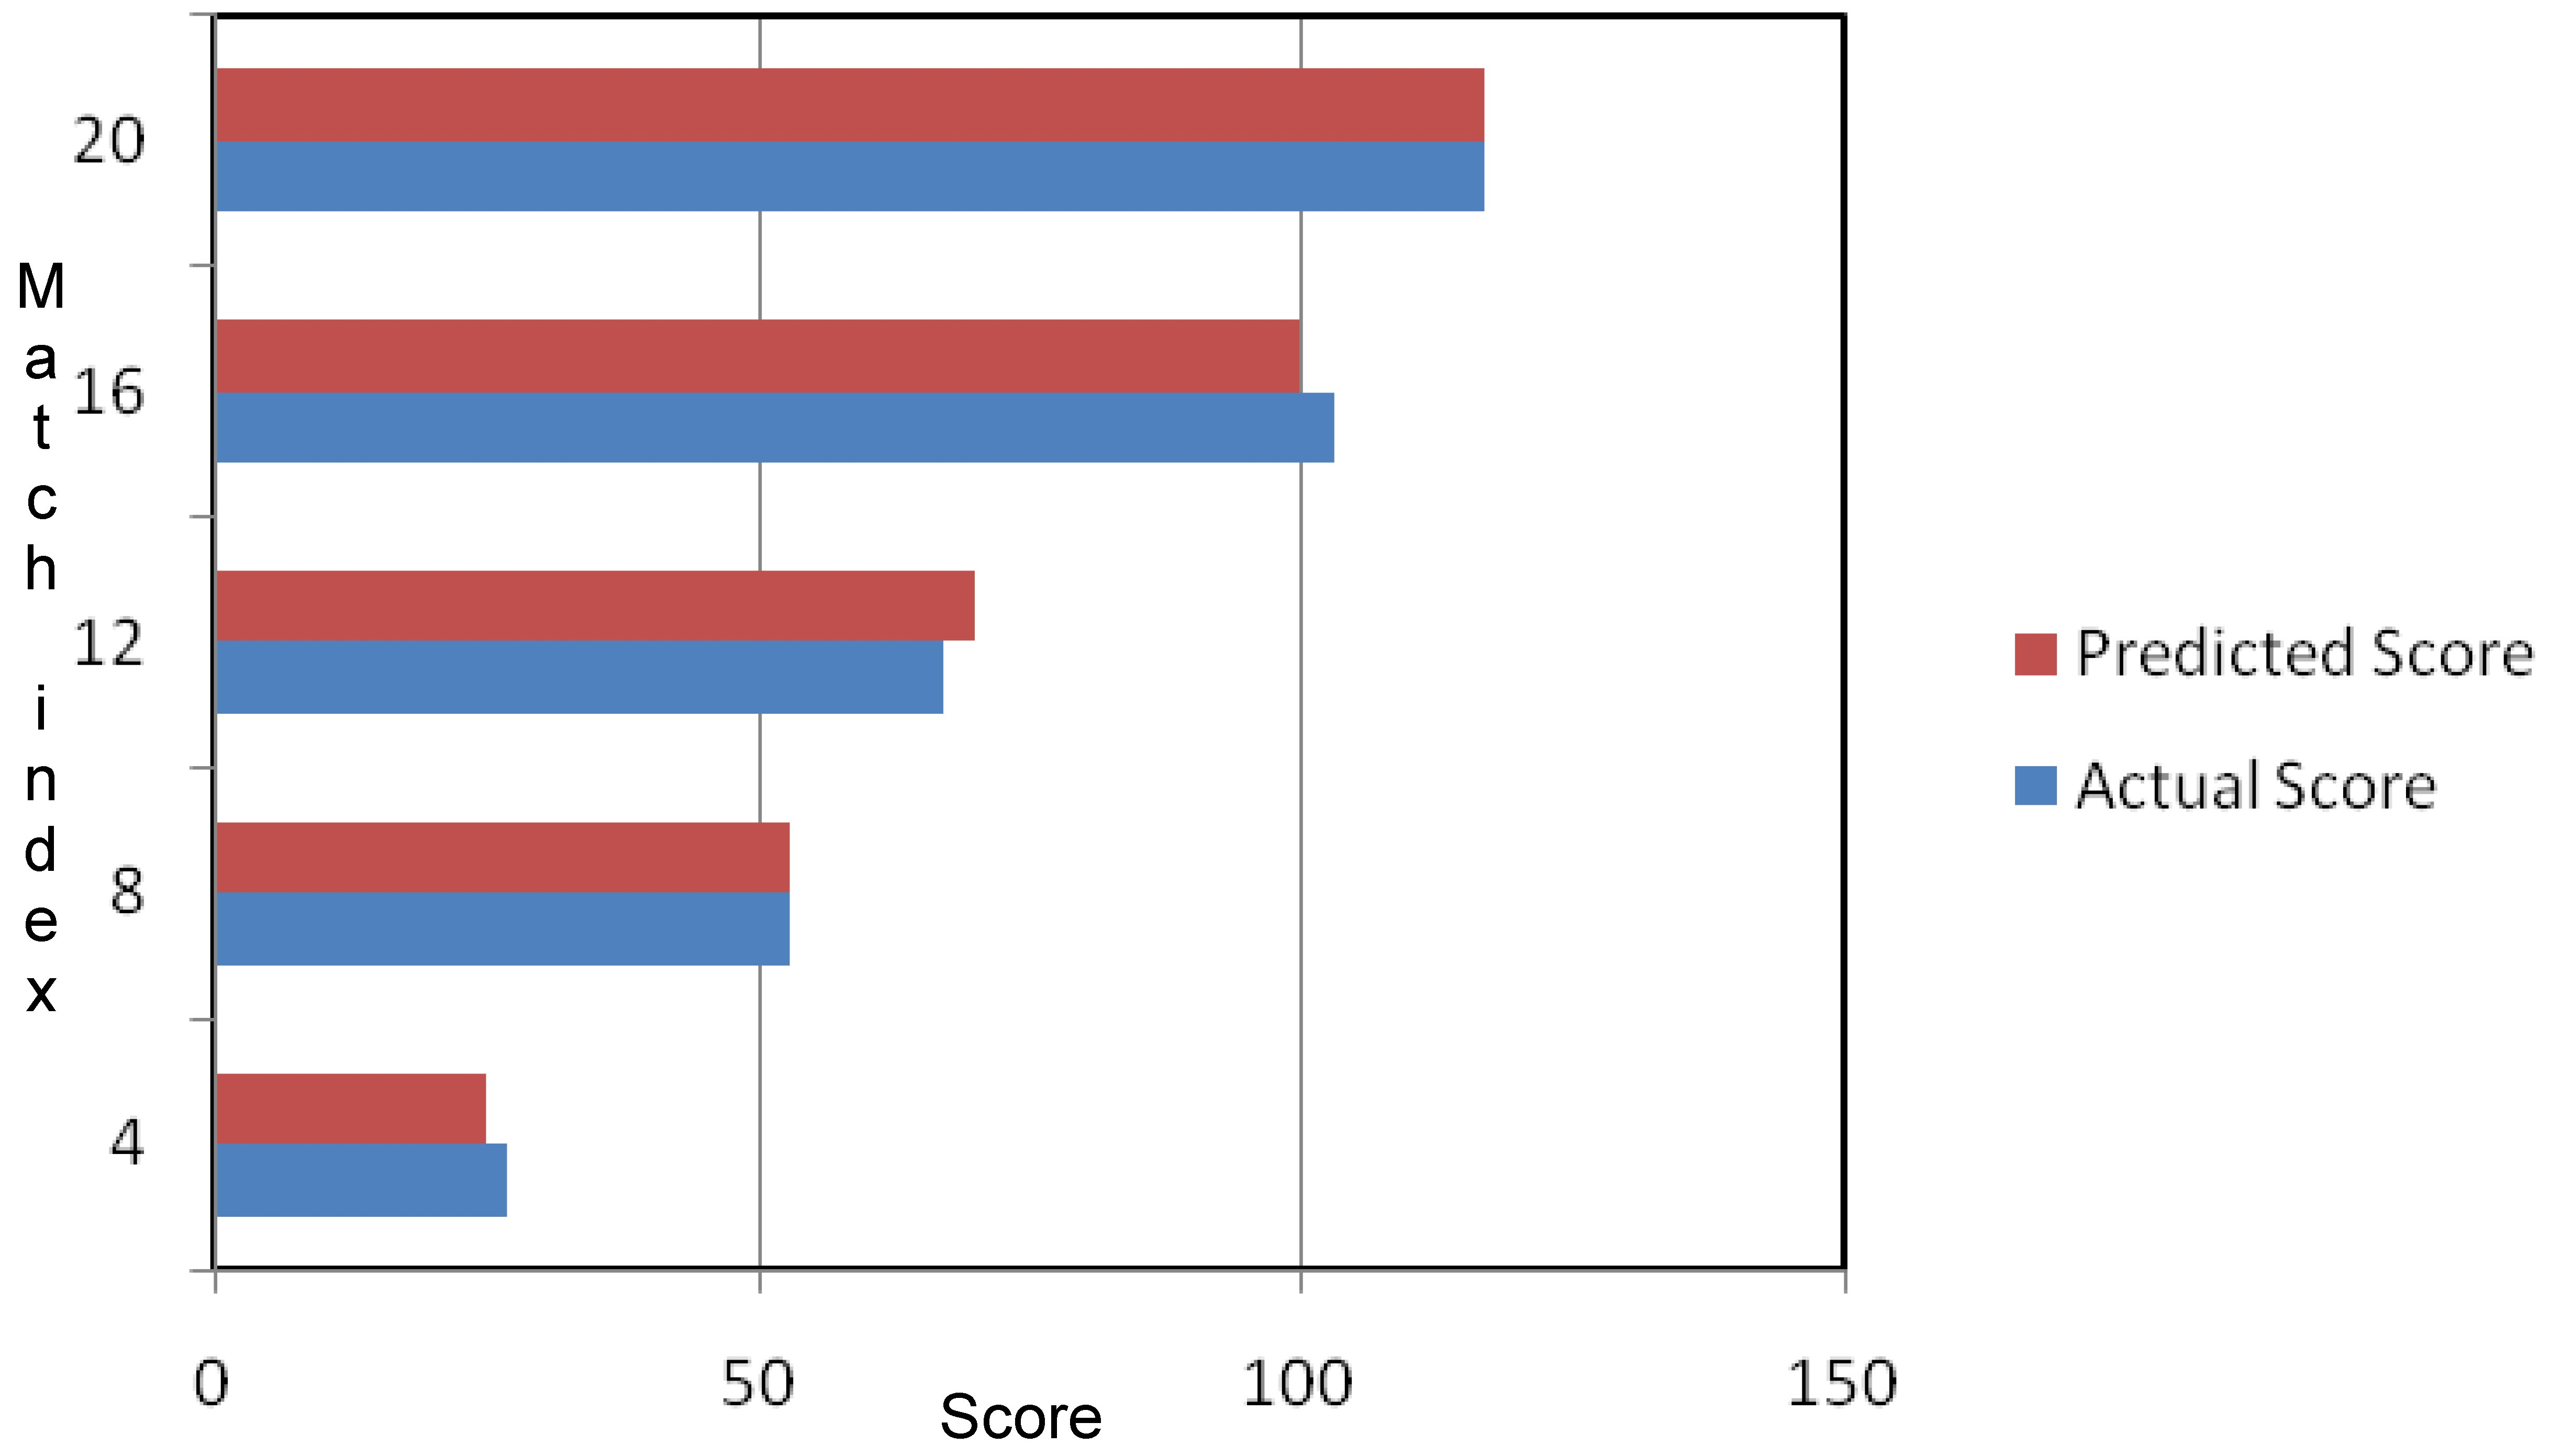
The dataset are collected from one of the leading sports repository with the name cricwaves network [1]. The historical data of 200 players have been collected from their past 10 number of matched. These players belong to teams from six different teams namely, India, Bangladesh, Australia, England, West-Indies, South-Africa. The data are retained from only full matched excluding the abandoned matches (due to rain, bad weather, foggy condition etc.). The overall rate of accuracy was calculated taking a -fold cross-validation strategy ( 5). The predicted scores and the actual scores have been compared and an overall accuracy of 94% has been obtained. The plot of the sub-innings wise predicted score for the recently played three distinct T-20 matches have been presented in Figs 2–4. It can be observed that the actual scores in the time line are almost close to that of the predicted scores. This validates the efficiency of the proposed scheme. Further, the proposed work is compared with three different prediction models using the same dataset. Corresponding statistics representing the rate of overall accuracy has been shown in Table 2. The proposed method rate of accuracy is par forth the remaining schemes.
Comparing actual score versus predicted score for India for T-20 between Indian versus Australia (10 Oct, 2017).
Comparing actual score versus predicted score for England for T-20 between England versus West-Indies (16 Sept, 2017).
Comparing actual score versus predicted score for South Africa for T-20 between South Africa versus Bangladesh (26 Oct, 2017).
Conclusion
An efficient and robust scheme has been proposed for prediction of real time innings score and total score for a T-20 format cricket match. This model utilizes the clustering technique taking into account the Pearson distance metric along with an ensemble of classifiers. At all the time the best classified cluster is chosen for the purpose of prediction which is decided by a voting expert technique. The proposed scheme almost approximate the actual score which has been validated by experimenting through thirty different international matches between six different teams. The future work includes a detailed analysis and prediction of loss of wickets, batsman score prediction and bowlers data mining. Generalization of the proposed scheme may be considered for other standard formats in cricket, however, various criteria influencing these formats may be introduced into the problem domain for increasing it’s efficiency.
BonidiaR.P.BrancherJ.D. and BustoR.M., Data mining in sports: A systematic review, IEEE Latin America Transactions16(1) (Jan 2018), 232–239.
6.
CarsonK.W.J. and LeungK., Sports data mining: Predicting results for the college football games, in: 18th International Conference on Knowledge-Based and Intelligent Information and Engineering Systems – KES 2014, 2014, pp. 710–719.
7.
BialkowskiA.LuceyP.CarrP.YueY.SridharanS. and MatthewsI., Large-scale analysis of soccer matches using spatiotemporal tracking data, in: 2014 IEEE International Conference on Data Mining, 2014, pp. 725–730.
8.
JanetzkoH.SachaD.SteinM.SchreckT.KeimD.A. and DeussenO., Feature-driven visual analytics of soccer data, in: 2014 IEEE Conference on Visual Analytics Science and Technology (VAST), 2014, pp. 13–22.
9.
SinghT.SinglaV. and BhatiaP., Score and winning prediction in cricket through data mining, in: 2015 International Conference on Soft Computing Techniques and Implementations (ICSCTI), Oct 2015, pp. 60–66.
10.
FisterI.FisterI.FisterD. and FongS., Data mining in sporting activities created by sports trackers, in: 2013 International Symposium on Computational and Business Intelligence, Aug 2013, pp. 88–91.
11.
PileggiH.StolperC.D.BoyleJ.M. and StaskoJ.T., Snapshot: Visualization to propel ice hockey analytics, IEEE Transactions on Visualization and Computer Graphics18(12) Dec (2012), 2819–2828.
12.
UmaP.Maheswari and RajaramM., A novel approach for mining association rules on sports data using principal component analysis: For cricket match perspective, in: 2009 IEEE International Advance Computing Conference, 2009, pp. 1074–1080.
13.
BhattacherjeeS.SahooJ. and GoswamiA., Association rule mining approach in strategy planning for team india in icc world cup 2015, in: 2015 Second International Conference on Advances in Computing and Communication Engineering, 2015, pp. 616–621.
14.
KhanR.K.ManarviI. and uddinM., Evaluating performance of blackcaps of new zealand vs. global cricket teams, in: 2009 International Conference on Computers Industrial Engineering, 2009, pp. 1500–1504.
15.
Neeraj PathakH.W., Applications of modern classification techniques to predict the outcome of odi cricket, Procedia Computer Science87(Supplement C) (2016), 55–60.
16.
BryllR.G.-O.R. and QuekF., Attribute bagging: Improving accuracy of classifier ensembles by using random feature subsets, Pattern Recognition36(6) (2003), 1291–1302.
17.
SzekelyG. and RizzoM., Data mining and knowledge discovery, Springer, the Netherlands, The Annals of Statistics42(6) (2014), 121–167.