
Abstract
In this research, a highly robust and efficient software design optimization model has been proposed for object-oriented programming based software solutions while considering the importance of quality and reliability. Due to a piece of information that software component reusability has allowed cost and time-efficient software design. The software reusability metrics prediction and cost estimation play a vital role in the software industry. Software quality prediction is an important feature that can be achieved a novel machine learning approach. It is a process of gathering and analyzing recurring patterns in software metrics. Machine learning techniques play a crucial role in intelligent decision making and proactive forecasting. This paper focuses on analyzing software reusability and cost estimation metrics by providing the data set. In the present world software, cost estimation and reusability prediction problem has been resolved using various newly developed methods. This paper emphasizes to solve the novel machine learning algorithms as well as improved Output layer self-connection recurrent neural networks (OLSRNN) with kernel fuzzy c-means clustering (KFCM). The investigational results confirmed the competence of the proposed method for solving software reusability and cost estimation.
Keywords
Introduction
Software reusability is a characteristic that refers to the projected reuse possibly of a software module. A module can be well-thought-out, a self-governing replaceable piece of the application that gives a distinct time function. A module of a software can be logically put together, which is created separately and distributed as components. The separated components can be associated unaffected with other apparatus to create an extensive system. Software reusability enhances the efficiency as well as can impact on the excellence and maintainability of software product. Developers have frequently used the concept of software reuse because of time and money constraints. Within a short period, developing the new system is a challenging and costlier one. It is generally assumed that the reprocessing of existing software will improve the dependability of a new software application. The real challenge involved in Software metrics is processing a large amount of historical data. Initially, the authors have taken the data set “sourceforge.net.”. In this paper, the author considered the WoS (Web of Service) projects. There are 100 numbers of WoS JAVA projects taken and extracted the software metrics. The role of data analytics (ML) Machine learning algorithms are used to perform so that the data is processed and patterns are generated. In this paper, we have extracted the software metrics by using the Chidambaram and Kemerer (CK) metrics, which are popularly known as CKJM. There are six well defined class oriented metrics are available like: -WMC (Weighted Method Per Class), DIT (Depth of Inheritance), NOC (Number of Classes), CBO (Coupling Between Objects), LCOM (Lack of Cohesion). These metrics are used to get the structural investigation of OO (Object – Oriented) based software mechanism. The primary objective of SE (software engineering) is to construct high-quality reusable software within the given period, with the least amount of price, and that satisfies the users requirement. To improve the quality of the software, the number of methods should be assumed. In the present trend, a set of experimental tools are used to determine the aspects of software with the help of recent developed technologies. Software measurement considers size, complexity, reliability and provides useful information concerning the exterior aspects of software like reusability, maintainability and testability.
Literature review
Dissimilar structures are enumerated in a variety of learning due to their belongings on the software merits. Padhy et al. [2] represents the concept of software reusability metrics and its implementation by using novel evolutionary algorithms. They proposed a set of parameters that allows estimating the measurement from the software code. Priyalakshmi and Latha [3] present the Evaluation of Software Reusability Based on Coupling and Cohesion. They have used several techniques to estimate the reusability metrics in this paper, they have focused cohesion primarily and coupling metrics as well as defined their metrics for extracting the quality information from the package. Li and Dai [4] present the article which demonstrates the objective of software reusability metrics and its importance in the software industry. They proposed a set of parameters that can calculate the Message length-based causal discovery, and others one is Ensemble structure discovery. Padhy et al. [5] focused more on software reusability criteria. They have done the systematic literature review (a decade review from 2000–2018) and found the essential reusability influencing factors. Hudaib et al. [6] discussed the software reusability metrics prediction by using a self-organization map (SOM). The SOM is one of the known pattern matching algorithms and ANN representation that is based on competitive knowledge and is an unsupervised learning paradigm. Padhy et al. [7] describe the complexity estimation using software met- rics. They have taken a set of 20 numbers of programs of each C# and Python and estimated the metrics form each other, further demonstrated software reusability metrics. Bou Nassif et al. [12] demonstrate how effort estimation can be done by using novel machine learning algorithms. Padhy et al. [13] proposed a set of reusability metrics by considering a six CK metrics set, which is defined by Chidambaram (1994). They have demonstrated the importance of software reusability in the industry. Padhy et al. [14] proposed evolutionary algorithms and models which able to estimate the reusability cost estimation by using novel machine learning algorithms. Przemyslaw et al. [16] discussed the software cost and project estimation by using unique machine learning algorithms Padhy et al. [17] identified the reusable components from the Component-Based System. They have proposed several metrics and model which will determine the reusable parts from the repository system. Padhy et al. [18] discusses the software reusability metrics from the MobileApps by using evolutionary algorithms. They have taken the case study of mobile Apps, which is called RozGaar. They have taken the evolutionary algorithm, which allows making a prediction of job seeker as well as a provider. Padhy et al. [19] demonstrated the software estimation procedure and parameter settings. Authors have used the different algorithms, notations to represent reusability metrics. Several algorithms have been used to get the reusability prediction.
Software metric.
Software metrics can be used throughout a software development life cycle to assist in the estimation, quality control, productivity assessment, and project control. Figure 1 presents the software metrics life cycle, that demonstrate the metric software concept with measurement based techniques.
CK metrics
CK metrics
Different characteristics of different metrics.
Is it possible to predict the software reusability metrics Is it feasible to estimation the software cost? Is it feasible to derive the software cost estimation by using novel K-based fuzzy clustering?
In contrast, Metrics play a vital role in measuring quality products [15]. It can be employed throughout SDLC to assist fault and software quality estimation, quality monitoring and control, product evaluation, etc.
Figure 1 represents the flow of metrics and their classification. The above diagram indicates the hierarchical relationship of metrics. There are different types of parameters described; among them, CK metrics is one of them. In this paper, our prime concentration is CK metrics. The CK metrics consist of six other metrics, which we have been used to estimate the metrics from the data set. These are WMC (Weighted Method Per Class), DIT (Depth of Inheritance), NOC (Number of Children), CBO (Coupling between Object) RFC (Response for Class), and LCOM (Lack of Cohesion). The detailed classification of software metrics represents in the Fig. 2.
In this paper, the following six CK metrics have been used for fault detection and classification, as well as prediction purposes. The objective of choosing the attribute subsection is to access the complete feature set by utilizing enriched principles. Generally, the assortment of attribute subdivision includes two main fragments: the calculation of the feature subsections and examination of the overall existing space. Likewise, the evaluation of the specific features where the exploration contains an empirical model established on extensive survey methodology. The collection of assets signifies the method to decrease the laid-off attributes of the primary data and used to calculate the attribute subsections for assessing the improved value in the function.
OSM (Object-Oriented Software Metrics) are used to compute an assortment of characteristics of software like size, complexity, reliability, quality, and so on. They participate in a significant responsibility in analyzing and improving software code. Software measurement also offers useful information on exterior eminence aspects of software such as its maintainability, reusability, and reliability [8, 9].
The fundamental requirement of any metric is to measure a precise issue. Here, the primary task is to identify the metrics and formulate what we expect to achieve in the course of reusability.
The most important plans in the construction of reusable mechanism are applicability, competence, ease of use, and reduce the efforts and comfort of maintenance.
The subsequent are the key aims for reuse metrics. The importance is on straightforwardness and ease
To make available practical procedures of reuse To estimate the reimbursement of reuse. The parameters help to judge the approximation of the benefits from specific factor To offer a response to developers and management To give easy, effortless the recognition of values.
In this section, the authors have discussed the state-of-the-art issues of Object-Oriented Metrics.
The principles of this research work are sketched below:
To recommend the diversified ML (Machine learning) performance based on software reusability estimation replica for OO (Object-Oriented) software using use case point approach To evaluate the efficiency of machine learning techniques for reusability estimation of WoS (Web of Service) projects and validate the result using the dataset, and collected from “Sourceforgue.net.”
In this paper, we have used machine learning algorithms to estimate the software reusability metrics from the data set. There are several algorithms used, which are specially used for prediction purposes. The choice regarding deciding the machine learning technique for accomplishment reason in the planned investigate is carried out based on the historical research study done in the literature survey [10, 11].
Decision tree technique
This technique is called a prediction technique where an intelligent model characterized, and the dependent variable used as a set of predictor variables. Initially, it was proposed by “Morgan and Sonquist in 1963,” and at that time, it was referred to as Automatic Interaction Detection (AID).
The primary objective of the DT algorithm is to optimize every node locally rather than globally for the whole tree structure diagram. It provides better results accuracy As compared to other models. It may understand the ill belongings of the over-fitting issues.
Random forest technique
It is another kind of classification and regression analysis technique. The random forest (RF) falls under ensemble learning algorithms. It builds several decision trees throughout the preparation period and decides the concluding class by choosing e the mode of the levels produced by distinct trees. To get better results which are competitive than the results from individual DT models, ensemble model joins the consequences from dissimilar models of similar type or different types.
Performance evaluation criteria
Performance evaluation criteria
It is the groups of learning machines, supportive of implementing the structural hazard minimization inductive standard in arrange to get a good generalization on a limited number of learning prototypes. For the regression type, the authors have used the SVM (Support Vector Machine). The earlier drawbacks found in the literature can be overcome by the SVM model. Weighted Gradient Boost Support Vector Machine Classification Technique After relevant feature selection, Weighted Gradient Boost Support Vector Machine Classification (WGB-SVMC) Technique is proposed in GLSFE-WGBSC Technique to attain improved classification efficiency for brain tumor disease identification.
On the contrary to well-known works, WGB-SVMC Technique is designed by combining Support Vector Machine (SVM) and gradient boosting classification.
On the contrary to existing gradient boosting classification, WGB-SVMC Technique assigns a weight value for each base SVM classifier based on loss function and thus finds the robust classifier for brain tumor disease classification. The WGB-SVMC Technique combines a set of base SVM classifiers (i.e., weak classifiers) to form a reliable and robust classifier. An SVM is a weak classifier, which is a prediction model with relatively poor performance (e.g., in terms of accuracy) that may lead to wrong conclusions due to the high rate of misclassification error. To convert a weak learner to a strong one, the predictions of several weak independent learners have to be combined. This combination accomplished by taking the higher weight of every prediction of all vulnerable learners as the final robust classifier. SVM predicts the reuse-proneness of the OO-software classes. To model SVM based prediction the following generic function is applied
Where represents the non-linear transform. The prime objective of this model is to estimate the value is obtained by the minimization of regression risk.
It signifies the cost function, and the penalties for the estimation error (small and significant value of
Association – Identifying correlations among data and establishing relationships between data that exist 284 together in a given record. Classification – Identify and 285 sorting data into groups based on similarities of data classification is one of the most common applications of data mining. The idea is to build a model to predict future outcomes through the classification of database records into several predefined classes based on specific criteria. Clustering – Finding and visually presenting groups of facts previously unknown or left unnoticed. Heterogeneous data is segmented into several homogenous clusters. Standard tools used for clustering include neural networks and survival analysis Forecasting – Discovering patterns and data that may lead to reasonable predictions. It estimates the future value based on a record’s design. It deals with the continuously valued outcome. Forecasting relates to modeling and the logical relationships of the model and sometime in the future.
Performance evaluation and its criteria
Mean absolute error (MAE)
It presents the calculated output, and it gives the actual value as expected.
Mathematically, it is presented as
It presents the calculated output and shows the actual value as expected. In the experiment, to alleviate any possibility of overflowing in the denominator, 0.01 is added. Thus, it becomes
Mathematically, SEM is presented as below
Software reusability metrics comparison using machine learning algorithm
In the above equation refers to the standard deviation of the mean and presents the total number of samples.
In this paper, we have used several parameters that will estimate the accuracy, precision, F-measure, and recall. The corresponding mathematical expression has been given in the tabular form. Apart from this, there are other parameters that are used, which are called errors.
Software reusability comparison graph.
The artificial Intelligence-based ANN model has developed for three machine learning algorithms, specifically SVM, RF, and DT, where their efficiency measured. The overall representation has been drawn in terms of the confusion matrix, which represents in Fig. 4. It shows the value of Accuracy of SVM is 93.41%, and F-Measure is 95.45%, which obtained for training, validation, testing, and overall, respectively.
SVM.
Random forest.
Similarly, the overall representation has been drawn in terms of the confusion matrix, which is represented in Fig. 5. It shows the value of Accuracy of RF is 83.41%, and F-Measure is 89.45%, which obtained for training, validation, testing and overall respectively. As a comparison from these two models, it reveals that SVM dominates RF technique.
Similarly, the overall representation has been drawn in terms of the confusion matrix, which is represented in Fig. 6. It shows the value of Accuracy of DT is 92.40%, and F-Measure is 95.45%, which obtained for training, validation, testing and overall respectively. A comparison in terms of DT and SVM from these two models it reveals that SVM dominates all other techniques which are clearly visualized in Fig. 7.
During data pre-processing techniques, the raw data must be transformed into target data. Then after the target data must be converted by using the selection technique so that pre-processed data will generate. In this paper, our raw data are 100 WoS projects developed using an object-oriented programming approach. To convert a sophisticated tool has been designed. A CKJM (Chidambaram and Kemerer) metrics extracted, then normalization is done, which range must be 0 to 1. At the end of the stage, machine learning reusability proneness techniques used.
Software cost estimation using kernel-based fuzzy clustering model
Papamichail et al. [21] discussed the data set about software reusability based on the static analysis metrics. They have explored the data set and presents the reuse rate information. They have discussed 62 maven projects and examined the number of classes and packages. Their primary focus on the source meter tool and finally retrieved 24,000 classes and 2000 packages. The primary purpose of this function is to use employing kernel function is to rewrite to get the intended service of the kernel-based fuzzy C-means clustering (KFCM) algorithm.
In the above equation, the parameter
Decision tree.
Software reused prediction model.
Structure of hidden layer for OLSRNN model.
Moreover, the partition matrix and cluster centers can be computed using alternating optimization [8] as follows:
In this paper, the polynomial kernel has also been examined right through this make inquiries. To achieve this research work, the PKF (Polynomial Kernel Function) is used to redraft the objective function (i.e. Eq. (8)). And then, making an allowance for the FPM (Fuzzy Partition Matrix) and CC (Cluster Centers), it is being optimized. After optimization, we got the fresh CC and FPM. This can be acquired as below:
Statistical properties of used datasets
KFCM-OLSRNN based block diagram for software cost estimation.
In this section, the proposed model is constructed where a single training sample can be indicated as
Software cost estimation by using KFCM
There are several authors focused on software cost estimation techniques by taking sample software project datasets. Padhy et al. [3] demonstrated the model for software cost estimation and reusability prediction. The author [15] focused on software cost estimation techniques by taking sample data sets. FCM stated as one of the premier fuzzy clustering algorithms, but it is one that’s why it is not widely used as well as multifaceted intrinsic uniqueness cannot proceed as well on polarimetric data clustering. It is known as linearly separable patterns. This part of this paper investigates the new cost prediction techniques, which are called KFCM, and it is derived from the COCOMO model. This model primarily required the following parameters, and these are as follows:
Person team size Work proceeds time in months Person efforts in the month
The above parameters can be represented in numerical ways:
In the above equation, the coefficient ‘a’ represents the productivity, and ‘b’ indicates the scaling factor parameter. The accuracy of the project cost will be increased with 15 cost drivers mentioned as
In this part of this article provides the necessary dataset information. The primary dataset refers to PROMISE, but in this paper, a sample of students’ lab assignments considered to be the data set of GIET. To assess the performance of the proposed approach, we employed five software measurement datasets of the PMS-Repository of GIET. Table 4 offers the statistical information for these datasets in terms of a numeral of features in each dataset, dataset size, mean, minimum, maximum and skewness of effort.
Padhy et al. [20] focused on the reusability metric estimation as well as threshold derivation. Authors have also described the evaluation of threshold measurement as well as the threshold parameter setting mechanism. Maggo and Gupta [22] discussed the software reusability prediction model by using novel machine learning algorithms based on certain OOPs (Object-Oriented Programming System). They have developed the optimisation model for software reusability prediction. Papamichail et al. [23] discussed the software user-perceived reusability estimation techniques. They have estimated metrics from the software repositories. Again they have used several machine learning algorithms for estimation software metrics at both class and package level.
Comparison of machine learning models for cost estimation model
To identify the best possible (cost-efficient and effective reusability estimation model), the performance of the proposed system is assessed in two phases:
Accuracy related performance assessment. Cost-efficiency related performance assessment. A brief of these performance evaluation approaches is given as follows.
Accuracy related performance assessment
In this phase, performance is evaluated in terms of prediction Accuracy, Precision, F-Measure, Recall and Specificity and different error-profiles such as mean absolute error (MAE), the mean magnitude of the relative error, standard error of the mean (SEM), and root mean square error (RMSE). To retrieve performance measures, confusion metrics are obtained for each classifier. The key variables of the confusion metrics are given in Table 2.
Metrics-1
The performance of the above model can be measured by using the below metrics, and it can accurately identifying model derivation which is called as MMRE (mean magnitude of relative error)
In the above equation, the parameter ‘N’ stands for the number of projects, and it
Metrics-II
By taking the above equation, we can derive the new metrics which estimate the median value of all the mean magnitude errors, which termed as MdMRE. It can be represented as below:
Metrics-III
The third metric used in this work is defined as the percentage of predictions falling within the actual known value, referred to as PRED, which is given by
Where
Where
We utilise the cross-entropy between the predicted probability
It seems that different models convergence rates and their essential differences are obviously depicted. Since in the proposed reusability prediction model the total number of reusable class identified by the proposed reusability prediction model is equal to the sum of true positive (TP) and false positive (FP) value, it is must estimate the cost incurred at testing and verification process at class level. In this manner, the cost of evaluation would be equivalent to the cost of unit testing (
Machine learning models for cost estimation model.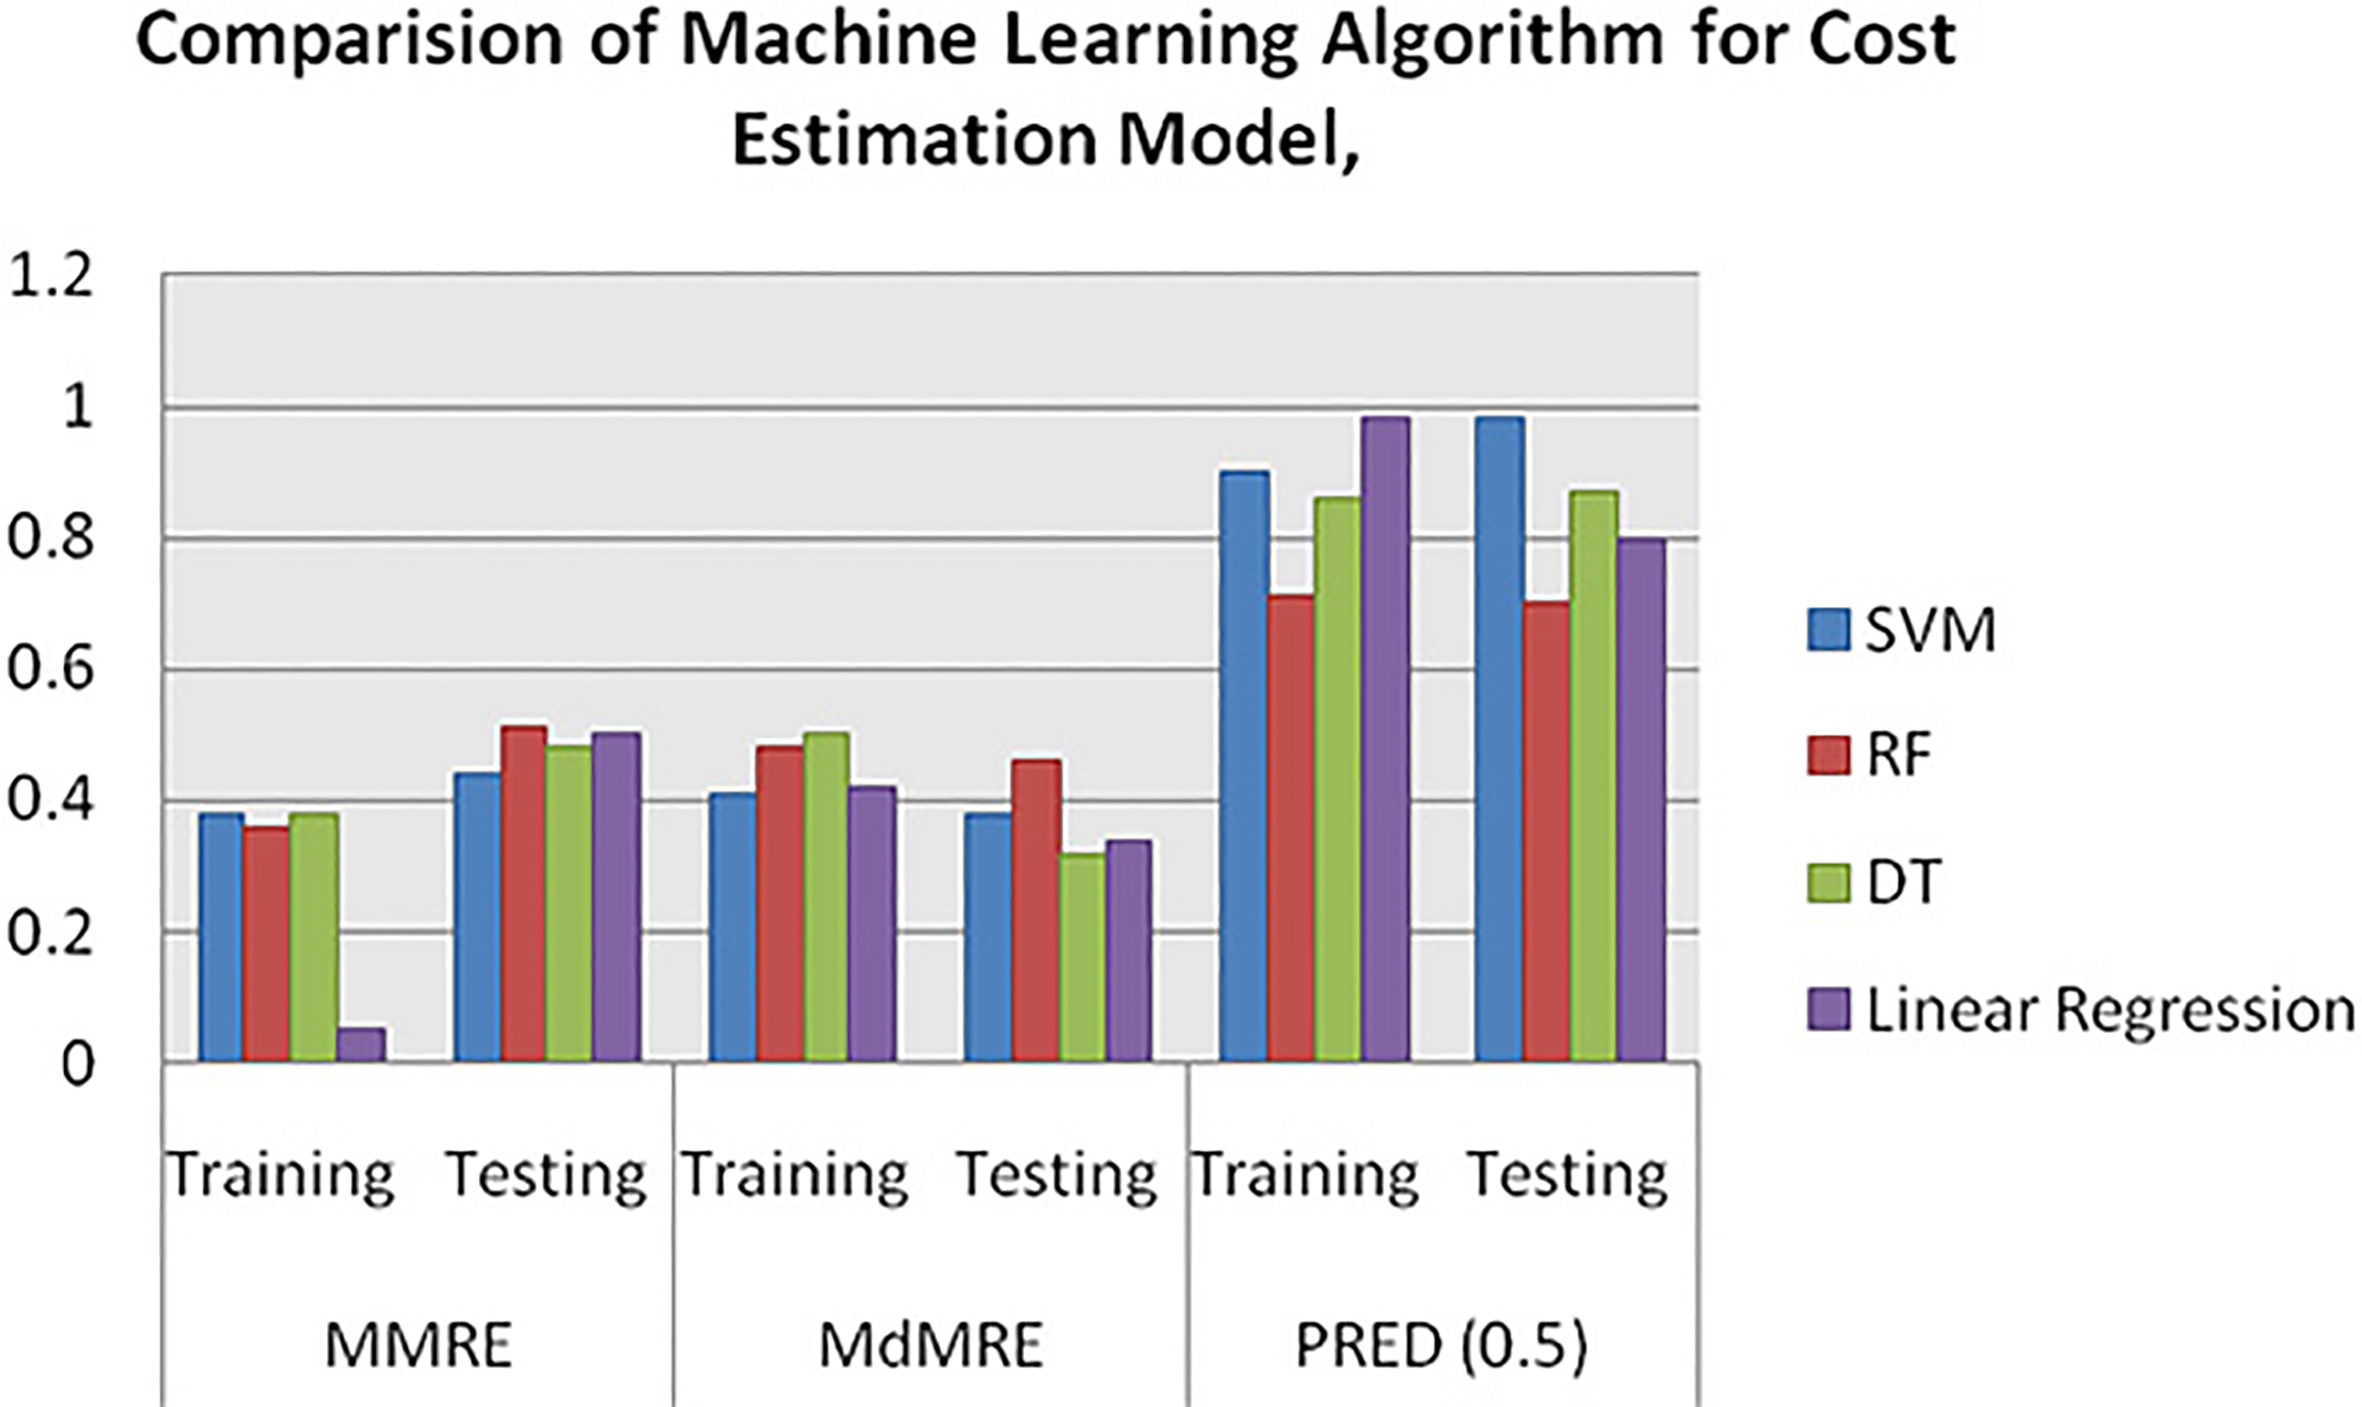
In practice, where there can be 1000s of classes particularly in WoS solutions where there can be more functions or classes working dependently, it becomes infeasible to identify 100% of reusable components (due to higher complexity and inter-module dependency), it can be possible that a few of the correctly predicted faulty class may remain undetected in unit testing. Additionally, there is the possibility that such faulty classes and the defective classes which were predicted as non-reusable classes (number of FN) are identified by the predictor in later phases of testing such as system testing (
In testing, if prediction analysis is avoided then the unit testing of each class becomes a must. Thus the total cost on unit testing turns out to be:
The experimental results suggested that improved results are achieved by combining the KFCM algorithm with the OLSRNN method than the other traditional methods such as KFCM-LSTM, KFCM-SRNN, and KFCM-GRU. In other words, for all the datasets, the KFCM-OLSRNN process provides more PRED (0.25) values, MdMRE, and MMRE values. Also, it is more significant for the selection of the validation technique.
In this article, software reusability prediction and cost estimation model have developed for object-oriented design based Web of Service software systems. The proposed method applies several novelties, such as a web of service software metrics estimation and reusability prediction. The overall results presented in the form of a confusion matrix in Fig. 6. The confusion matrix represents the accuracy of the Decision tree is 92.40%, and F-Measure is 95.45%, which obtained for training, validation, testing phases. Similarly, Random Forest and SVM algorithms are used for software cost estimation and reusability prediction. This research work revealed that is it feasible to derive an efficient and robust Reusability prediction model for Web-service products using OO-CK metrics. Here, it was also found that OO-CK metrics, particularly complexity, cohesion, and coupling related metrics can help predict Reusability in Web-services software products.
In the future, researchers may use deep learning algorithms to detect software reusability metrics prediction and cost estimation. The other researchers may focus early prediction whether the system enters into the aging (fault) or not? In the future, other reusability threshold estimation, feature selection, and evolutionary computing based classification algorithms can be explored to provide a more efficient solution.