
Abstract
The commoditization of voice, saturation of the urban market, fierce competition, and the increased cost of the spectrum have forced the mobile telecom network operators to promote and garner revenue from non-voice services (NVS) namely value-added services (VAS) and data services (DS). It is a fact that monthly revenue from different segments of a mobile telecom service provider is non-linearly related to its previous revenue. Hence, existing linear prediction models such as regression and linear combiner do not exhibit accurate prediction performance. This article proposes one linear adaptive linear combiner (ALC) and three nonlinear (trigonometric expansion based neural network (TENN), multi-layer perceptron (MLP) and radial basis function (RBF)) models for prediction of revenue from voice services (VS), DS and VAS segments. The real-life revenue data of a mobile telecom service provider in a licensing area of India is utilized for this study. The predictor performance has been obtained from the simulation study of the models and analyzed. It is observed that the prediction performance of linear ALC model is the worst. The TENN model outperforms the MLP and RBF models from amongst the proposed nonlinear models based on the available historical data. In essence, the study demonstrates that the overall ranking of the four models based on prediction performance are TENN, RBF, MLP, and ALC.
Keywords
Introduction
The opening up of the Telecom sector by the Government of India has been the most important milestone that has heralded an unprecedented growth of telecom in the last decade. India boasts of as the second largest market after China in terms of connections in the world. The total wireless customer base by the end of June 2017 is 1186.84 million and the overall teledensity in India reached 92.12% (Source:
Even though forecasting revenue is a complex process but is an important and valuable function of any organization for facilitating decision-making. Forecasting revenue is a complex task for a mobile service provider in view of continuous price war by the competitors, changed policies, the introduction of new services and new technology as well as the launch of feature-rich smart devices.
The rest of the paper is organized into seven sections. Section 2 discusses the literature review, research gap, and motivation for current research work. The third and fourth sections outline the methodology adopted and related data collection. The fifth section presents the development of one linear and three nonlinear adaptive models for prediction of revenue from VAS, data and voice services. This section also deals with the training and testing schemes used in the development of prediction models. Section 6 deals with the analysis and interpretation of results. The strategic implications of different forecasting models are outlined in Section 7. The last section provides a conclusion and scope for future research work.
Literature review
This section makes a comprehensive review of relevant literature on recent methods of prediction of various time series data using artificial neural networks (ANN) as well as other nonlinear prediction models.
ANN is the computational model based on the neural network of human beings that comprises of a group of interconnected neurons (nerve cells) to carry out the desired function. The ANN models can solve nonlinear and ill-defined problems with greater accuracy compared to the traditional computational models. ANN-based models have found the interest of researchers for the last two decades in solving problems in the domain of finance, management, and business. Starting with the basic multilayer feed forward network, different hybrid networks are developed to enhance the performance of traditional models. Tkac and Verner [20] carried out the review of research in ANN applications from 1994 to 2015 covering a total of 412 articles, indicating the active interest of researchers in applying this methodology in various areas of study.
Short and long-range forecasting of time series data find extensive applications in many fields such as finance (stock index, exchange rate, interest rate, net asset value etc.) [15], electrical load [34], consumer behaviour, customer churn, satisfaction and loyalty [20, 29], domestic debt [3], rainfall [5] etc.
It is observed that for the short term forecasting of electric load the authors [29] have employed a spiking neural network model and have demonstrated improved performance compared to other competing using ANN models. In the work reported by Majhi et al. [23], the authors have used adaptive bacterial foraging optimisation (ABFO) and BFO techniques for predicting stock market indices. They have shown that the ABFO based adaptive linear combiner models provides the best performance and also offers lower computational complexity compared to genetic algorithm (GA) and particle swarm optimisation (PSO) based prediction models. In another reported article [3] an adaptive neuro-fuzzy forecasting model is developed for domestic debt and it is demonstrated that this model has a strong estimation capacity.
In most cases, the future data is related to the past values in a nonlinear manner and hence conventional linear statistical methods such as regression provide poor prediction performance. Different linear and nonlinear prediction models have been proposed in the literature for various applications. In recent past adaptive nonlinear structures such as multilayer perceptron (MLP), neuro-fuzzy network, and radial basis function (RBF) network are employed and the internal weights of the models have been updated [40] using mostly derivative based gradient descent training schemes such as the least mean square (LMS) and backpropagation (BP) algorithms [21].
In 2009, the authors have used [6] a hybrid multilayer perceptron (MLP) network model for prediction of customer churn and have demonstrated that the hybrid (MLP
In another communication [26] the fuzzy logic has been introduced to predict exchange rates It has been demonstrated that this new model improves the forecasting of exchange rate movements. The unique feature of this paper is that it combines both fundamental analysis and fuzzy logic. An adaptive neuro-fuzzy model has been suggested [3] for forecasting the domestic debt. It is shown that this new approach possesses better estimation capability compared to that of other standard methods. An interesting paper on exchange rate forecasting has been proposed using an adaptive autoregressive moving average (ARMA) model with its weights being trained by a differential evolution based algorithm. The authors [23] have proposed a model using functional link artificial neural network (FLANN), for prediction of customer satisfaction and loyalty in mobile phone sector of India and have reported that the new model provides satisfactory prediction performance. A particle swarm optimization (PSO) based integrated functional link neuro-fuzzy logic system [26]has been shown to offer better prediction performance of stock market indices. In addition, the authors have employed a local linear wavelet network for prediction and comparison purpose. The proposed model is shown to provide improved prediction of the stock market. Ano- ther hybrid approach using evolutionary Levenberg-Marquardt neural networks and data pre-processing has led to an improvement in prediction accuracy (Shahrokh et al., 2012) of the stock market. The results show that the suggested approach can also cope with the fluctuations of the stock market values. A new forecast model using spiking neural networks has been developed [29] for load forecasting in the short-term in power system operation and planning environment. Lin et al. [12] have used the least squares support vector regression model in a fuzzy environment for deve- loping a revenue-forecasting model. It is reported that the proposed model outperforms four different models in terms of forecasting accuracy. Thus it is a useful alternative for predicting seasonal time series. Ghiassi et al. [15] have proposed a model for forecasting of movie revenue of major motion pictures in the USA during the pre-production period using a dynamic artificial neural network.
It is mentioned that the new forecasting model improves the forecasting accuracy by 32.8% over existing models. Further, by the addition of the production budget, advertising expenditure, seasonality, and runtime as variables the prediction accuracy is enhanced to 94.1%. Zhang et al. [14] has suggested a model using multilayer BP neural network (MLBP) to forecast box-office revenue before its release. The authors have chosen input variables based on the market survey and the associated weights are obtained by using the statistical method. In the field of revenue management, the demand forecast of a product plays a key role. A mixed integer nonlinear Programme (MINLP) has been proposed [27] for demand forecasting in revenue management. This approach relies on daily registered bookings and product availabilities.
A number of publications have been reported in the literature using the ANN as a forecasting method for prediction of stock prices with appreciable accuracy. Using ANN, Dutta et al. [7] have forecasted the stock market in India and Zhu et al. [36] have predicted the STI, DJIA, and NASDAQ indices. Shachmurove and Witkowska (2001) observed that the ANN is a better predictor tool compared to an ordinary least square model. The ANN and its variant based forecasting models for prediction of various financial and other time series data have been reported by Desai and Bharati [35], Kim and Shin [8], Zhu et al. [36], Yu and Wang [13], Kara et al. [39], Chen and Kao [30], Bisoi and Dash [24], and Patel et al. [11].
Research gap
Literature review reveals that many adaptive structures and learning algorithms have been employed for forecasting of various time series data. Out of these ALC, TENN, RBF and MLP find extensive applications for forecasting purposes. It is seen that MLP has been used for forecasting of the swell potential of clay soils [9], short-term price prediction [37]. Similarly, TENN based method is used to predict exchange rates [32], stock price prediction (Patra et al., 2009). The RBF finds applications to predict breast cancer [10] and noisy time series [5]. The ALC is a simple adaptive model and is used to track power system harmonics (Dash et al., 1996), forecasting electric load [34]. ANN based models have been developed for prediction of revenue (Lin et al., 2013), pre-production movie revenue [15], Box office revenues [14], forecasting aggregate retail sale (Aye et al., 2015).
The revenue is a non-linear time series data. The conventional statistical methods are mostly linear and hence cannot provide satisfactory prediction performance. Hence there is a need for developing non-linear prediction models for different time series data. It is further observed that the ANN & Fuzzy logic based prediction models reported in the literature are meant for other non-linear time series such as exchange rate, electric load, stock market etc. No standard reported materials are currently available for predicting different segments of revenue of a telecom service provider. Thus further studies are necessary to develop non-linear adaptive models using intelligent techniques for better prediction of telecom revenue.
Motivation for research and research objectives
From the literature review and the associated research gap as discussed above, we are motivated to carry out an investigation on the development and performance evaluation of ANN based adaptive prediction models for the short and medium term. The three segments of the revenue of a telecom service provider are proposed to be predicted.
From the motivation the following research objectives are formulated
To develop different ANN based forecasting models for revenue from VAS, DS and VS of telecom revenue. To train and validate the developed models by using real data from a telecom service provider. To assess and compare the prediction performance of various prediction models and to provide a ranking of these models.
The steps involved in the current research on reve- nue prediction are detailed in Fig. 1. In the first step revenue data for three different segments of mobile revenue of a specific Indian mobile operator is obtained and normalized. The normalized data is used to extract features of each month. Then using 80% of the features one linear and three nonlinear adaptive models are trained using standard learning algorithms. After completion of training of these models, the last weights attained by each model are frozen and the resulting models are used for validation by the help of remaining 20% features. Using the prediction results of each test pattern the mean percentage of error is computed for one to four months’ cases of all the four models. Finally, the results are interpreted and the prediction performances of all models are ranked and a conclusion is drawn and the future research problems in the area are outlined.
Steps involved in the proposed research.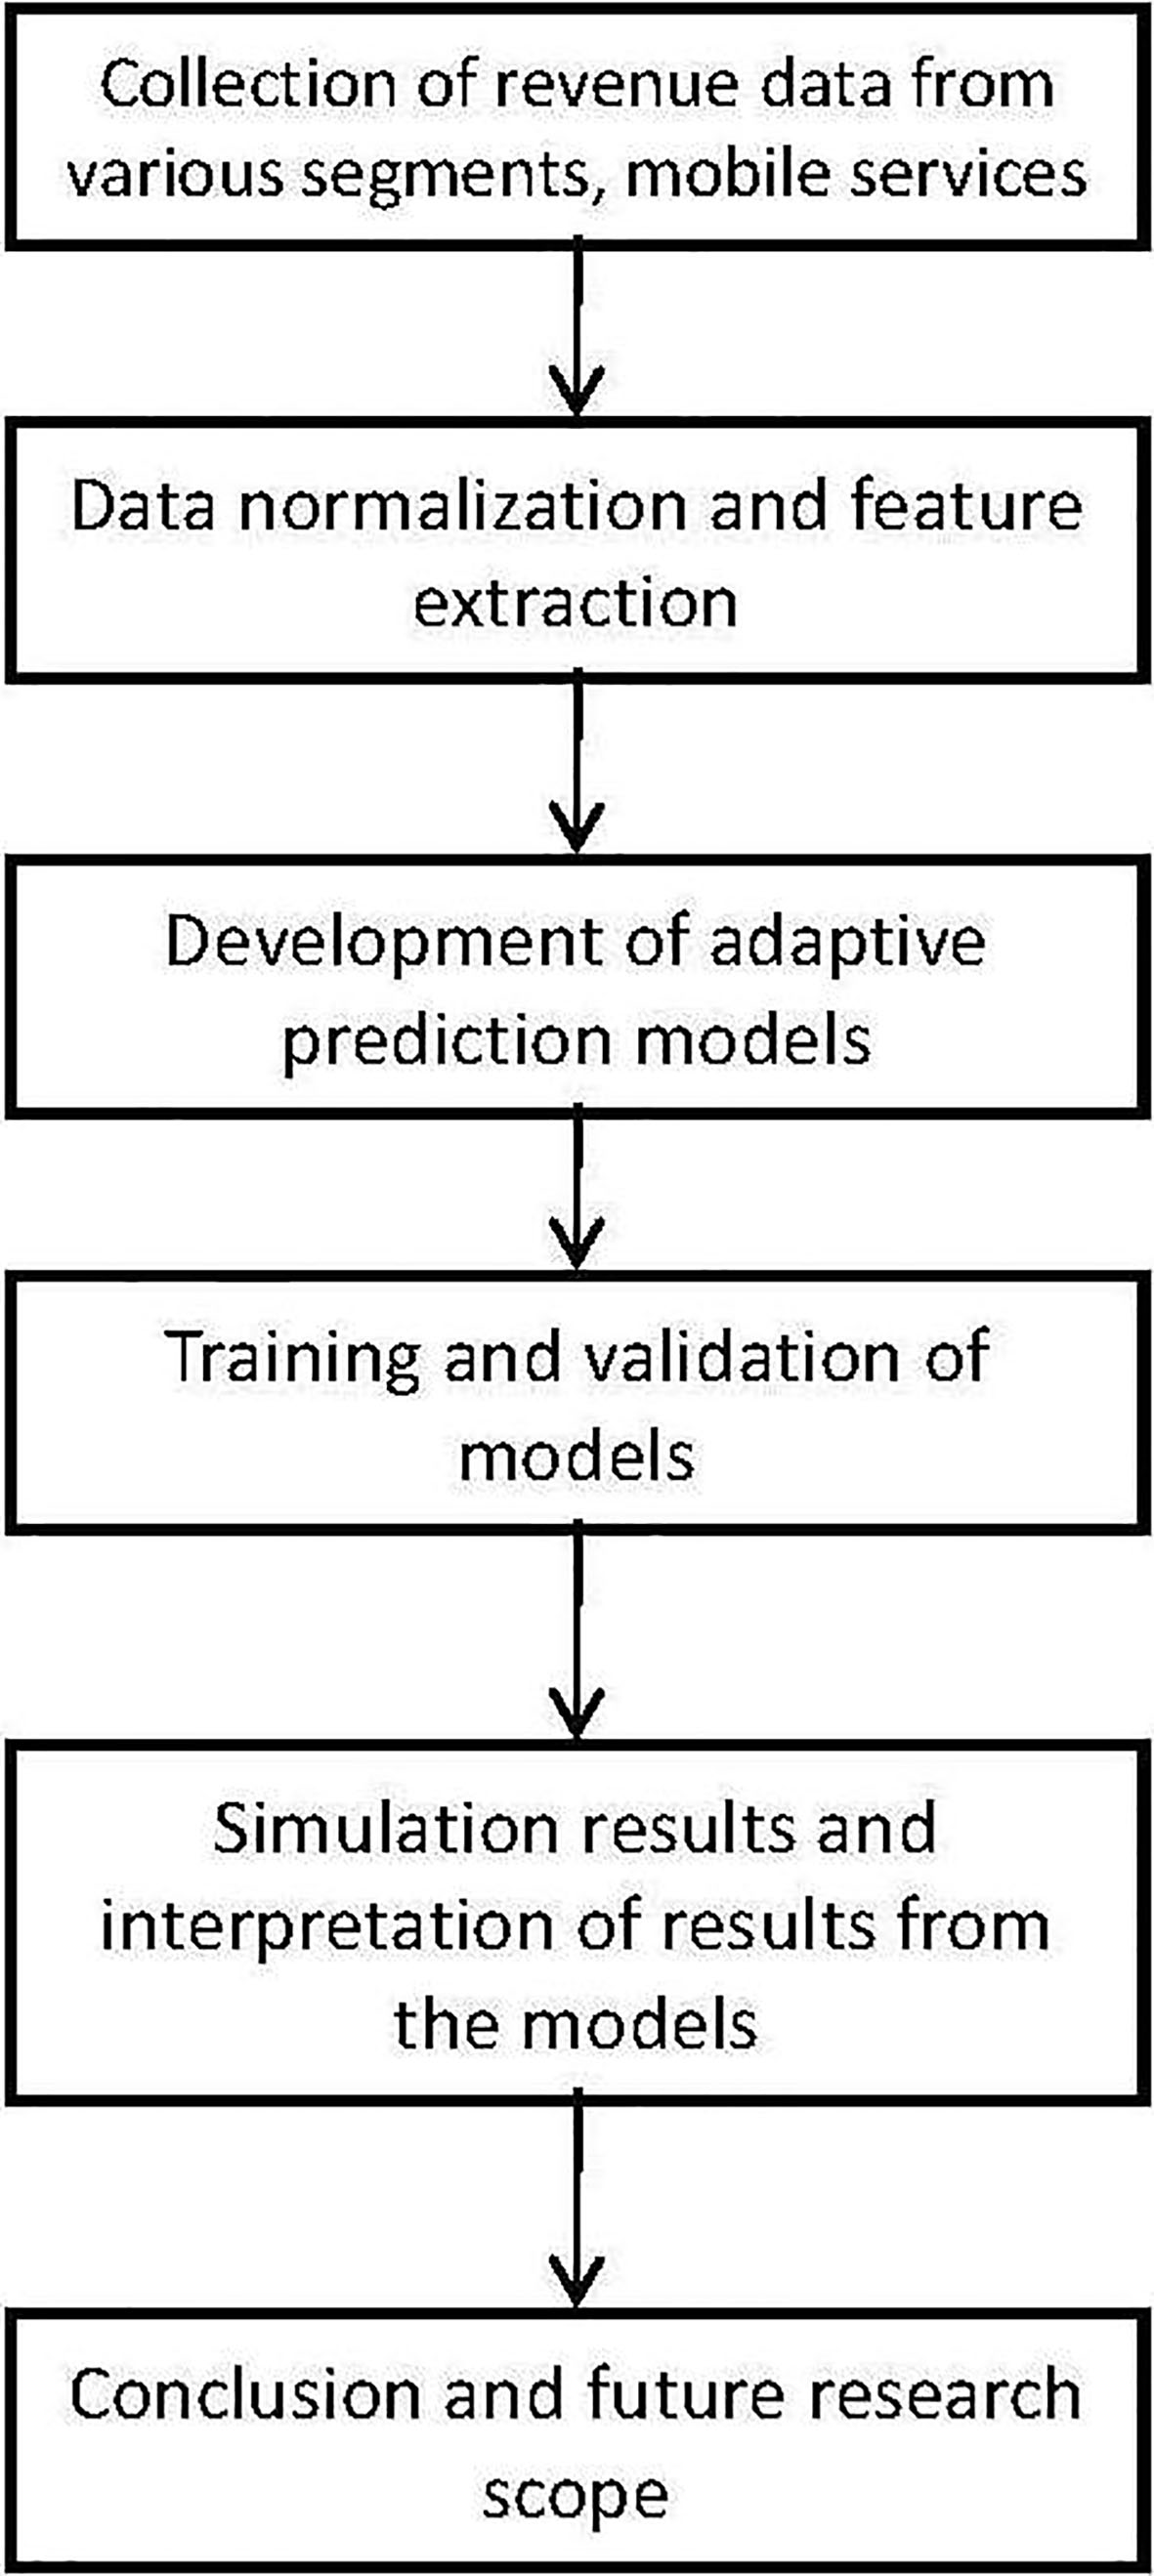
In this section, the data collection, as well as the feature extraction from the datasets is dealt. The monthly revenue information for data services (DS), value-added services (VAS) and voice services (VS) of a major licensed Indian mobile service provider is collected for 36 months (as provided by the operator). Each reve- nue value is first normalized to lie between zero to one as the artificial neural network based prediction models developed in this paper requires the magnitude of the data within that range. In the proposed method, the statistical features of the revenue data instead of raw data are used as the input to the models as more accurate and faster training is achievable in the latter case. In the present case, the features considered for each month are the current value, mean and variance values computed using the data available within a sliding window of six samples. In any time series prediction, if raw data is used the accuracy of prediction becomes poor because information relating to inter-relation between the data is not available to the prediction model. Therefore, the mean and variance which are called statistical features and related to the inter-relation between the data, are extracted from the data set and used as input to the prediction model. This is expected to increase prediction accuracy. Therefore statistical features are employed in the prediction models.
Number revenue data of various services used for training and testing the performance of different adaptive models
Number revenue data of various services used for training and testing the performance of different adaptive models
Details of different adaptive prediction models
A generalized adaptive revenue predictor.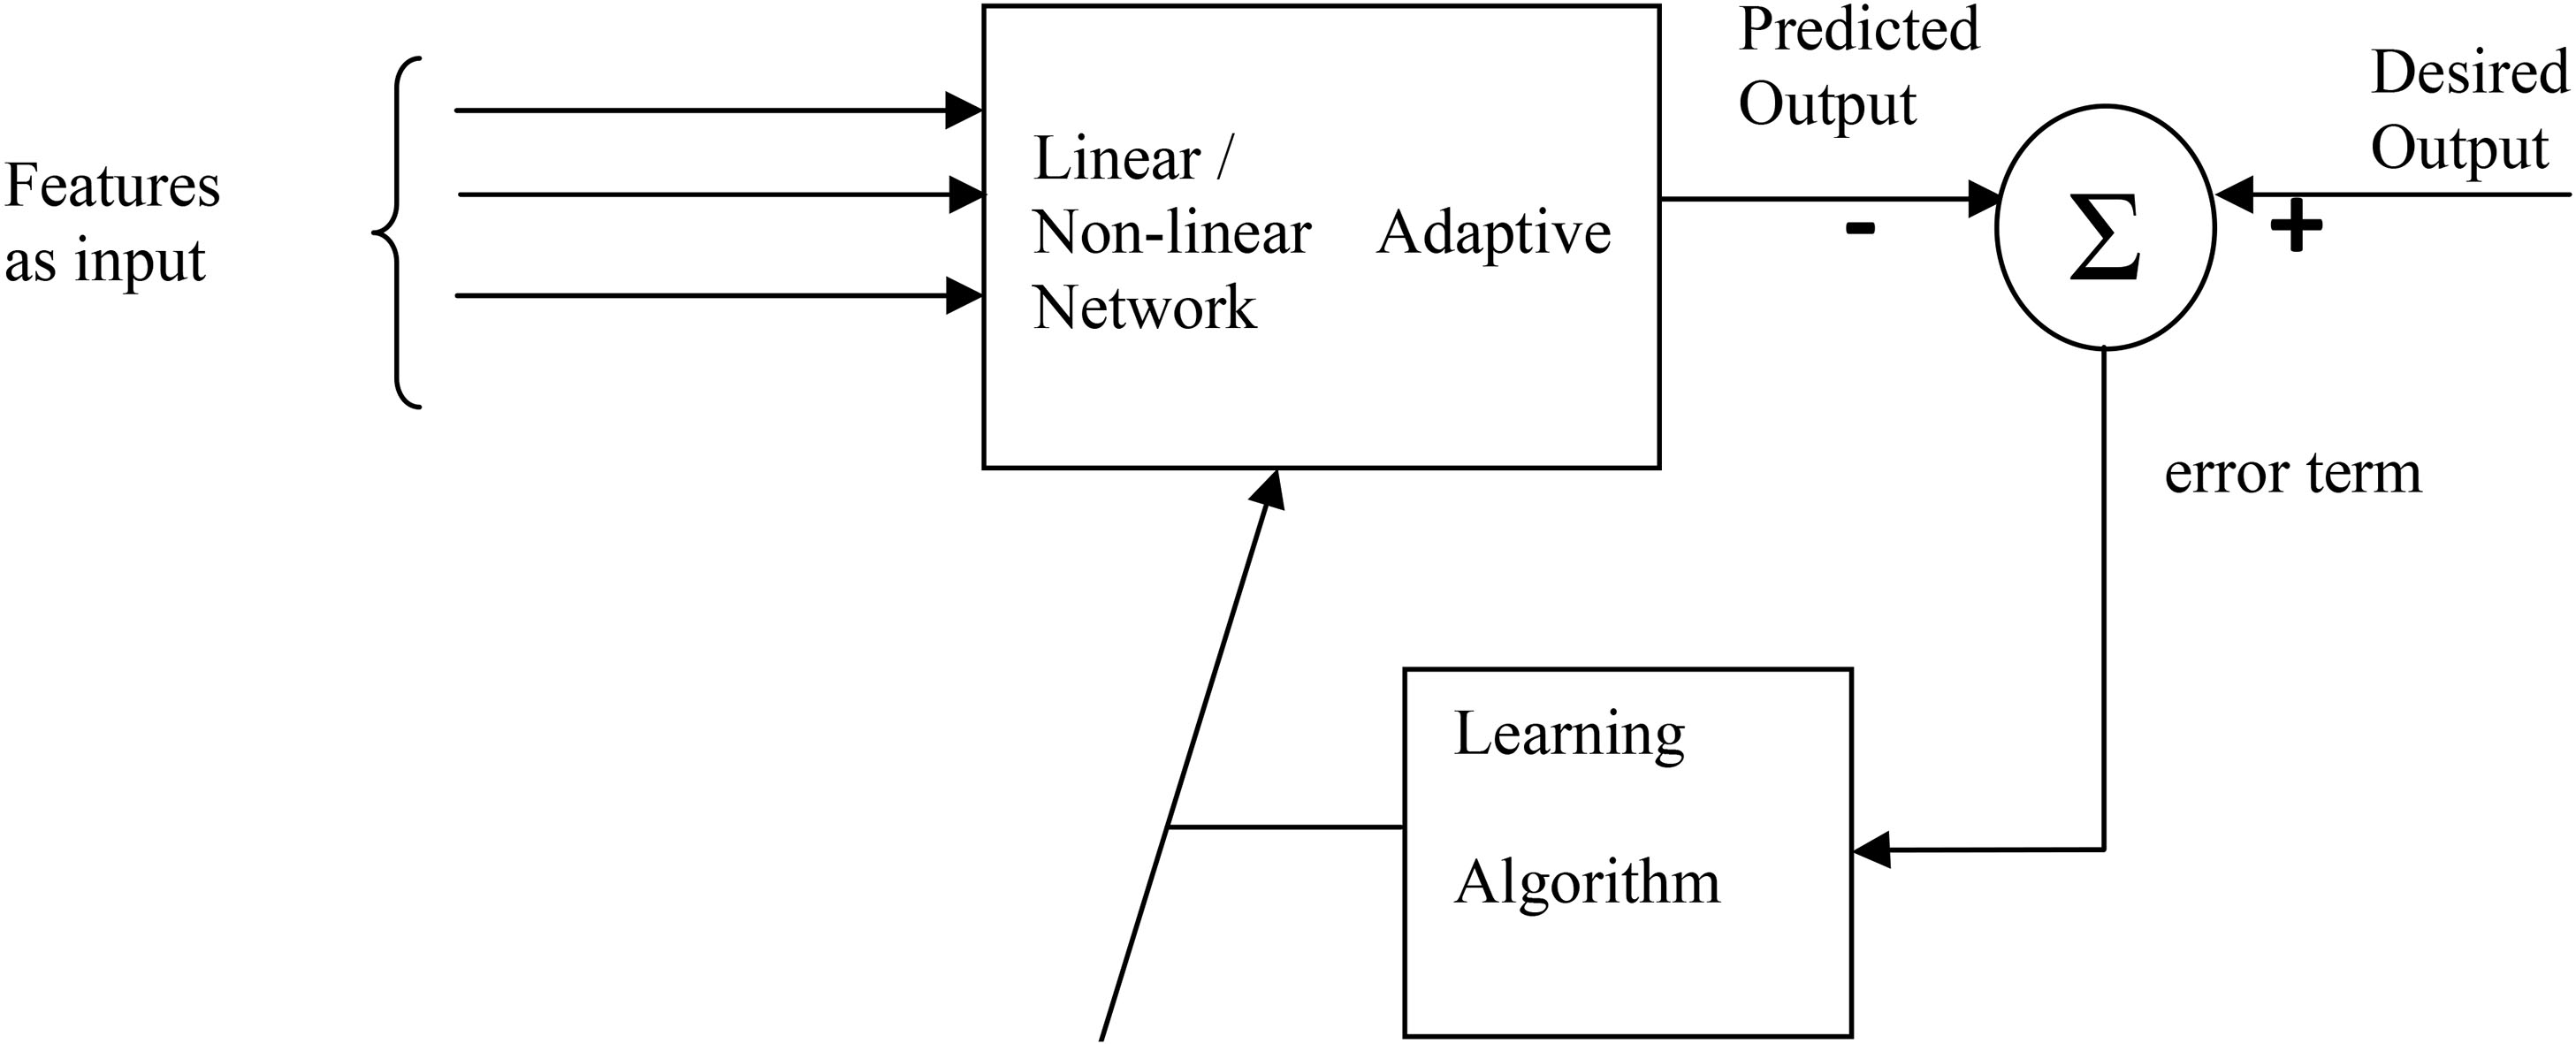
Three feature tables consisting of 31 patterns are prepared for training and testing of the proposed four prediction models. Each pattern of feature consists of actual normalized revenue value, mean and variance computed over a running window of size six. Table 1 depicts the details of data collection and features used in the investigation.
In this section four adaptive revenue prediction models are developed which can predict separately the revenue due to data service (DS), value-added service (VAS) and voice service (VS) of a mobile service provider.
Out of various existing adaptive models the adaptive linear combiner (ALC) with least mean square training scheme, trigonometric expansion based nonlinear network (TENN) with LMS training scheme, multilayer perceptron (MLP) with back propagation (BP) training scheme and radial basis function (RBF) network with least mean square training scheme have been chosen based on their popularity and consistent performance in other applications. In order to choose the appropriate structure of different models used in the paper, performance is the sole criteria. If the number of hidden units in the structure is less, the performance becomes poor. However, if the number of hidden units is increased, the complexity increases but the performance does not increase. Based on the above reasoning, the optimum neural structure is decided.
Generalized model for revenue prediction
In this section, the schematic diagram and the deve- lopment of a generalized adaptive prediction model are proposed in Fig. 2.
Adaptive linear combiner (ALC) based revenue prediction model.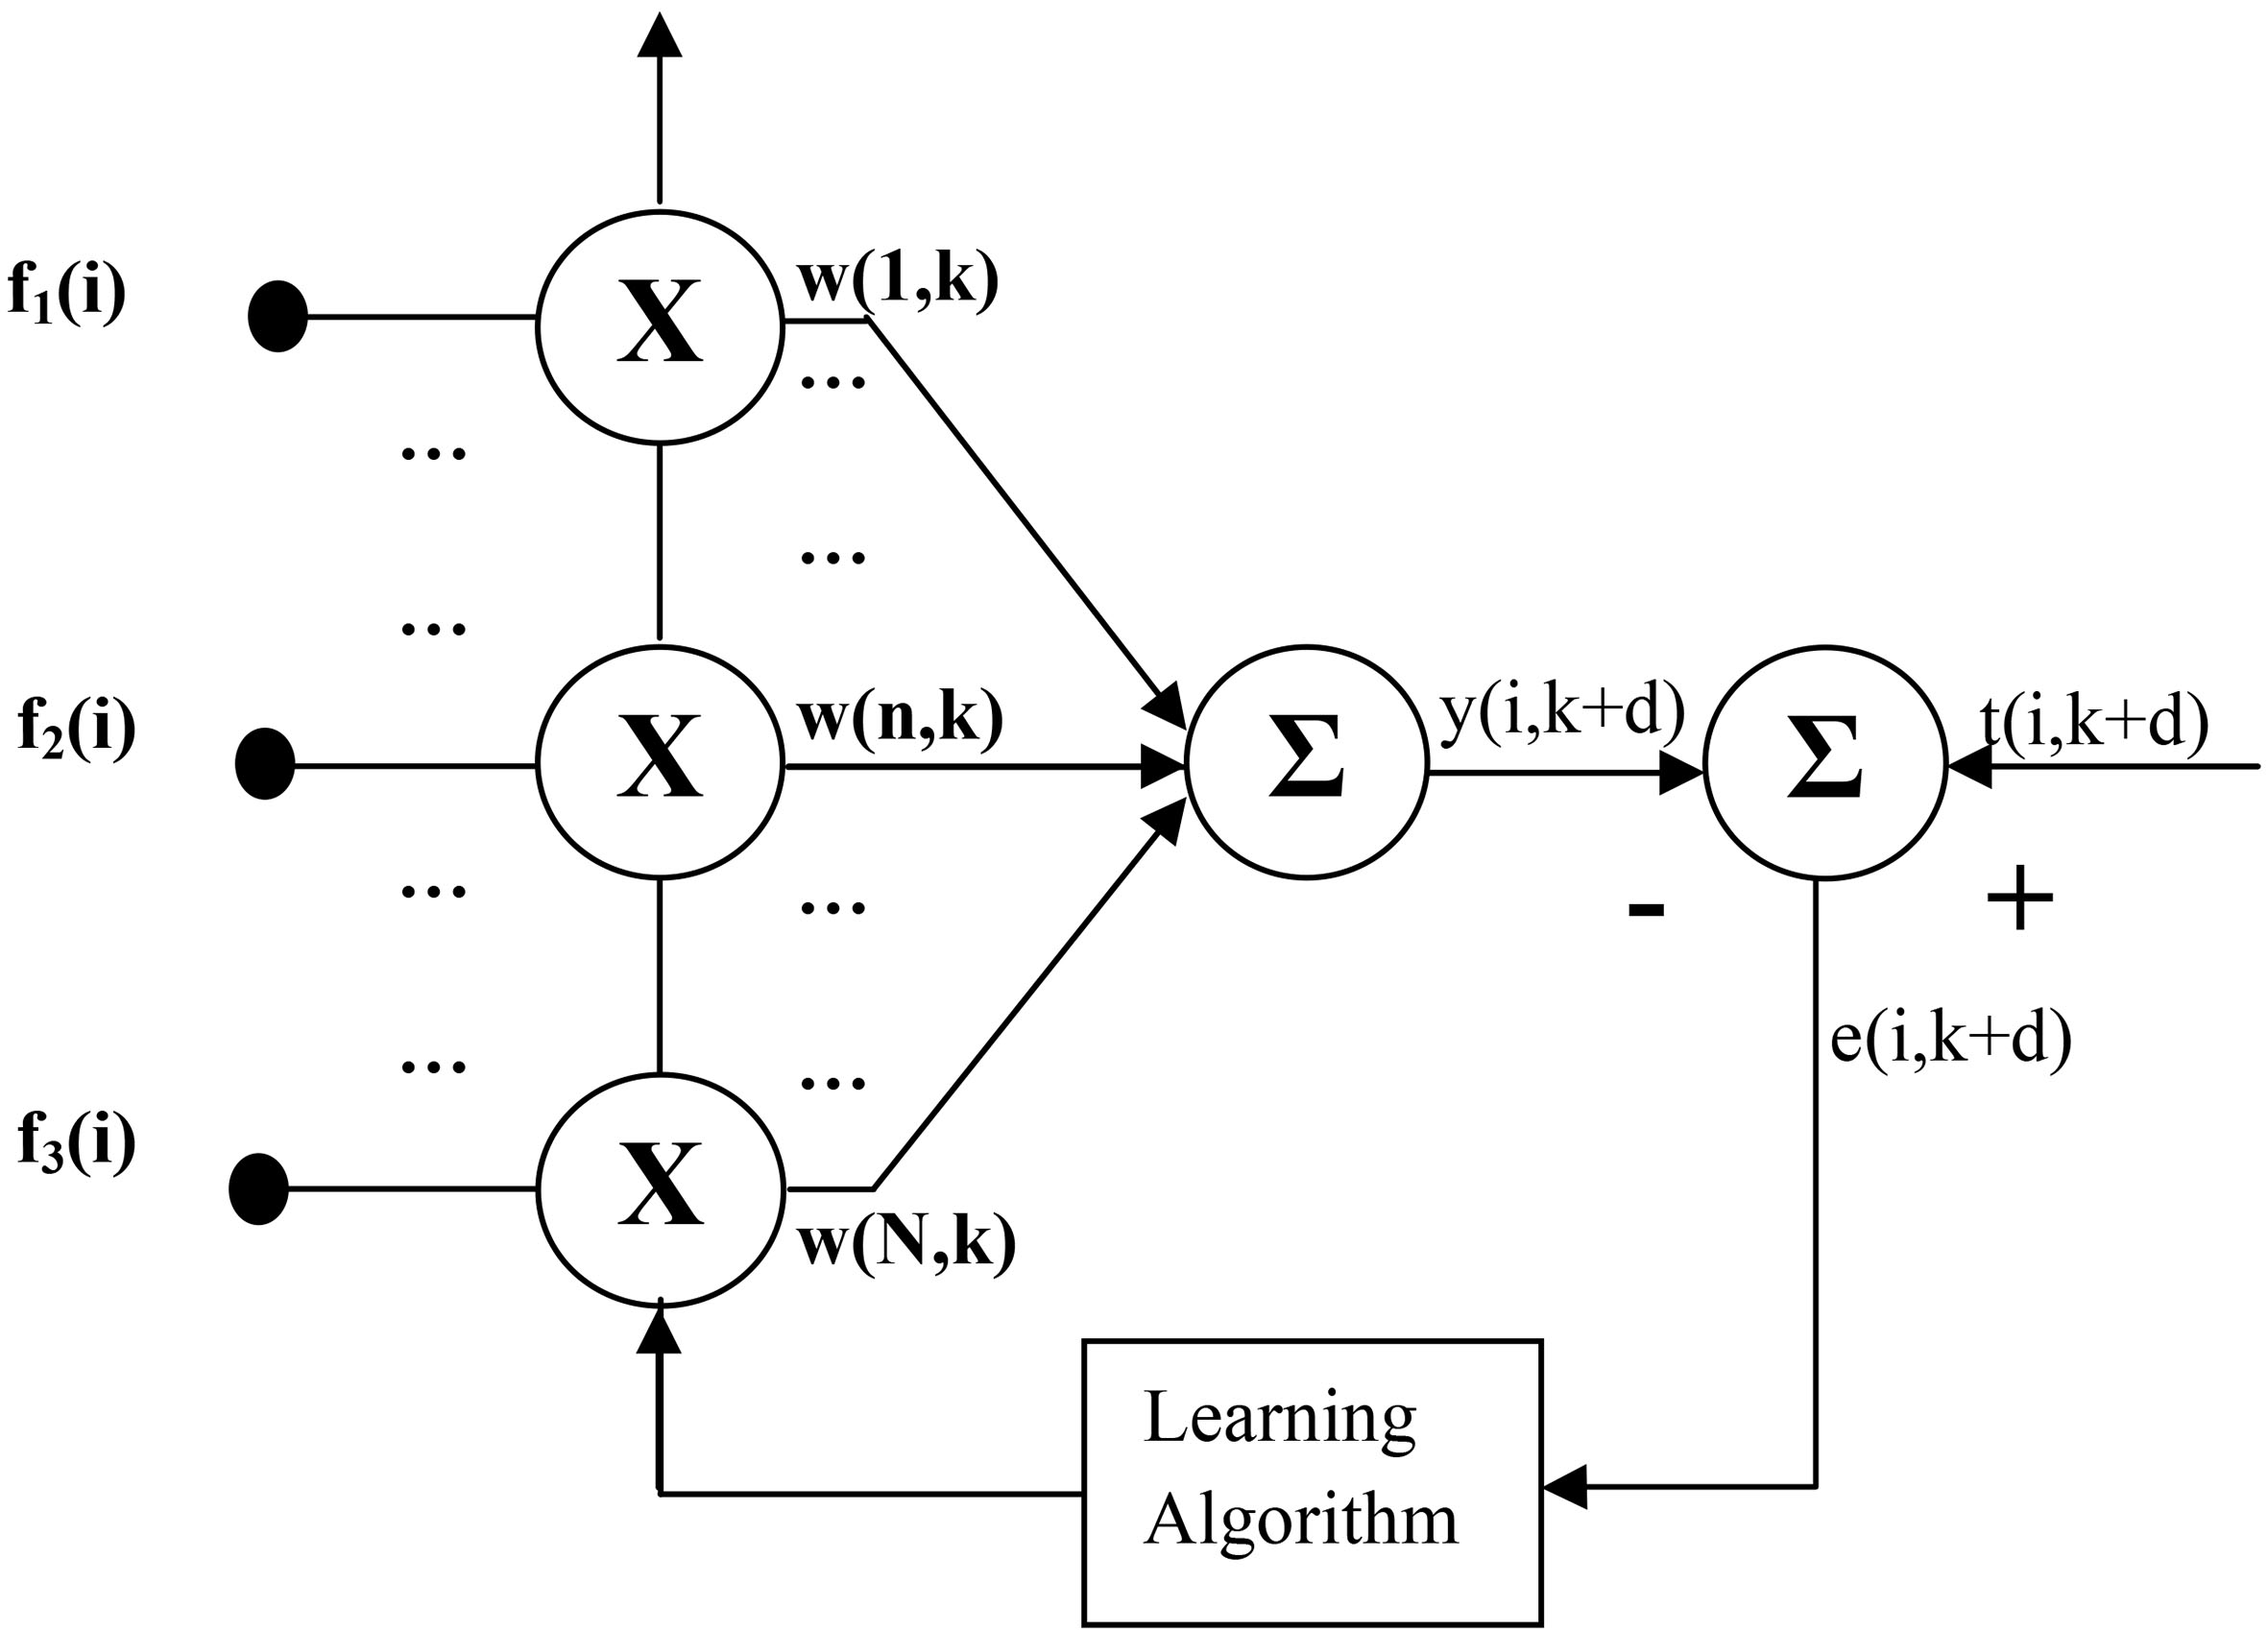
From past revenues information using a running window of six samples, three statistical features are extracted for each month. These features of each day are used as input to the model and from the past revenue information and the desired value is chosen for comparison and to produce the error term.
The weight of each path of the revenue predictor is adjusted based on the weight update algorithm of the corresponding model. The training of the model is completed when the mean square error of the model attains the least possible value. At this stage, the model is ready for predicting the feature revenue. The detailed procedure of developing all the four types of adaptive models mentioned beforehand is outlined in this section.
Trigonometric expansion based nonlinear revenue prediction model.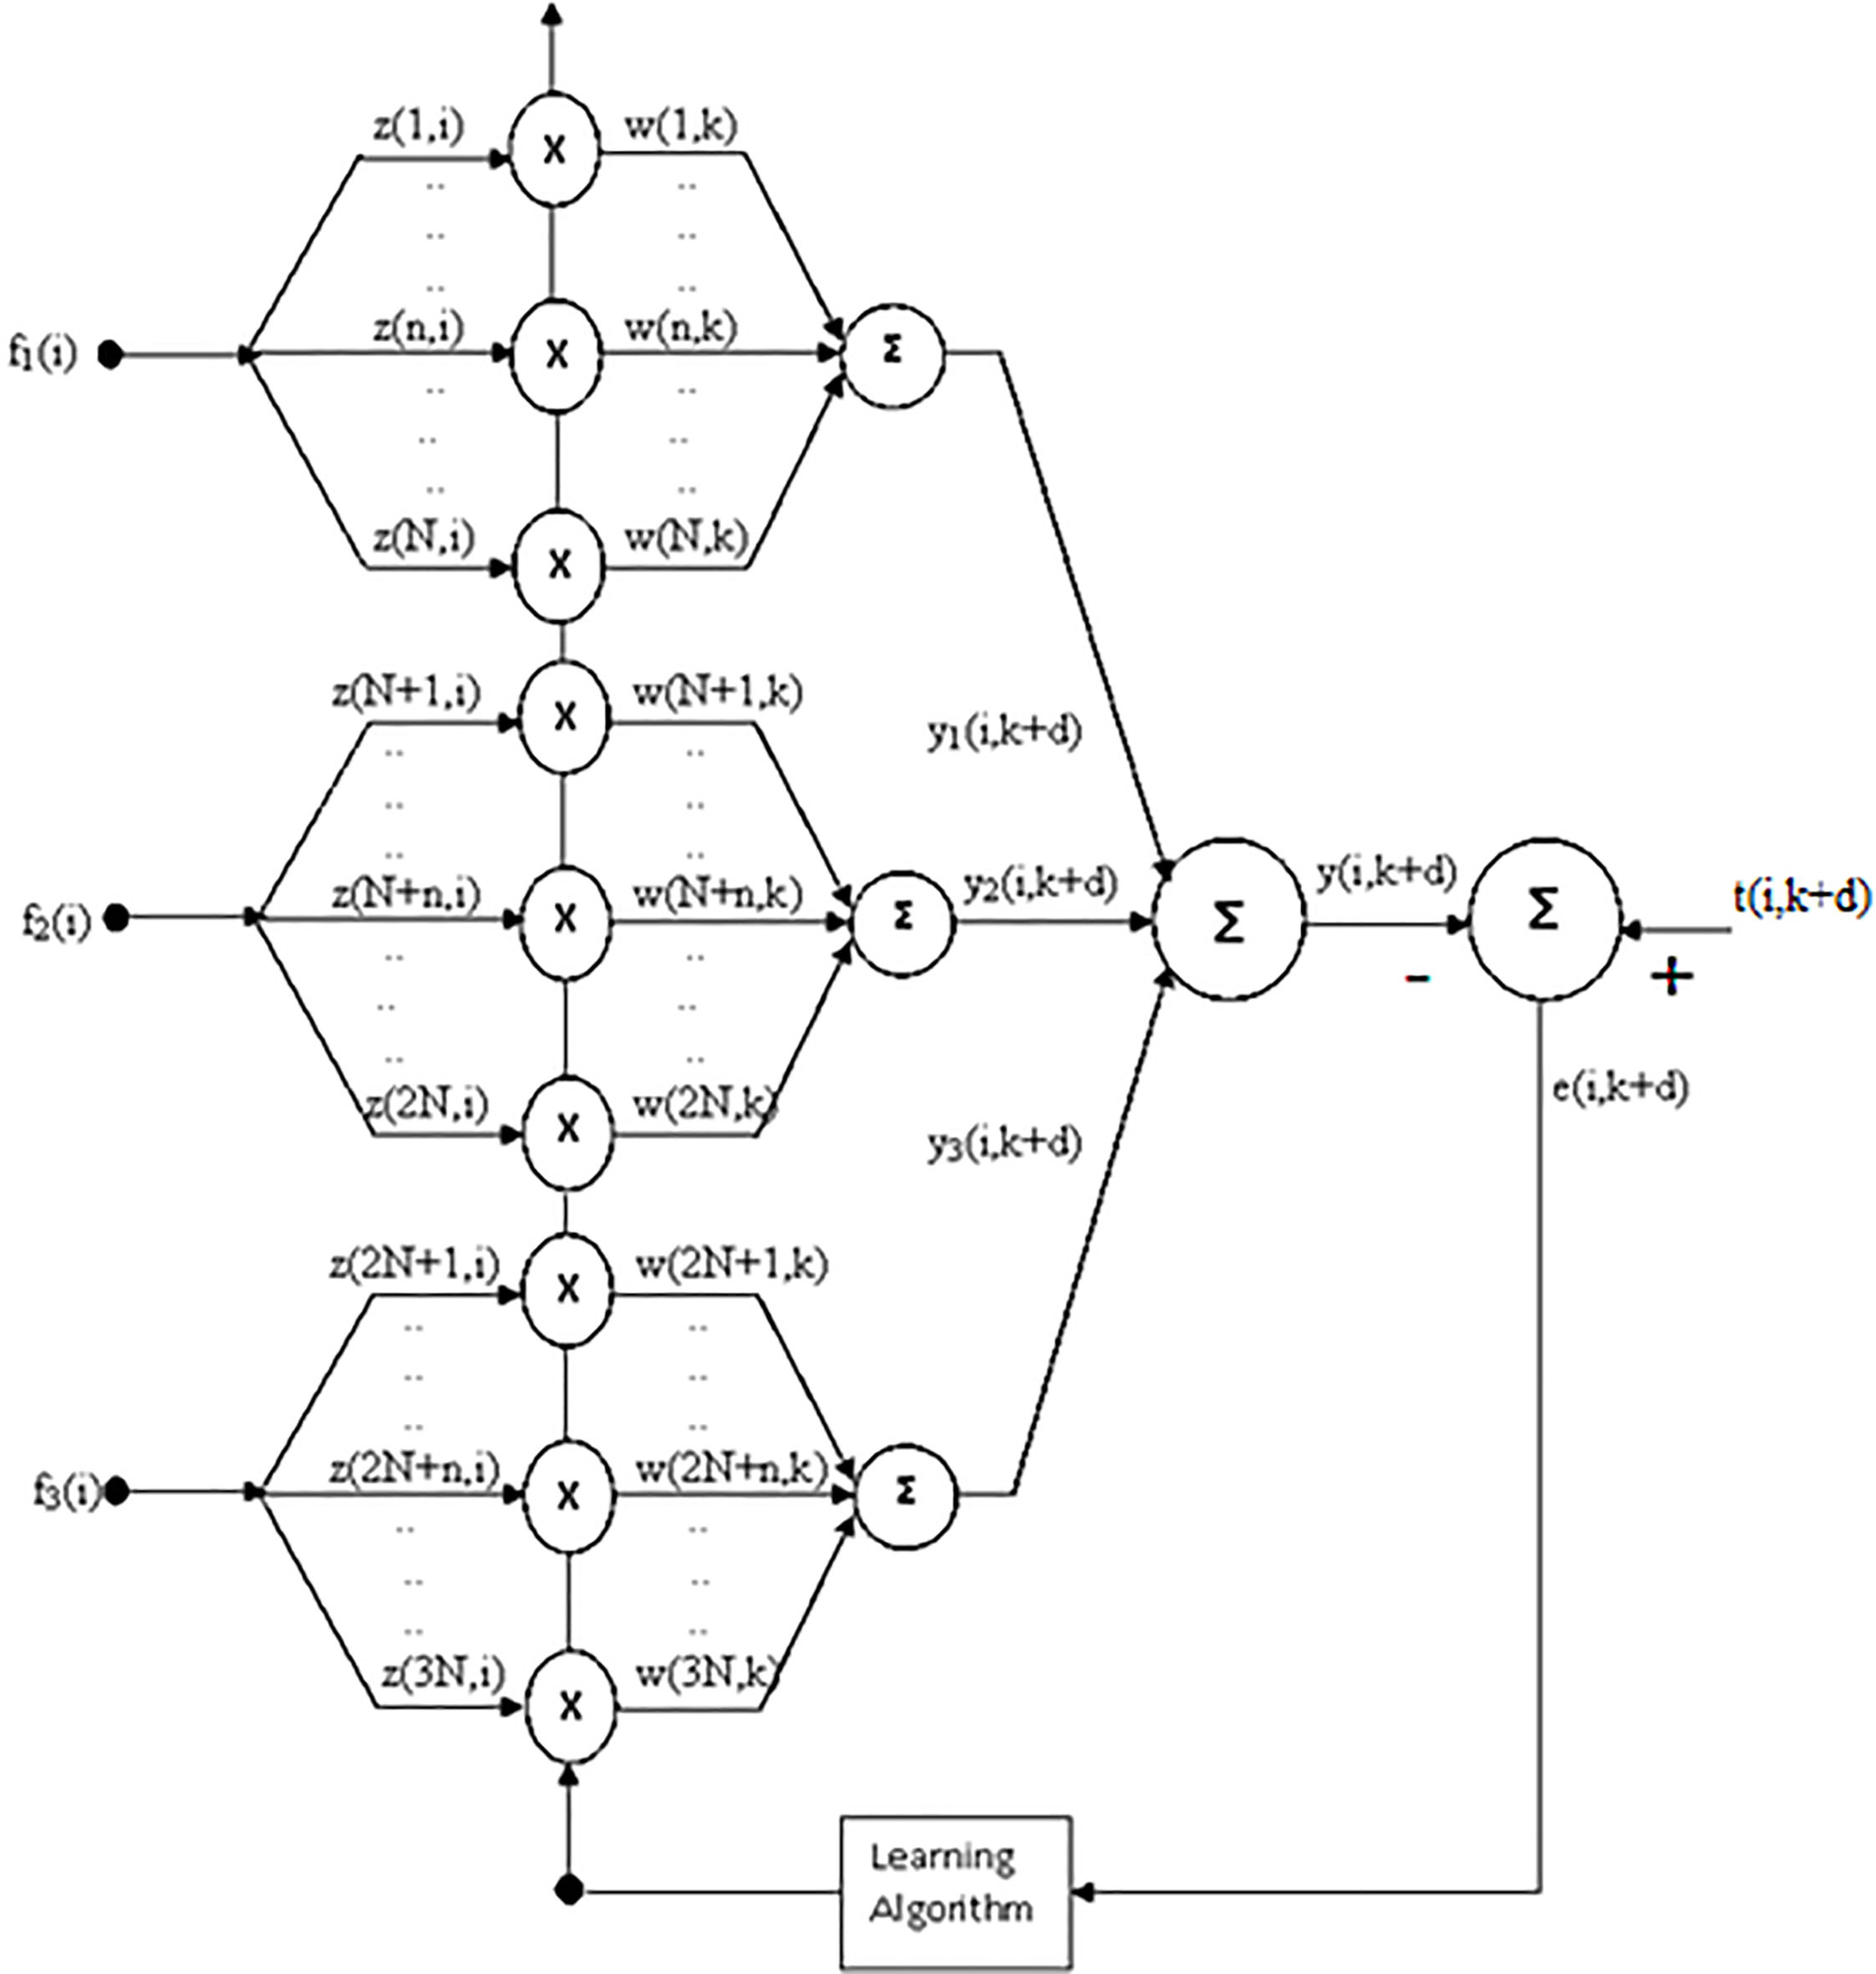
MLP based revenue non linear prediction model.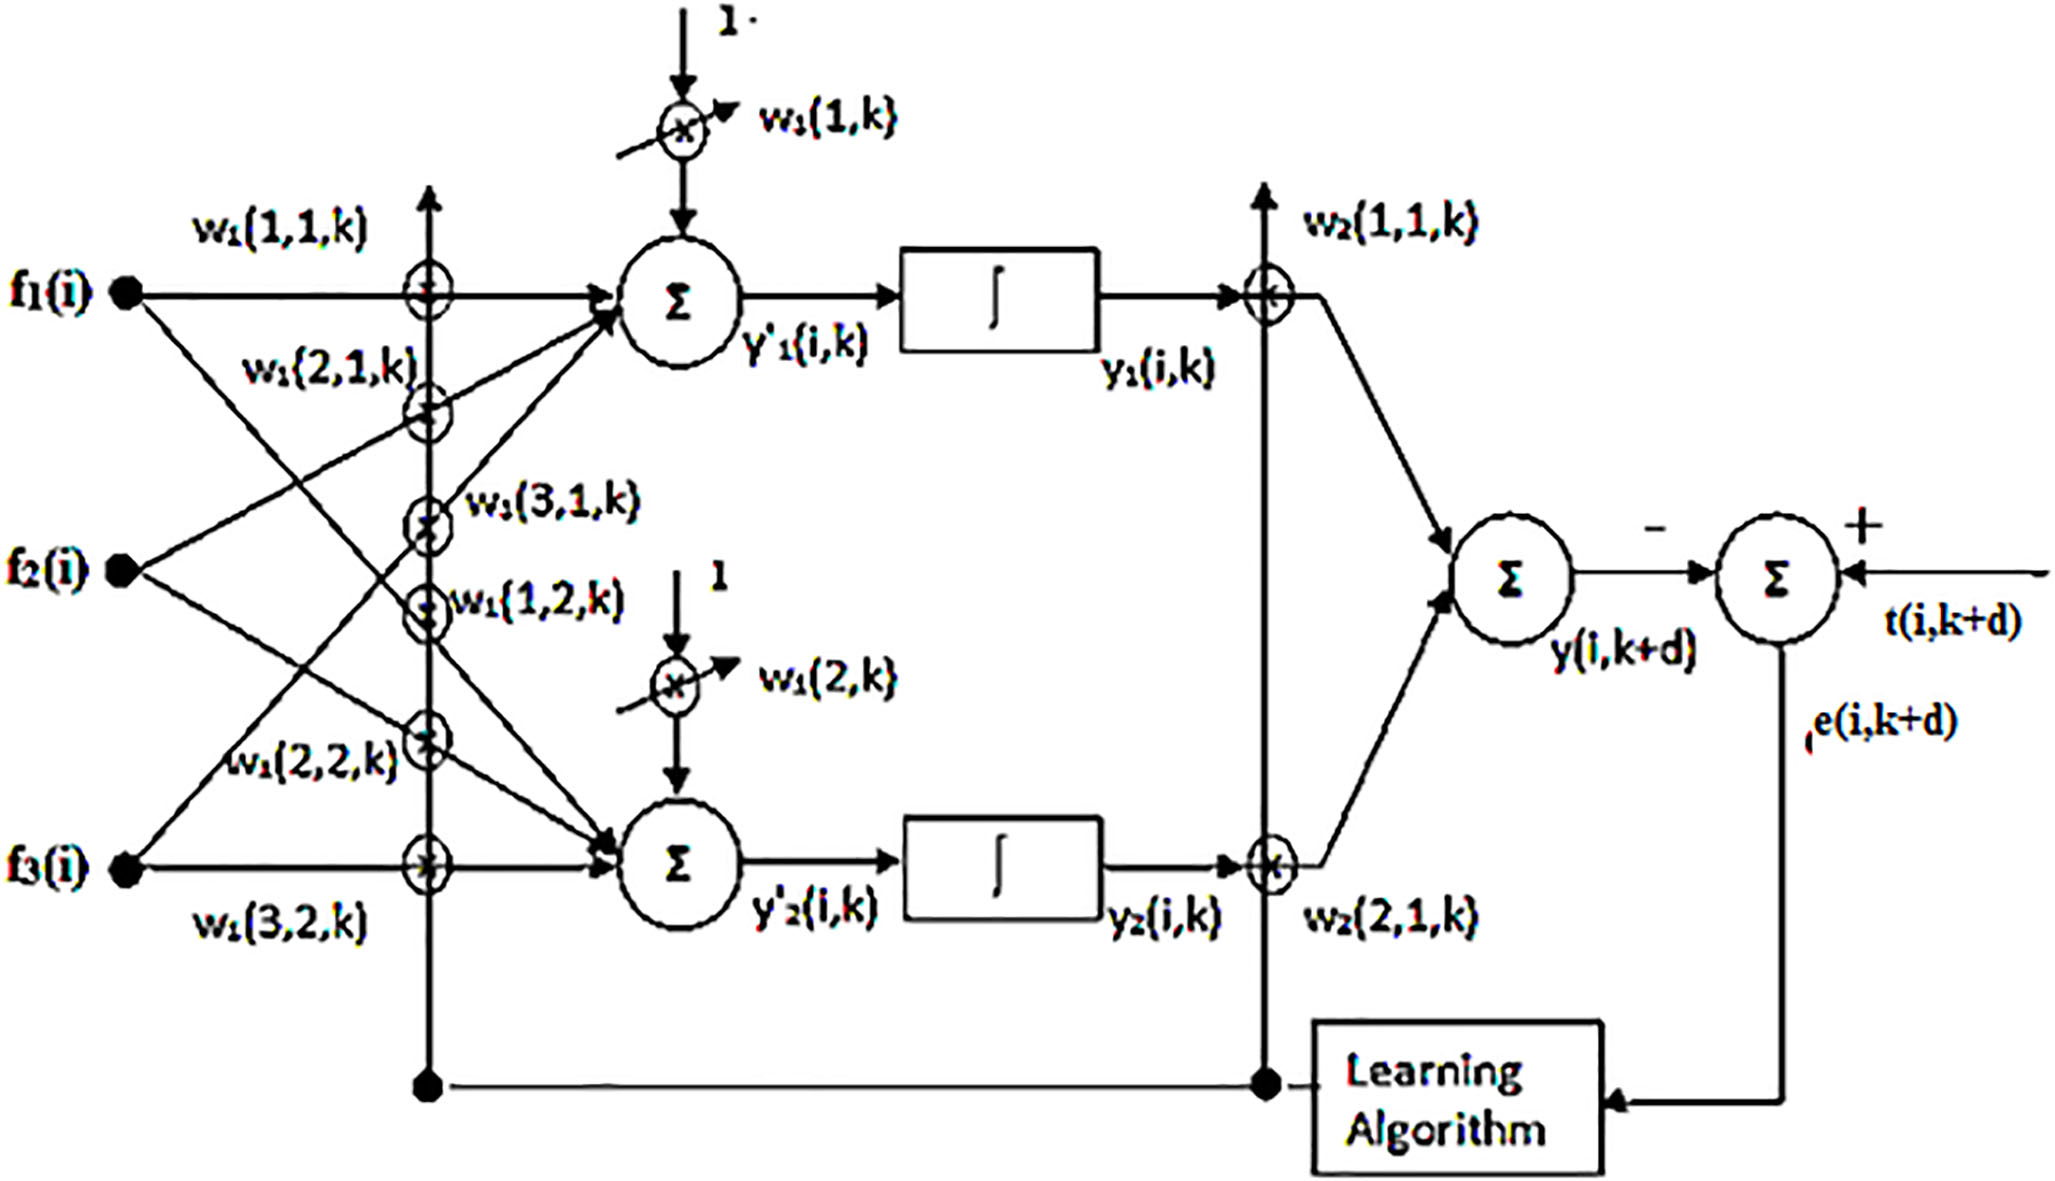
RBF based revenue prediction model.
In the four adaptive models (Figs 3 to 6) the following common symbols and variables have been used.
Figure 3 shows a simple ALC predictor with three input features and one output node to provide the forecasted revenue. During training phase one input pattern is applied and corresponding modified output is compared with the actual output which is the revenue earning after
The equation used for computing the output of the model is given in Eq. (1).
During training the error term is given as
Using error terms and input feature values the average change in weight is computed as
where
The updated weight at
One experiment of training gets completed after 80% of the input patterns are applied sequentially and weights are updated once after completion of each experiment. The mean square error after each experiment is computed as
As the training proceeds the weights of the models attain steady state value and do not change further. It is observed that, when the value of
The TENN is a low complexity nonlinear adaptive model and has been used for many nonlinear tasks. Since the prediction of revenue is a nonlinear task, in this paper, the TENN adaptive model is chosen for this purpose. The TENN model offers low complexity, exhibits nonlinear relation between input and output and offers equivalent and sometimes superior performance as compared to the MLP model. Figure 4 shows a TENN model as a nonlinear predictor.
Referring to the model in Fig. 4, the output of each expansion block is given by:
For each feature five expansions are used in this model. The first one is the actual value, the second one is the Sin of actual value and the third one is the cosine of actual value. The fourth and fifth are sin3 (actual value) and cos3 (actual value). The expansion process is carried out similarly for the other two features namely mean and variance input. The trigonometric expansion transforms normal inputs to its non-linear components, which are then used in the prediction model. Such non-linear inputs help in achieving better prediction accuracy.
The error term is computed as in Eq. (2).
In this case the number of weights to be updated is
The prediction scheme using MLP structure is shown in Fig. 5. The output of the first hidden layer is given as
where
The predicted revenue value at the output is given by
The error term is computed as
The
The average change in weight of the output layer is computed as
The weight update is carried out according to
The
After application of all patterns the average change in weight is calculated as
Finally, the weights of the input layer are adjusted using
The training scheme of the models is the same as that outlined for the previous models. Similar to the previous models the weights are frozen when the mean square error
In this section an RBF based prediction model is proposed with two inputs, three centres and one output node. This model is shown in Fig. 6. The output of the Gaussian centre is given as
Where
The estimated output is given as
The average change in centre value of the Gaussian function is given as
The updated center of the model is given by
Similarly, the weights are updated as
The training scheme of the RBF model is identical to the previous cases. After completion of training of all the models, their performance is tested using the remaining 20% of revenue features of each segment of services, which have been used during training.
Simulation set up
The simulation-based experiment is an important step in the development of adaptive prediction model of telecom revenue. To simulate such a set up the following sequential steps were carried out
Collection of relevant real telecom monthly revenue data of three segments namely voice services (VS), data services and VAS. Normalization of the above data. Extraction of statistical features from the revenue time series, which are to be used as input to the model for achieving better prediction. Selection of appropriate prediction models based on the reported performance of these models. Training of the adaptive models using appropriate learning algorithms. Testing of these models with known input features extracted from the past data. Performance evaluation of these models in terms of convergence characteristics and mean average percentage of errors. Ranking of models and choice of the best model for prediction of telecom revenue.
In the present case 36 number of telecom revenue data collected for a period of 36 months from a mobile operator operating over a particular licensing area in India. To make the prediction model simple yet effective, two statistical features such as mean, variance and the present input are chosen to be used as input to the model.In the present case, four adaptive models such as ALC, TENN, MLP, and RBF have been chosen based on their consistent prediction performance. The live data is collected for 36 months for the three segments of telecom revenue. The normalisation of these data is carried out by dividing each value by the maximum value of the whole set in a particular segment. From this dataset of 31{(36
In the case of ALC (Fig. 3), there are only three weights to be trained by least mean squares algorithm [4] using suitable learning coefficient, which lies between 0–1. In the case of TENN (Fig. 4) each input i.e. actual, mean and variance is expanded to five terms such as x, sin x, cosx, sin 3x and cos 3x. As a result, there shall be 15 expanded terms and hence there shall be 15 unknown weights to be trained. In a similar way (as in the case of ALC) 23 patterns are sequentially applied for training the model. When each input pattern is applied to the corresponding desired value (predicted value) is used to train all the 15 weights (Table 2).
In the case of MLP model, three layers are used and the structure of MLP is 3-2-1. The first layer has six weights plus two biased inputs and the last layer has 2 weights and hence the model has a total of ten weights. Thus, in this case, there are ten weights to be updated by using the back propagation algorithm [19]. In this case, also convergence characteristics are obtained during the training period by applying 23 feature patterns. There are no specific studies available in fixing the number of hidden neurons. This number has been fixed on the basis of trial and error. The performance degrades if more number of neurons is used due to over modelling.
Comparison of convergence characteristics of one month ahead VAS revenue prediction models.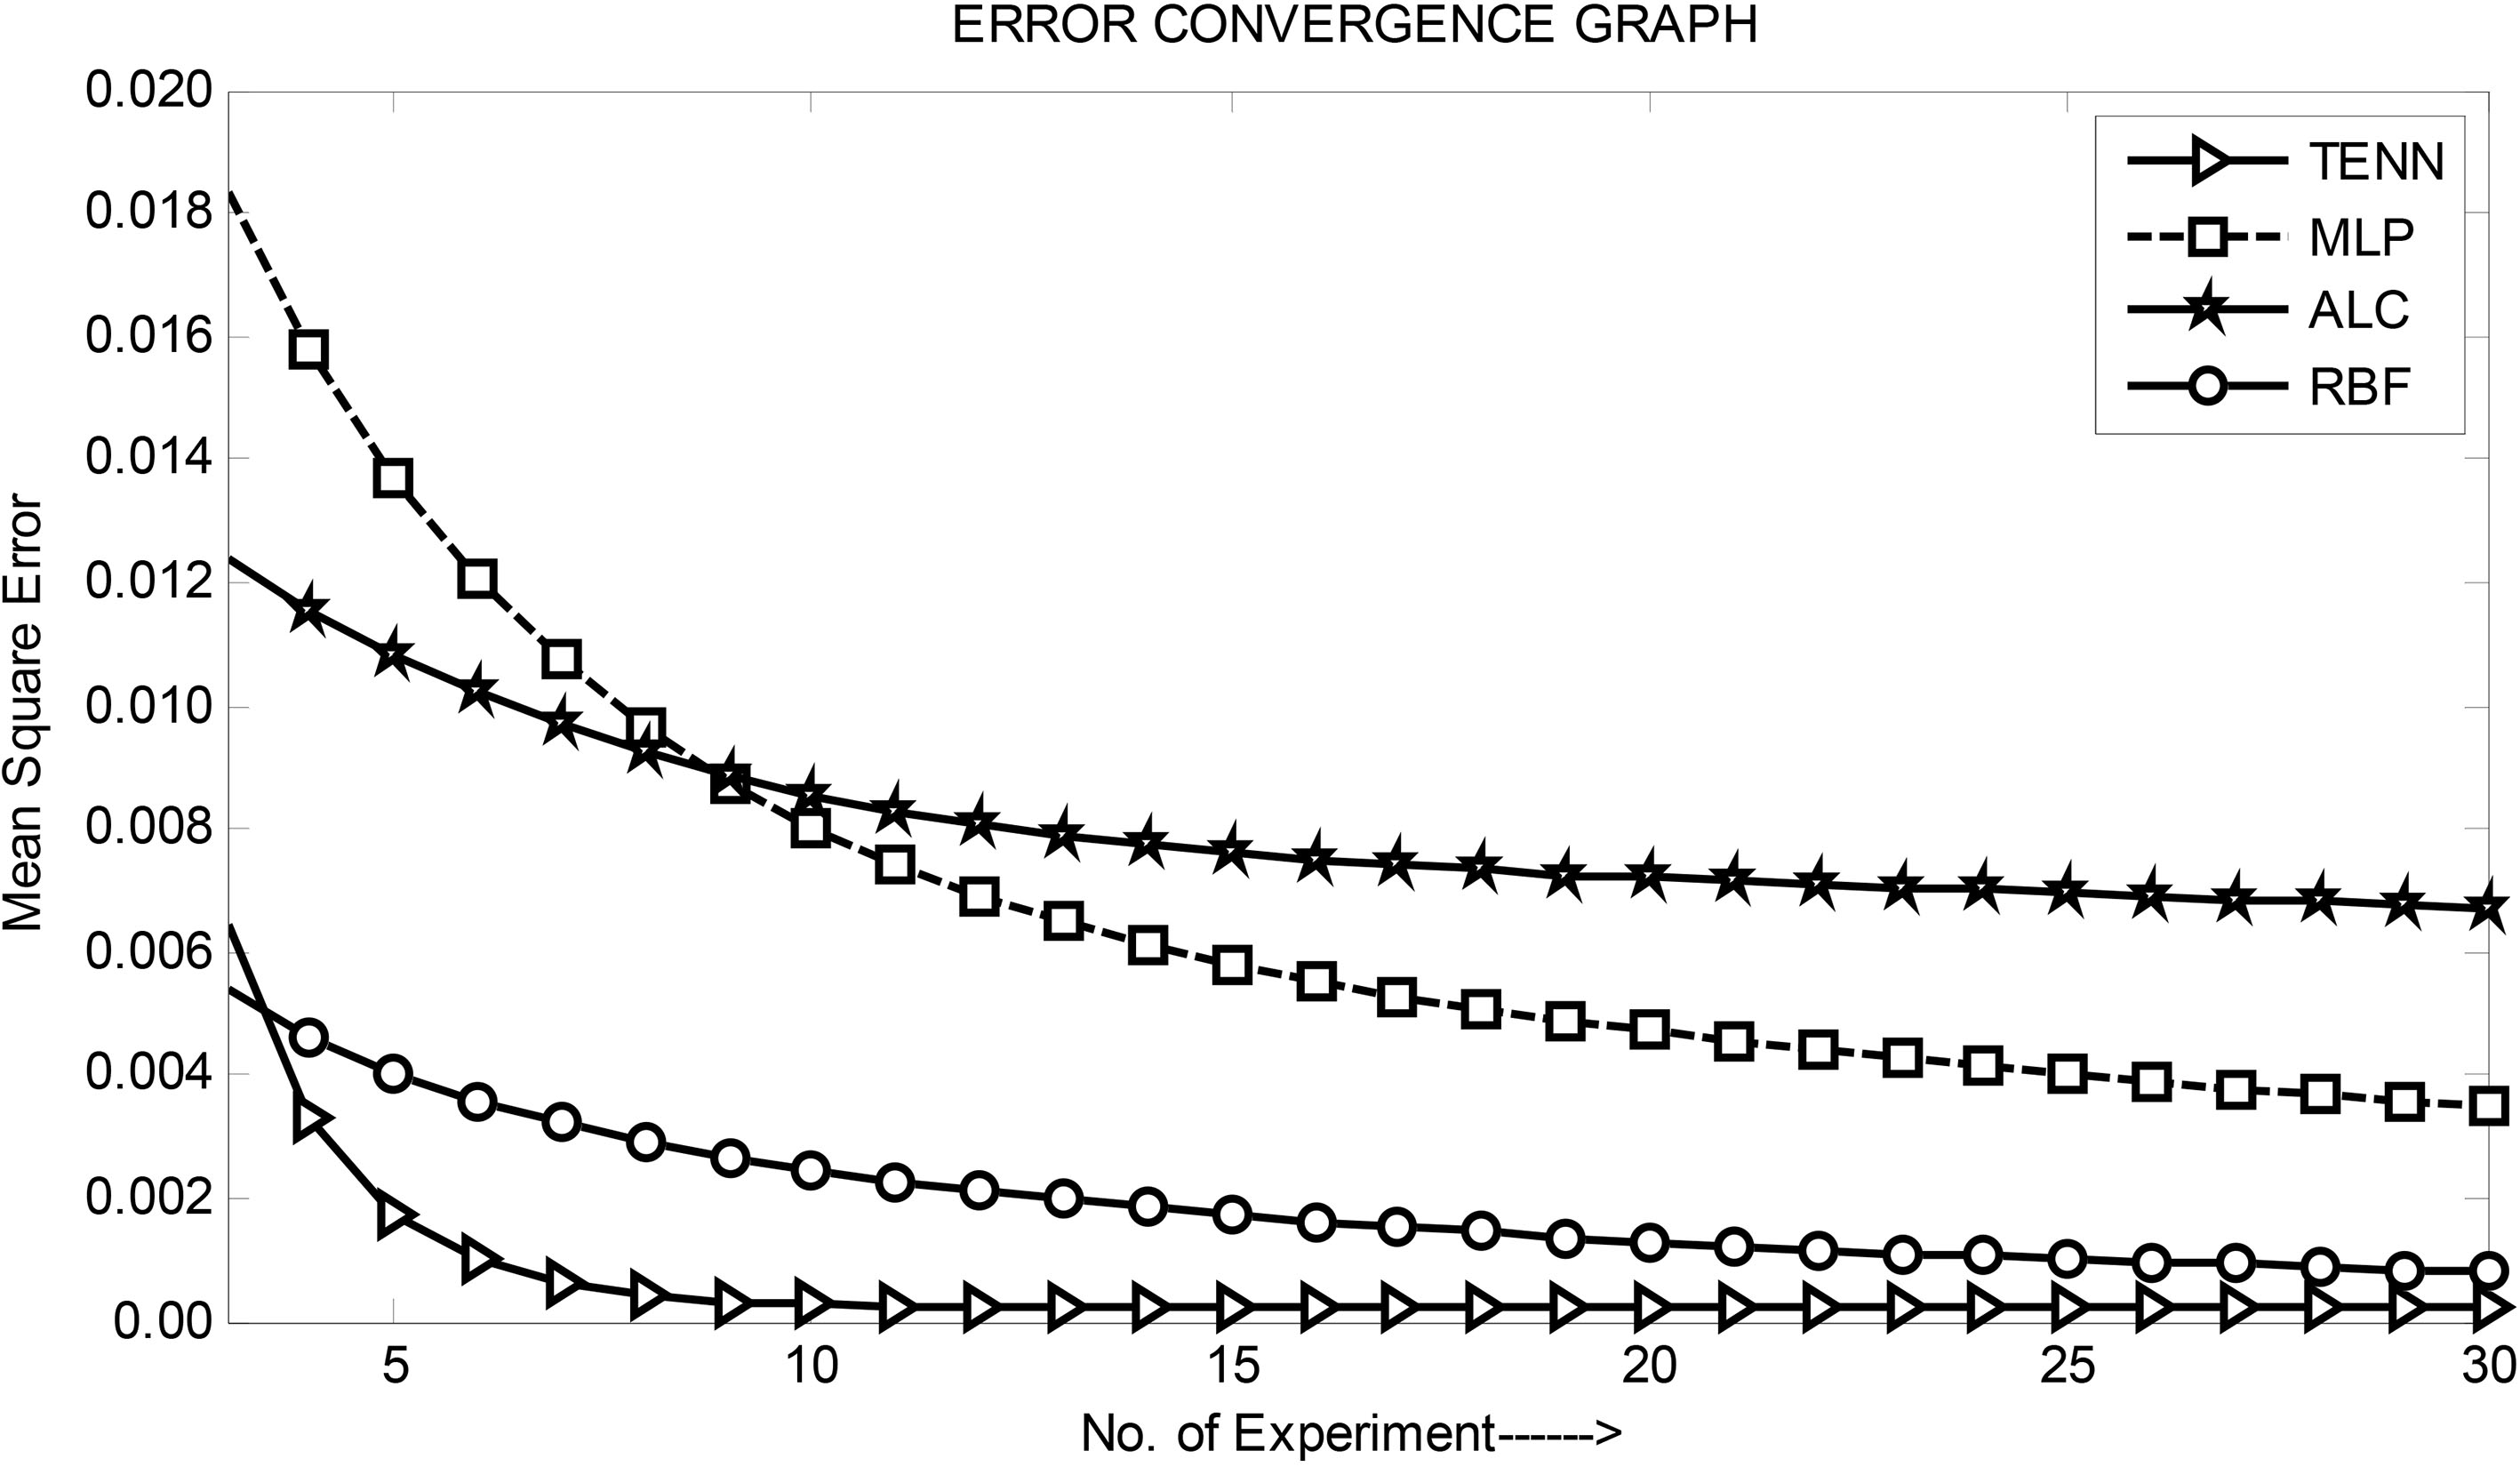
Comparison of convergence characteristics of one month ahead VS revenue prediction models.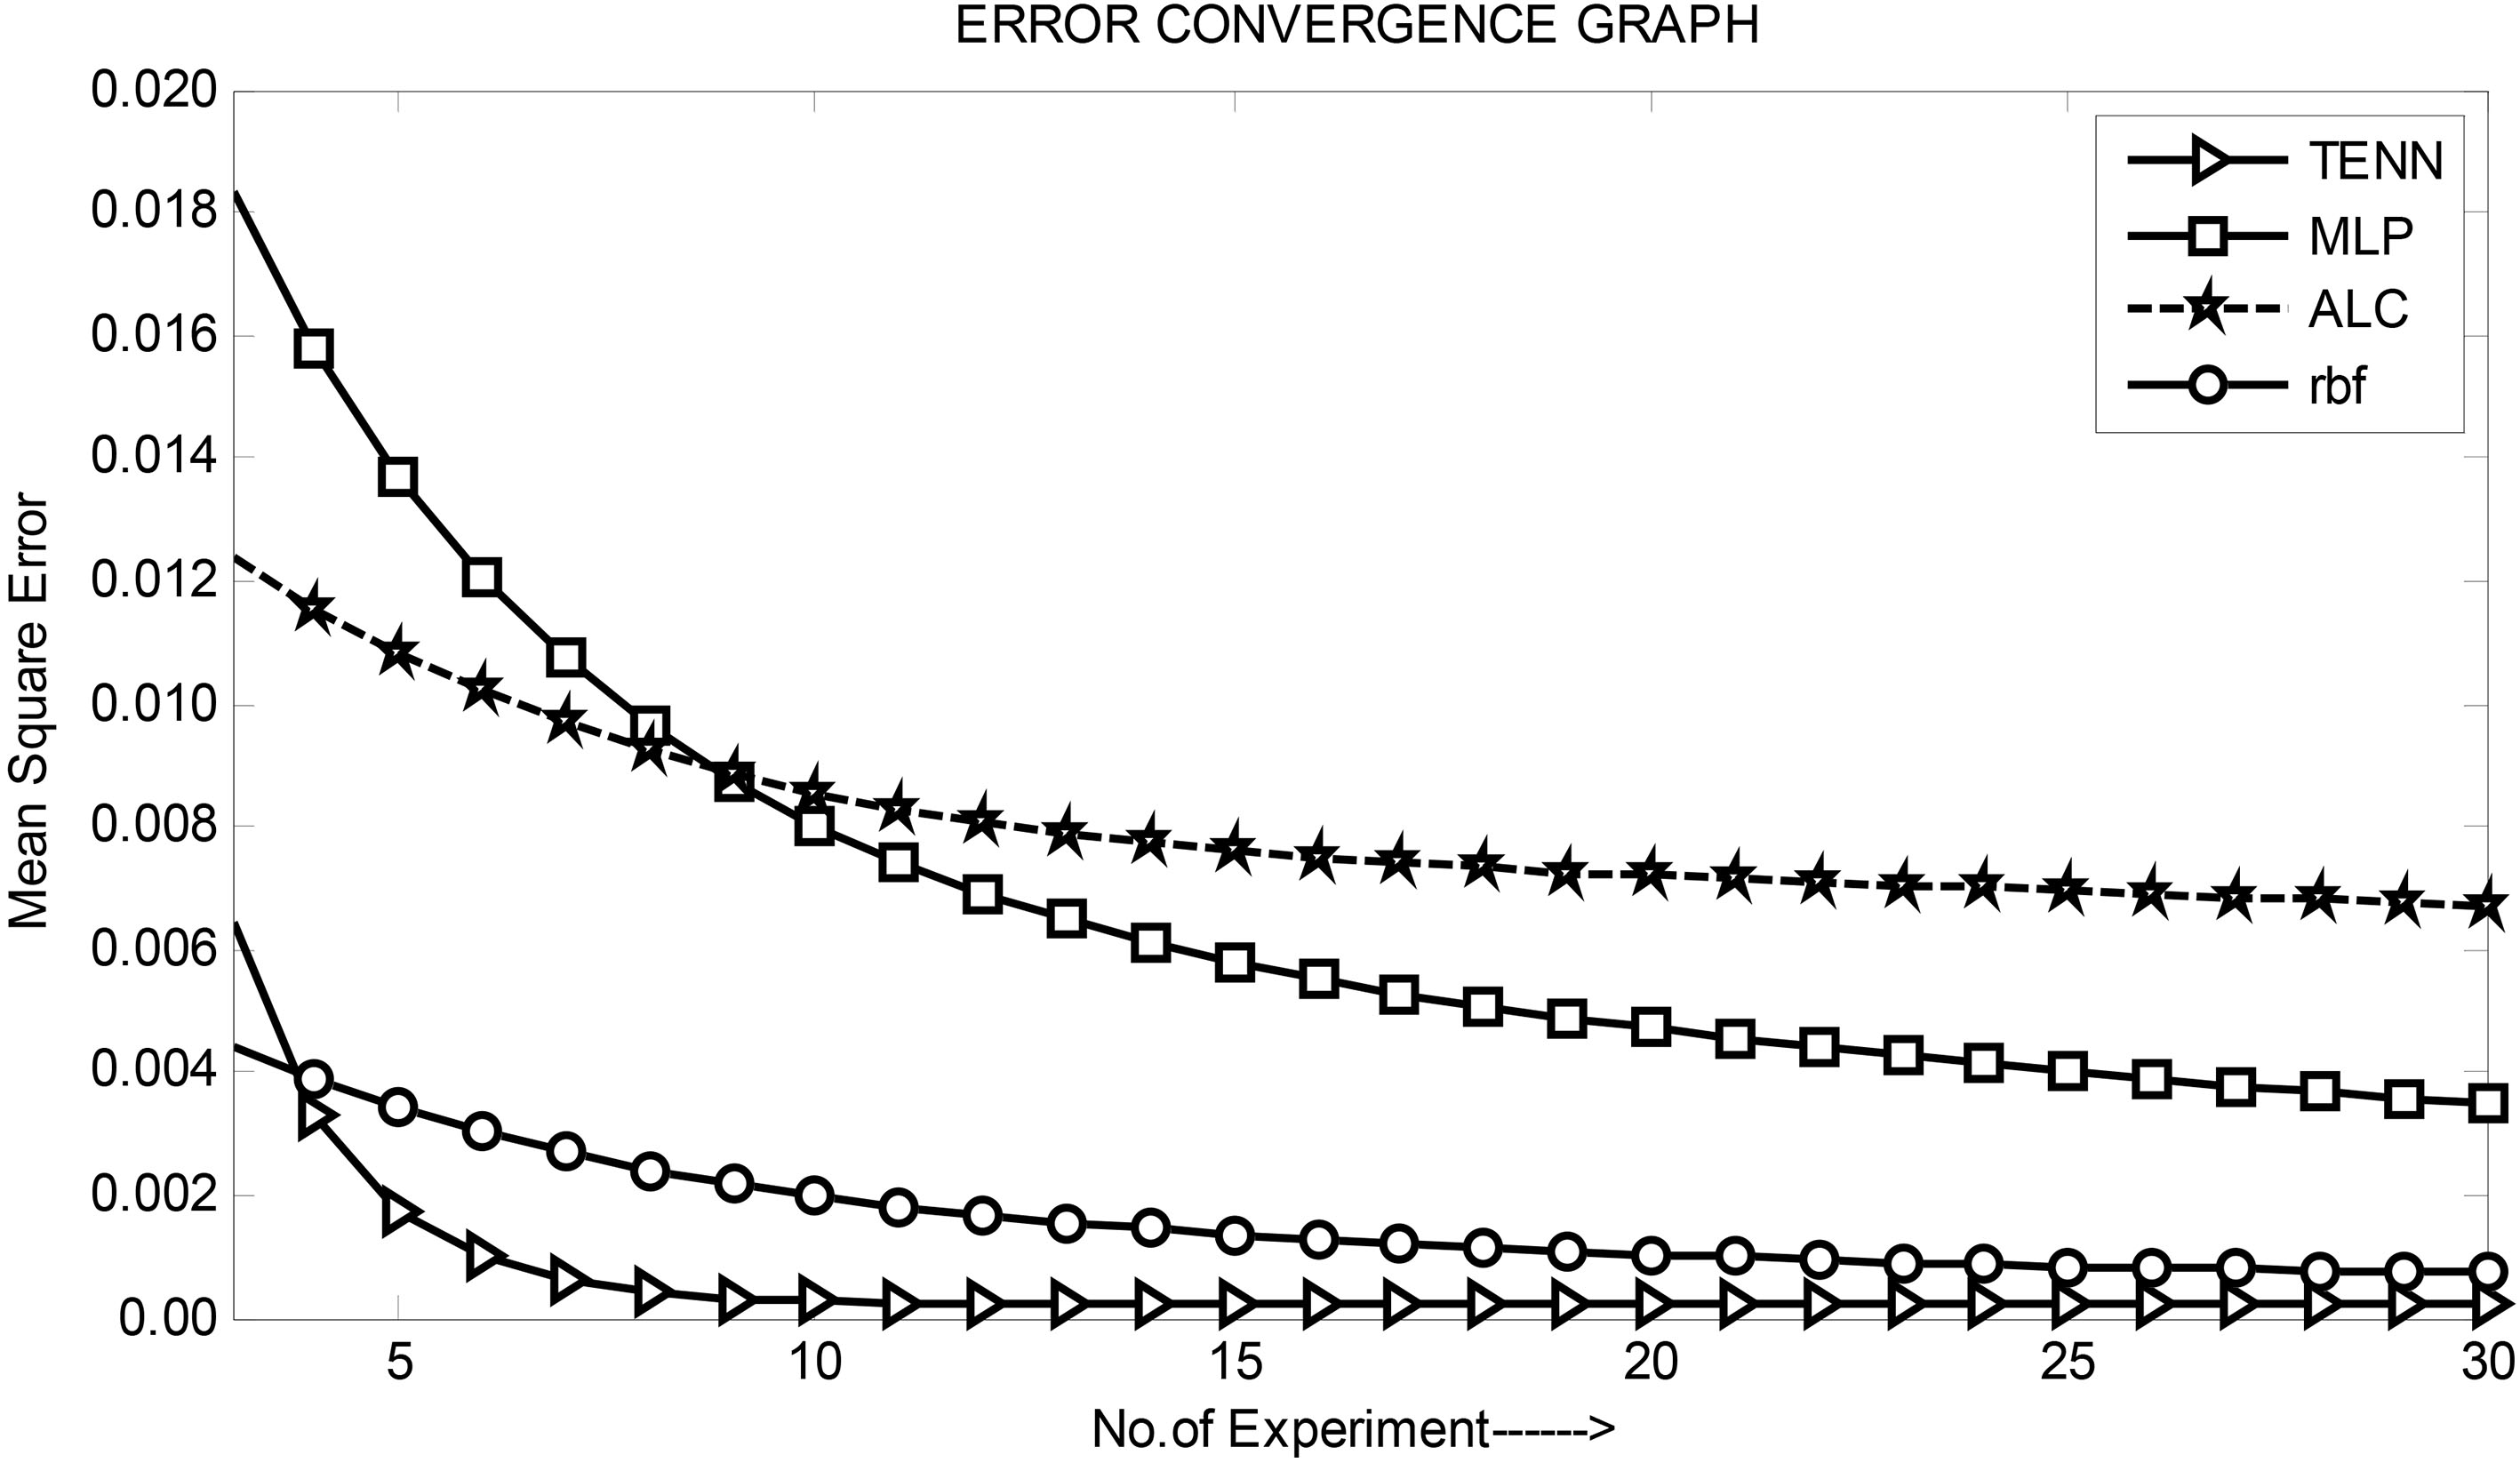
Comparison of two months ahead DS revenue prediction of various models.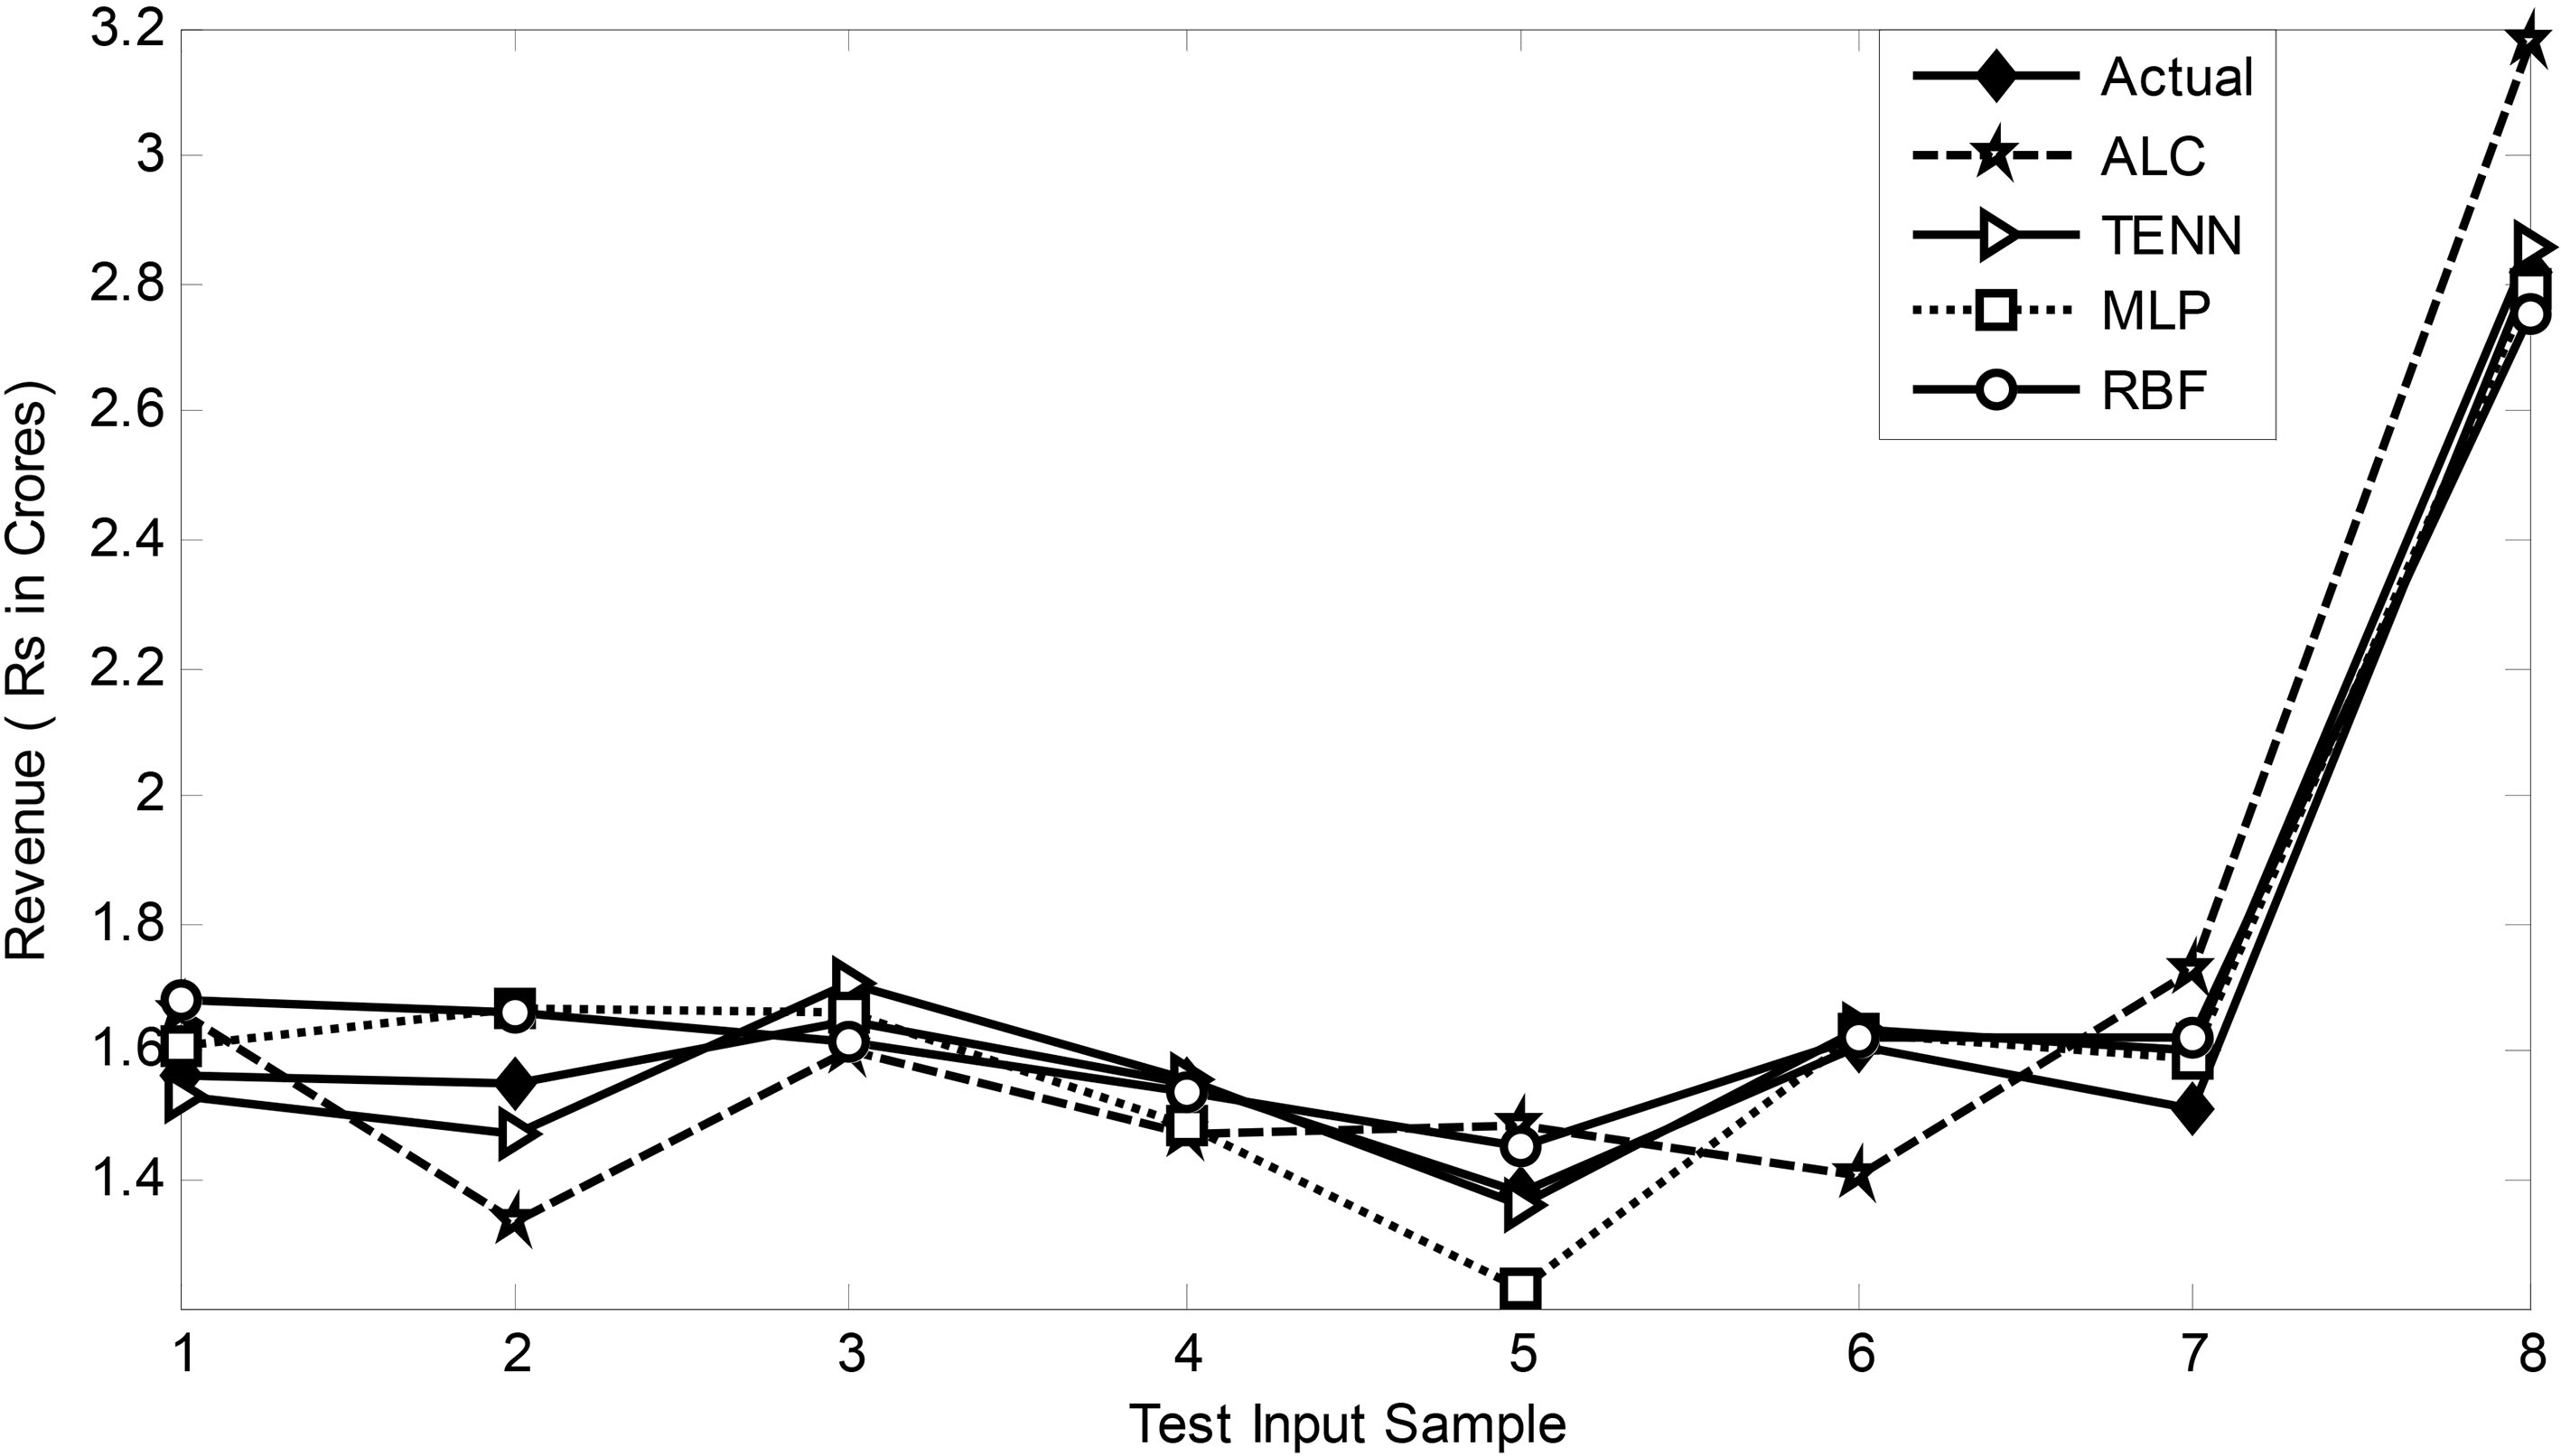
Comparison of three months ahead DS revenue prediction of various models.
Comparison of two months ahead VAS revenue prediction of various models.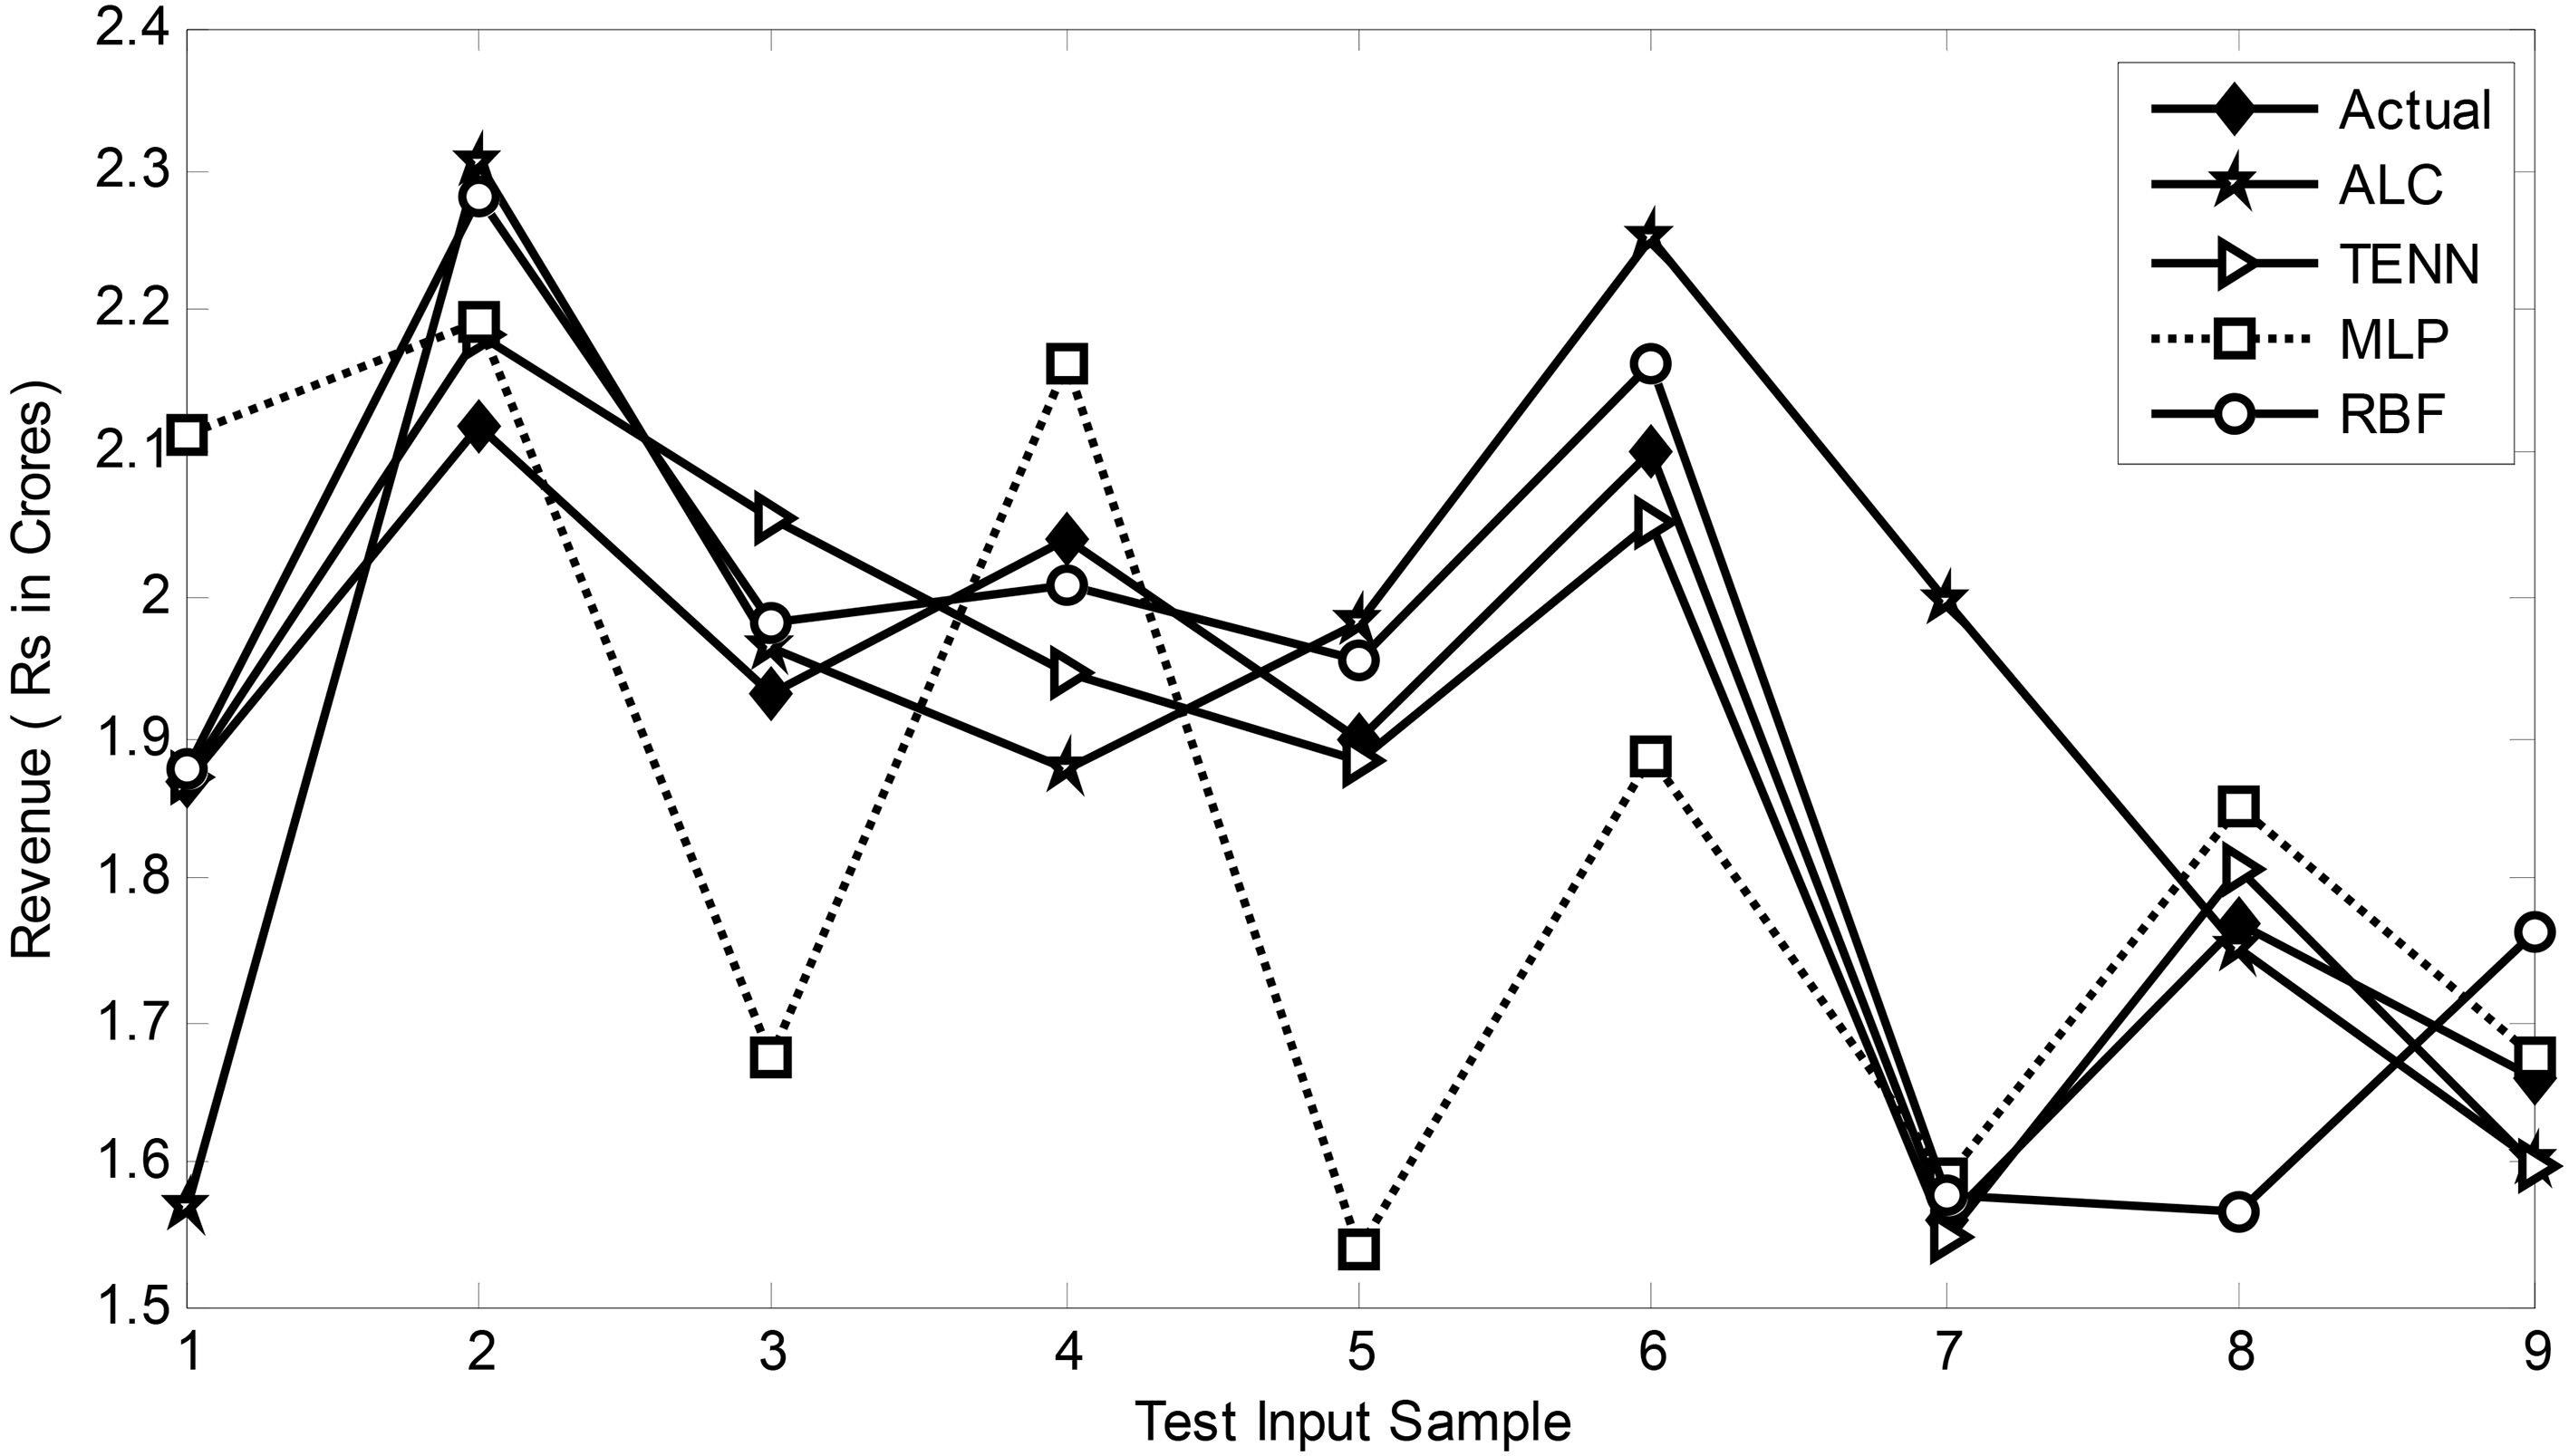
In the case of RBF model, Fig. 6 is simulated in Matlab and the training process is carried out using 23 input feature patterns. In this case, ten centers are chosen and hence there are ten weights in the last layer which are to be updated by using the rule given in [23, 25]. In case of RBF network ten number of Gaussian nodes are chosen in the model as prediction accuracy is poor if the number of nodes is less than ten. Further if the numbers of nodes are more than ten, no improvement of performance is observed. Therefore ten numbers of Gaussian centers are used in the model. On completion of training, the validation process is carried out using remaining 8 feature patterns.
The simulation study has been carried out for four different models for the three sets of revenue data (VS, DS, and VAS) and for 1, 2, 3 and 4 months ahead prediction.
By running the Matlab programme and using relevant input features the learning or convergence characteristics are obtained for each case. Figure 7 shows the comparison of convergence characteristics of all the four models of one month ahead VAS revenue. Similarly, Fig. 8 exhibits comparison of convergence characteristics of one month ahead of VS revenue prediction model.
Comparison of actual and predicted values of revenue from data services (DS) for one month and four months ahead
Comparison of actual and predicted values of revenue from data services (DS) for one month and four months ahead
Comparison of actual and predicted values of revenue from value added services (VAS) for one month and four months ahead
Comparison of three months ahead VAS revenue prediction of various models.
Comparison of actual and predicted values of revenue from voice services (VS) for one month and four months ahead
Comparison of mean percentage of error in one month and two months ahead data services (DS) revenue prediction
Comparison of mean percentage of error in three months and four months ahead data services (DS) revenue prediction
Comparison of mean absolute percentage of error in one month and two months ahead value added services (VAS) revenue prediction
Comparison of mean absolute percentage of error in three months and four months ahead value added services (VAS) revenue prediction
The prediction performance of all the four proposed models have been compared with the actual values for all four models have been compared with the actual values for all the three segments of revenue data and for two and three months ahead. Figures 10 and 11 compare the prediction performance of all the four models with that of the actual corresponding DS revenue for two and three months ahead. In the same way Figs 11 and 12 display the comparative prediction performance of VAS revenue for two and three months ahead respectively.
Comparison of mean absolute percentage of error in one month and two months ahead voice services (VS) revenue prediction
Comparison of mean absolute percentage of error in three months and four months ahead, voice services (VS) revenue prediction
Comparison of two months ahead VS revenue prediction of various models.
Comparison of three months ahead, VS revenue prediction of various models.
Table 5 compares the prediction values of revenue from VS for one to four months ahead. Tables 6 and 7 compare the mean % of error in one to four months ahead for DS revenue prediction. Similar results are presented in Tables 8 and 9 for VAS revenue prediction and Tables 10 and 11 for VS revenue prediction respectively. Finally, in Table 12 a performance ranking is presented based on prediction potentiality of four different models studied for three sets of revenue data.
Ranking based on prediction performance of different adaptive models for DS/VS/VAS
Ranking based on prediction performance of different adaptive models for DS/VS/VAS
The Comparative convergence characteristics are shown in Figs 7 and 8 reveal that the TENN prediction model provides the best convergence performance during training both in terms of training time and accuracy. It is followed by RBF, MLP and ALC models. This is true for all sets of data as well as all months ahead prediction. It is observed from Figs 10–14 that, for all sets of revenue prediction, the TENN model performs the best as summarised in Table 12. The second best model in terms of prediction performance is RBF. The MLP model comes in the third position whereas ALC is the least performing prediction model.
Hence the general observation after analyzing all the simulation results is that the TENN prediction model is the best in all three cases of revenue prediction and for different months ahead of forecasting as it offers the least value of mean square error after the convergence is achieved.
The mean absolute percentage of error (defined as the average of the sum of the percentage of error for each test case) is computed for each model and for different months (1 to 4) ahead of prediction. These results are listed in Tables 6–11 for four different models, for different service segments and, for four different months of prediction.
The result of the validation of all the forecasting models proposed in the paper is shown in Figs 10–14. In Figs 10 and 11, the prediction of revenue from DS for two and three months ahead using four different models is compared. A similar comparison has been made in Figs 12–14 for VAS and VS data respectively. Close examination of the performance using the DS test patterns reveals that in all cases the TENN model offers the best forecasting result closest to the actual compared to the other three linear and nonlinear models. A similar observation is made for VAS and VS dataset. Revenue dataset is a time series, which is inherently non-linear. Therefore non-linear ANN based models perform better than the linear model as seen from our study.
Based on the average percentage of error the ranking of the prediction model is made and the same is presented in Table 12. This table indicates that for each of the different months ahead of prediction and for all types of service segments, the order of ranking of models obtained is TENN, RBF, MLP, and ALC. In other words in general, the TENN model offers the best performance compared to other three models based on available data.
The revenue models developed in this research are applicable to any Mobile operator in India and elsewhere. These prediction models could also be used as a valuable tool to study the impact of any change of marketing strategy; product innovation or pricing on the revenue accrued from various segments like VAS, DS or VS over the medium term. The results could be utilized to study the revenue growth pattern in the short or medium term.
In this research monthly revenue data of a Mobile service provider, in a licensing service area of India, over a period of thirty-six months was utilized as the input data. This data was observed inadequate for achieving appreciable prediction accuracy over medium-term or higher. Availability of data over at least a hundred months could have been better for developing a model with adequate training so that the accuracy of prediction could have been improved and the best model suitable for such application could have been identified with greater accuracy.
It is observed that the growth of revenue on account of VAS is rather slow. There is an imperative need to go into the details of the causes of poor adoption of VAS in the Indian context. There is a need to consult all stakeholders of the VAS ecosystem to arrive at any conclusion.
Conclusion
The paper has developed four adaptive models for efficient prediction of revenue from three service segments such as VS, DS, and VAS. It is in general observed that for the real-time revenue data of a telecom operator the TENN model outperforms the other three models. It is further observed that for longer span prediction, the accuracy of prediction of all the models becomes less. If the number of features is kept constant (in this case 3) and prediction is made for more number of months ahead, then prediction accuracy decreases because correlation between data decreases for more months ahead. In addition the data set available for the study was only for 36 months which also contributes to less accuracy for higher months.
The adaptive models selected are standard models in signal processing and soft computing literature. The TENN model provides the best performance for all the segments of services and for different months ahead prediction. The TENN model predicts better than other models because it provides more non-linearity suited for revenue time-series data.
The poor performance of ALC indicates that the revenue time series is nonlinear and hence a linear model like the ALC provides poor performance.
In this study, an optimum prediction model has been developed for the VAS revenue along with the other streams of revenue namely Voice and Data. The increased revenue from Data is accounted for due to the increased use of mobile-enabled services such as m-commerce, m-education, m-health, m-finance, m-entertainment, and other OTT services. The revenue from VAS would improve due to the increased use of VAS as well as increasing the number of VAS users. There are a lot of studies available in the literature on the adoption of specific VAS like SMS, PRBT etc. However, very few studies are reported on the factors of growth of the VAS industry, which can contribute towards the increase of revenue of the operators. Further increasing the number of users of VAS is a challenge and therefore further study is needed so as to find out the ways and means of increasing VAS users in rural India.