



Abstract
Many heart diseases can be identified and cured at an early stage by studying the changes in the features of electrocardiogram (ECG) signal. Myocardial Infarction (MI) is the serious cause of death worldwide. If MI can be detected early, the death rate will reduce. In this paper, an algorithm to detect MI in an ECG signal using Daubechies wavelet transform technique is developed. The ECG signal-denoising is performed by removing the corresponding wavelet coefficients at higher scale. After denoising, an important step towards identifying an arrhythmia is the feature extraction from the ECG. Feature extraction is carried out to detect the R peaks of the ECG signal. Since as R peak is having the highest amplitude, and therefore it is detected in the first round, subsequently location of other peaks are determined. Having completed the preprocessing and the feature extraction the MI is detected from the ECG based on inverted T wave logic and ST segment elevation. The algorithm was evaluated using MIT-BIH database and European database satisfactorily.
Introduction
India is seen as coronary heart disease capital of the world. According to the current situation, India will soon have the highest number of heart disease cases in the world. MI conduction system controls the propagation and generation of electrical signals (action potentials). The signals cause the muscle cells to contract and consequently pump the blood.
This electrical activity can be measured using electrodes placed at different positions on the skin. This produces a composite recording in the form of a graph. This recording is known as Electrocardiogram (ECG).
However these signals being non-linear and non-stationary in nature, it is difficult to analyze them visually. Since the ECG signal takes long hours for clinical observation and it is non-linear, the irregularities may not be periodic. An ECG is a tool used for identification of any change in normal activities of the human heart.
The activity of the human heart is measured using skin electrodes placed on the human body. Total ten electrodes are usually used for recording ECG signals; six electrodes are placed on the chest and two on each limb. ECG signals may be affected by different kinds of noises such as baseline wanderings, power line interferences, and due to movement of muscles. Among these, baseline wanderings and power line interference’s are the major noises which are mainly responsible for affecting the ECG signals.
Baseline wandering noises appear in ECG signals when a patient breaths in (resulting in the chest expansion) and breathing out (resulting in the chest contraction). Generally the baseline wanderings has a frequency less than 0.5 Hz. Prior to recording ECG signals, a gel is applied to those portions of the body (of the patient).These application reduces baseline wondering noises. Power line interferences in ECG signals occur because of an improper grounding of the ECG machine.
Power line interferences have a frequency around 50 Hz or around 60 Hz depending on a specific country. By proper grounding of the ECG machine we can reduce power line interferences [1]. Denoising of ECG signals has attracted greater attention since the Signal to Noise Ratio (SNR) of the ECG signals is low.
Earlier digital filtering techniques such as Finite Impulse Response (FIR) filter or Infinite Impulse Response (IIR) filter is used for removing noises from ECG signals. However, researchers have mainly used FIR filter to eliminate the noises from the ECG signals for the following reason. That is, the advantage of FIR filter is that it has an exact linear phase and it is always stable [2].
The disadvantage with FIR filter is that its design has more constraints than that of IIR filter. Although higher order IIR filters can remove the noises from the ECG signals, their stability is lower than that of FIR filter [3, 4].
Later researchers have used the Empirical Mode Decomposition (EMD) technique for denoising ECG signals. This method decomposes the signal into a finite and often small number of components. These decomposed components are known as intrinsic mode functions (IMF). The disadvantage with EMD is mode mixing [5].
Adaptive filters are also used for noise cancellation in ECG signals. Adaptive noise canceler is a technique used in adaptive filters to cancel various types of noises which are present in ECG signal to improve its quality.
The noise cancellation is based on subtraction of noise from the received signal which is controlled in an adaptive manner. Adaptive filter methods such as Least Mean Square (LMS) algorithm and Recursive Least Square (RLS) algorithm are used for noise cancellation in ECG signals.
But in an adaptive filter method as the step size is increased, both the noise and rate of convergence increase. Therefore adaptive filtering methods are not effective for noise cancellation in the ECG signal [6].
Presently, researchers are often using wavelet transform to denoise the ECG signals. Wavelet transform has been found to be a powerful tool for non-stationary signal analysis.The advantage of the wavelet transform is that it does not change the morphology of the ECG signal [7, 8].
For extracting the features in the ECG signal, earlier researchers used Pan-Tompkins algorithm for detecting the peaks in ECG signal. Later on, they often use peak detection based on the location of the R peak method.
In this method first the R peak is detected by finding the maximum value of the voltage. The maximum value is obtained by decomposing the signal with the help of wavelet transform. Based on the location of R peak the remaining peaks are detected [9, 10].
For detecting the MI presently researchers use ECG signal characteristics such as ST-segment deviation and amplitude of the T wave [11].
The analysis of the ECG signal is used for detecting cardiac diseases. The ECG signal mainly consists of PQRST waves. In a normal heart, each beat begins in the right atrium. The atrial depolarization is represented by the P-wave. Ventricular depolarization and atrial repolarization are represented by the QRS complex, while the ventricular diastole is represented by the T-wave.
If any fatty material is present on the inner walls of the heart, the coronary arteries become narrow. It results in restricted blood supply to heart. The heart does not get sufficient oxygen. Consequently it leads to Ischemia. If this continues for a long time cells may die resulting in damages to the heart muscles causing MI. Figure 1 shows the normal ECG signal in different segments of PQRST wave form.
Normal ECG signal with PQRST waves.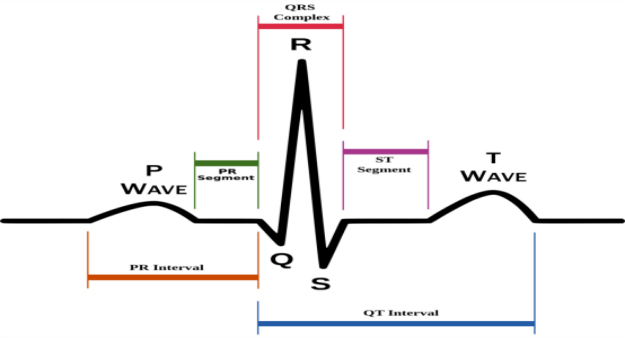
In this paper, we have developed a method to automatically detect the MI. ST-segment elevation and inversion of the T wave are the features selected for detection of MI. ST-segment elevation implies that the ST-segment present in the ECG goes above the normal value and thus the walls of the heart become thick and blood supply to the heart stops.
In ST depression we observe an inversion of T wave. ST depression means ST segment goes down and the T wave gets inverted. In ST depression (T-wave inversion) partial thickness appears inside the heart. Consequently the heart does not get sufficient blood supply.
Flow chart of proposed method to detecting MI.
The Wavelet Transform has become a prominent tool for time-frequency analysis of ECG signals. The Wavelet can analyze the signal simultaneously in time and frequency. The continuous wavelet transform (CWT) is useful for analyzing non-stationary signals,while the Discrete Wavelet Transform (DWT) is useful for decomposing the signal into its components. The CWT contains a large amount of redundant information while analyzing a signal. The DWT analyzes the signal with a number of scales,as small as acceptable, with varying number of translations at each scale.
The CWT gives a complete representation of a signal by changing the scale and translation parameters. The output of the CWT is useful for time-frequency analysis of the signal. The mathematical representation of wavelet is given as
Where
The DWT is used for decomposing the signal into an orthogonal set of wavelet basis functions. It decomposes the signal into different levels based on the requirement. Different types of DWT wavelets such as the Haar, the Daubechies, the Symlet, the coiflet, and the Discrete Meyer wavelets are available for denoising. The equation for DWT is
where,
The Fig. 2 Indicating Proposed Method to detecting MI.
Before extracting the features of the ECG signal, selection of wavelet for decomposition is an important task. Different families of wavelets such as the Haar, the Daubechies, the Symlet, the Coiflet, the Bi-orthogonal, and the Discrete Meyer wavelets are available in the literature. Among them, The Daubechies family shape is similar to that of the ECG Signal.
In the Daubechies family having many wavelets (viz.db2, db3, …, db10) out of which db4 wavelet matches the QRS complex in ECG Signal [9]. For decomposing the signal, the DWT is used. Figure 3 indicates Daubechies wave forms from db2 to db10.
Daubechies wavelet family.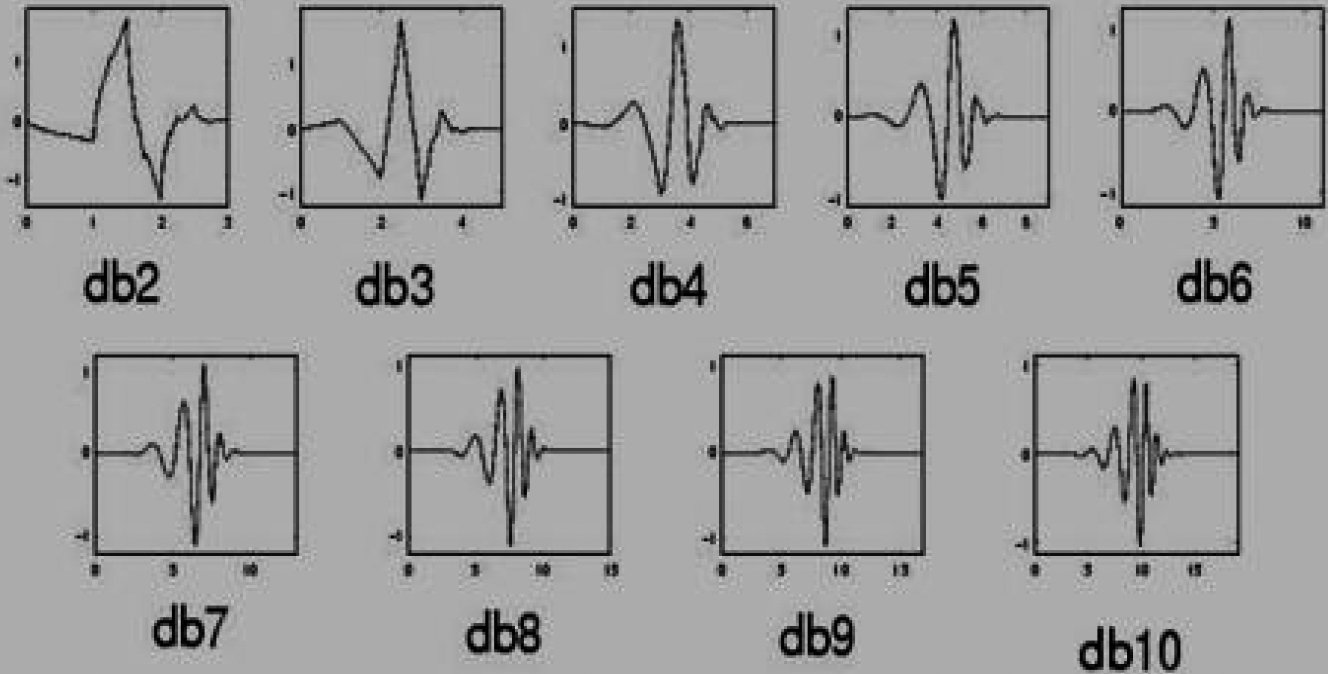
In the ECG signal the R peak is having the highest amplitude. So first we detect the R wave. Based on the R peak location we detect the location of remaining waves [10]. The signal is then decomposed using a the DWT. The signal is then decomposed up to four levels using the DWT. After denoising we identify the peaks of the ECG signal as follows.
R peak detection
As Since the R wave has the height amplitude in the ECG signal, We compute the local positive maxima. In the rising edge of down sampled signal. If we keep a threshold of 60% of the maximum of the signal then these peaks are considered probable R peaks. We separate the R peaks which are very close to each other. We retained the peaks which are 10 samples apart. This step is to avoid the false R peak locations. Store all the R peak values of down sampled signal which were found. In this way the locations of R peaks are detected in our proposed method.
P-peak detection
To find the P peak we have selected a window of size R location-100 to R location-50. We then find the maxima within the window. These maxima are P-peaks.
Q-peak detection
For finding the Q peak we have selected a window of size R location-100 to R location-10. We find the minima within the window. These minima are Q-peaks.
S-peak detection
Select a window of size R location+5 to R location+50. We find the minima within the window. These minima are S-peaks.
T-peak detection
Select a window of size R location+25 to R location+100. We find the maxima with in the window. These maxima are T-peaks.
Original ECG signal.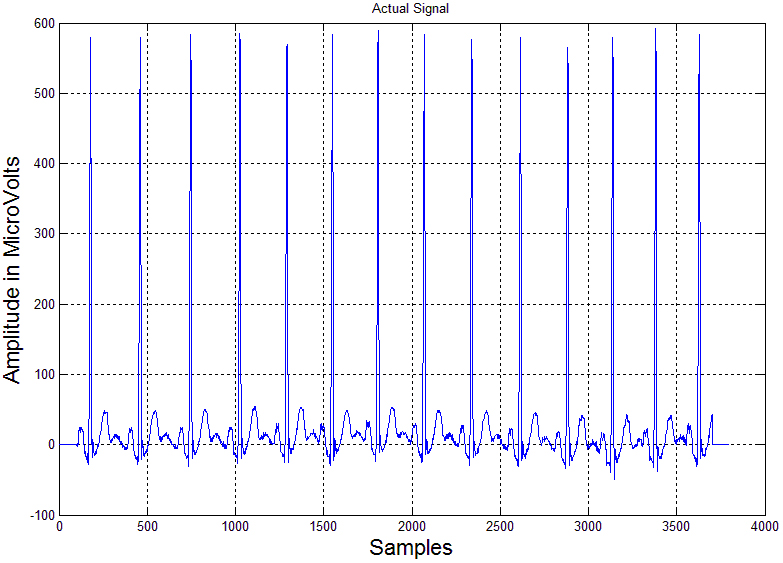
Having obtained all the peaks, we compute zero crossing onset and offset points for S and T peaks. The difference between an S offset and a T onset point is ST segment. In an ECG signal, ST segment represents the time period between ventricular depolarization and ventricular repolarization. ST segment is important in emergency medicine because characteristic changes during a heart attack can be seen in the ST segment. ST segment abnormality will leads to MI. In medical term heart attack is commonly known as MI. It is a flat segment in an ECG signal. While reading ECG we can confirm ST-segment elevation based MI (STEMI) if ST-segment elevation is present. In our work we have identified the presence of MI in ECG signal based on Inversion of T wave and the elevation of ST segment. ST segment is calculated from S off-set and T onset. Generally, the ST segment is an iso-electric line i.e. it should be at zero milli Volt (mV). Normal limit of in deviation is acceptable. We consider it as an elevated ST segment. T wave is a positive peak in ECG signal. If the T wave is inverted we can confirm MI [11].
ST deviation is calculated by taking the difference of PR point and ST point. Here
Where
Decomposed ECG signal.
Approximation coefficients up to level 4.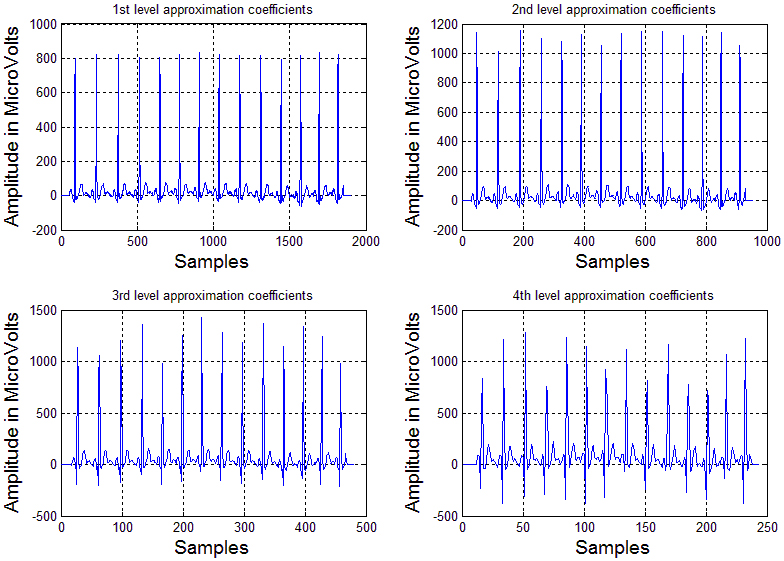
R peaks detected in 2nd level approximation coefficients.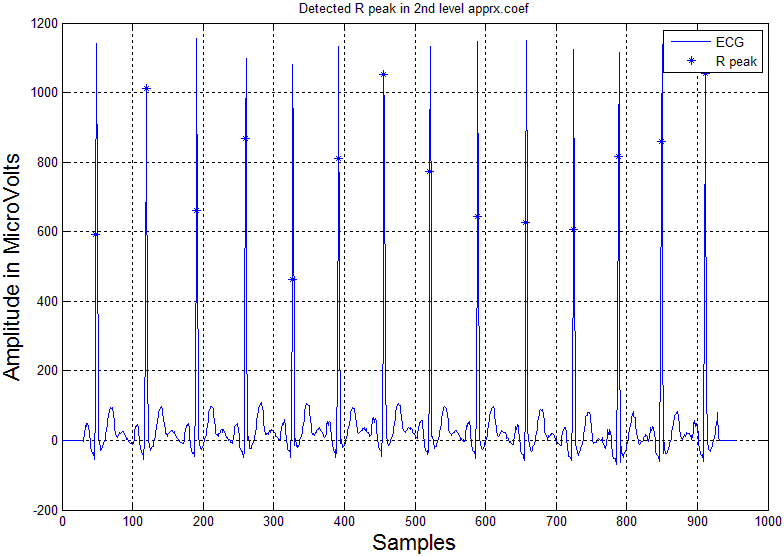
R peaks detected in original ECG signal.
PQST peaks detected in original ECG signal.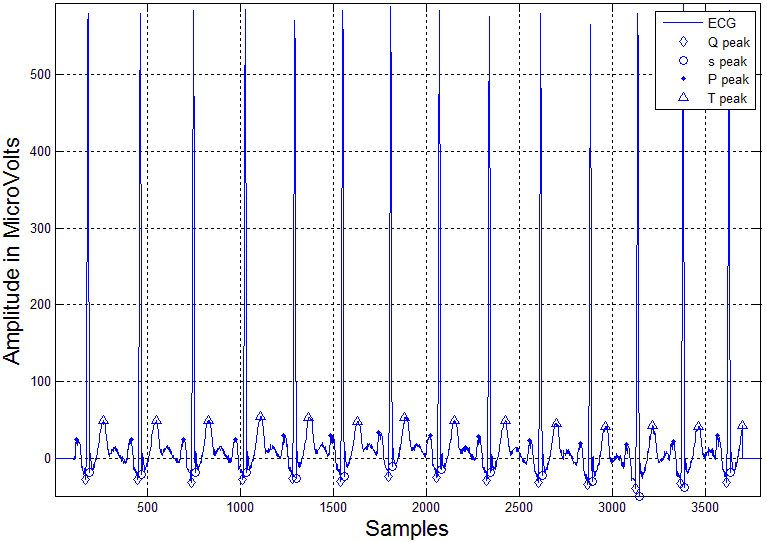
ST elevation MI detected.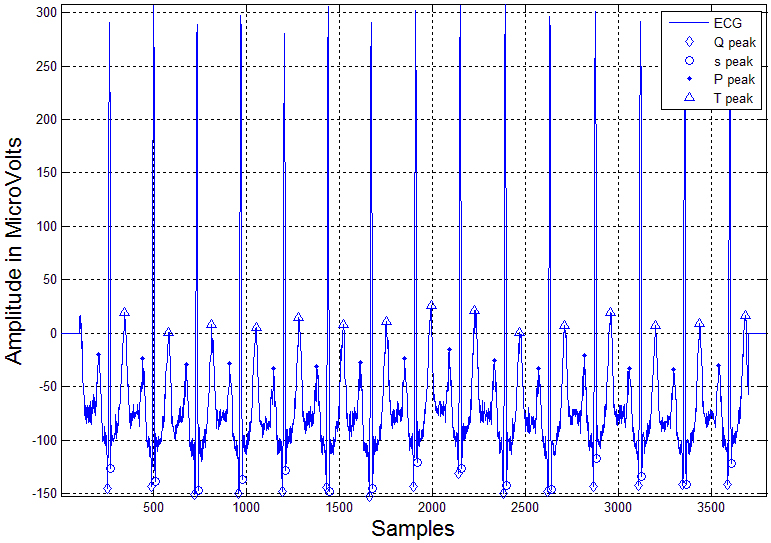
T wave inversion MI detected.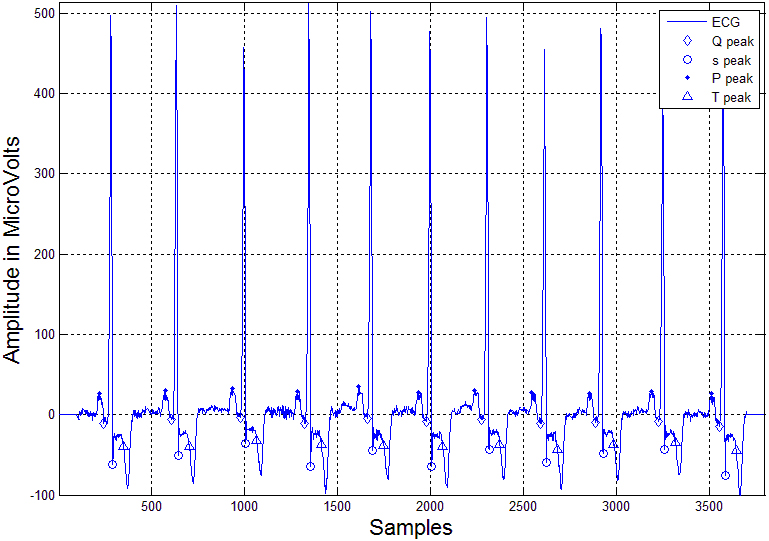
The ECG signals are taken from the MIT-BIH arrhythmia database. The experiment is conducted in Matlab R 2013a. In our proposed method we have used DWT for signal decomposition. In our work we have taken a raw ECG signal from MIT-BIH and European Database.
We have tested our algorithm with a number of signals and results are plotted for Normal ECG signal of record number of 309 and ischemic signals of record numbers 300 and 306.
Figure 4 represents the original ECG signal of record.no.309 which was taken from the MIT-BIH arrhythmia database. The original signal is decomposed with the help of DWT. The decomposition is performed up to level 4. Daubechies 4 (Db-4) is the wavelet used for decomposition. Figure 5 represents the decomposed ECG signal. The decomposition is done up to level 4. Figure 6 shows approximation coefficients up to level 4. Figure 7 represents the 2
Detection of peaks in MIT-BIH database
Detection of peaks in MIT-BIH database
Detection of peaks in European database
In Fig. 9 the remaining (PQST) peaks are detected. In Fig. 10 the ST segment is elevated. It implies that the ST segment is longer than the normal ST segment value. Thus ST-segment elevation based MI (STEMI) is detected in rec.no.300. In Fig. 11 the T wave is inverted in rec.no.306. Hence we can confirm MI with T inverted logic.
In the proposed work Db-4 wavelet is used for signal decomposition because the shape of the ECG signal is similar to the shape of the Db-4 wavelet. The feature extraction method is successful in detecting all the peaks of the ECG signal. From Table 1 sensitivity of 97.74% and positive predictivity of 99.19% for MIT-BIH database and from Table 2 sensitivity of 98.52% and positive predictivity of 99.37% for European database are obtained which are promising results. In the proposed method MI is detected based on ST segment elevation and inverted T wave. From the results, it is clear that proposed algorithm is able to detect the MI from the ECG and it can also classify the healthy and diseased subjects. The proposed automated method can be installed in the Intensive Care Units (ICU’s) of hospitals to assist the clinicians in confirming their diagnosis.