
Abstract
The expansion of service-oriented architecture and the increasing number of web services has led to an increase in demand for their use. But since a single service alone may not be enough to meet the most relatively complex business processes requirements, it is necessary to combine several individual services to deliver user satisfaction. By increasing the number of services that have the same functionality, the quality of service provided by each service will play an important role in the service selection process; in the process of service composition, different services with different quality parameters come together to provide a new task. Therefore, offering the best quality service to the user is considered an important issue. The challenging issues in the service composition process include how to combine the web services with quality parameters based on user preference, long response time for the composition process, large search space, and the correlation between the services. In this paper, the quality-based service composition is modeled by considering the relationship between the services to improve the quality of service (QoS) parameters. The proposed model consists of several steps. In the first step, the inappropriate services will be pruned by applying the correlation between the services. In the second step, by determining the quality levels for the QoS, the APSO algorithm is used to select the best levels and, finally, the best services. In the service combination stage, the services selected from the previous stage are combined using a fuzzy genetic algorithm (FGA) to create a suitable combination service. The results show that when the correlation between the services is considered, the response time criterion improves significantly by integrating the quality parameters and pruning the candidate services, and reduces the search space.
Keywords
Introduction
According to IBM, a web service is a new generation of web applications that are comprehensive, self-described, and use modular applications that can be published, located, and cited across the web. Also, the World Wide Web Consortium (W3C) defines a web service as a software system that supports interoperable machine-to-machine interaction over a network. It has an interface described in a machine-processable format (specifically, Web Service Definition Language, or WSDL) [38]. Other systems will interact with the service according to this pre-defined description, and messages are transmitted by the simple object access protocol (SOAP) protocol or other related protocols [6].
For all the benefits that web services offer, there is a fundamental limitation to their use: a web service alone cannot respond to a complex request. This limitation has made the creation of larger and more efficient services using existing web services an important area of research in web service technology. To this end, a composite service consists of a combination of available services to achieve the capabilities that a single service cannot provide. In the service composition process, a workflow based on the service map is created by entering a request from the user. Basic services tailored to each task in progress are then discovered imported from the service repository to create multiple combinations that guarantee several optimal composite services based on the user’s requirements [2, 4, 23].
According to existing research, it can be inferred that the field of finding the optimal result of the combination of services has disadvantages such as low speed, insufficient accuracy in the output result, large search space, static of the service combination process, and so on. Each of these disadvantages can lead to many limitations for users and service providers. The best combination of web services is based on the QoS parameters, ensuring that the compatibility of the services shared in the combination is high and checking the degree of compatibility of the QoS of the combinations with the needs of users. Because there may be services with the same functionality but different QoS parameters, when submitting a request, the service composition process should look for a set of services that together meet not only the functionality needs but also the QoS parameters of the user’s request. Therefore, the purpose of QoS aware web services composition is to discover the best combination of web services that can meet the needs of functionality and service quality parameters at the same time.
If the composition process consists of
On the other hand, in the combination of web services, there are two limitations which are: correlation (dependency) limitations and conflict limitations. The correlation (dependency) constraint indicates the dependence of different web service implementations on each other so that by selecting a service, the next single service is chosen according to the existing dependency constraint. The conflict constraint denotes conflicting implementations of several different web services. By choosing a single service, the next one should not conflict with the previous one in terms of implementation.
In the current methods of service selection and composition, the role of service quality parameters in service composition and the impact of the correlation of services are rarely considered. But in actual service-based applications, the quality of service is often dependent on the selection of other services. Therefore, using service quality-awareness technology and a service correlation matrix is of great importance and has a functional concept [4].
The model proposed in this paper includes three steps: the pruning, the selection, and the composition of the service. In the service pruning stage, pruning algorithms are first used to remove correlation-free services and services without the optimal default value. The service selection step uses the Web Service Dynamic Selection Approach, which uses a fuzzy logic Method and an Adaptive Particle Swarm Optimization (APSO) algorithm to break down global constraints into local constraints based on user preferences. According to user priority and the value of the utility function, the appropriate services are selected for the composition and used as the initial population of the genetic algorithm. In the service composition phase, the proposed hybrid algorithm uses the genetic algorithm together with fuzzy rules. In this method, the probability of crossover and mutation operators is calculated using fuzzy rules. As a result, the probability of genetic algorithm operators that are calculated using fuzzy rules in each iteration of the genetic algorithm can make the genetic algorithm adaptive. Rules that determine the probability of crossover and mutations in a transparent manner are adopted to improve the behavior of the genetic algorithm.
This paper is organized as follows. The next section briefly discusses related works and research background. In Section 3, the proposed method is presented. Section 4 analyzes and evaluates the proposed method. The conclusion is offered in Section 5.
Related work
Due to the recent interest in the QoS-based web service selection and composition in service-oriented applications, many studies have been carried out, and several approaches have been proposed. These researches can be examined from different aspects such as the algorithms used for services composition, the focus on QoS parameters composite services, the correlation between basic services, and others. The following is a comparison of researches based on the algorithm used, QoS parameter, and service correlation.
Wang et al. [2] used reinforcement learning to combine the service to enable a service composition to adapt to its environment autonomously. A service composition was modeled via the Markov Decision Process (MDP) so that multiple alternative services and workflows could be incorporated into a single service composition. The aim of learning was to achieve an optimal policy for extracting the best quality of service in Markov’s decision process. They claimed that since the learning process took place throughout the life cycle of the service composition process, the composition could adapt to changes in the environment and services in the real world. They considered two QoS attributes, namely fee and execution time. The experimental results showed that their approach obtained the optimal execution policies of service compositions at runtime and (near-) optimal execution policies efficiently, and they were highly adaptive to the changes of the component services.
Chen et al. proposed a new service composition method called the Web Service Composition Recommendation (WSCRec) to manage increased dynamic and diverse user requests without regard to the QoS parameters. They used the execution log of composite services to identify appropriate services that proved to be more reliable and robust and, therefore, those services had a higher probability of fulfilling the users’ demands. To find the top-k possible composite services in real-time, they adopted the A* search algorithm with various pruning heuristics to dynamically expand the search space more efficiently. The experimental results showed the effectiveness and efficiency of the proposed approach [23].
Wang et al. [4] proposed a constraint-aware service composition method in which service constraints were well taken care of. The proposed solution included a graph search-based algorithm and two novel preprocessing methods. First, they described the problem through some real-world business scenarios; then, the service constraints and formal expressions were defined. Finally, a graph search-based algorithm and two different preprocessing methods were presented to advance the field. The proposed graph search-based algorithm could be applied to general service composition problems. Also, it could generate all the feasible solutions according to a user’s request.
Wang et al. [1] proposed a Web Service Dynamic Selection Approach (WSDSA) based on the breaking down of the global quality of services into a local constraint. They used an adaptive adjustment method (AAM) based on fuzzy logic and an adaptive particle swarm optimization algorithm to achieve this breakdown, which was based on user preferences so that the WSDSA obtained the most appropriate service composition with local selection.
Chang [5] proposed a novel approach to measure the QoS of Web services in dynamic and open Web service environments. The approach employed the Bayesian Network to establish the measure model of QoS and then used it to measure each of the QoS values of the web services. This study only focused on service quality.
During the service composition process, Wang et al. [7] simultaneously considered the global optimization web service and the preferences of the decision-makers. Then, alternatives were generated according to these preferences, and those closest to that of the group were selected. Finally, the WSS-TOPSIS method was used to reduce the workload and search space by replacing the evaluation of the decision-maker with QoS.
Jian et al. [8] proposed a new QoS Uncertainty-aware Web Service Composition approach based on a novel QoS interval model by using a Multi-criteria Decision Analysis (MCDA) method and an improved genetic algorithm. Also, a fuzzy ranking approach was designed to measure the preference between the two QoS intervals until the MCDA was employed to rank the alternative composite services, and the GA was applied to facilitate the service composition in different problem size. The experimental result demonstrated that their proposed method had a better performance than the traditional tentative QoS-aware service composition, especially in large problem size.
Deng et al. [13] proposed a novel method of service selection called the Correlation-Aware Service Pruning (CASP) method. It managed QoS correlations by accounting for all services that could be integrated into optimal composite services and pruned services that were not optimal candidate services. In this approach, a preprocessing algorithm removed the services that did not contribute to the optimal composite services from the candidate service sets. Then, two others algorithms were proposed for service selection with correlations in adjacent tasks and nonadjacent tasks. The experiments showed that this method could manage complicated correlations between services and significantly improve the QoS values of the generated composite services.
Liu et al. [16] proposed an approach for Web service dynamic composition based on global QoS constraints decomposition. The proposed method consisted of three steps: Firstly, global QoS constraints were decomposed into local constraints optimally by a new algorithm, namely the Culture Genetic Algorithm. Secondly, QoS values determination rules were designed to determine the QoS values of candidate services. Thirdly, the best Web services that satisfied the local constraints were selected for each task during the running time. The experimental results showed that their approach had a better performance in solving the problem of QoS-aware Web service dynamic composition.
Alrifai et al. [14] proposed a hybrid solution that combined global optimization with local selection techniques. They generated mixed integer programming to find the optimal decomposition of the global QoS constraints into local constraints. Then, they used distributed the local selection to find the best web services that satisfied the local constraints. The experimental results indicated that this approach significantly outperformed the existing solutions in terms of computation time while achieving close-to-optimal results.
Yuan et al. [10] presented a context-aware web service composition method that supported the correlation between services in order to improve the quality of the composite service. They introduced a service-correlation matrix that was dynamically updated with context awareness technology. Then, they combined service candidates using a genetic algorithm.
Tao et al. [27] proposed the use of a particle swarm optimization technique to solve the correlations among the services in manufacturing grids. Barakat et al. [28] presented a correlation-aware composition approach to model quality correlations among services during composite service selection. Wagner et al. [29] considered the time and input aspects that affected the QoS values of a service. However, these approaches addressed the service selection problem with QoS correlations but did not incorporate QoS correlations directly into the composition process.
Feng et al. [30] considered QoS-aware service composition in the presence of service-dependent QoS and proposed a method that dynamically refined the composed services in light of QoS correlations. This approach was capable of dealing with QoS-aware service composition with QoS correlations.
The existing research seldom considers the correlation and QoS aware service composition simultaneously, which can have a significant impact on the QoS value of the composite services. Also, these algorithms require considerable space to store the composite services as well as spending a considerable amount of time generating these composite services. In combination with the research above, this research introduces a new service composition based on the correlation between the services and their QoS in order to reduce the search space.
Hybrid proposed method
Proposed method framework.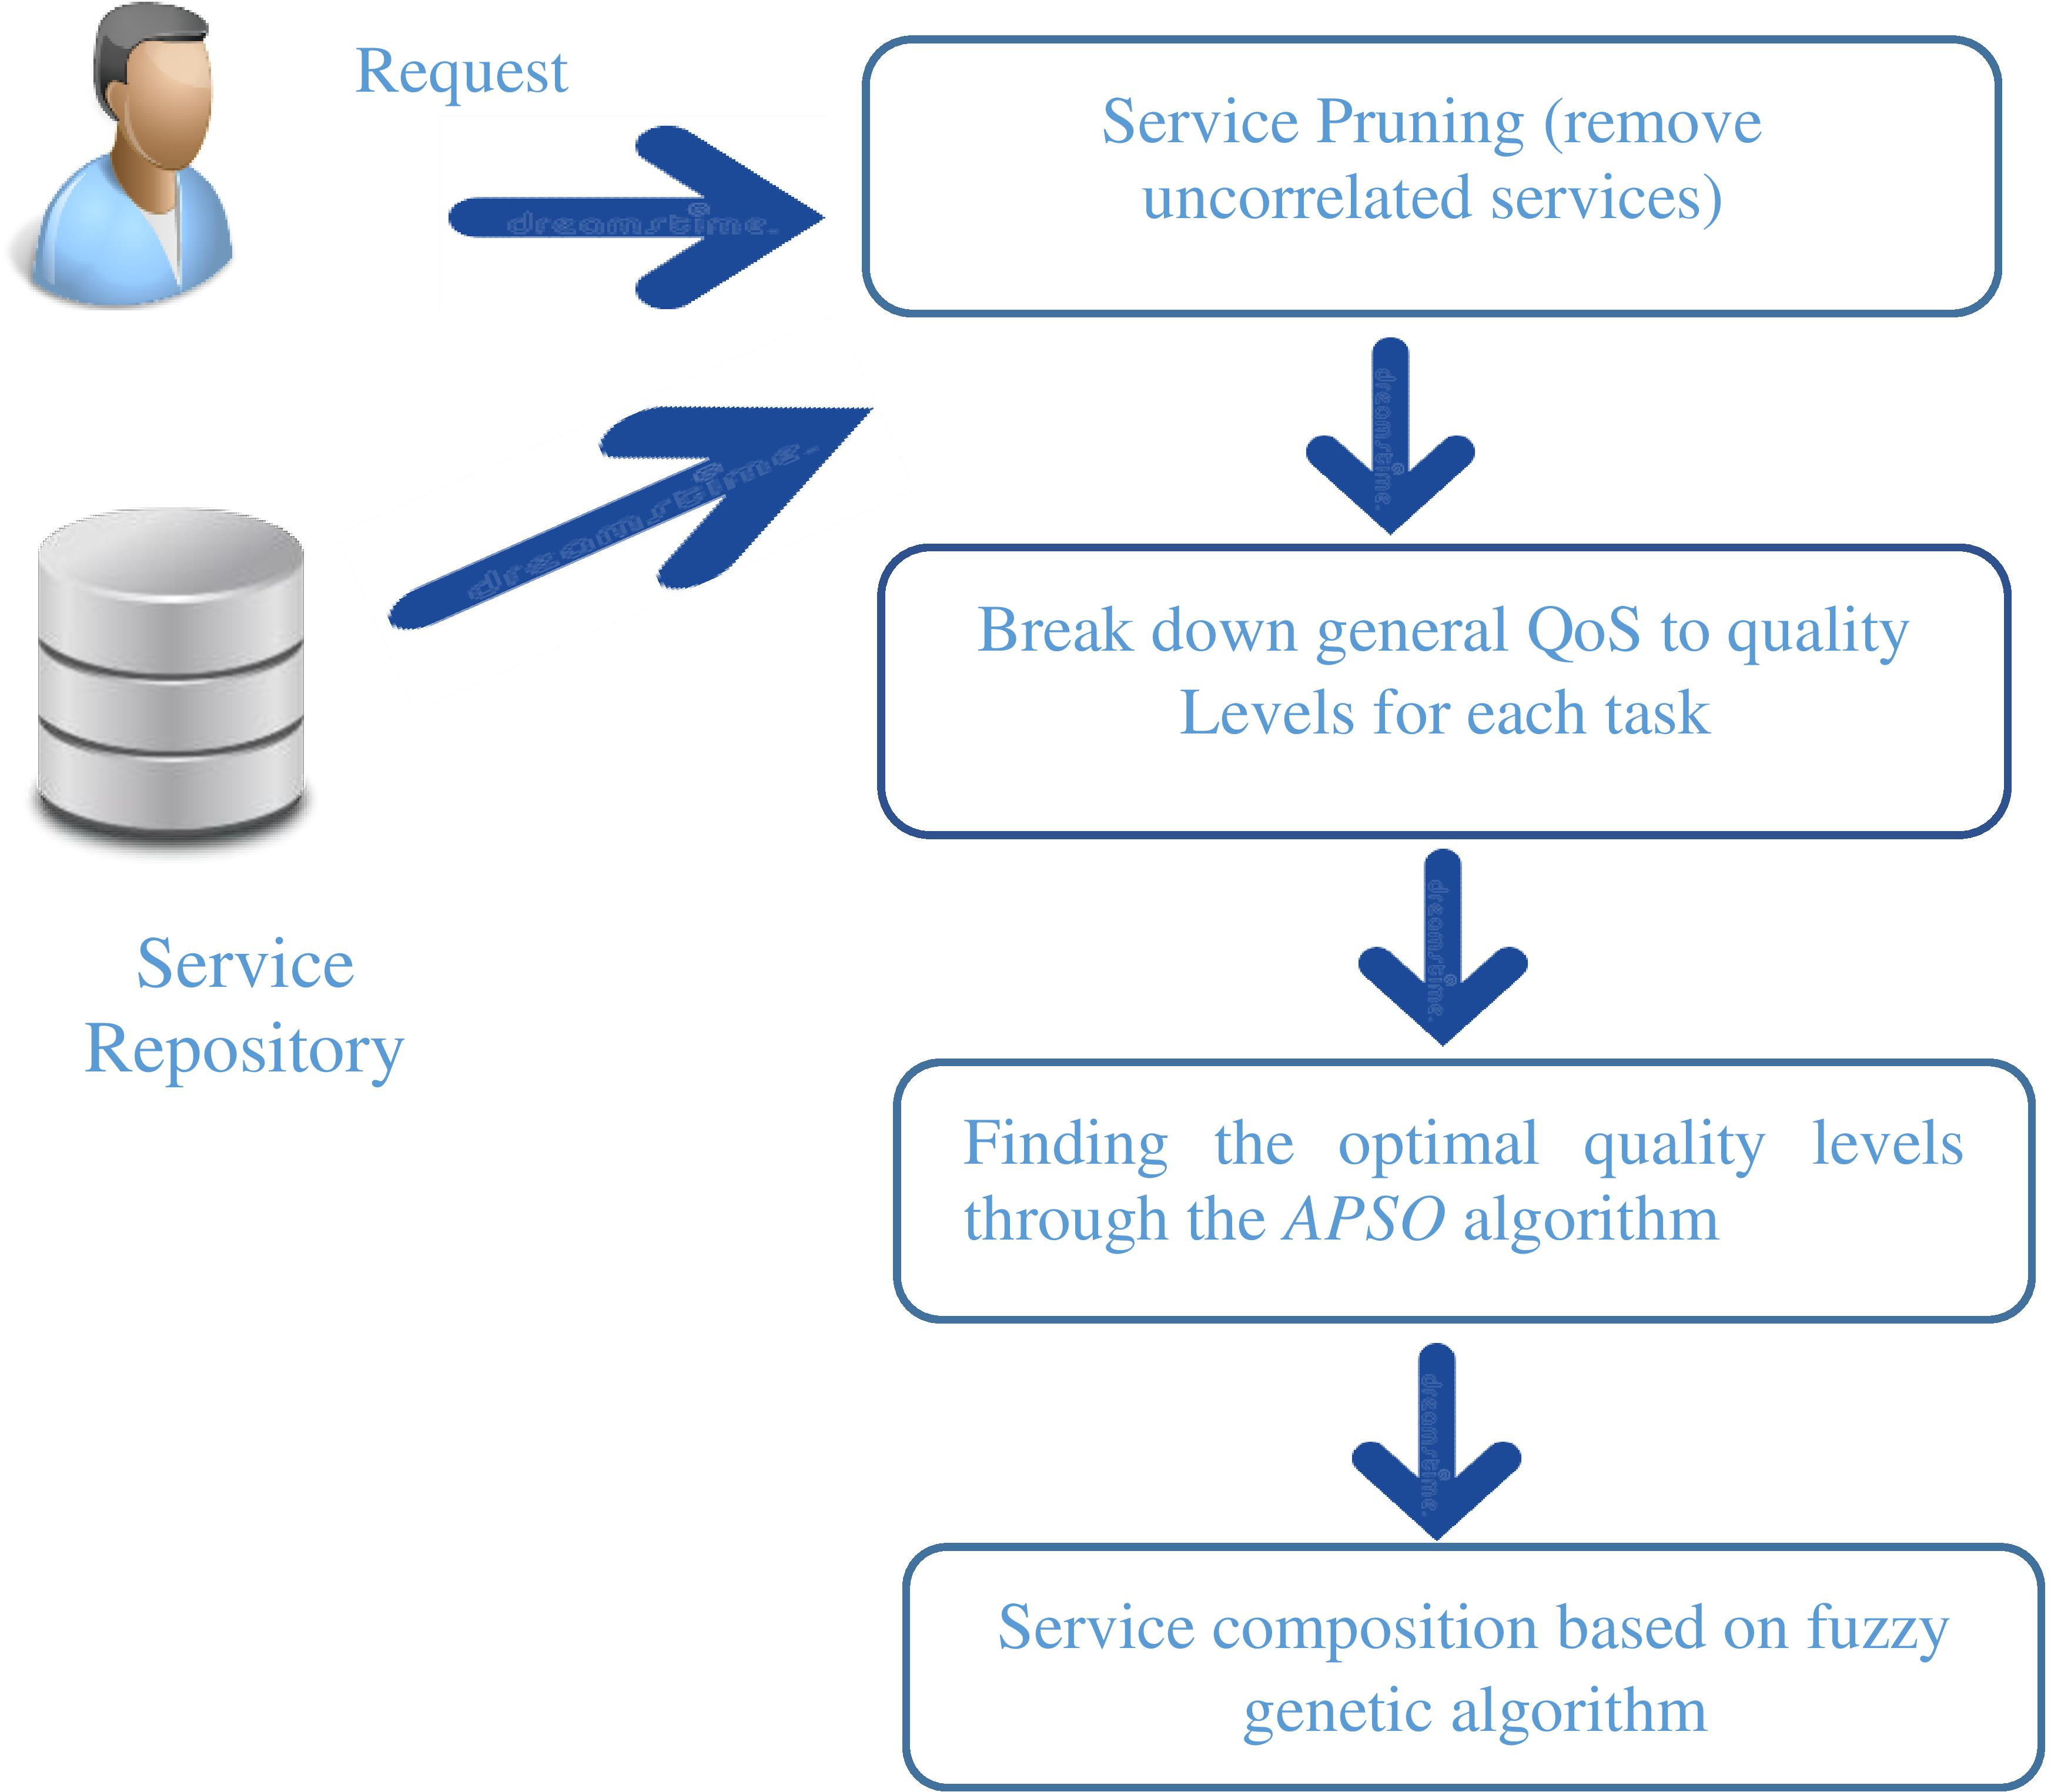
As mentioned, the correlation between the services and reducing the search space in the service composition process is very important and challenging. Therefore, this research attempts to overcome these challenges to some extent. Figure 1 shows the framework of the proposed method. In the first step, the services that correlate with each other are selected by considering the QoS parameters required by the user, and the useless services are removed. In the second step, the APSO algorithm is used to break down the global constraints into local constraints based on user preferences. According to user priority and the value of the utility function, the appropriate services are selected for the composition and used as the initial population of the genetic algorithm. In the third stage, the service combination process is performed using the fuzzy genetic algorithm. Genetic algorithm operators use fuzzy rules to select a better service combination.
In our model, we assume that we have a set of tasks
A composite service can be defined as:
CS
The Aggregation functions of composition services
The QoS vector for a composite service CS is defined as
Service composition workflow.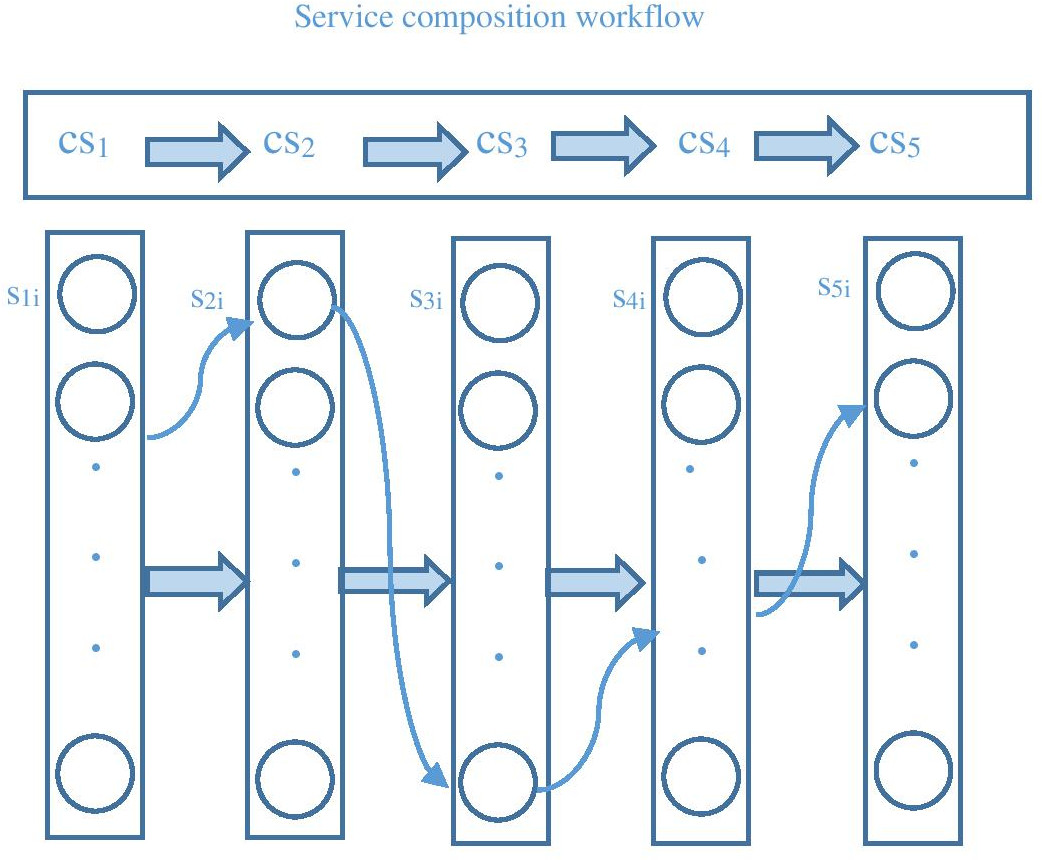
Figure 2 illustrates the Web service composition, where
This research considers only the sequence structure among the sequence, conditional, parallel, and loop structures because the conditional, parallel, and loop structures can be converted to the sequence structure. In sequential structure, a sequence of services
A utility function is used to evaluate the multi-dimensional quality of a given web service. The utility function maps the quality vector
The utility computation involves scaling the QoS attribute values to allow a uniform measurement of the multi-dimensional service qualities independent of their units and ranges. In the scaling process, before computing the utility value of (composite) Web service, each QoS attribute value is transformed into a value between 0 and 1 by comparing it with the possible minimum and maximum values according to the available QoS information of the service candidates. For a composite service (CS), the aggregated QoS values are compared with the minimum and maximum possible aggregated values. The minimum (or maximum) possible aggregated values are easily estimated by aggregating the minimum (or maximum) value of each service in CS. For example, the maximum execution price of CS is computed by summing up the execution price of the most expensive service candidate in each task in CS.
Formally, in the sequential model, the minimum and maximum aggregated values of the
where
Calculating utility function of QoS parameters.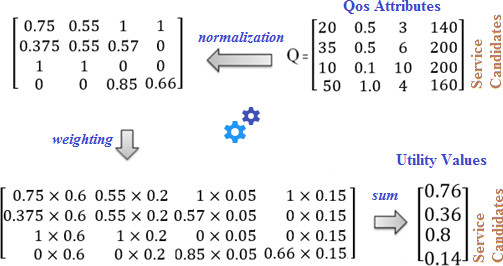
Figure 3 shows the step-by-step stages of calculating the utility function of the QoS parameters. In the first step, the matrix on the right shows the quality parameters of the four candidate services. In the second step, the normalization of the value quantity of quality parameters in each matrix row is obtained from Eq. (3). In which the maximum quantity of the quality parameter is subtracted from the current value of the QoS parameter and divided into the difference between the maximum and minimum values of the quality parameter, which is shown in the second matrix. In step 3, according to the priority set by the user, the weight factor of each quality parameter is multiplied by the normalized value of the service. It should be noted that the total weight factor assigned by the user is one. In the last step, the sum of the quality parameters of each service is mapped to a real value.
The correlation of service quality between the services affects the quality parameters of other services. Therefore, the choice of candidate services, taking into account the correlation of the quality of service, is of particular importance. In choosing the service, the CASP method is used [13]. This method checks the quality of service correlation of all services and prunes those candidate services without optimal quality values.
By increasing the number of candidate services for each class in the service plan, the redundant services increase the time complexity of the service selection process. In order to reduce the complexity of service selection, the pruning algorithm of preprocessing for candidate services is introduced to remove the redundant services from a set of candidate services. In the candidate service set, all the uncorrelated services are eliminated except the services with optimal default values. For two distinct services, if there is more than one correlation between the set of candidate services, only a correlation with the optimal quality value is maintained, and the other candidate services are deleted. Each class is a step in the candidate pruning service algorithm. For each class, the pre-processing of the selection of the candidate services set is done in two steps. The first one finds the service with the optimal default value and removes all the uncorrelated services. The second step eliminates the services with non-optimal correlations. Since a service may encounter a one to several and several to one correlation, the algorithm continues to find other involved correlations if a correlation is worse than the others.
Preprocessing example.
Figure 4 shows an example of service pruning that assumes the quality parameter is the cost of implementing the service, which is labeled within each service for simplicity. All the correlations between the services are specified with two values: the first number is the default service cost, and the second number indicates the cost of service correlation. The arc between the services shows the correlation between the services. For example,
In this step, the research uses the proposed algorithm in [1, 14]. The web service dynamic selection approach (WSDSA) uses an adaptive adjust method (AAM) based on fuzzy logic and the adaptive particle swarm optimization (APSO) to decompose global constraints into local constraints based on user preferences [1, 14]. The WSDSA decomposes all the service components of each task in several separate quality sets according to the global service quality constraints. After each component of the task
The service selection algorithm steps are presented as follow:
Step 1: Selection of quality levels and calculation of the value of the utility function of the quality levels
The purpose of this step is to determine a small set of values for the quality of each service parameters to display the service set. This step consists of three phases [14]: sorting, partitioning, and selection. In the first phase, candidate services are sorted according to the quality parameter values. In order to partition candidate services, the number of quality levels (
Determination of the quality level of services example [14].
Figure 5 shows an example of the determination of the quality levels of services. In the first step, the values of the quality of service parameters are sorted. In the next step, the division of values of the quality parameters is shown in several quality levels. In the third step, the candidate services are selected randomly, and the highest value of the repeated quality parameter is selected as the sample value.
Each quality level is mapped to a value of
The value of
Step 3: Finding the optimal quality levels through the APSO algorithm
The particle swarm optimization algorithm is quickly trapped in the local optimal due to its simple structure, and the phenomenon of early convergence occurs. Therefore, by applying the fuzzy rules in the PSO algorithm, this algorithm is converted to APSO. Fuzzy rules are used to dynamically adjust the inertia weight w at different stages of the convergence of the particle swarm algorithm to adaptively adjust the global coefficients by considering the efficiency of the search and the search precision. The higher amount of inertial weight ensures the ability to search globally at the initial stages of the algorithm, and the lesser inertia weight accelerates the convergence [15].
The particle example [16].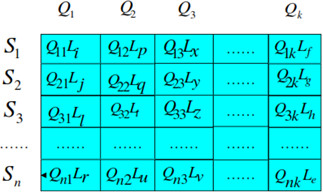
In order for the APSO algorithm to find an optimal quality level, a good particle must be created to encode the problem. In this research, each particle is expressed as a two-dimensional array of integers, indicating an index of selected quality levels of tasks. An example of a particle is shown in Fig. 6. Each row shows the tasks, and each column shows the quality of service parameters. In other words, the
At each stage of the APSO algorithm, the particle behavior randomly occurs in three directions: following the path of the particle itself, returning to its best previous location, and going to the best previous or current location of the particle group. The particle behavior in this algorithm is expressed in Eqs (5) and (6) [15]:
where
The utility function of the particle is obtained similar to the method of Liu et al. [16] that must consider the two conditions. First, only one quality level (
Step 4: Selection of the candidate service components at each level
After completing the above four steps and finding the optimal quality levels, the candidate services that are not of a quality level are eliminated; then, according to user’s preference and the amount of utility function, the appropriate services are selected for the composition and used as the initial population of genetic algorithms.
Weighting quality level in APSO algorithm service selection.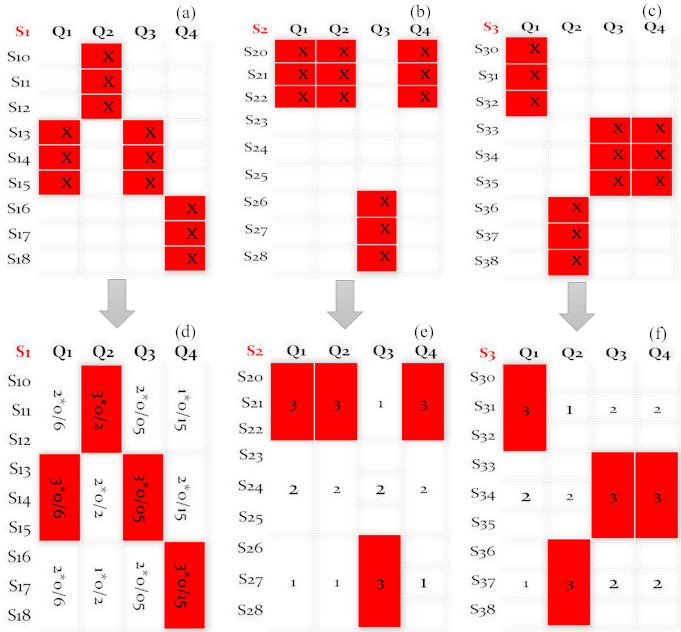
In the service composition process, the candidate services selected in the previous step must be combined. In this research, a fuzzy genetic algorithm is used. Each chromosome represents a composite service candidate. Each chromosome is thought of as a string with values of 0 or 1 for each gene.
A typical chromosome of the proposed solution for problem-solving in the genetic algorithm is shown in Fig. 7. The value of the coding string is used to express the status of the candidate service component.
Population initialization
The population initialization in the genetic algorithm is important because it has a direct impact on the rate of convergence of the genetic algorithm. The weighting method shown in Fig. 7 is used to select the task components in the service composition; the optimal quality levels shown with the red background have the highest weight, and the maximum weight of the optimum quality levels (
In Eq. (7),
As previously stated, the user specifies the quality parameter’s preference through the weight factor. Therefore, the sum of the result of multiplying the weight of the quality levels in the coefficient of weight of the quality parameter is a criterion for choosing the candidate services, which is obtained from Eq. (8):
Then, service components are arranged based on the calculated value, and a number of candidate services with the highest value are selected as the initial population of the genetic algorithm for the composition of the service.
As an example, in the task
In the utility function, each task includes different functionally equivalent services with different quality of service parameters. Also, the weight coefficient of the same quality parameter varies in different tasks. Therefore, the value of the quality parameter and the weight factor of each feature of the tasks are shown in a matrix. Using the data encoding of the genetic algorithm, the problem utility function is defined from Eq. (9) [10]:
where
Creating subsequent generations of the population is based on selection, crossover, and mutation operators. These operators create a new generation of chromosomes, which are different from the previous generations. In fact, the population of subsequent generations is produced by selecting the pair of chromosomes to combine.
Selection operator
The appropriate
By observing the result of implementing the selection operator, the instances with a higher utility value are easily selected.
Calculation of the probability of crossover using fuzzy rules
According to the method used in calculating the probability of crossover and the probability of mutation proposed by Srinivas et al. [21], excellent instances are produced with great utility values, and the rate of change in the instances is accelerated with smaller utility values. The formula for calculating the probability of crossover is shown in Eqs (11) and (12) [10]:
where
In order to avoid falling into the local optimal trap (the convergence of the utility values of the instances in the current population), the probability of the crossover operator increases by increasing the standard deviation of the population utility values from the desired chromosome. For optimal population stability, if the utility values of the selected chromosomes instance are optimal in terms of the quality parameter and sufficiently close to the maximum population utility of the current population, the probability of the crossover operator decreases.
Suppose that
The mean distance of the utility value from the best fit utility The distance between the utility values Utility values
and
Using the parameters specified as fuzzy logic controller inputs, the above rules are presented in the form of the following fuzzy rules [22]:
IF IF Var is small AND IF IF
For example, in the first rule,
Similarly, in the second rule, the closeness of the mean population utility to the maximum amount of utility reduces the Var value, and therefore, with the reduction of the probability of crossover, there is no need to use these instances in the production of the next generation.
In the third rule, by increasing the difference in the amount of utility of the instances with the maximum utility value shown with the variables
According to the fourth rule, by reducing the value of variables
The input parameters are in the range of [0, 1]. For each input variable, a membership value is defined using the membership function [22] in Figs 8 and 9.
Membership function of input parameters.
Membership degree 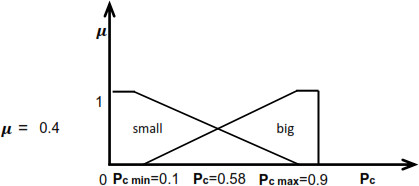
The Mamadani defuzzification procedure is used in every fuzzy rule.
Mutation
Comparing response time proposed method and APSO algorithm [1] (variable number of candidate services and the constant number of task).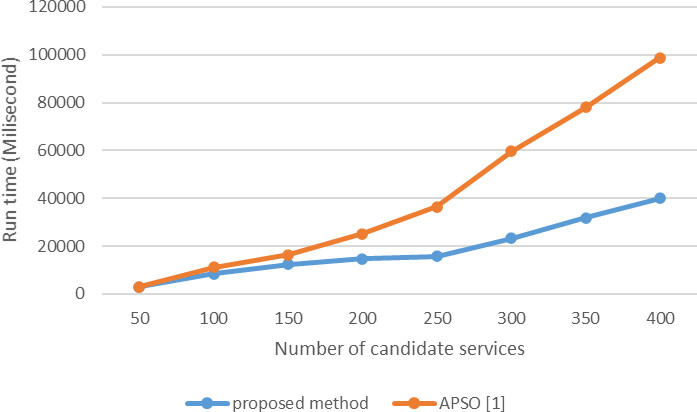
Comparing response time proposed method and APSO algorithm [1] (constant number of candidate services and the variable number of task).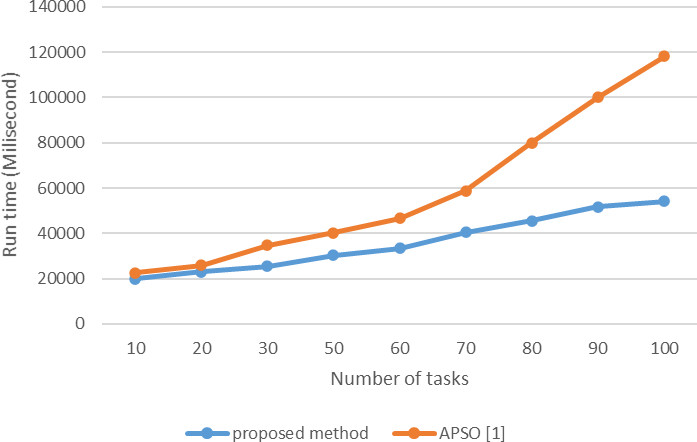
If the current chromosome utility value is close to the maximum utility value, the probability of mutation is lower. Therefore, the probability of mutation is obtained from Eqs (13) and (14) [10]:
where
To improve the mutation [22], the following rules are used:
If the population utility value is optimal in terms of the quality parameter, and the utility deviation of the desired chromosome is less than the maximum utility value, the probability of the mutation operator increases. If the current population has a large deviation, the probability of the mutation operator decreases.
Using the Var and
IF Var is small AND IF Var is small AND IF Var is big THEN
Comparing response time APSO algorithm in proposed method and APSO algorithm [1] (variable number of candidate services and the constant number of task).
Comparing response time proposed method and APSO algorithm [1] in large scale (variable number of candidate services and the constant number of task).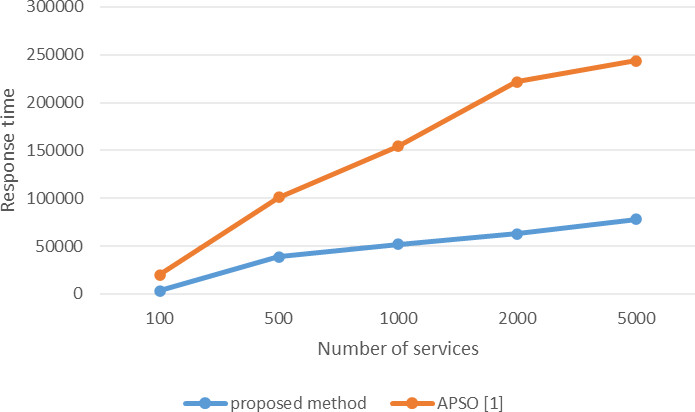
Comparing response time proposed method without pruning of candidate services and APSO algorithm [1] (variable number of candidate services and the constant number of task).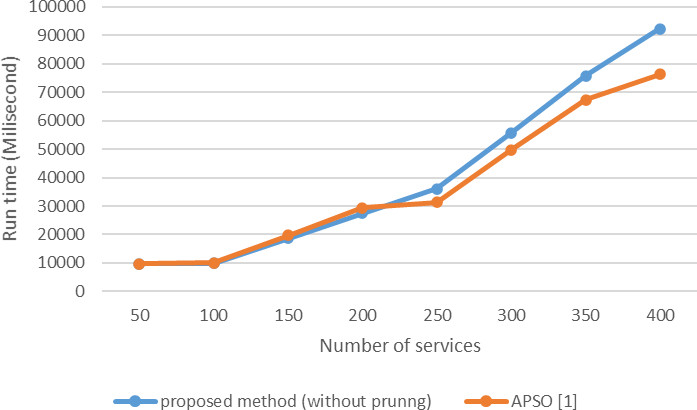
Comparing response time proposed method without pruning of candidate services and APSO algorithm [1] in large scale (variable number of candidate services and the constant number of task).
Comparing response time proposed method with constant number of quality level and APSO algorithm [1] (variable number of candidate services and the constant number of task).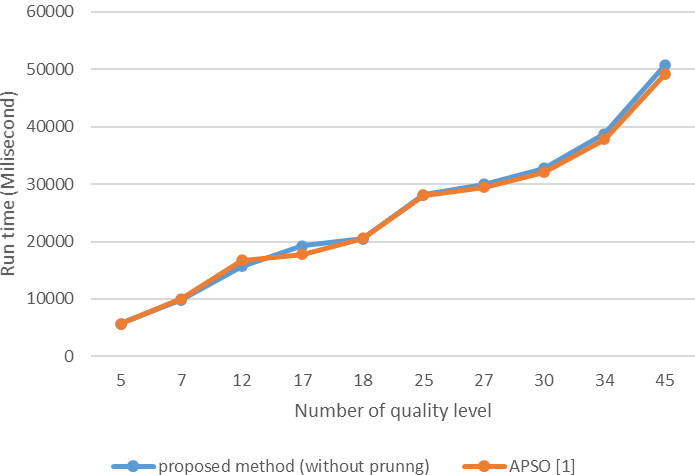
In the first law, the low value of the Var variable means the suitability of the population utility value, and the largeness of the variable
According to the second rule, the small value of variables Var and
In the third rule, because of the inappropriateness of the average instance size (Var), the probability of mutation is reduced.
Comparing memory consumption of proposed method and APSO algorithm [1] (variable number of candidate services and the constant number of task).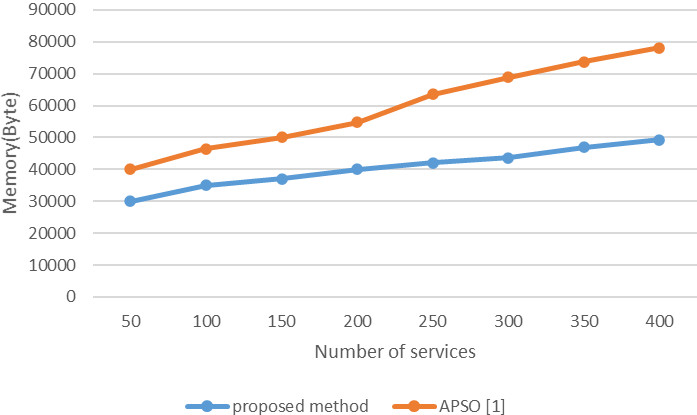
Comparing memory consumption of proposed method and APSO algorithm [1] in large scale (variable number of candidate services and the constant number of task).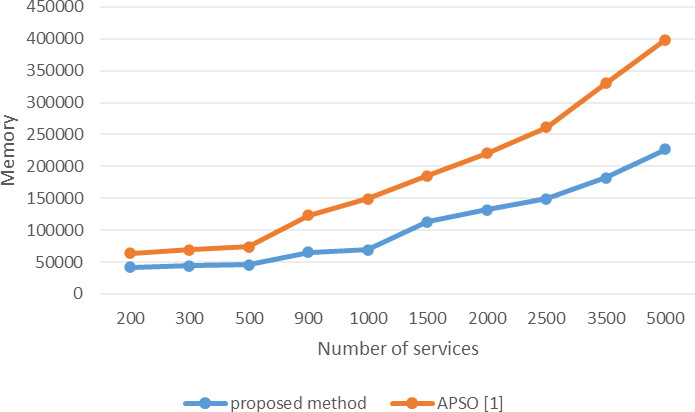
In order to evaluate the effectiveness of the algorithms proposed in this paper, a data set randomly generated with a different number of services and different values of QoS parameters, and the correlations were randomly generated. The experiments were implemented on a computer with a Pentium Intel (R) Core (TM) i3-4160 CPU @ 3.60 GHz, 4 GB of RAM and a Windows 7 operating system.
In this study, the proposed method was compared with the services composition based on a genetic algorithm and quality of service-awareness provided by Chen et al. [1] in different ways. First, in terms of response time, they were investigated with the variable number of candidate services. Second, the use and non-use of pruning algorithms in the selection of candidate services were compared in terms of time. Third, the response time was assessed by the constant number of candidate services and the fixed number of quality levels. Fourth, this comparison is done in terms of memory consumption and the results are shown. The details of the comparison diagrams of the proposed method and the APSO algorithm [1] are described in more detail in the following sections.
In Fig. 10, the response time of the proposed method and the APSO algorithm are compared and shown with the variable number of candidate services and the constant number of tasks. The number of tasks in this comparison is 10, and each task can have between 50 and 400 services. The horizontal axis indicates the number of candidate services, and the vertical axis of time is shown in milliseconds. As shown in Fig. 10, the response time of the algorithms increases with the increasing number of candidate services in the range of 50 to 400; according to the studies, the deviation of the response time values in the proposed method in comparison with the APSO [1]algorithm is higher with the increase in the number of candidate services.
As the number of candidate services increases in the range of 50 to 200, the response time of the algorithms increases; according to the studies, the deviation of the response time values in the proposed method is not significantly different from the APSO[1] algorithm. Therefore, in the proposed method with a lower number of candidate services, no significant change is observed in the APSO algorithm.
With the increased number of candidate services ranging from 250 to 400 service candidates, the response time of the proposed method is significantly reduced when compared to the APSO algorithm. Obviously, in the proposed method, with an increase in the number of candidate services, there is more deviation from the APSO[1] algorithm.
Figure 11 shows the evaluation results with the number of variable tasks and the constant number of services for each task. In this comparison, the number of services per task is 50 and the number of tasks is between 10 and 100. As shown, when the number of tasks reaches 60, the difference between the proposed method and the APSO algorithm [1] becomes significant in terms of speed. This is because in the proposed method using pruning of non-correlated services, the number of services is reduced before selecting candidate services.
On the other hand, in Fig. 12, the execution time of the APSO algorithm in the proposed method and the proposed algorithm in [1] are shown with the variable number of candidate services and the constant number of tasks. The horizontal axis shows the number of candidate services, and the vertical axis shows the execution time of the APSO algorithm in milliseconds. As shown in Fig. 11, the response time of the algorithms increases with an increased number of candidate services in the range investigated (50 to 400 candidate services); according to the studies, the deviation of the response time values in the proposed method in comparison with the APSO[1] algorithm is higher with an increase in the number of candidate services. A comparison of Graph 2 (APSO algorithm execution time) with Graph 1 (full execution time of the algorithm) shows that the maximum execution time is related to the APSO algorithm.
Figure 13 compares the two methods in terms of scalability with increasing number of services. In this comparison, the number of tasks is 10 and the number of services is between 100 and 5000 for each task. As the figure shows, with the increase in the number of services to 1000, the response time of the proposed method is better than the PS method, and this improvement is due to the pruning of services as well as the use of fuzzy rules in genetic algorithm operators.
Evaluation of the efficiency of the proposed algorithm using the pruning algorithm
In order to investigate the importance of the pruning of candidate services in the proposed method, the implementation time of the proposed method is compared with the APSO[1] algorithm without pruning the candidate services, see Fig. 14. As shown in the figure, the increase in the number of candidate services in the range of 50 to 200 shows that there is no significant difference between the two methods, and with an increase in the number of candidate services from 250 to 400, the implementation time of the proposed method is less than that of the APSO[1] algorithm. Figure 15 also shows similar results for more candidate services. As the figure shows, the difference between the two methods is not very significant, and the APSO algorithm [1] is slightly better in terms of response language, because the proposed method uses two algorithms, PSO and Genetics, to selection and composition of services, respectively.
Evaluation of the effectiveness of the proposed algorithm with the fixed number of quality levels
Figure 16 illustrates the effect of the number of quality levels on the response time of the proposed method and the APSO [1] algorithm. As shown in the figure, with an increase in the number of quality levels, the execution time of both algorithms increases to the same ratio. It can be seen that the response time of both approaches increases with an increase in the number of candidate services.
Evaluation of the proposed algorithm based on memory consumption
Figures 17 and 18 compare the proposed method in terms of memory consumption with the PS method on two scales, small and large, respectively. As these two figures show, the proposed method has significantly reduced the search space due to pruning services. This reduction is better done in a large number of services.
Conclusions
One aim of this research is to select the appropriate services by satisfying the constraints of the quality parameters of the service while considering the priorities of the users and the dependence between the services. This is done in such a way that in the process of selecting the number of candidate services by removing the services without correlation decreases the search space and improves the performance. Another aim is the combining of services based on the fuzzy genetic algorithm. Based on the proposed method, the service selection phase is tailored to the limit of the quality parameter and the requested user restriction among all the available services, as well as the filter services that are not in compliance. Therefore, the combination is only performed on a set of services in accordance with the user’s request, which reduces the number of candidate services and search space. By limiting the service selection stage, the total time of the combined process is reduced, and its performance is maintained. In the composition stage, using the genetic algorithm and fuzzy rules in the calculation of the probability of genetic operators, the number of candidate services and the search space of the compound decreases. Finally, the combination of optimal service is achieved according to user preferences and qualitative parameter constraints. Our evaluations show a significant improvement in terms of computation time while achieving close to optimal results. In this paper, we only considered the service plans with a sequence structure. In our future work, we will future work include service plans with more complex structures. Furthermore, more complex scenarios with requirements on multidimensional QoS attributes will be taken into account.