
Abstract
The aim of this study is to predict the profitability of Indian banks. Several factors both internal and external, affecting bank profitability were derived from extensive review of literature. We used Artificial Neural Network (ANN) with cross-validation technique to perform predictive analysis. ANN was chosen due to its flexibility and non-linear modelling capability. Several structures of ANN with a single and two hidden layers along with varying hidden neurons were implemented. Further, a comparison was made with the multiple linear regression (MLR) model. We found the models based on ANN to offer very accurate results in prediction and are marginally better as compared to the regression model. Higher accuracy of the model makes a significant difference due to the astronomically large size of the balance sheet of banks. This article is unique in the approach of handling the panel data for predictive analysis wherein the training of the model was done on a single bank’s data, thus, reducing the panel data to a time series data. This approach shows the ability to work with large panel data and make accurate predictions.
Keywords
Introduction
Efficient banking system channelizes savings into productive investments and enhances the performance of economies. In the developing countries, banks are the main source of finance for the firms [1] and therefore a robust and well managed banking system can help reduction in poverty and income inequality through economic growth [2]. The current profitability of banks boosts up economic growth [3] especially during the period of bad economic conditions. Well-earning banking sector can take risk, increase lending and help arresting downturn in economy. On the other hand, low profitability reduces willingness and ability of banking sector to lend; as a result, economic downturn is further aggravated [4]. Thus, profitability of banking sector is important for stability of economy [5].
In recent years, health of banking industry in India, is showing declining trend, in terms of quality of assets as well as profitability. In 2017–18, scheduled commercial banks in India, reported gross non-performing assets of 11.6% and losses of Rs.324 billion [6]. The position of gross non-performing assets (GNPAs) of banking industry in India as on 2018, is second worst in the world. In addition, GDP growth rate of India has declined from 8.17% in 2016 to 6.98% in 2018 [7]. The Reserve Bank of India has warned that the alarming situation of growing GNPAs and losses of banks may endanger the stability of the banking sector in India [6]. In view of this, the present study which predicts profitability of banks in India is important. The level of banking sector profitability is an important forecaster of imminent financial crisis; however, it is difficult to monitor it because the components of profit of the banks are observed only at the quarterly intervals. Therefore, study of the influence of operational and macroeconomic indicators on bank profitability is important [8].
The factors influencing the profitability of banks have been widely studied in literature, which are classified as bank specific [9], macroeconomic [10, 11] and industry specific factors [11]. [12] has found that profitability is strongly related to bank’s concentration in the home market, government ownership, central bank discount rate, long term government bond rate and rate of growth of assets. [13] have studied bank profitability in low, middle and high income countries using internal variables such as capital ratio, cost to income ratio, ratio of loan loss provisions to total loans, growth rate of deposits, total assets, proportion of interest income to total income and cost of funds. The macro-economic and industry specific factors used were effective tax rate, inflation, growth rate of GDP, per capita GDP, market capitalization to GDP ratio and bank concentration ratio. It is found that market concentration which indicates monopoly power of the bank positively influences profit in low income countries. Furthermore, banking business in low income countries is found to be characterized by higher margins as the markets are less competitive as compared to high income countries. However, [14] opines that higher concentration of the bank encourages management to take more risk and hold risky assets in pursuance of higher profits. [9] have found that bank profitability is determined by firm specific factors viz. size, capital, cost management, credit risk, liquidity and market concentration as bank specific factors, in addition to GDP and inflation as external factors. It is found that the profitability of banks is not only influenced by the factors related to management decisions but also by the changes in the external macroeconomic environment [15]. Moreover, higher levels of equity in banks is found to influence profitability positively, whereas asset quality is found to be negatively related [16]. Similar results have been found by [17] that size and capital ratio are significant factors affecting bank profitability positively whereas higher loan loss provisions which are indicative of lower asset quality influence profitability adversely.
It is highly important for the individual banks to monitor its profitability continuously, to ensure that it is improving and declining trends are arrested in time. Lower profitability reduces ability of the bank to raise capital from the market which is necessary for lending. It also reduces incentive for the banks to make good loans as these are associated with low returns. In general, banks with low profitability are tempted to gamble by lending to risky borrowers which are ready to pay higher rate of interest. This in turn, increases non-performing assets of the banks reducing profitability in medium and long term, due to higher loan loss provisions [18]. Thus consistently declining profitability adversely impacts capital adequacy, asset quality and earnings as well as liquidity, making a bank fragile, endangering its existence [19]. Further, declining profitability and asset quality of large number of banks in an economy can limit the impact of fiscal policy as well as monetary policy of the central bank of the country which will have adverse impact on economic growth [20]. Furthermore, profitability of banking sector is important as it helps in reducing the impact of business cycles on the financial stability of an economy. The profitable banks being well capitalized can take risk and lend when borrowers need money in adverse economic conditions. Thus profitable banking sector can reduce the negative impact of downward cycle in an economy. On the other hand banking sector with low profitability will be reluctant to take risk and lend thus resulting in denial of the credit when needed. This will further aggravate the business cycle jeopardizing financial stability [4]. Financial stability of an economy is also impacted by the levels of idiosyncratic risk and systemic risk to which the banking system is exposed. The lower level of these risks is associated with higher financial stability and vice versa. It is found that higher profitability provides higher equity, encourage prudence and reduce risk taking by the banks. Thus enhanced profitability is linked to low idiosyncratic and low systemic risk and higher financial stability [21]. Therefore, continuous monitoring of profitability of individual banks and the banking sector as a whole is necessary. This will ensure timely arresting of downward trends and improvement in bank profitability which in turn will result in economic growth and financial stability.
The most commonly used industry specific variable by researchers is concentration ratio which represents monopoly power of the industry. The studies by [14], and [15] suggest that monopoly favourably influences profitability of banks. However, some studies have found that monopoly negatively impacts bank profits due to dis-economies of scale [22, 23]. In view of conflicting conclusions, we have not considered inclusion of this variable in our study. Moreover, sample size under study, measured by credit portfolio, constitutes a very large portion (90.72% on an average) of total credit extended by scheduled commercial banks in India. Sample size, being large, captures industry specific factors in a major way. Therefore, we have not considered industry specific variables in our study. We have used only bank specific and macroeconomic variables.
Previous studies on bank profitability show the wide use of regression whether pooled ordinary least square (OLS) or fixed effect and random effect [9, 12, 15, 16, 17, 24, 25, 26, 27]. Generalised Method of Moments (GMM) is another method that has been employed in the earlier studies [13, 28]. GMM offers several advantages as compared to the pooled OLS and fixed/random effect regression [29]. [24] also performed the computation of x-efficiency (cost and profit). However, these methods of analyses take care of only the linear relationship between the dependent and independent variables. Artificial Neural Network (ANN) provides the advantages over these methods as it is very flexible, can handle non-linear dynamics and is able to perform any complex function mapping with arbitrarily desired accuracy [30, 31]. ANN is also less stringent about data assumptions [32].
ANNs offer a method for characterising synthetic neurons like human brain for solving complex problems. For the past few decades, there has been a growing interest in studying mechanism and structure of human brain, and it has resulted in the development of new computational models, connectionist systems or ANNs (which are biologically inspired) to solve various complex problems such as pattern recognition, fast processing and adaptation, etc. [33]. ANN has been applied to different problems in various fields. It has been used in bankruptcy predictions [30, 32, 34, 35], forecasting of sales [36], inflation [37]; prediction of stock market [31, 38, 39, 40, 41]; credit evaluation [42]; insurance [43]; drought [44], energy consumption [45], municipal solid waste [46]; character recognition [47], image recognition [48], among others. Recently, [49] also used ANN in predicting bank profitability for state deposit money banks in Turkey.1
The purpose of this study is to predict the profitability of banks. For this, we used ANN due to its flexibility and capability of non-linear modelling. Pre-processing of the data was done applying data interpolation and data normalization. We trained the ANN models on the time series data of a single bank. We implemented several structures of ANN including a single and two hidden layers. Varying number of hidden neurons ranging from 9 to 200, were used in the models. Similar approach was used in the multiple linear regression (MLR) model and a comparison was made between ANN models and MLR Model. We found that the ANN models are able to predict the bank profitability very accurately with the low error as reflected by RMSE. It is observed that ANN models with two hidden layers generally offer better solution as compared to the models based on a single hidden layer. In addition, we observed that the ANN models performed marginally better in predicting bank profitability as compared to the regression analysis.
The remaining sections of the article are organized as follows: Section 2 presents the relevant literature pertaining to the factors influencing the profitability of banks. Discussion is centered around bank specific and macroeconomic. The rationale for the inclusion and exclusion of the variables are also presented. Section 3 discusses the methodology of the study. It presents the data sources, data pre-processing in terms of data interpolation and normalization, the modalities of the Artificial Neural Network (ANN), the structure of the ANN implemented, and the cross-validation technique employed to offer robustness to the ANN model, respectively. Section 4 presents the results and findings of both the ANN models and the regression analysis. Finally, Section 5 provides the conclusion, managerial implications and future directions.
Bank specific internal and macroeconomic factors
Bank specific internal factors such as capital, deposits, loans and total assets are found to positively influence bank profitability, so also macro-economic factors which are external to bank such as economic growth, inflation, and market capitalization [50]. In addition, private consumption is also found to be a significant factor [51]. The internal factors show the differences amongst different banks regarding sources and uses of funds, capital adequacy, liquidity management, management of operations, provisioning policy and management of expenses [17]. These factors are influenced by the policies, decisions and actions of the management which generate profit for banks [15, 50, 52]. We have used the bank specific factors namely i) Total shareholders fund ii) Liabilities iii) Liquid assets iv) Loans v) Non-performing assets vi) Non-interest income and vi) Non-interest expenses. We have selected internal input factors from balance sheet and profit and loss accounts, as the factors influencing profitability have their origin in these financial statements [53]. The macroeconomic factors selected as inputs, pertain to business environment and economic conditions. These are i) corruption ii) rule of law iii) GDP growth and iv) Inflation.
Bank specific internal factors
Total shareholders’ funds
Total shareholders’ fund comprises equity capital and reserves. It is found that equity capital favorably impacts bank profitability but reserves impact profitability negatively. As such, total share holders’ fund has mixed impact on bank’s profitability. This is because, reserves funds are associated with an opportunity cost [54]. In India, the share of total credit of public sector banks has fallen to 60% as on March 2019 from 75% as on March 2012 [55]. But still, government owned banks constitute major portion of banking business. It is found that profitability is negatively impacted by government ownership. This is because large amount of savings are transferred to meet the objectives of public policy rather than for commercial purposes. Thus, for improvement in profitability, it is necessary to lower government ownership, liberalize banking system and promote corporate culture [56]. The government ownership of banks is mostly found in developing countries with poor governance and low protection rights of the people which are associated with high costs and higher net interest margins [57].
Liabilities
The liabilities constitute deposits, borrowings and short term liabilities. Amongst the other factors, profitability of the bank is determined by structure of its liabilities [54]. Further, management of liabilities (resource funds) strongly influences interest expenses which is an important determinant of bank profitability [58, 59, 60]. The deposits include savings, short term as well as long term deposits of the customers. Borrowings of the bank comprise short term borrowings from money market and long term borrowings from securities market. In addition, short term funds are available in the form of non-deposit short term liabilities which include un-paid expenses and loan losses. These funds are short term in nature and are available to banks without interest cost [54].
The interest rate payable is different in each category of deposits. The cost of short term borrowings depends upon monetary policy of the central bank and money market conditions and structure of financial system [61]. However cost of long term borrowings also depends upon the capital. Higher the capital of the bank, lower is the cost of bank borrowings [54].
The short term liabilities of the bank include provisions for loan losses which affect the profit of the bank in different ways i) it is direct hit on profit, ii) in India, regulatory provisions allow banks to count loan loss provisions as a part of tier-II capital. As a result, banks can take or delay earnings hit by making provisions for loan losses, iii) this may permit banks to maintain adequate regulatory capital (Capital Adequacy Ratio) and hold risky loan portfolio. This in turn may increase loan provisions in future [62].
Liquid assets
Profitability of banks is strongly linked with amount of liquid assets [9, 63, 64, 65]. The liquid assets of the banks in India, comprise cash and balances with Reserve Bank of India; balances with other banks, money at call and short notice and investments in government securities which bring low earnings. However, there is no evidence to support the view that lower the amount of funds invested in liquid assets, higher will be the profitability levels. On the contrary, it is found that higher investment in liquid assets is associated with high profitability [66]. The banks in India are required to keep cash balances with the Reserve Bank of India in proportion to their Net Demand and Time Liabilities (NDTL). This proportion is mandated at 3% of NDTL with effect from 27
The significantly a large portion of assets of banks in India constitute investments. The banks are required to invest 18.25% of Net Demand and Time Liabilities (NDTL) in from of approved government securities as a statutory requirement. These are highly liquid investments and carry lower rate of returns as compared to average return on loans. However banks are investing 8.4% (of NDTL, as on 28
Loans
Loans and advances significantly contribute to the profitability of banks [26]. However, interest income depends upon the structure of advances and the contractual interest rate charged by the banks [54]. It is found that the amount of profit earned increases with its size i.e. total assets [72, 73]. This is due to increase in productive assets. However, in some cases productivity is found to be negatively related to growth of assets due to increase in low earning or non-earning assets [74].
Capital adequacy ratio (CAR)
Banks in India are required to maintain minimum 10% of risk weighted assets as capital. The proportion of capital to risk weighted assets (CAR) influences profitability of the banks [26, 58]. High capital adequacy ratio implies high capital and reserves. This reduces profitability of the banks as, equity capital is often costlier compared to borrowings. In addition, it comes with opportunity cost because these funds could have been profitably invested elsewhere. However, it also positively affects profitability in two ways i) higher capital adequacy ratio indicates financial soundness which enables banks to obtain external finance at lower rate. ii) In case the ratio is higher than mandatory ratio, banks can earn more interest income by expanding credit portfolio. Thus, higher capital adequacy ratio affects banks in different ways [75]. However, [54] found that higher capital impacts bank profitability favorably due to higher net-interest margins for such banks, but, reserves impact profitability negatively.
Non-performing assets (NPAs)
Messai and Jouini [76] have found that non-performing loans vary negatively with the growth rate of GDP and positively with the unemployment rate, the ratio of loan loss reserves to total loans and the real interest rate and have negative relationship with profitability of banks. Asset quality which is determined by proportion of NPAs to total assets, is one of the major determinants of bank profitability [25, 77]. As such, non-performing assets adversely affect profitability of the banks [54, 75, 78, 79]. We have considered gross as well as net NPAs as input variables since both affect the profitability in different ways. The net NPAs appear in the balance sheet of a bank and affect the profit negatively in two ways i) on account of loss of interest income ii) due to mandatory provision required to be made and iii) more supervision required [24, 74]. These may be due to endogenous factors like bad management which is unable to control risks and recovery costs [80]. The gross NPAs affect the profit positively as well as negatively. Banks take requisite legal measures for recovery of gross amount due from the borrower. Recovery in such accounts partly impacts the profit positively to the extent of write back of provisions. The legal and other expenses for recovery impact profit negatively.
Other income or non-interest income
Other income is non-interest income from the sources other than lending (such as fee based business) which constitutes an important source of revenue for banks [81]. Its significance for augmenting profitability increases when net interest margin is declining [82]. Thus, banks can increase profitability by increasing other income [25].
Non-interest expenses
We have considered staff expenses, operating expenses (excludes employee cost & depreciation) and total provisions and contingencies under this variable. It is found that profitability of the bank is strongly linked to total cost which includes interest cost and non interest cost [9]. The interest cost depends upon structure of liabilities as it influences the amount of interest expenses. Non-interest cost includes staff expenses, provisions for expenses, loan losses and for contingencies. Both the types of costs are significant factors reducing profit [83]. On the other hand, reduction in the interest cost as well as non interest cost enhances profitability [75]. The impact of staff expenses on the profitability depends on the productivity of staff. In case of high productivity, staff expenses can positively influence bank profitability [84]. It is also likely that high profits earned by the firm may be appropriated in the form of higher payroll expenditures [58, 85].
External factors
Some of the prominent macro-economic factors commonly used by researchers are as follows: i) Inflation [5, 14, 16, 25, 51, 53, 86, 87], and ii) GDP growth rate [15, 25, 51, 87, 88]. In addition, some researchers used growth rate of personal income [15], unemployment rate , exchange rate [88], and private consumption [51] as macroeconomic factors. It is observed that inflation and consumer price index are related. We have included inflation and GDP growth in our study. The ability of the banker to recover dues through legal action is constrained by the enforceability of the contract which depends upon the ‘rule of law’ in the country. Thus, the level of NPAs and hence the profitability of banks is related to the rule of law [89]. The factor ‘corruption’ has been included in view of India’s low rank (78) as per Corruption Perceptions Index, 2018 [90] as it negatively influences profitability of banks [54].
Corruption
The corruption by the bank officials and the borrowers is costly for the banks as well as for the economy. It is costly for banks because assessment and sanction of loans is not solely based on merit of the proposal, consequently increasing the chances of non-performing loans [91, 92, 93]. Moreover, the poor and unconnected persons are denied credit to improve their economic conditions and are deprived of contributing to economic growth [94]. It is found that corruption is an hindrance to firm’s growth [2]. Thus, corruption has negative influence on profit of banks directly and indirectly. The direct influence is through lower quality of assets and indirect influence is due to subdued growth of borrower firms and the denial of opportunities to the deserving firms [95, 96].
Rule of law
The rule of law ensures conducive legal and regulatory environment for the banks which in turn determines their ability to recover dues from defaulter borrowers [89]. The increased ability to enforce the law and recover the dues enhances the confidence of the bankers to lend further. This increases credit growth and the growth of economy, further boosting demand for credit [97]. Thus, the rule of law favorably impacts profitability of banks [54].
Gross domestic product (GDP) growth rate
GDP growth has positive influence on bank profitability [98]. Higher growth implies lesser chances of corporate as well as individual defaults [15]. Therefore, during the period of growth, banks are inclined to lend more [99] which increases their interest income. Thus, GDP growth enhances profitability of banks [53, 54, 100, 101, 102, 103, 104]. Some researchers are of the view that there is two way relationship between credit growth (which increases profitability) and economic growth [105, 106]. However, whatever be the direction of causality, profitability of banking sector is important for economic growth [107].
Inflation
It is found that profitability of banks is significantly influenced by inflation [7, 79, 101, 102]. Higher level of inflation reduces demand for credit and also causes cash flow difficulties for the borrowers increasing the chances of default and NPAs affecting net interest margins of the bank adversely [108]. Furthermore, high and variable inflation creates difficulty for banks in planning, negotiation and assessment of loans due to uncertainty in interest rates. This adversely affects quality of loan portfolio of banks [109] negatively impacting profitability [79, 88, 104]. However, the impact of inflation on profitability depends on whether it is expected or unexpected and whether interest rates are adjusted accordingly or not. In case, interest rates are adjusted, profitability will be impacted positively. If the banks are slow in adjusting interest rates, their interest cost can increase faster than interest income; causing negative impact on profits [110]. The studies by [111] for Malaysia and for Hong Kong by [86] found that higher inflation leads to higher bank profitability if banks adjust their lending rates with inflation. However, in case European countries, [88] found a negative relationship between inflation and bank profits. Furthermore, in general, for developing countries inflation is found to impact profitability of banks adversely, especially, when the banks have high capital adequacy ratio [54]. As such, the conclusions of studies regarding relationship between inflation and profitability are mixed.
Data and methodology
We used bank specific internal factors and external factors in predicting bank profitability. The data for internal factors or bank related factors is collected from annual reports available in Centre for Monitoring the Indian Economy (CMIE) Prowess database. Whereas, the data for external factors are collected from the World Bank database. The details of these variables are given in Table 1 and Appendix 1.
Data sources and data links for external factors
Data sources and data links for external factors
Source: compiled by authors.
The real data for all the indicators is available for the financial years (financial year in India pertains to the period from 1
where
Data normalisation
Multi-layer perceptron with two hidden layers.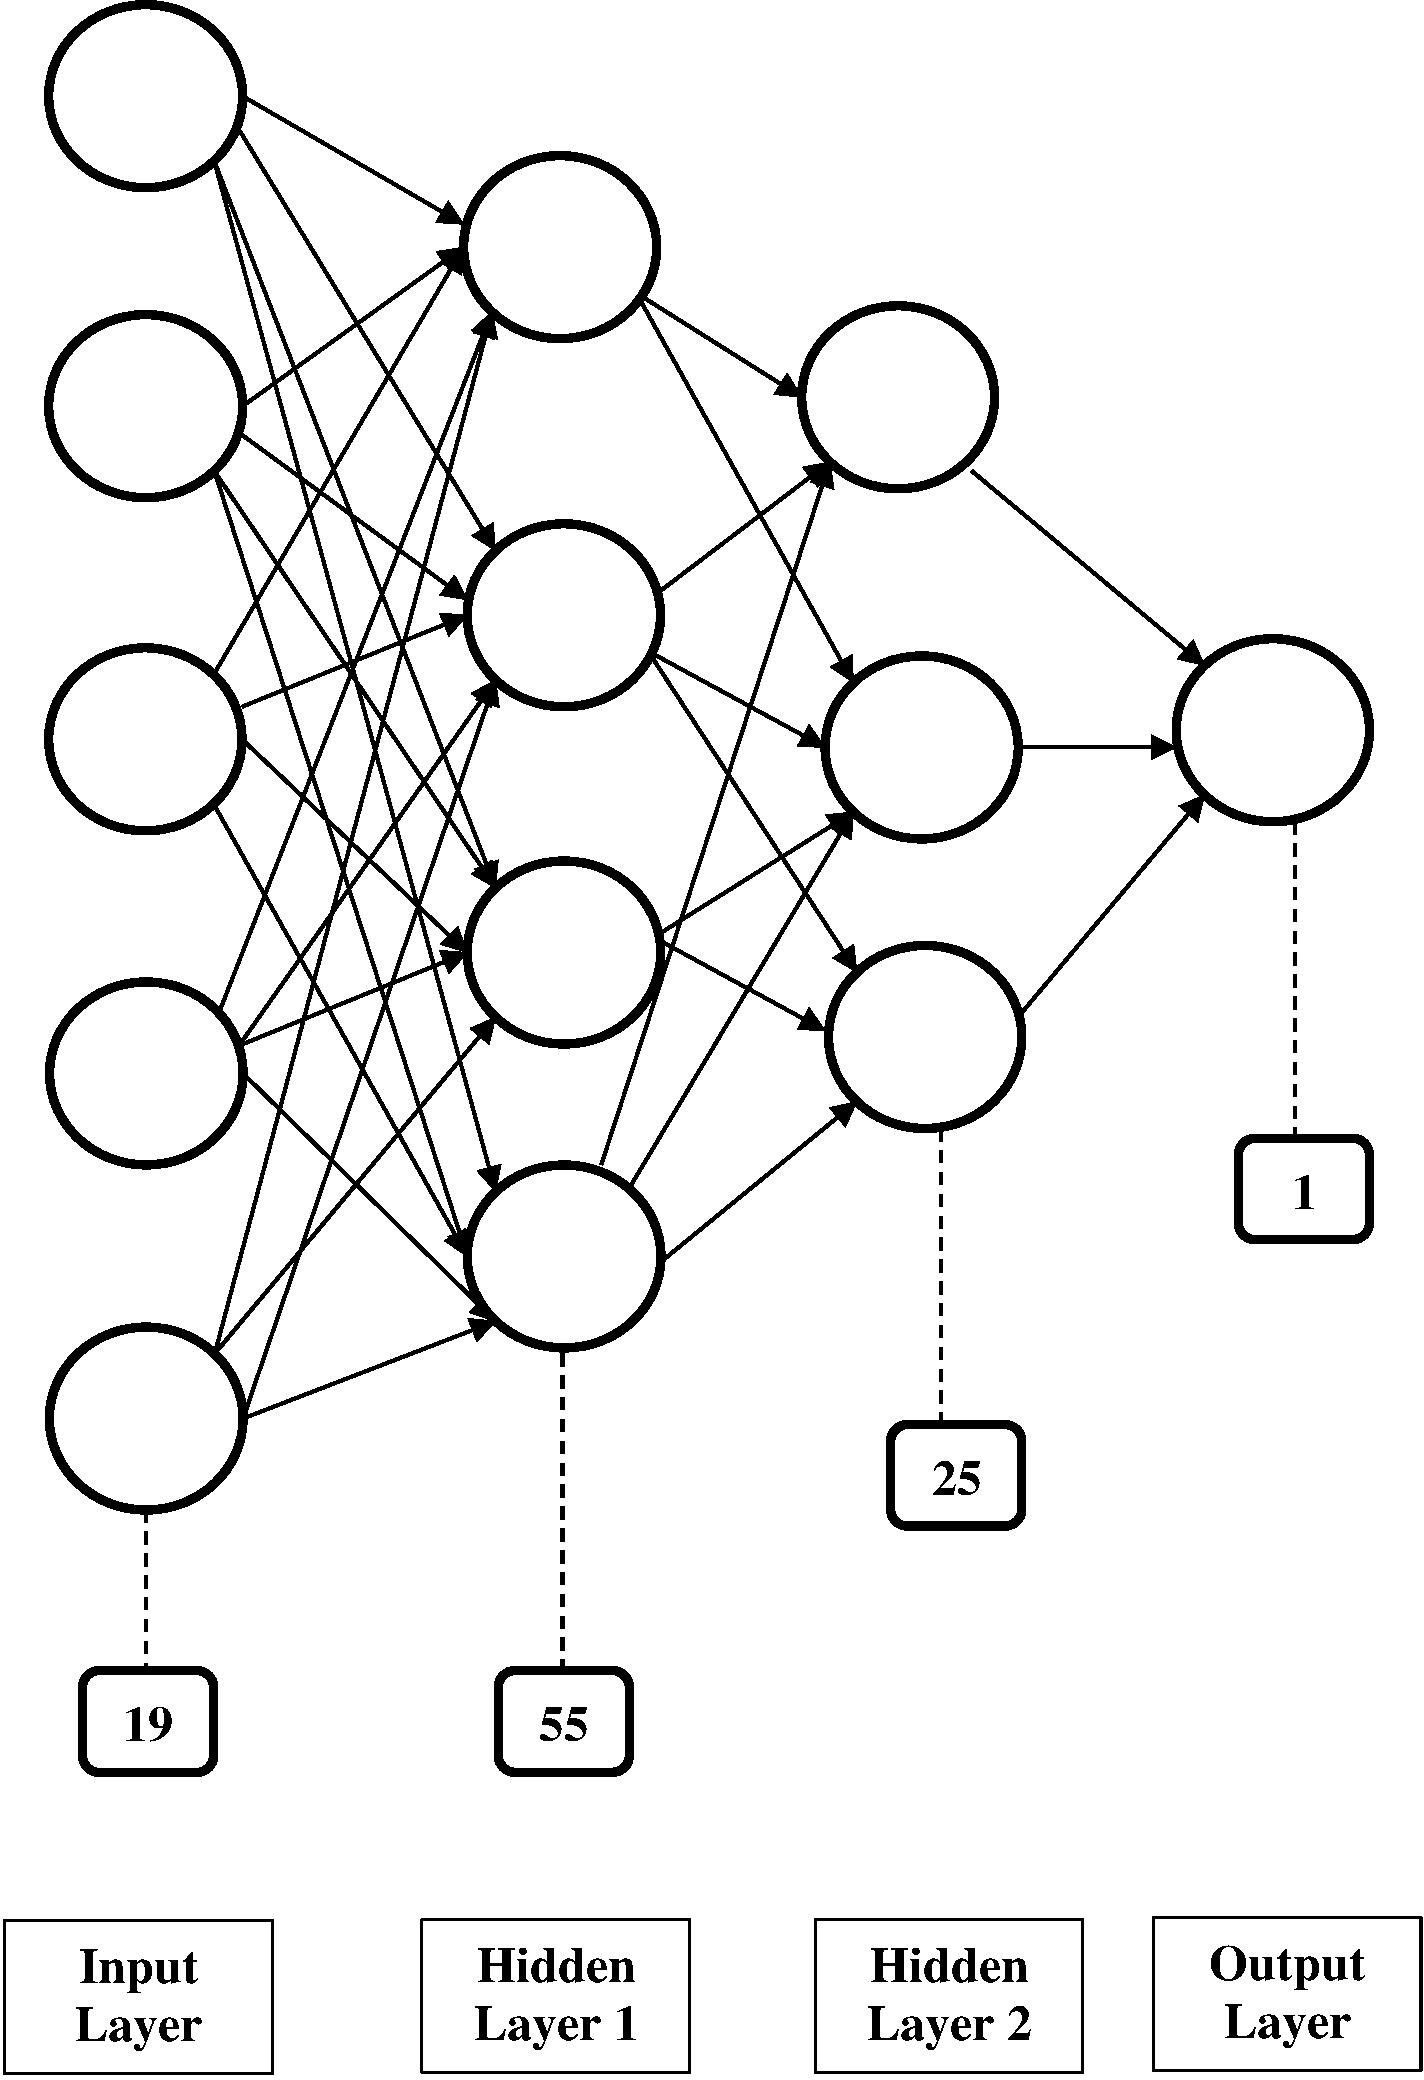
As the data are measured in different units, it is important to perform data normalisation. It is computed to obtain and improve the subsequent numeric computation and the resulting output. Similar to the previous studies, we implemented min-max scaling technique which scales the data from 0 to 1 [113, 114]. The benefit of it is exactly preserving every relationship in the data without introducing any bias. The derivation of normalisation is shown below:
where
ANN is a dynamic flexible and non-parametric modelling tool. With regards to the mapping capabilities, ANN can perform any function mapping with arbitrarily desired accuracy [30, 115]. One of the most widely used neural network architectures is referred to as Multi-Layer Perceptron (MLP) model. MLP consists of several layers of computing nodes. Each node in the MLP receives an input signal from the other nodes or external inputs after which processed signals through transfer functions are relayed to the other nodes or final output. In MLP, all nodes and layers are arranged in a feed-forward manner. The first layer in MLP is called the input layer in which the external information is fed into. In between, there can be one or many layers called hidden layers which are important for ANN to identify the complex patterns in the data. The last layer is called the output layer where the ANN offers the model solution [30, 32]. The MLP with two hidden layers, reflecting one of the ANN structures used in this study is shown in Fig. 1. This ANN structure includes the first layer with 19 inputs, two hidden layers (first hidden layer with 55 nodes and the second with 25 nodes), and one output.
The ANN is trained using back propagation algorithm with gradient descent and momentum terms [31, 115, 116]. The main purpose of training is estimation of weights so that the errors measured by mean squared errors (MSE), mean absolute errors, sum of squared errors, etc. are minimized [30]. Consistent with the previous studies [37, 115], we use root mean squared error (RMSE) to measure the accuracy of the ANN model.
where
RMSE and Mean Absolute Error (MAE) are the two error measures widely used not only in machine learning and data mining discipline but also in other disciplines such as time series, bio sciences, atmospheric sciences, etc. Several authors have argued that MAE is a better error measure in comparison to RMSE. RMSE and other sum of square measures are considered to be ambiguous and sensitive to sample size as compared to MAE. However, [117], based on large set of simulated data, showed that RMSE is not ambiguous in its meaning. In addition, RMSE is more appropriate in contrast to MAE when the errors are normally distributed. Both MAE/RMSE reaches a constant when number of observations,
In ANN there exists no formal method to derive a network configuration in arriving at a solution. A lot of factors such as hidden layers, number of hidden nodes, normalisation of the data, methodology applied in training the data set, among others can influence the performance of the ANN model. As such, the optimal or the best model is arrived through experiments [30]. For this study we use both a single and two hidden layers. The number of hidden nodes is not easy to determine a priori. Even though, there are several rules of thumb suggested for ascertaining the number of hidden nodes, e.g.,
Most of the modern neural networks apply ReLU functions. It is also the default activation function recommended to be applied in modern feed-forward neural networks [119, 120, 121, 122]. Application of ReLU to the output of a linear transformation yields a nonlinear transformation. This activation function has been found in improving the training of deep neural networks [123]. ReLU preserves many of the properties that make linear models easy to optimize with gradient-based methods and also this activation function helps to preserve many of the properties that make linear models generalize well [122]. ReLU is considered to perform better than other activation functions (e.g., sigmoid, tanh, linear activation function, softmax, etc.) in most cases as all the neurons are not activated at the same time. In some cases, the weights and biases are also not updated during backpropagation step of training the neural network, as the value of gradient is zero [124]. In the modern feed-forward neural networks, ReLU has replaced classical activation functions such as sigmoid, Tanh, etc. as those activation functions suffer from vanishing gradient problem [120, 121, 125]. ReLU is defined by the function:
With regards, to the choosing of optimizer for the neural network, at present, there is no consensus on the use of single optimizer. Currently, the most popular and widely used optimizers are SGD, SGD with momentum, RMSProp, RMSProp with momentum, AdaDelta and Adam. The optimization algorithm used for this study is “Adam”. The name “Adam” is derived from the phrase “Adaptive moments”. This optimizer was proposed by [126]. It is arguably the most used optimizer algorithm in the literature [122, 127]. It takes advantage of two other popular methods, i.e., AdaGrad [128] which works well with sparse gradients and RMSProp [129], which works well in on-line and non-stationary settings. Some advantages of Adam are that “the magnitudes of parameter updates are invariant to rescaling of the gradient, its stepsizes are approximately bounded by the stepsize hyperparameter, it does not require a stationary objective, it works with sparse gradients, and it naturally performs a form of step size annealing” [126].
Summary of the proposed ANN architecture
Summary of the proposed ANN architecture
MLP with drop out application.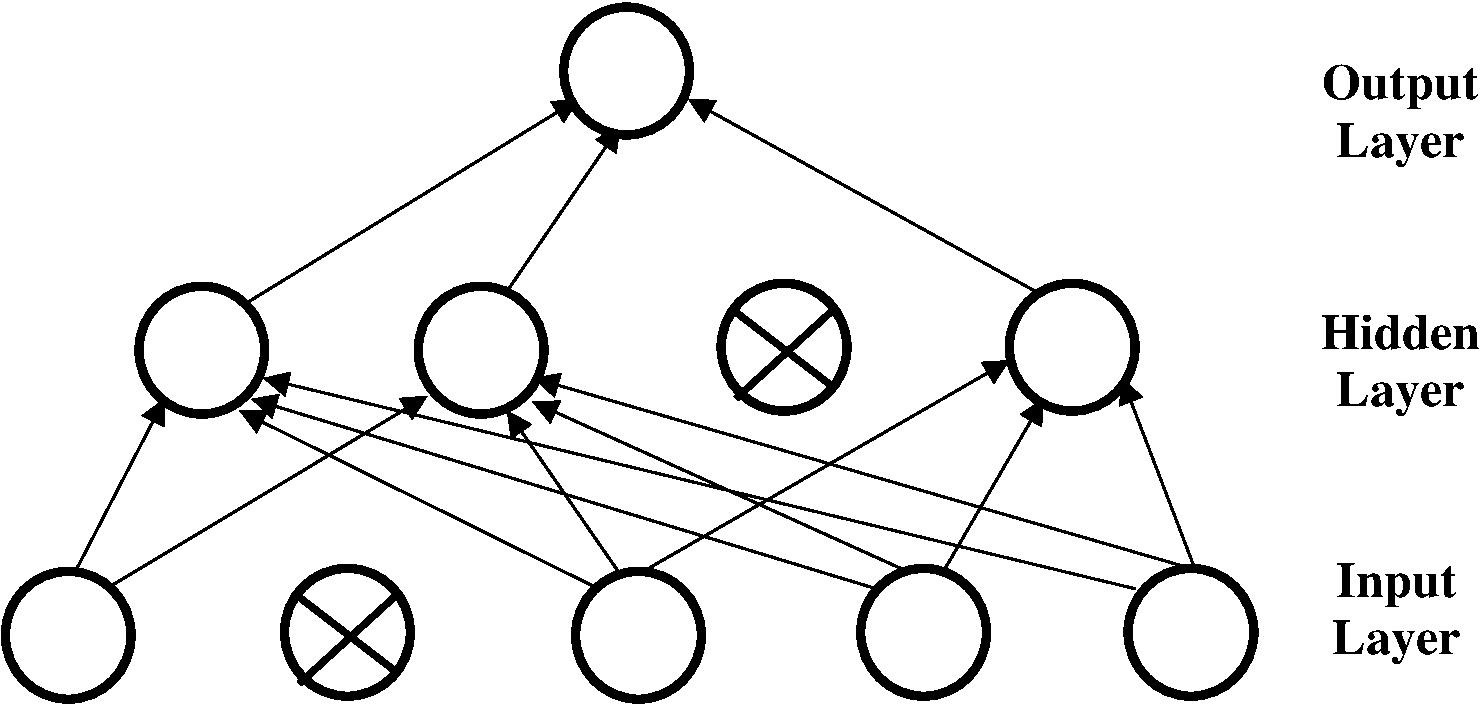
ANN models
Performance of the ANN and regression models
In order to avoid overfitting, we applied early stopping and dropout of nodes in the network. Early stopping is used for regularization in deep learning. Its popularity can be attributed to its effectiveness and simplicity [122]. We also used dropout technique which refers to dropping of the units both hidden and visible in the neural network. It has been shown that dropout technique can prevent overfitting problem while at the same time enhances the performance of the network models. It randomly chooses the units to be dropped out and temporarily removes them from the layer [130, 131]. We applied uniform dropout rate of 0.2 for both the input and hidden layers. The MLP with a drop out is depicted in Fig. 2. The epoch refers to the number of training samples offered to the network between weight updates [132]. We performed training of the model at epoch size of 1000. We also used the fixed learning rate of 0.01. Traditionally, learning rate are kept fixed during training the model and optimal learning rate are generally determined by trial and error [122, 132, 133].
In order to achieve more reliable accuracy and robustness of the ANN model, we employed cross-validation technique [134, 135]. Cross-validation is a resampling technique whereby a sample is randomly is split into training and test subsamples. The major benefit of cross-validation is that the entire sample is used for testing and most of them are also employed for training the model. It not only improves the robustness of the model with sampling variation, but also offers simple method for examining the predictive accuracy of the model [30, 32]. For this study, we used ten-fold cross-validation which carries out the simple cross-validation ten-times. In it, the sample is split in ten equal and mutually exclusive parts. Training is performed on any of the nine of the ten portions and testing is done on the remaining. As such, ten overlapping training samples are created and testing is also performed ten times. The average test score of the entire ten partitions is a good indicator for the out-of-sample performance of the regressor [30].
In this study, we trained the model using the interpolated data of Bank 1 for six years from 2010-11 to 2015-16 and validated the models on Bank 1 for 2016–17 and 2017–18. Further, using the same model/s we predicted the profitability of rest of the banks for the same period, i.e., 2016–17 and 2017–18.
The main reason for training the ANN model on a single bank dataset for several years rather than training it on the dataset of several banks for several years is for the simplification of the problem for the machine learning algorithm. This will make the ANN model learn the pattern from the historical time-series data of a single bank to predict the future performance of the same bank or different banks better. The summary of the proposed ANN architecture consisting of parameters for this study is shown in Table 2.
Results and findings
Results using ANN
We perform several ANN models with a single as well as two hidden layers having different neurons. Table 3 shows these ANN models with RMSEs of both the training set and validation of the models. As ANN is performed applying 10 fold cross-validation to increase the robustness of the model, the train error in terms of RMSE along with the mean RMSE of the 10 sub-samples is given for the training set. It can be observed that the errors of the models are very minimal in the training set as compared to the validation set. Of all the ANN models, RMSE in the validation of the model is lowest in model 7 followed by 6, indicating that these are the most accurate models. Thus, we show the prediction of bank profitability of these two ANN models only (see Tables 3 and 4). From Table 4, it can be seen that both the ANN models are capable of predicting the profitability of banks very accurately.
Multiple linear regression
We also perform multiple linear regression to make a comparison with the performance of ANN models. The RMSE of multiple linear regressions is 0.605 and it can be seen than the regression model performs well in predicting the performance of banks. On comparison with ANN models it can be observed that the best ANN models, i.e. ANN models 6 and 7 offer marginally better solution as compared to the regression model. In fact, majority of the ANN models, except for model 8 and 9, offer marginally better solution in comparison to regression model (refer to Tables 3 and 4).
Conclusions and future directions
In this article, we predicted the profitability of banks applying ANN. Based on substantial literature review, factors affecting the bank profitability were considered in a comprehensive manner wherein bank-specific and external factors were covered. Several ANN models with different structures, i.e. a single and two hidden layers and hidden nodes ranging from 9 to 200 were implemented. To avoid overfitting problems, both early stopping and dropout techniques were applied. The ANN models were trained on the time series of a single bank. We found that the ANN models are able to predict the bank profitability very accurately with the low error as reflected by RMSE. It is observed that ANN models with two hidden layers offered better solution as compared to the models based on a single hidden layer. To compare with the ANN models, we also performed regression analysis applying the similar approach of training the model on a time series data of a single bank. We observed that the ANN models performed marginally better in predicting bank profitability as compared to the regression analysis (RMSE of 0.321 in the best ANN model as against RMSE of 0.605 in regression model). This could be due to ANN’s flexible non-linear modelling capability [32]. Previous studies have shown that models based on ANN generate more accurate results and predictions as compared to regression models across different domains of study, e.g., [31] in prediction of stock market index; [30] and [32] in bankruptcy studies; [136] in ozone concentration prediction, among others. However, it is worth noting that a simple regression model performed reasonably well and the ANN models with all the complexities perform marginally better only. We believe that the reasons could be due to data pre-processing, particularly data interpolation and most importantly due to the approach of running the models, i.e. training the model only on the timeseries data of a single bank instead of the panel data, i.e. data for many banks for many years. This results in the simplification of the problem for the algorithm to learn the pattern of the data better and make more accurate predictions.
Even though, it may seem that ANN model/s perform marginally better than the regression model, in practice, higher accuracy will make a significant difference due to the astronomically large size of the balance sheet of banks and consequent values of the profits or losses.
Managerial implications
In India, the individual banks and the Reserve Bank of India are monitoring the profitability on quarterly basis, as the financial statements of the banks are available only at the end of the quarters i.e. March, June, September and December. However, frequent monitoring of the profitability of the individual banks as well as that of the banking system is desirable. It will help individual banks to arrest declining trends and to take corrective actions in time. The frequent monitoring will help RBI to frame effective policy responses for managing business cycles and for promoting growth of the economy with financial stability. The internal factors are under the supervision and control of managements of individual banks and the government in coordination with RBI can influence external input factors. As such, input variables can be used as control factors for monitoring of individual banks and banking system as a whole.
The present study will enable individual banks to monitor their profitability on near-continuous basis and reduce the monitoring gap substantially. Besides, central bank can consider entire banking system as a single bank and predict and monitor profitability of the entire system. This will help the central bank to monitor the economy more closely. In addition, the findings of this study will enable the central bank to observe the trends in profitability more closely. The trends in profitability of banks have implications on the risk taking ability of banks which in turn affect supply of credit and economic growth. Furthermore, the model presented in the study can be used as a tool for handling economic crisis and ensuring economic stability. Thus, the use of current study can improve the efficiency of the central bank.
Limitations and future directions
As per the authors’ knowledge, this is the first work in approaching the panel data and ANN wherein the training of the model was done on a single bank rather than on multiple banks, thus, reducing the panel data to time series data. We also used interpolation of the training set to enlarge the data points. It will be worthwhile to further explore this approach in predictive analytics whether in the use of regression, ANN or other techniques. This study is faced with the difficulty in selecting the most appropriate ANN structure, particularly, number of hidden layer/s and number of neurons in those hidden layers. Selection of the most appropriate ANN model was done on trial and error basis. Future studies can explore/apply methods that help in automatically selecting the most appropriate ANN structure/model based on the characteristics of the dataset, e.g., Automatic Model Selection (AMS) by [137]. Metaheuristics which are nature inspired artificial intelligence (AI)-based nature inspired solution methodologies or algorithms can also be explored in predicting bank profitability [138].
Footnotes
Though [![]() ] applied ANN in predicting bank profitability, our study is different from their study in terms of (a) number of banks considered. We considered 21 banks in contrast to 3 in their study (b) We trained the model on a single bank and then used the output of the model in predicting other banks’ profitability, thus, simplifying the panel data into a time-series problem. [49] is not clear on training the data on panel or time-series data. (c) They used several rule of learning such as Adam, RMSProp, Stochastic Gradient and Descent (Momentum). Our study only used Adam due to its advantages compared to other rules of learning (this is discussed in detail in Section 3.3 (page 19)). (d) Our study explored several ANN structures, whereas, [49] presented only a single structure. (e) Our study also performed multiple linear regression and compared the results with various ANN results. Comparison with other methods of analysis is not provided in the study by [49].
] applied ANN in predicting bank profitability, our study is different from their study in terms of (a) number of banks considered. We considered 21 banks in contrast to 3 in their study (b) We trained the model on a single bank and then used the output of the model in predicting other banks’ profitability, thus, simplifying the panel data into a time-series problem. [49] is not clear on training the data on panel or time-series data. (c) They used several rule of learning such as Adam, RMSProp, Stochastic Gradient and Descent (Momentum). Our study only used Adam due to its advantages compared to other rules of learning (this is discussed in detail in Section 3.3 (page 19)). (d) Our study explored several ANN structures, whereas, [49] presented only a single structure. (e) Our study also performed multiple linear regression and compared the results with various ANN results. Comparison with other methods of analysis is not provided in the study by [49].
Appendix
Appendix 1. Description of the variables prior to data normalisation
Variable
Type
Mean
Standard deviation
Min
Max
Total share-holders funds
Numerical (in INR
19987.189
24503.000
3655.92
188286.06
Deposits
Numerical (in INR)
282901.212
291656.539
59723.19
2044751.39
Borrowings
Numerical (in INR)
12568.571
24537.369
1281.220
159276.080
Other liabilities and provisions
Numerical (in INR)
12568.571
24537.369
1281.220
159276.080
Cash and balances with RBI
Numerical (in INR)
15560.650
19662.603
3126.450
129629.330
Balances with banks money at call and short notice
Numerical (in INR)
15426.985
24504.861
29.150
127689.700
Investments
Numerical (in INR)
88470.469
91200.126
18643.650
765989.630
Advances
Numerical (in INR)
209369.257
243646.462
1148.230
1571078.380
Capital Adequacy Ratios
Numerical (in Percentage)
11.981
1.112
8.000
15.000
Gross-NPA
Numerical (in INR)
12623.074
16149.524
124.210
112342.990
Net-NPA
Numerical (in INR)
7363.608
9021.771
237.940
58277.380
Other income
Numerical (in INR)
3056.066
4455.383
417.150
35460.930
Payments to and provisions for employees
Numerical (in INR)
3201.142
4328.545
688.200
26489.280
Operating expenses
Numerical (in INR)
1667.842
2509.838
0.000
17690.180
Provisions and contingencies
Numerical (in INR)
4125.682
5503.840
0.000
40363.790
Control of corruption
Numerical (in a scale of
0.413
0.101
0.540
0.240
Rule of law
Numerical (in a scale of
0.052
0.023
0.090
0.000
GDP growth rate
Numerical (in percentage)
6.933
1.023
5.240
8.170
Inflation
Numerical (in Percentage)
7.165
2.359
2.490
10.910