
Abstract
Ovarian cancer (OvCa) is the fifth leading cause of cancer deaths in women and remains the deadliest gynecological cancer. Our study goal is to examine associations between diagnostic patterns and OvCa stages. We used the data from a web-based survey in which more than 500 women diagnosed with OvCa provided both free text responses and staging information. We employed text mining and natural language processing (NPL) to extract information on clinical diagnostic characteristics, together with 21 dichotomous symptomatic variables, patient-centered advocacy, and polytomous disease severity, with internal validation. We conducted multivariate analyses and developed tree-based classification models with the confirmation of Random Forest to determine important factors in the relationships of the clinical diagnostic characteristics with OvCa stages. Models including the symptoms, patient advocacy tendency, disease severity and doctors’ responses as predictors, had a much better predictive power than those limited to doctors’ responses alone, indicating that OvCa stage at diagnosis depends on more than just doctors’ responses. Although effective early stage diagnosis and treatment remains a challenge, our analysis of patient-centered clinical diagnostic characteristics and symptoms shows that self-advocacy is essential for all women. The frontline physician is critically important in ensuring effective follow-up and timely treatment before diagnosis.
Keywords
Introduction
Ovarian cancer (OvCa) is the fifth leading cause of cancer deaths in women and remains the most deadly gynecological cancer. The disease places a debilitating burden on the US population, in terms of mortality, morbidity, individual suffering, and loss of productivity for all women with OvCa. National expenditures for OvCa care were estimated at $5.12B in 2010 (
We have previously shown that public awareness and knowledge about OvCa is poor among the general population (Carter et al., 2014). It has also been reported that ovarian masses have often been misdiagnosed (Pomeranz & Sabnis, 2004), although there was some association of pre-diagnostic symptoms with OvCa (Goff et al., 2007) and with OvCa diagnostic stages (Sun et al., 2015). The motivation for the current study was to examine the association of diagnostic patterns (determined by the responses from ‘frontline’ clinicians, specifically primary care physicians (PCPs) and emergency room (ER) doctors, together with follow-up by specialists), with OvCa stages.
Methods
Our data source was patterns of diagnosis extracted from reports by a large cohort of women in a web-based survey that we created (
A primary predictor set of clinical diagnostic characteristics, including physicians both initial contact and follow-up efficiency, was defined as shown in the first three columns in Table 1.
Primary predictor set of diagnostic characteristics – doctor’s responses
Primary predictor set of diagnostic characteristics – doctor’s responses
Key: Y
Here, we define that a PCP responded, i.e., PCP-R
The relationships of clinical diagnostic characteristics (the primary predictor set) with OvCa stage were investigated, in consideration of an additional predictor set (Table 2) consisting of 21 dichotomous symptomatic variables studied in Sun et al. (2015), one patient-centered variable of interest Advocate (ADVO), and one polytomous variable Severity (SEVTY), which was defined to have three classes (mild, moderate, severe). A patient’s symptom was mild if she had no or only minor/occasional symptoms that caused no sharp or lingering pain. In this case, abnormality was often found in an annual checkup/pap smear, a study one participated in, or a CT/ultrasound for unrelated problems. A patient’s symptom was moderate if she had some level of pain/discomfort, but not as bad as those severe symptoms. For example tumor/mass may exist, but usually only discovered by doctor. Symptoms consistently exist, but do not require immediate attention and may not be obviously linked to cancer. A patient’s symptom was severe if her symptoms required immediate attention. These include: severe pain/pain, usually leading the patient directly to ER, heavy bleeding, fatigue, short of breath, extreme swelling, or abdominal mass felt by the patient herself before she went to the doctor.
Second set of predictor variables – clinical characteristics
The free text field of the records in the database were examined using text mining. The review was carried out in two phases by 6 independent observers. In the first phase three independent observers calibrated the data on 200 cases, with post-hoc cross-checking between observers to ensure consistency. Data extraction guidelines were refined and a second-phase review of all cases was carried out by three independent observers and cross-checked to minimize potential observer biases.
As with any complex multivariate study, descriptive exploratory statistics were first applied in order to provide an overview of the data. All data were self-reported. There was some missing data, which was characterized as N/A. Data validation and treatment of outliers followed our established methods as previously described (Sun et al., 2015).
The proportion trend test (Dalgarrd, 2006) and proportion difference test were also used to determine significant trends or differences that appeared in the data distribution.
Further detailed analyses were carried out using tree-based modeling. This approach was selected because tree-based models use a non-parametric approach that relies on the evidence presented in the data and minimizes a priori model assumptions imposed on the data. Tree-based models also handle missing data more effectively than standard parametric models and allow generalized interactions between different types of predictor variables. This class of models is also well suited for use on many categorical variables, such as those presented in our dataset. The rpart package (from R) was selected for model development because it allows for ordinal categorical predictors and handles missing values by employing surrogate variables to treat the remaining missing variables after recombination.
When developing an adequate tree-based model, there remain several options to be investigated. In the current study, the options included disease staging, prior probability distribution of the possible outcomes, and missing variable surrogate criterion.
Disease staging: OvCa staging was characterized as either:
Two stages: Early (Stage I and II) or late (Stage III and IV). Four stages: Stage I, II, III and IV.
It is typically harder and requires more/better data to build a good predictive model for a finer classification (D2) than for a coarser classification (D1).
Prior probability distribution:
The default (natural) prior probability mimics the natural frequencies of the response variable from a dataset. The equal prior probability places no bias toward either stage for each record and is based on the symptoms and other predictors, rather than a-priori assumptions.
Missing variable surrogate criterion:
‘Regular (or raw) accuracy’ selects surrogate variables by maximizing the total number of correct classifications for a potential surrogate variable. Thus both missing and non-missing variables contribute to the surrogate variable. ‘Percent accuracy’ selects surrogate variables by maximizing the percent correct classification, calculated over the non-missing values of the surrogate at the current node. Thus all non-missing values contribute to the surrogate variable.
It was also considered valuable to compare models with both symptoms, i.e. variables in Table 2, and doctors’ responses (Table 1) included as predictors, against those with only doctors’ responses.
Symptoms inclusion criterion:
Both symptoms and doctors’ responses are included in the predictors’ set. Only doctors’ responses were included in the predictors’ set.
This approach was based on the hypothesis that including both symptoms and doctor’s responses (S1) is necessary to improve the classification rate of the model using doctor’s responses alone.
Therefore, we conducted model building analyses to explore combinations from two modes of disease staging, two types of priors, two missing variable criteria and two types of predictors. This provided the possibility of 16 models. In building each of the 16 models, we conducted a tree-based analysis using the rpart() function in R with appropriate settings. The prediction error of each tree-based model was assessed by averaging the results of 10 independently drawn 10-fold cross-validations (CV) for the model. Specifically, in a 10-fold cross validation, each model was developed by 1) randomly partitioning the complete sample into 10 subsamples of equal sizes, 2) using each of the 10 subsamples for testing and validating the model built usingthe remaining 90% of all records as the training set and 3) averaging the 10 models to produce a single estimation. Since a 10-fold cross validation is based on ‘random’ partitioning, this ‘random’ effect was reduced by repeating partitioning 10 times independently to provide a stable average model and estimated cross-validated error for our model. The important predictors for modeling the diagnostic stages were obtained by examining the final trees (Fig. 3a–e) and computing the ‘variable(s) (of) importance’ using ’random forest’ to confirm the result of each tree model. The important predictors were also cross-checked by fitting a logistic model to the early/late stage response data and running a variable selection procedure, with the available complete data.
As shown in Fig. 1 the percentage of severity increases significantly as Stage increases from I to IV (
Severity of symptoms by stages.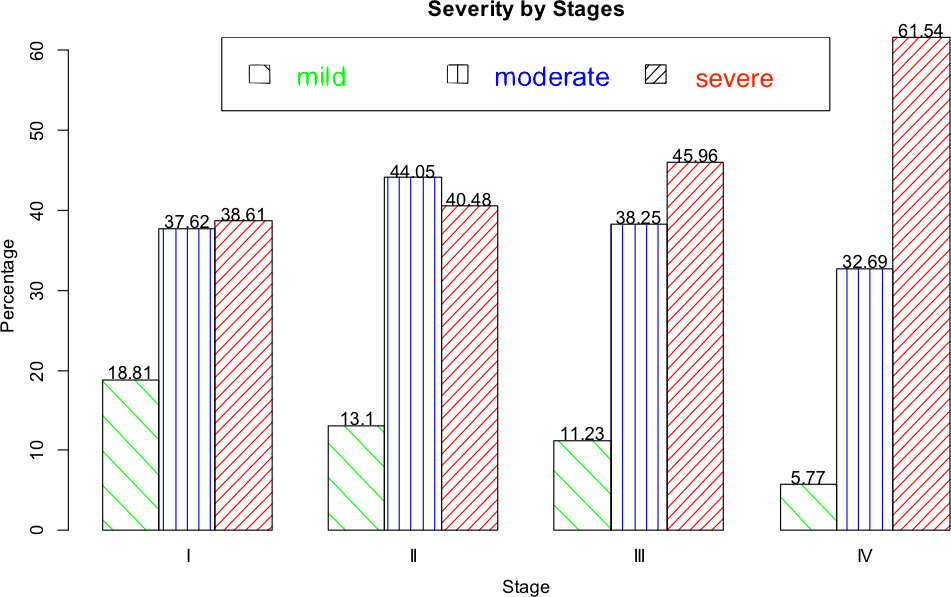
PCP factors across stages.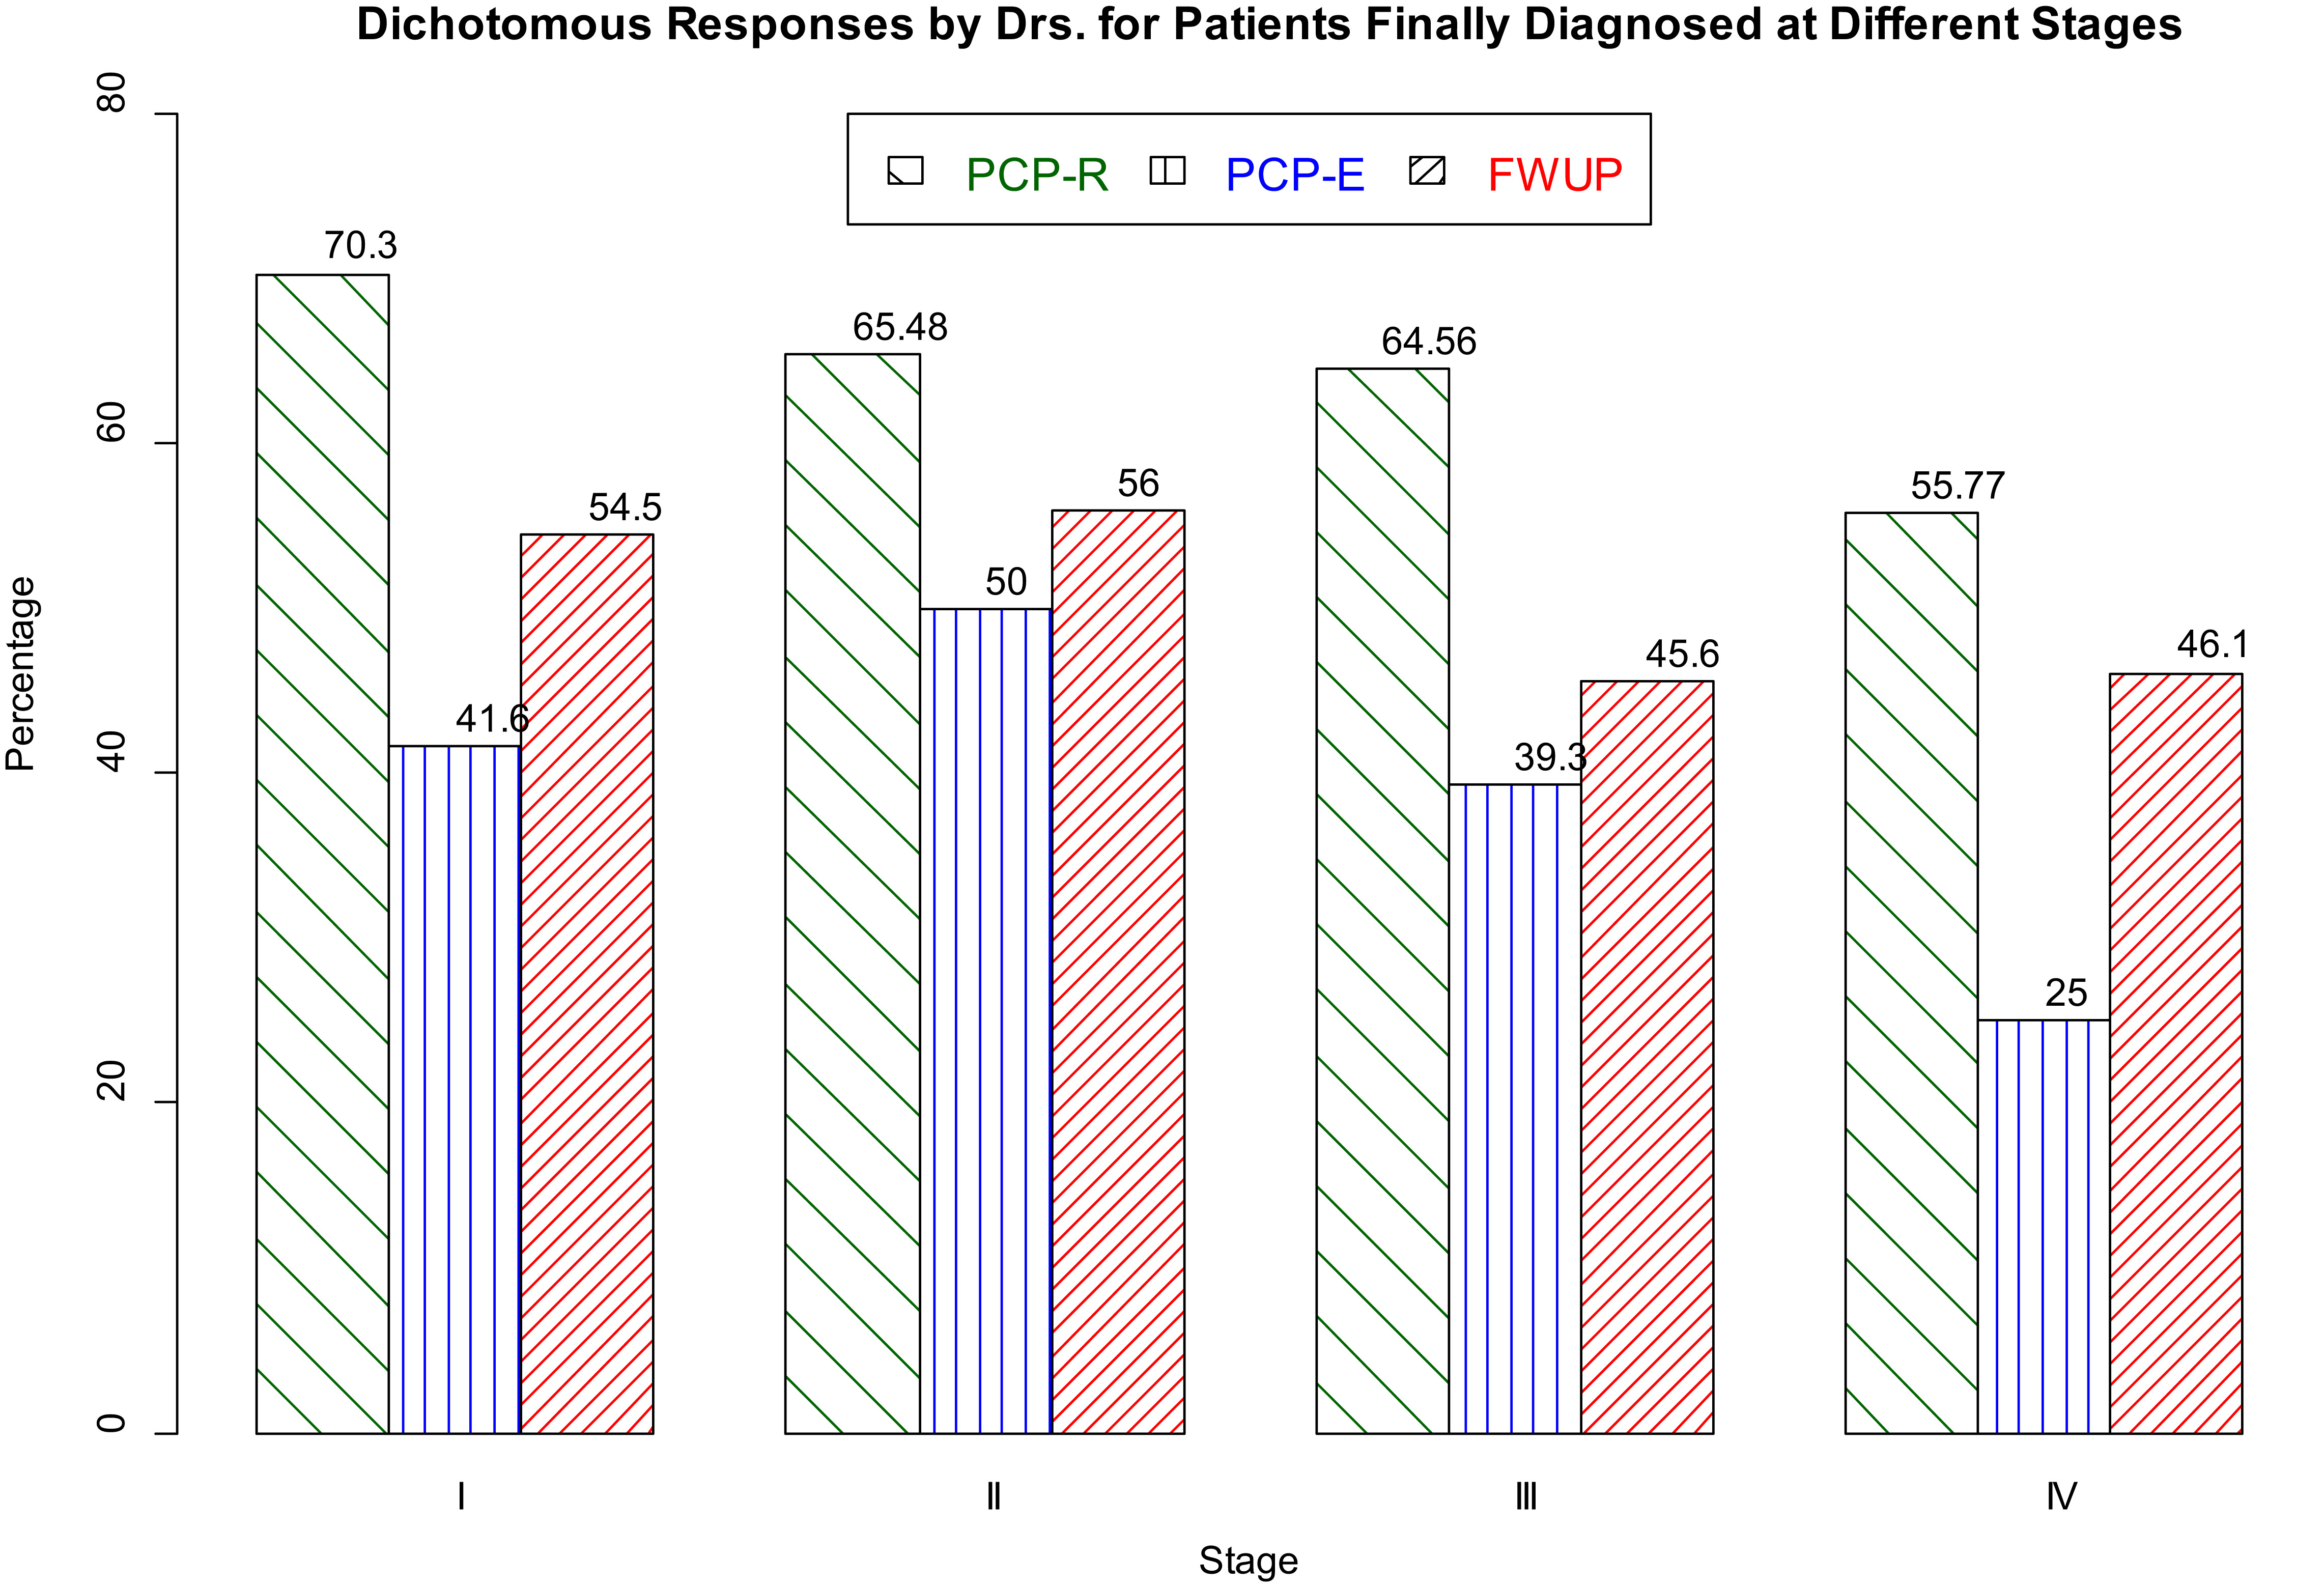
D1, P1, M1, S1: D 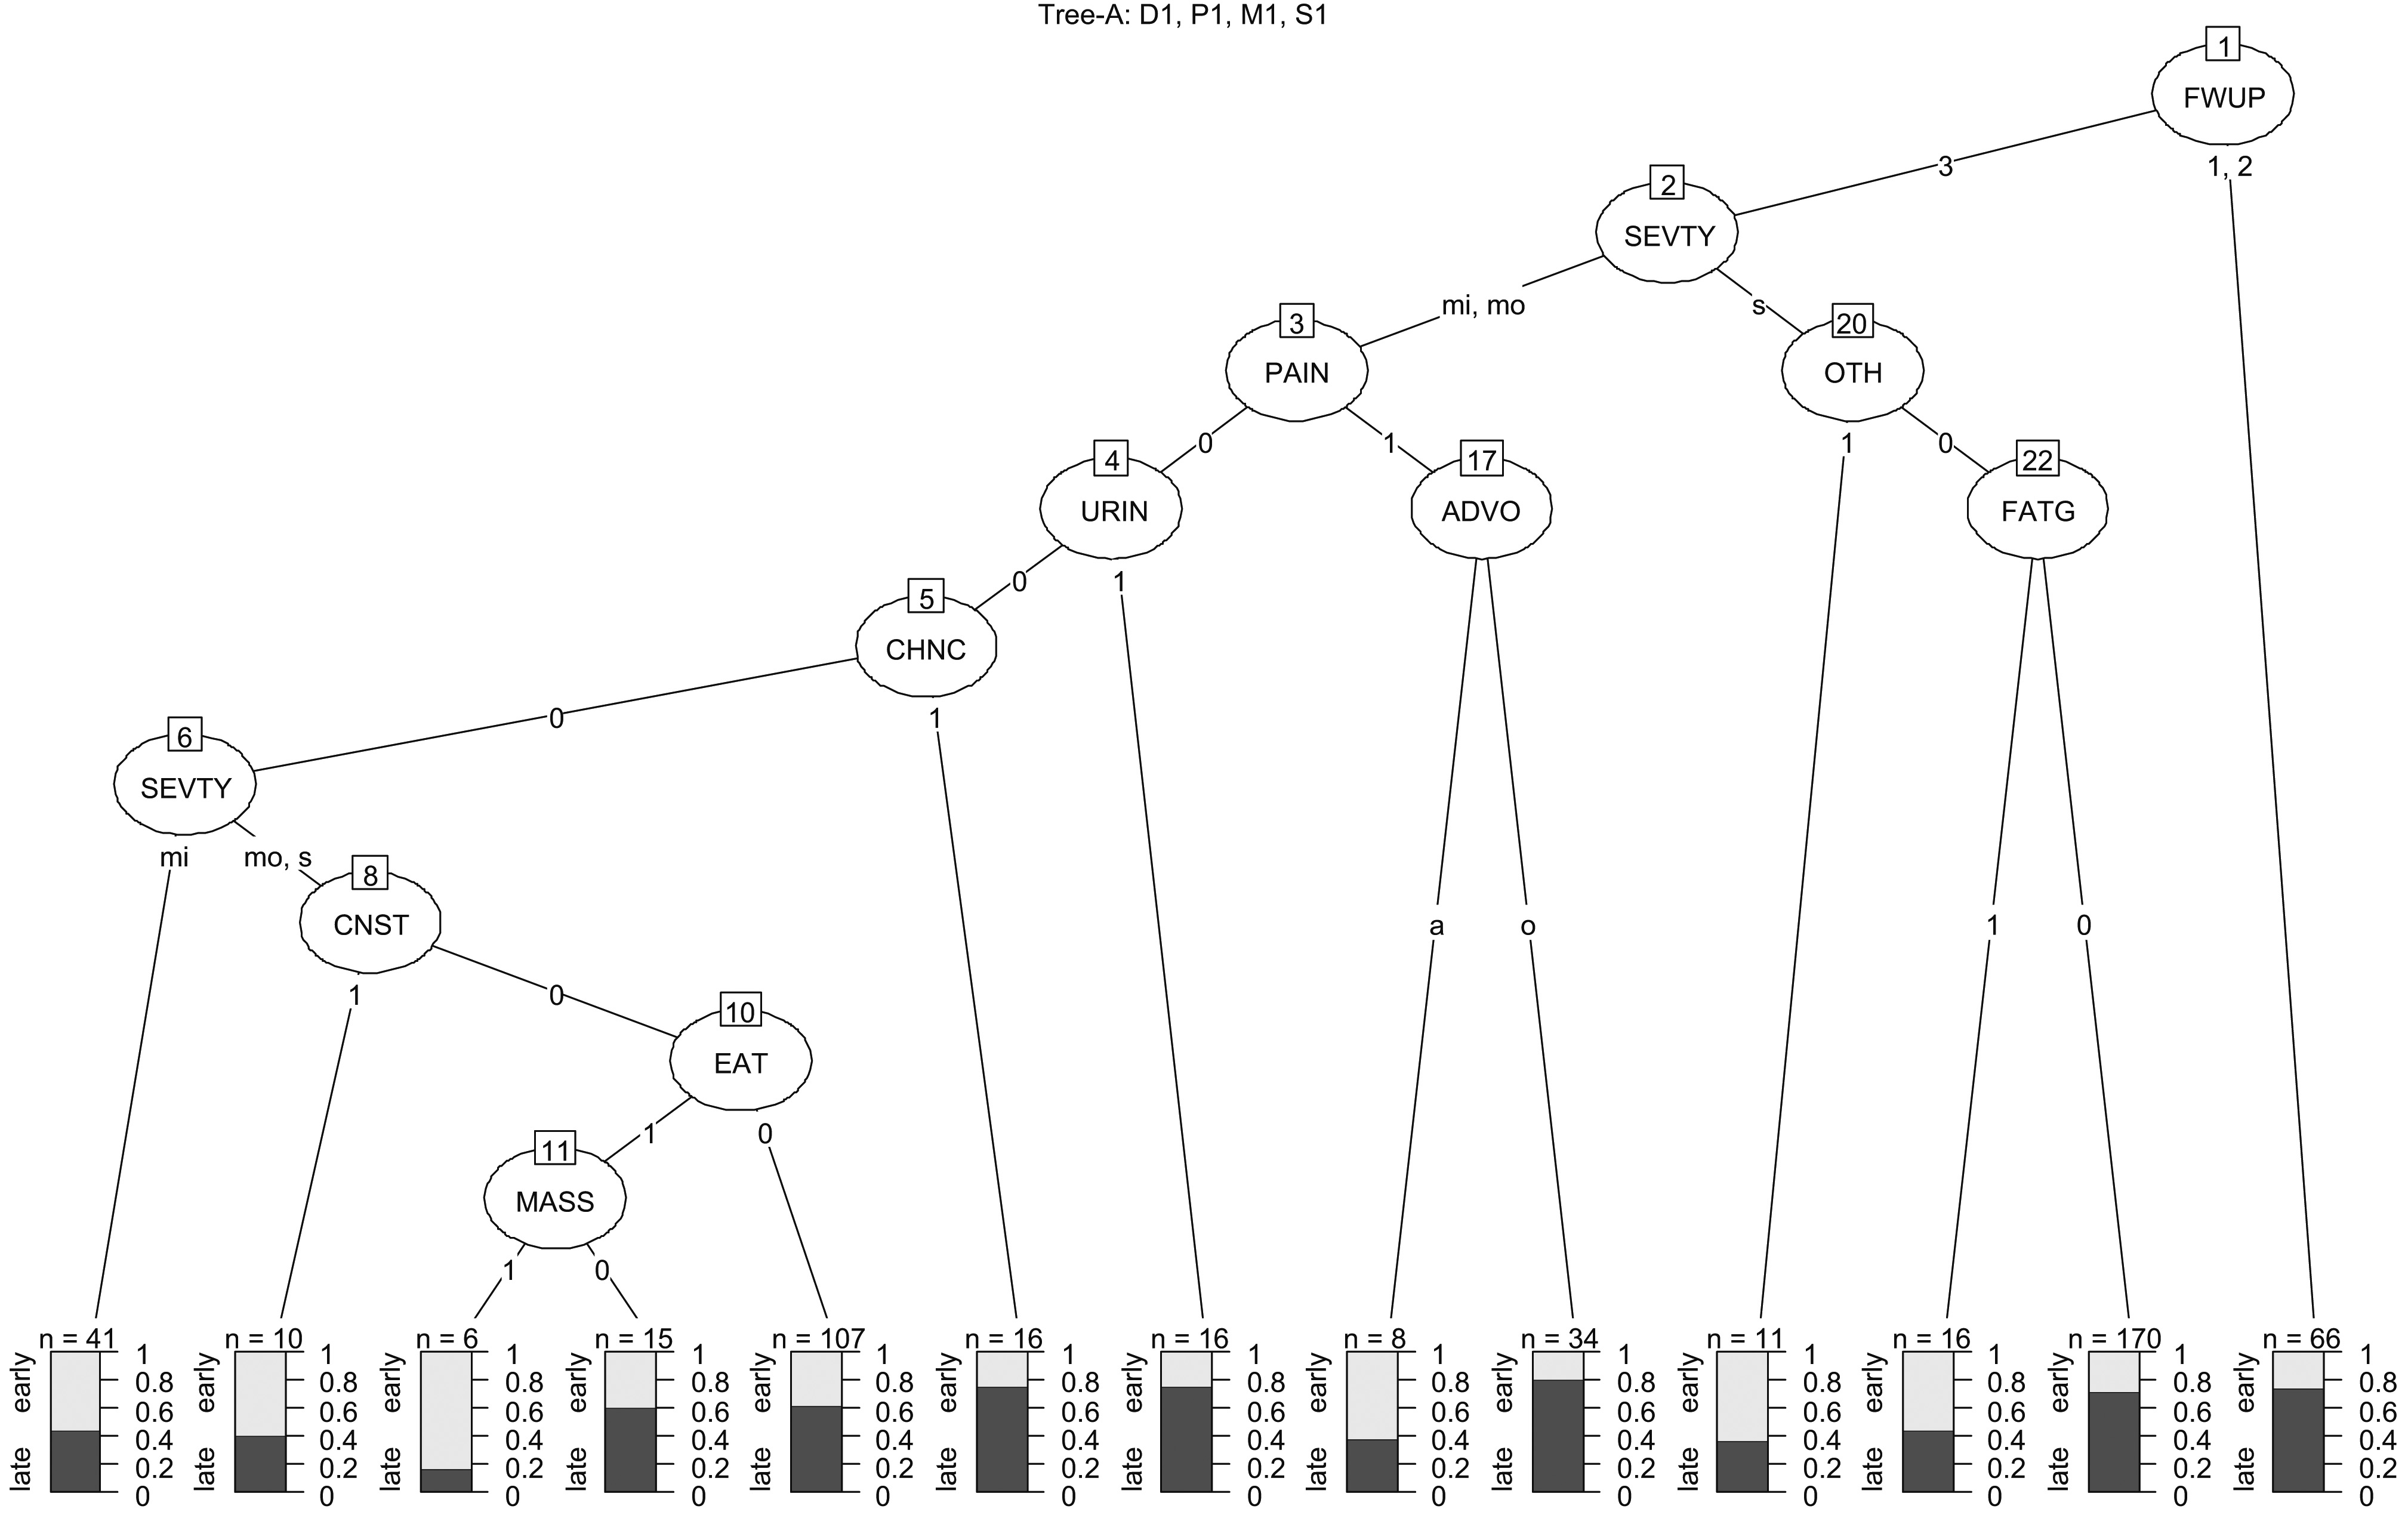
D1, P1, M2, S1: D 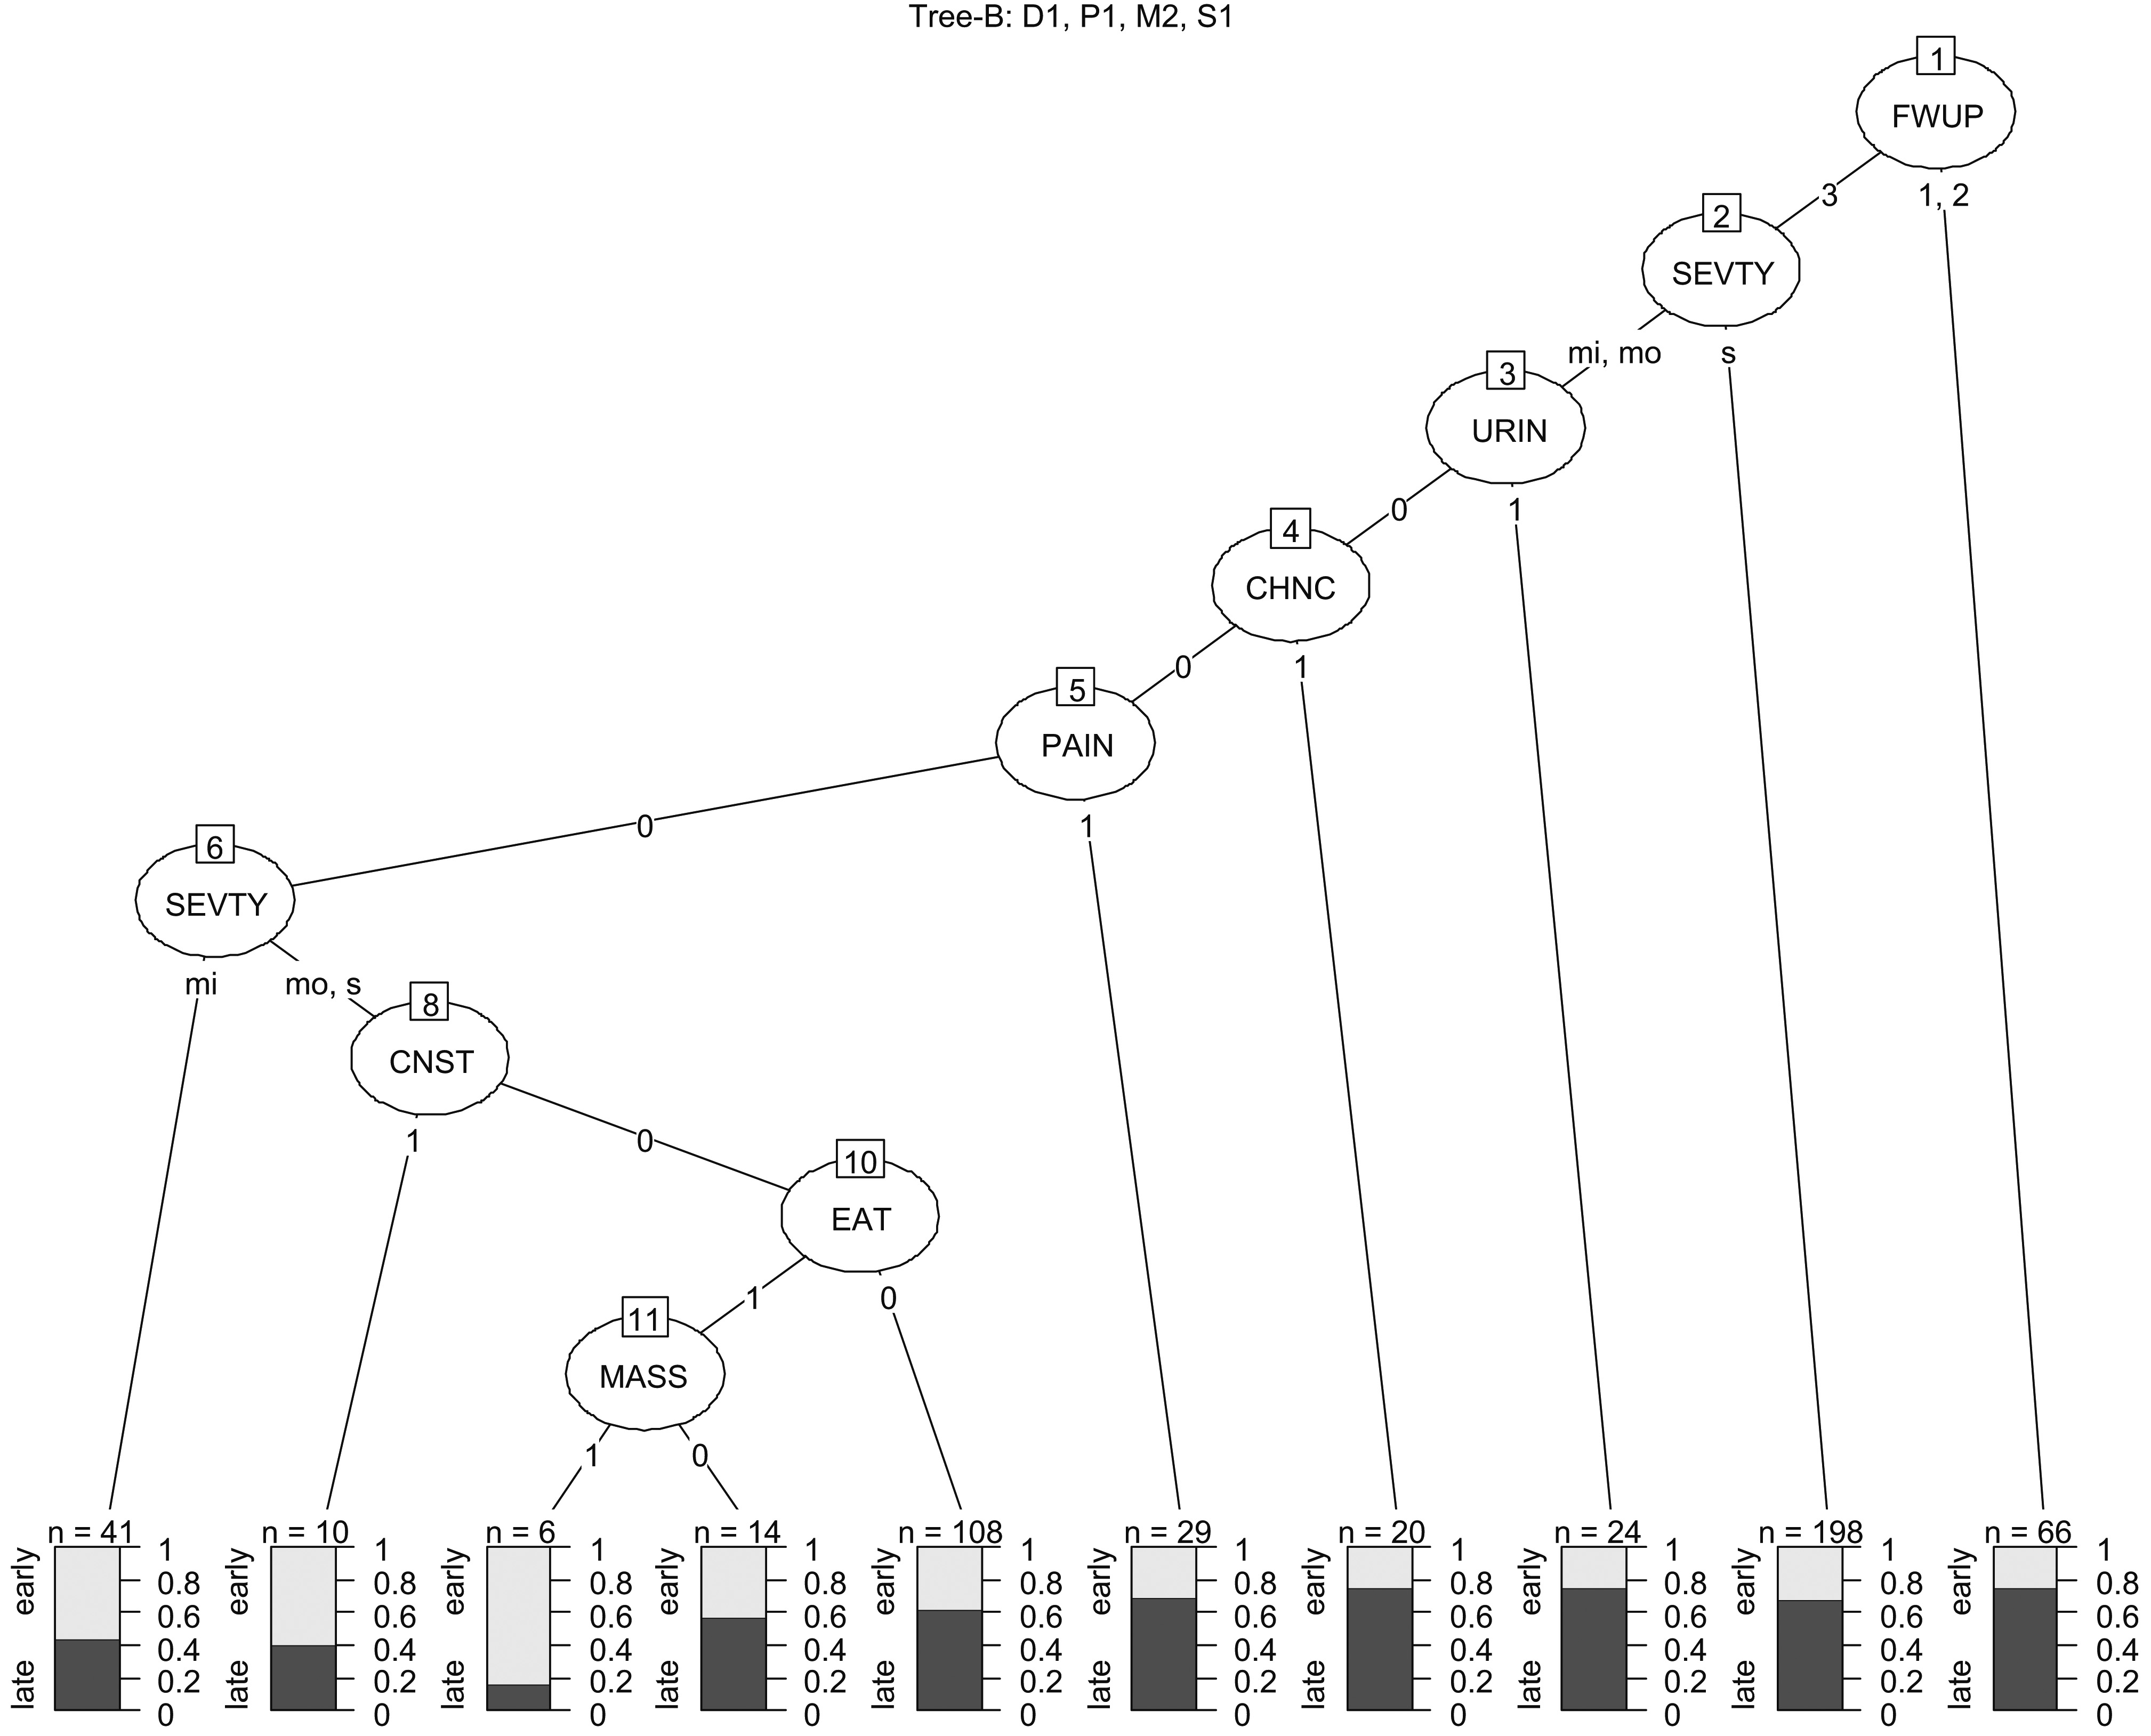
As shown in Fig. 2, the PCPs’ response (PCP-R) varied across stages with an overall slight decrease (
While PCPs’ efficiency (PCP-E) for the excellent rating, varied across all four stages (
The percentages of missing data for each variable compared across all four stages were similar and were discarded in the above analyses. FWUP at late stages (Stages III and IV) was significantly less than at early stages (
D1, P2, M1, S1: D 
D1, P2, M2, S1: D 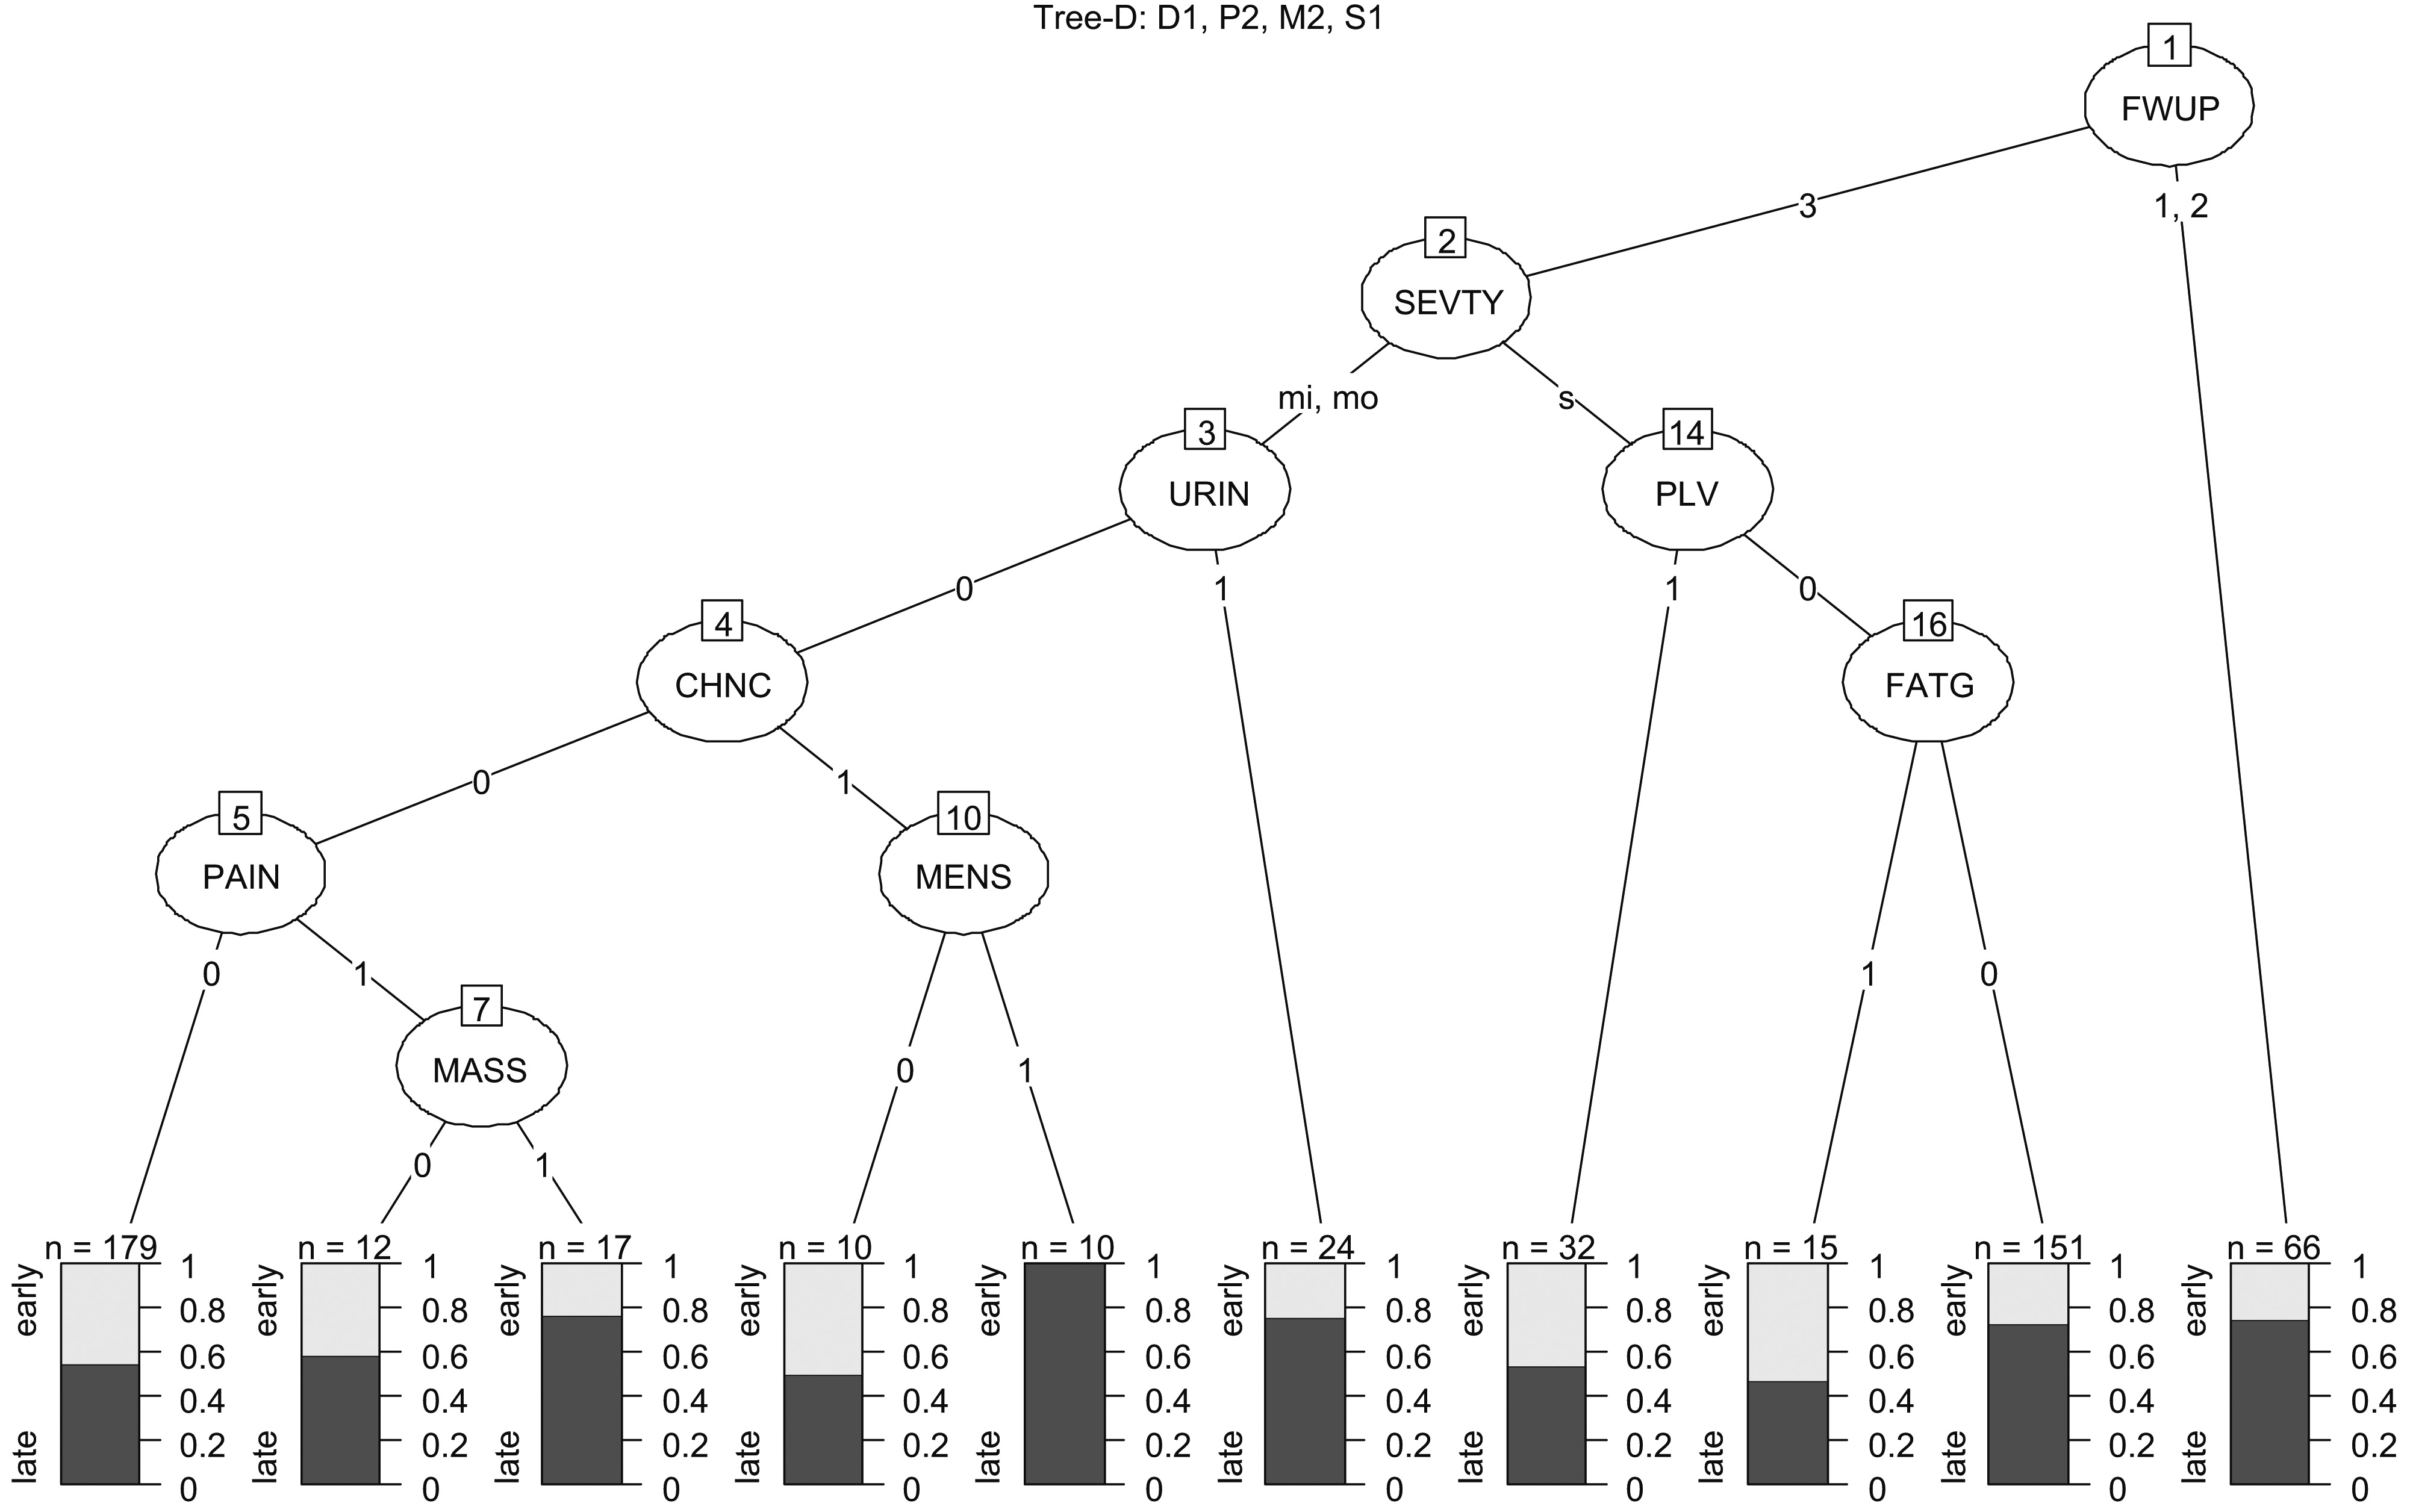
D2, P2, M2, S1: D 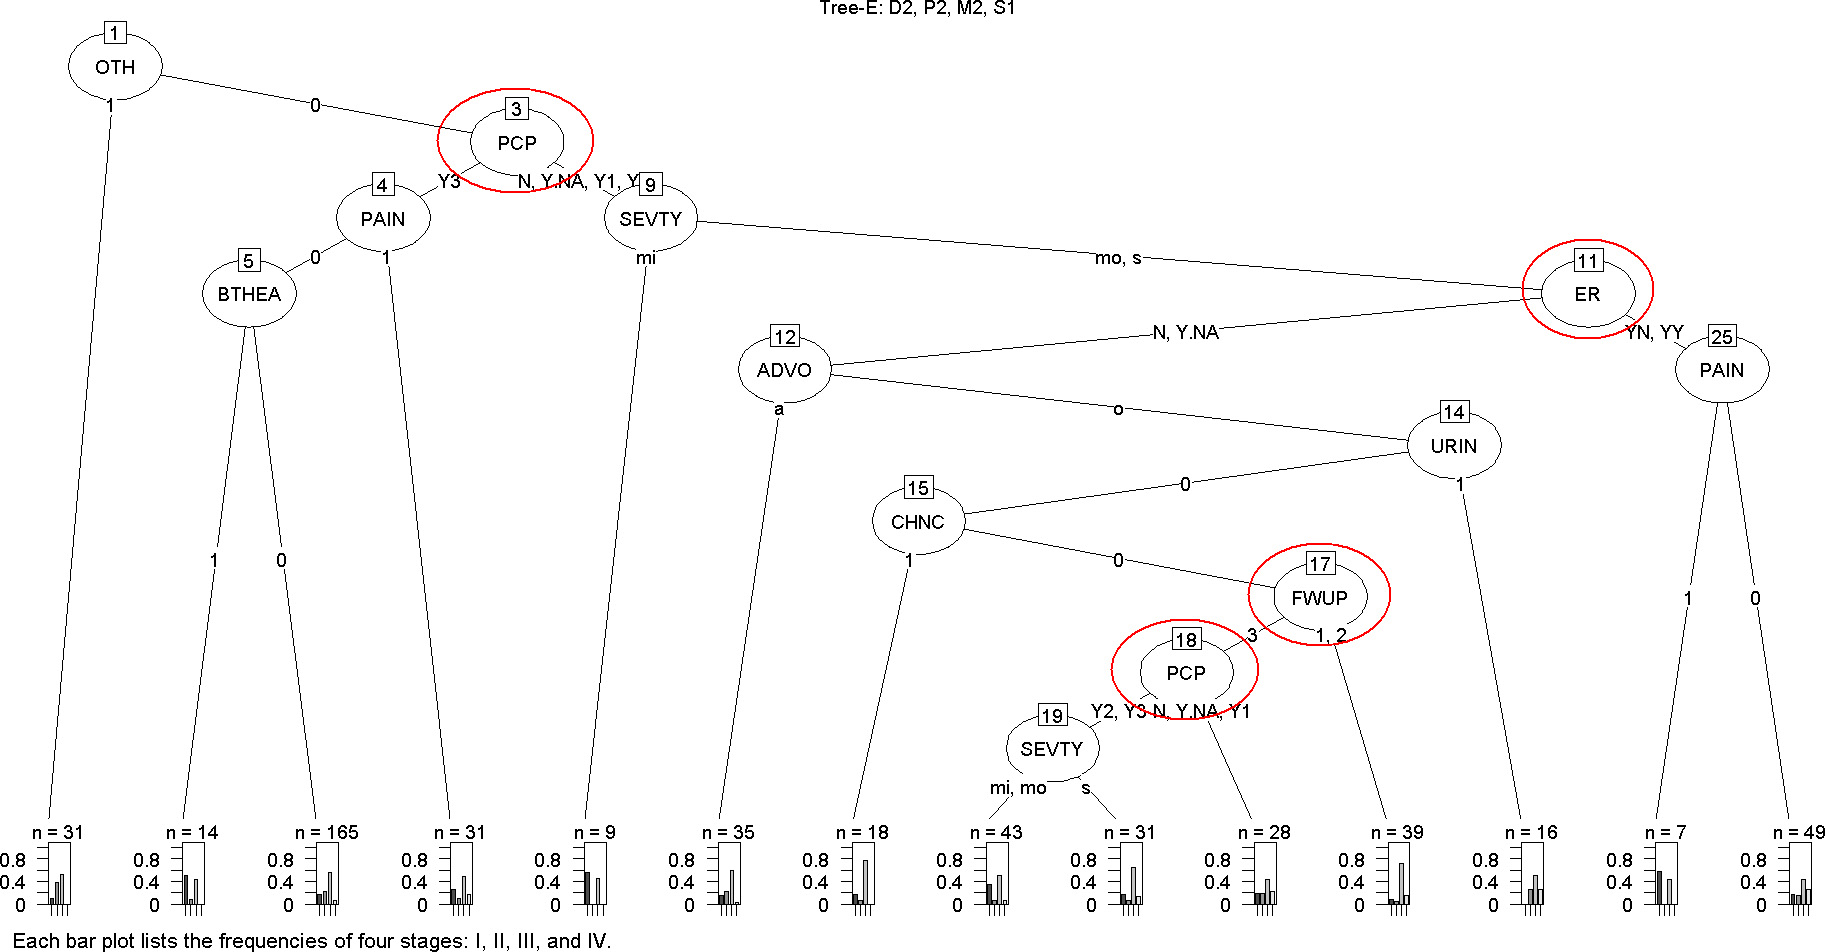
Variable importance plot by random forest for 5 trees Tree-A-E in Fig. 3a–e.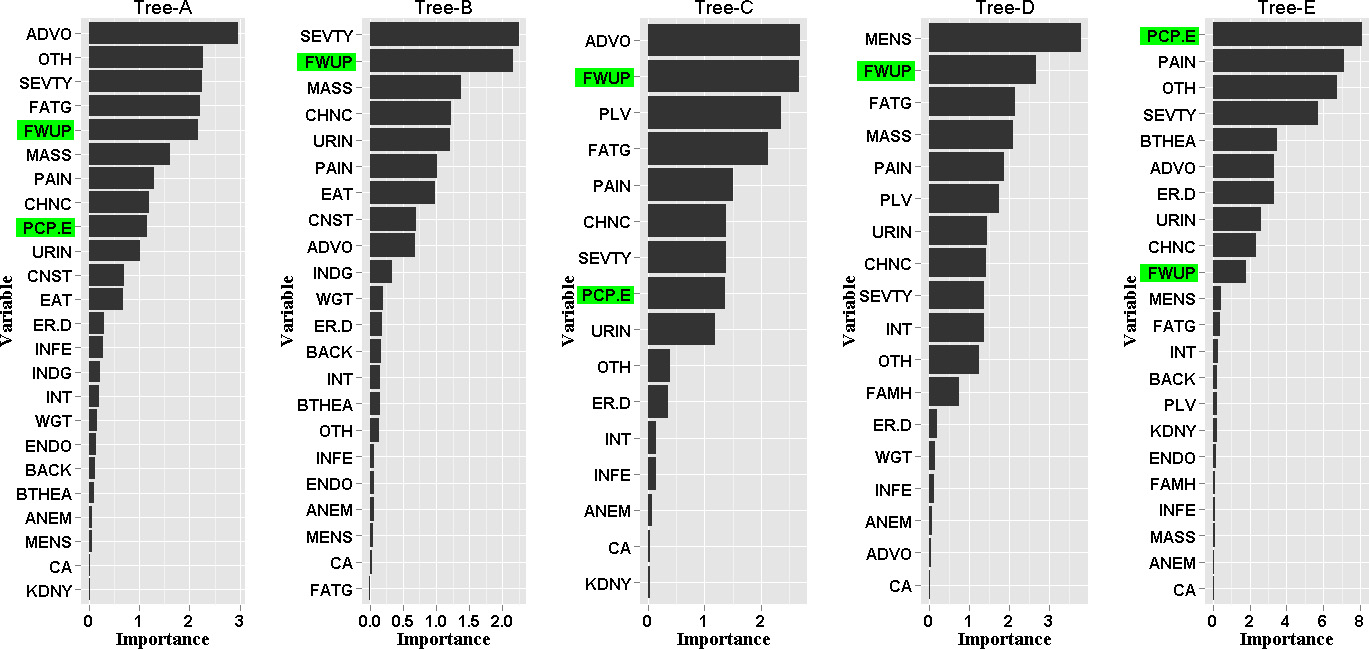
From the 16 potential trees examined during model development, five trees were found to produce valid outcomes and have reasonable classification rates (Fig. 3a–e). The classification rates for trees with a dichotomous outcome ranged from 60–68%. Among these models, Tree A (Fig. 3a) is the best. The classification rates for Tree-E (Fig. 3e) with a 4-stage outcome were poor, only slightly better than the equal probability guess. However, if we relax the definition of misclassification to allow for the ‘nearest 1-neighbor correctness’, i.e. the decision is counted as correct if the difference between the classified stage and actual diagnostic stage is none or equal to 1, then the classification rate for Tree-E is 80%. These classification rates are acceptable because there are other factors, such as genetics and tumor subtypes, which also help to determine the diagnostic stages. Using the ‘nearest 1-neighbor correctness’ rule also allowed us to account for the transition from one stage to another in diagnosis. The models that included only doctors’ responses as predictors did not have good classification rates, reflecting that diagnostic stages depend on more than the doctors’ responses alone.
Doctors’ follow up efficiency (FWUP in the top node) was an important factor in changing the odds of an early diagnosis in all dichotomous outcome models (Fig. 3a–d). If the PCP or ER doctor did not send a patient to an adequate follow-up path, follow up efficiency could be compromised in patients’ reports. Indeed, the PCP and ER doctors’ responses were shown more clearly as top factors (in addition to FWUP) in the 4-staging outcome model (Fig. 3e). The variable importance chart given in Fig. 4 also showed the importance of the doctors’ responses in association with diagnostic stages, given the disease symptoms, severity and patient’s self-advocacy tendency about her health.
As a secondary check for the association of doctors’ responses with diagnostic stages, we also fitted a logistic model to the early-late stage response data and ran a variable selection procedure to the subset of data that has complete records. The variables found to be important from this secondary check also included FWUP, as both Tree-A (Fig. 3a) and Tree-B (Fig. 3b) did. The fitted classification rate for the full logistic model fit was 73% and the predicted classification rate based on leave-one-out cross validation was 68%. However, it is important to note that the standard logistic modeling does not allow for missing data automatically as the tree-based models would. Thus, without re-programming and running an imputation that would need to be carefully planned and justified for missing categorical variables, the logistic regression was run with the missing values excluded. This is in contrast to the tree-based models that considered the missing information.
The goal of our analysis was to identify diagnostic patterns from a complex multivariate data source and investigate their association with OvCa stages, given disease symptoms, severity and patient’s self-advocacy. In addition, we considered the possibility of complex interactions and patterns within our data. Our analytic approach therefore used tree-based models, which provide a versatile robust approach without requiring restrictive parametric assumptions about the model that may not fit the data well or is subject to challenges in dealing with missing categorical values. This method is being increasingly used in the analysis of complex biomedical data, particularly in the field of oncology (Fenton et al., 2013; Barlin et al., 2013).
We have found that the models including only doctors’ responses as predictors did not have a good discriminating power, indicating that OvCa stage at diagnosis depends on more than just doctors’ responses.
Tree-building uses a recursive-partitioning algorithm to carry out an exhaustive search of all options for splitting variables to maximize the accuracy in classification and prediction of outcomes. This process produces terminal nodes (or leaves), at which point the nodes cannot be divided anymore and need to be pruned to avoid over-fitting and to optimize efficiency in prediction.
In our analysis we were interested in the differences between diagnostic patterns for women whose OvCa was identified at a Stage I or II (early) compared to those whose OvCa was diagnosed at Stage III or IV (late). We investigated the potential advantages of classifying using a four stage outcome. However we found the misclassification rates were poor for these trees; only slightly better than the equal probability guess. If we relax the definition of misclassification to allow for the nearest 1-neighbor correctness, i.e. the decision is counted as correct if
It is known that OvCa is symptomatic; however, until recently symptoms were considered non-specific. This has limited the reliability of primary diagnosis and/or appropriate referral by specifically PCPs and emergency room (ER) doctors, which has led to the majority of women being diagnosed at late stage for OvCa. Goff et al. proposed a scoring system for women who had already been identified as being at risk based on six symptoms (Goff et al., 2007). A study by Hamilton et al. in a UK population identified seven symptoms independently associated with OvCa at all stages (Hamilton et al., 2009). In a secondary analysis of this data, Grewal et al reported on the development of a scoring system for primary care physicians (Grewal et al., 2013).
These studies provided some insight regarding symptoms that were retrospectively identified from the clinical record as being related to a diagnosis of OvCa. However previous studies did not extend to consideration of patient-centered criteria, such as self-advocacy, nor did they examine the effects of physician awareness and doctors’ responses. Our study investigated the association of OvCa stages at diagnosis with doctors’ responses, together with 21 relevant symptoms, a patient-centered self-advocacy response, and disease severity. Misclassification rates for the trees in Fig. 3a–e were 20%–40%, indicating that the factors examined were important, however they cannot fully explain the diagnostic pathway for all women with OvCa indicating that further studies are needed.
As Fig. 4 shows, in all the valid trees for our model development, the efficiency of the PCP response (PCP-E) and/or follow-up (FWUP) are always among the most important variables for effective diagnosis at all stages. Similarly, self-advocacy is a critically important variable impacting effective diagnosis most significantly in two optimal trees (Fig. 3a for the 2-stage and Fig. 3e for the 4-stage classification). It is of note that this variation in importance is less than that of efficient follow-up. The consistent findings in the association of the doctors’ responses with diagnostic stages validate the importance of health providers’ awareness about OvCa and prompt responses to patients’ reports. To date there have been some small qualitative studies of these factors in OvCa, all with study populations of less than 20 (Long Roche et al. 2016; Hagan & Medberry, 2016; Hagan & Donovan, 2013; Stewart, 2016). Our study highlights the on-going need for patient-centered care, specifically listening to patient concerns and continuing improvement in the education of primary care providers.
Conclusion
Effective early stage diagnosis and treatment of early stage OvCa remains a challenge. Our analysis of patient-centered clinical diagnostic characteristics and symptoms shows that self-advocacy is essential for all women. Furthermore, the role of the frontline physician is critically important in ensuring effective follow-up and timely treatment. There is an increased movement toward patient-centered care, which includes both self-advocacy and recognition of the important role of frontline physicians. Our study is the first to statistically demonstrate the importance of the self-advocacy and the role of frontline physicians, based on a robust cohort of more than 500 cases.