
Abstract
Precision medicine is important in the new era of medical product development. It focuses on optimizing healthcare decision for each individual patient based on this subject’s context information. Traditional statistics methods for precision medicine and subgroup identification primarily focus on single treatment or two arm randomized control trials. Its has limited capability to handle observational studies where treatment assignments could depend on covariates. In this paper, we described the limitations of traditional subgroup identification methods, and propose a general framework which connects the subgroup identification methods and individualized treatment recommendation rules. The proposed framework is able to handle two or more than two treatments from both randomized control trials and observation studies. We implement our algorithm in C++, and connect it with R. The performance is evaluated by simulations, and we apply our method to a dataset from a diabetes study.
Keywords
Introduction
Responses to treatments can vary widely due to the heterogeneity in most patient populations. One treatment that works for a majority of individuals may not work for a subset of patients with certain characteristics. Thus, significant improvements in treating patients could potentially result from treating individuals based on this patient’s specific characteristics rather than a one-size-fits-all approach. Recently, precision medicine has attracted great attention in medical and biostatistics research. As quoted from an article in Pharmacogenomics: “therapy with the right drug at the right dose in the right patient” is a great description of how precision medicine will affect the future of treatment (Mancinelli et al., 2000).
With new treatments and novel technology available, precision medicine has become an important piece in the new era of medical product development. At the evolution of drug development, for most therapeutic areas, there are multiple treatments available for the same disease. For example, in treating Type II diabetes mellitus, there are different classes of oral antidiabetic agents (Metformin, Sulfonylurea, Thiazolidinedione, DPP-4, SGLT-2, etc.), and multiple classes of injectable treatments such as GLP-1 and Insulin (American Diabetes Association and others, 2014). In each class, there are multiple drugs, and each drug often has different doses. The various of choices of treatments with different doses for a single disease provide the possibility of personalized medicine. At the same time, the information revolution has allowed the collection of vast amounts of data. Healthcare claims databases and other types of electronic medical records now contain multiple years of medical information for millions of patients. With the advent of genomics and our deepening knowledge of translational medicine, we are able to better characterize a patient which opens great opportunities to develop personalized medicine.
There are notable examples of marketed compounds that make tailored therapeutics a reality. For instance, Tamoxifen used to be a drug commonly prescribed to women with ER+ breast cancer, but 65% of women initially taking it developed resistance. After some research, it was discovered that women with certain mutation in their CYP2D6 gene, a gene that encodes the metabolizing enzyme, were not able to efficiently break down Tamoxifen, making it an ineffective treatment for their cancer (Ellsworth et al., 2010). Since then, women are now genotyped for those specific mutations, so that immediately these women can have the most effective treatment therapy. Another example is that Trastuzumab (Herceptin
Despite these successful examples, there remain tremendous challenges in developing solutions for personalized medicine. Besides the medical, operational, ethical, and regulatory issues, there are considerable statistical complexity as well. Much has been written about the dangers of subgroup analyses (Brookes et al., 2004; Lagakos, 2006; Ruberg et al., 2010), and various authors have proposed guidelines for analysis and reporting on subgroups (Rothwell, 2005; Wang et al., 2007). In particular, the FDA has already started to take initiatives to integrate personalized medicine into their regulatory policies. They developed a report in October 2013 entitled, Paving the Way for Personalized Medicine: FDA’s role in a New Era of Medical Product Development, in which they outlined steps they would have to take to integrate genetic and biomarker information for clinical use and drug development. They determined that they would have to develop specific regulatory science standards, research methods, reference material and other tools in order to incorporate personalized medicine into their current regulatory practices.
There are many existing methods to evaluate heterogeneity. Traditionally, we often conduct the subgroup analysis in clinical trials. Statisticians test for differential treatment effects among subgroups of patients in a very straightforward way (i.e. by adding a treatment-by-subgroup interaction term to a model). Consistent recommendations are that a small number of subgroups be specified in advance, that interaction tests be used, that all sub-group analyses be reported (a priori and post hoc), that multiplicity adjustments be considered, that interpretation of findings should be viewed cautiously even in the presence of significant multiplicity-adjusted
Therefore, novel methodologies are developed for personalized medicine which are generally in 3 categories. The first approach focuses on treatment by subgroup interaction detection. For example Su et al. (2009) and Lipkovich et al. (2011) developed the interaction tree methods by building splitting rules based on covariate-treatment interaction tests. The second category of methods are two-step methods (Cai et al., 2011; Zhao et al., 2013; Foster et al., 2011; Faries & Obenchain, 2013). The first step is to estimate differential treatment effect of each individual patient measured by a score function, then use the score as responses to establish relationship with covariates as the second step. The third class of methods are based on value functions which evaluate the patients benefit. The optimal personalized treatment recommendation rule is based on maximizing a special value function (Qian & Murphy, 2011; Zhao et al., 2012; Zhang et al., 2012).
New methodologies greatly extend our ability to explore solutions for personalized medicine, but there are also some limitations of these methods. First, the concept of subgroups may look like intuitive, but there is no consistent analytic definition. Instead of providing analytic definition of subgroups, different researchers may use a surrogate to search “subgroups”, such as largest treatment difference (Lipkovich et al., 2011) or smallest
In addition, the current methods primarily focus on learning precision medicine solution based on randomized control trials (RCTs). However, there are growing needs to develop personalized medicine solution based on observational studies, electronic medical records, and insurance claim database. First, payers are not only interested in efficacy data from RCTs but also the more generalizable effectiveness results from real world evidence. Second, not all the treatments are compared in RCTs but this information is often available in real world data. Third, most RCTs are not powered for subgroup analysis, but the real world data typically has much larger sample size. However, the use of real world data adds the additional challenge of addressing the confounding present in such data as part of the personalized medicine solution.
The purpose of this paper is to develop a method meeting the needs for drug development. We may comprise certain theoretical properties with practical requirements. The prioritized needs are:
The results are easy to interpret and easy to be implemented in clinical settings. The method is able to handle data from randomized control trials and also from observational studies. The method is capable to deal with multiple treatments. The framework is general enough to handle binary, continuous, time-to-event endpoints.
Therefore, we propose such a method that approximates a target function whose value directly reflects correct treatment assignment for patients. We show that our method naturally connects the subgroup identification and individualized treatment recommendation methods. The rest of this paper is organized as following, we propose our method in Section 2. Within this section, we start to introduce the general framework of individualized treatment recommendation, and then demonstrate the connection with subgroup identification. We present methods for both two treatment and multiple treatments. How to improve the numerical stability is also discussed. In Section 3, we introduce our search algorithm and demonstrate numerical results through multiple simulation studies. Real data analysis is conducted in Section 4. We close this paper with a discussion in Section 5.
In this section, we introduce the framework of individualized treatment recommendation, connect it with subgroup identification problems for multiple treatment subgroup identification methods, and in the end numerical stability issue is discussed.
Individualized treatment recommendation
We have a random sample of size
The research question for individualized treatment recommendation or subgroup identification is only valid when multiple treatment options are available for the same subject. In other words, if only one treatment option is allowed or available for certain subjects, the optimal treatment is the only available treatment where the research question is trivial. Therefore, without loss of generality, our population space
The expected value of treatment benefit with respect to
Our goal is to estimate
where
Illustration of Individualized Treatment Recommendation. Each subject has one covariate from 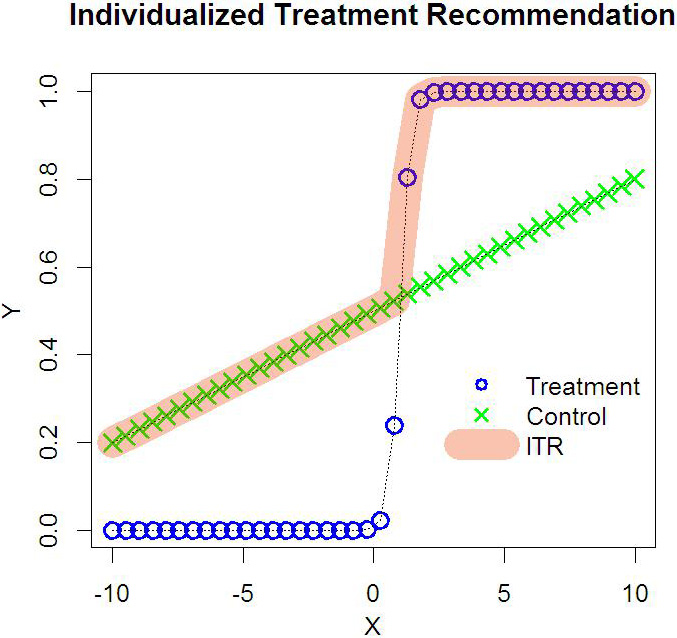
Illustration of Individualized Treatment Recommendation. Each subject has one covariate from 
Figure 1 is an intuitive explanation of Eq. (2). In this simple example, we have only one covariate
Figure 2 illustrates another example common to placebo-controlled randomized clinical trials. In panel (a), subjects on treatment group have better outcome than those on the control arm regardless of their covariates. Obviously, the optimal treatment recommendation for each subject is to take treatment. However, to develop a new drug, we often look for a nontrivial benefit over the traditional therapy or placebo. Therefore, we can shift the outcomes from the control group by adding a nontrivial benefit margin as shown in panel (b). So that the ITR method can help us to identify the subjects with a pre-defined nontrivial benefit. This is important for payers since the new treatments usually have higher cost than generic drugs, and we look for the nontrivial benefit to justify the price. This is also helpful to design a future trial because, to increase the chance of success, it is important to choose an appropriate study population for which the new treatment is expected to have nontrivial overall benefits that compensate for its risks and/or costs. Figure 2 provides an intuitive example on how our ITR method could connect with subgroup identification methods.
Qian and Murphy (2011) propose Eq. (2), and solve it using a two-step procedure. In the first step, a linear model is applied to sufficiently approximate the conditional expectation, with the estimated rule derived via
Therefore, these limitations motivate us to develop a simple yet direct approach. In this paper, we connect optimizing the value function Eq. (2) with subgroup identification, and provide algorithm directly searching all subgroups with rectangle shapes. Our goal is to generate easy to interpret subgroups, and the methods not only handle data from randomized control clinical trials but also observational studies.
One key challenge of existing subgroup identification methods is the lack of analytic definition of subgroups. It is important to have a clear objective on why we need subgroups. The purpose of subgroup assignment should maximize the defined objective function. Then, we can classify patients into different subgroups to maximize the objective function. Therefore, subgroup identification is a classification problem. However, many methods estimate the underlying functions first, then classifying the patients into different subgroups (Cai et al., 2011; Zhao et al., 2013; Foster et al., 2011; Faries & Obenchain, 2013). It is obvious that if we can estimate the underlying function correctly, we can do the classification. But the cost of estimating functions is high which often depend on strong modeling assumptions. Since our ultimate goal is classification, directly classification methods should be more efficient.
Our definition of subgroup is a way of treatment assignment which maximize the total patients benefit if it is followed by the entire patient population, which is consistent with Eq. (3).
To illustrate our point, we start with a simple case with binary treatment. Let
to maximize
The interpretation of Eq. (4) is straightforward which simply assigns a treatment to patients who can benefit more from it. In other words, a patient with a covariate vector
where
In practice, we are not only interested in developing individualized treatment recommendation, but also interested in identifying subgroup of patients which are suitable for a certain treatment. The ideal subgroups are defined by simple and easy to interpret rules. Therefore, if our purpose is to provide treatment recommendation for a group of patients, i.e.
which is equivalent to,
Therefore, our subgroup identification method for binary treatment situation is described by the following proposition.
.
Let,
where
where
Equation (8) is evaluated by observed data where
and
where
Proposition 1 provides a unified framework for individualized treatment recommendation and subgroup identification. The framework is very general. Here responses
If we require nontrivial treatment benefit for a new treatment as illustrated in Fig. 2, the modified response can be written as below,
where function
Since treatment
.
When there are multiple treatments, the optimal individualized treatment recommendation is
The optimal individualized treatment recommendation for a subgroup of patients
Let
where
Since we do not know the distribution of
Searching
where
Following the idea in Liu et al. (2014), we introduce the following numerical stabilization algorithm. First, instead of using the original
where
Suppose that we can find a consistent estimate of
This eliminates the impact on
In this section, we describe our algorithm and implementation for two treatments situation, then we use 5 simulation studies to evaluate its performance.
Implementation
As we discuss in the introduction, our paper focuses on meeting the needs for drug development. We are interested in subgroups with open rectangle shape (e.g.
Our searching algorithm for patients who should be on treatment can be described as the following steps,
We have the observed data as We fit a linear model with For a given number of covariates For each selected covariate, we choose a split value For each split value, we select a direction to define the subgroup. It can be After we have a subgroup in step 3, we assign treatment to this subgroup
By selecting different covariates, split values, and directions, we can evaluate all the value functions
Speed test for ITR algorithm. From panel (a) and panel (b), the time spent is in an exponential shape as the number of parameters increasing. In panel (c), the time spent is in an approximately linear relationship with the sample size.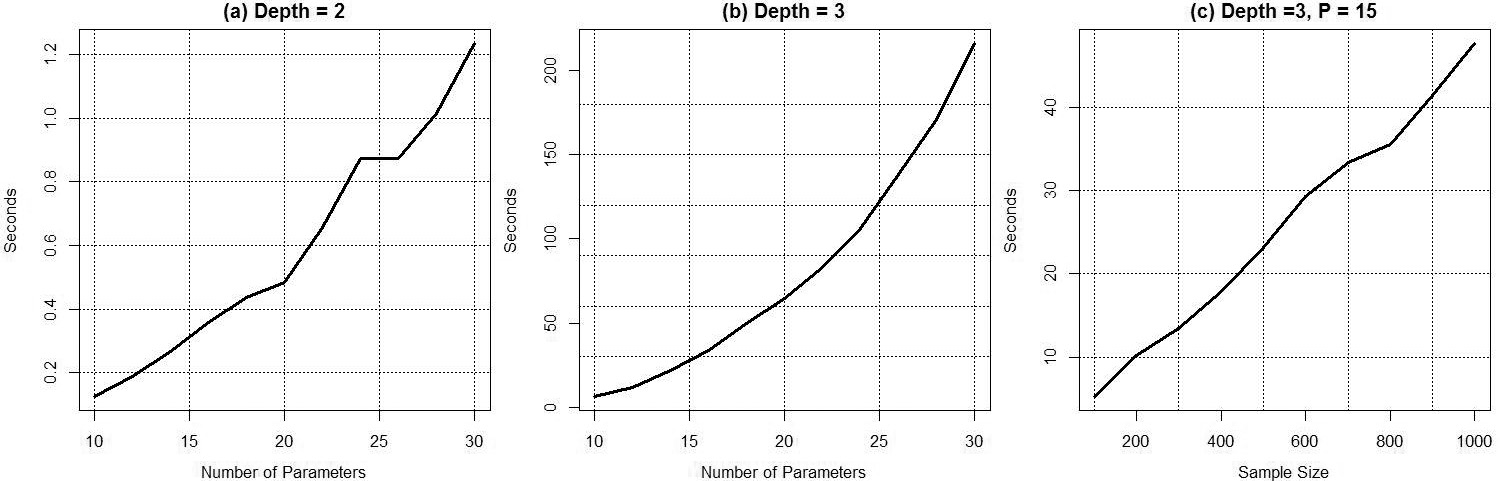
In this subsection, we design 5 simulation studies to evaluate our algorithm.
Speed Test: The comprehensive search is computational intensive, because there are many combinations to define a subgroup. For example, if we have Improve Numerical Stable: The second simulation is to demonstrate the procedure described in Section 2.3 can improve the numerical stability. We simulate 4 covariates
We do not include random noise
Improving numerical stable. Data are generated from Convergence in RCTs: It is natural to ask whether our algorithm can converge to the truth when sample size or signal-noise ratio becomes larger and larger. We design a simulation study to answer this question in RCTs settings. We have 4 covariates
where
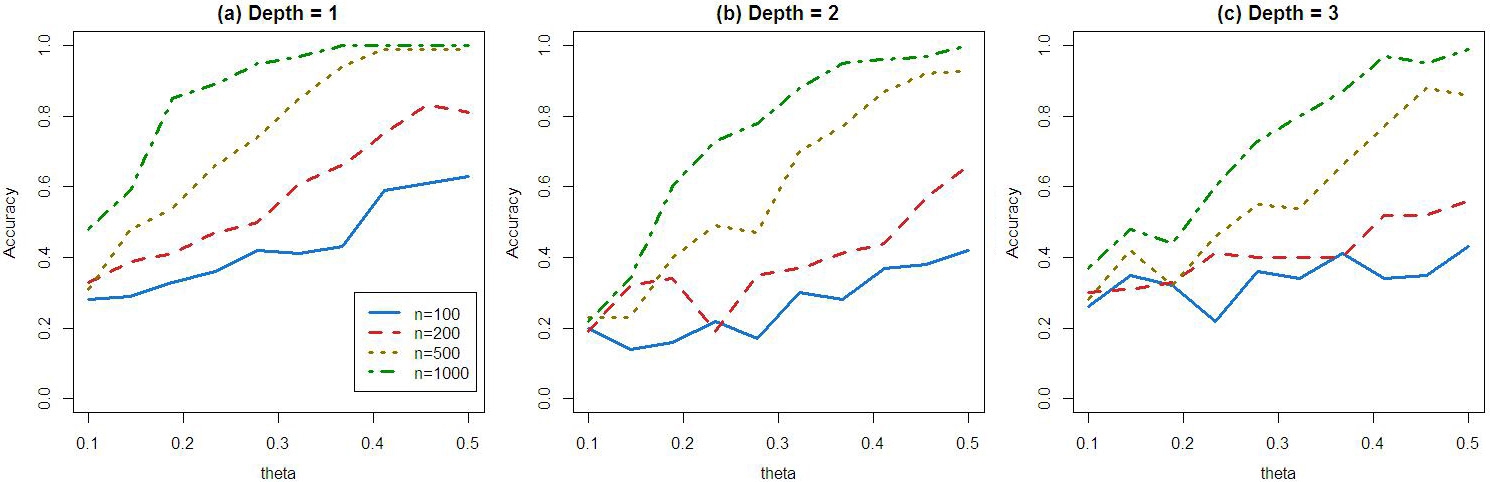
When depth is equal to 1, When depth is equal to 2, When depth is equal to 3, Study sample sizes are tested at 100,200,500,1000. The treatment is randomly assigned with probability equal to 0.5. We use
Algorithm convergence. Data are generated from simulated randomized control trials. These three plots illustrated that when sample sizes or signal-to-noise ratio go to higher, the algorithms become more accurate and converge to the truth. Convergence in Observational Studies: We design this simulation study to evaluate the performance of our method to identify correct subgroup when treatment assignment depends on covariates. We have 5 covariates
where
where we let Algorithm convergence for simulated observational studies. Data are generated from simulated observational. The table shows that when sample sizes

Variable importance. We have 10 variables, and the true subgroup is defined by variable 4 and 6. We have 500 simulations, and in each run we count the relative frequency for each variable to define the 5% ITRs associated with the highest value functions.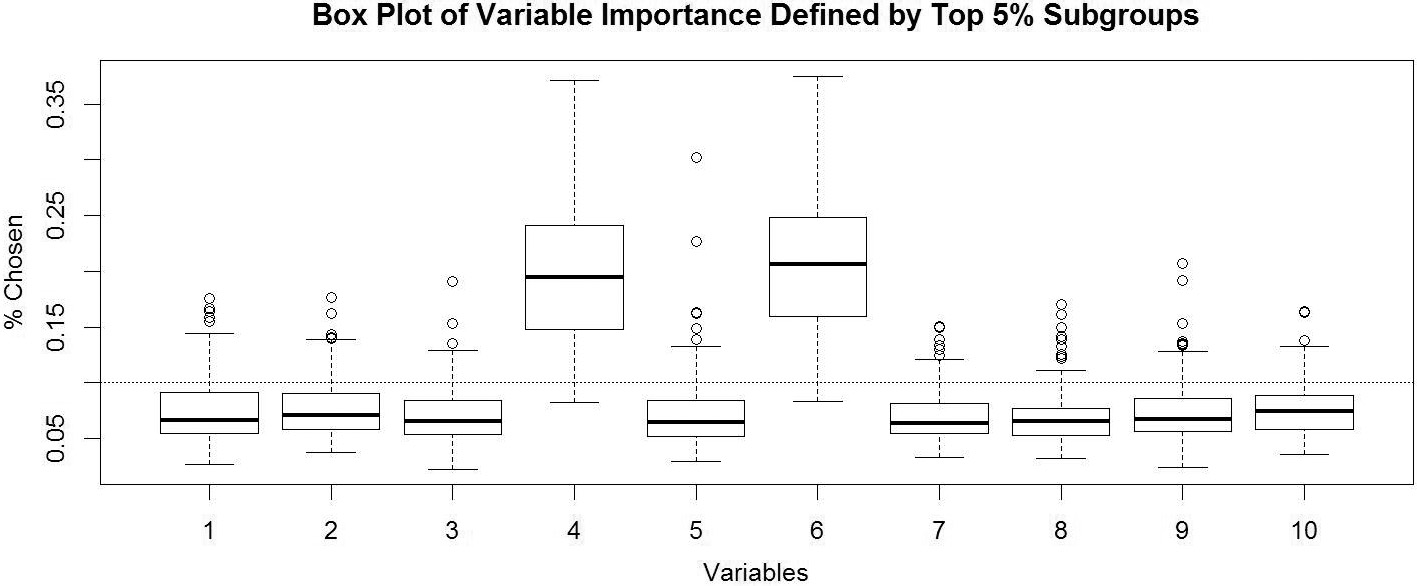
Variable Importance: It is often asked that which depth is a reasonable number to choose. We may introduce redundancy to use depth equal to 3 when the true depth is 2, and we may miss some signal to use depth equal to 2 when the truth is equal to 3. To answer this question, we need a way to evaluate the relatively important of the variables. This simulation demonstrates that our method is able to identify the important variables to define subgroups. We have 10 covariates
where
Diabetes mellitus, or simply diabetes, is a disease characterized by elevated blood glucose. It is a major cause of kidney failure, nontraumatic lower-limb amputations, blindness, heart disease and stroke. As a result, diabetes is one of the leading causes of death. Based on the data from Centers for Disease Control and Prevention (
Variable importance for the real data. We apply ITR with depth equal to 3, and rank the variable relative frequency for the top 0.01% ITRs.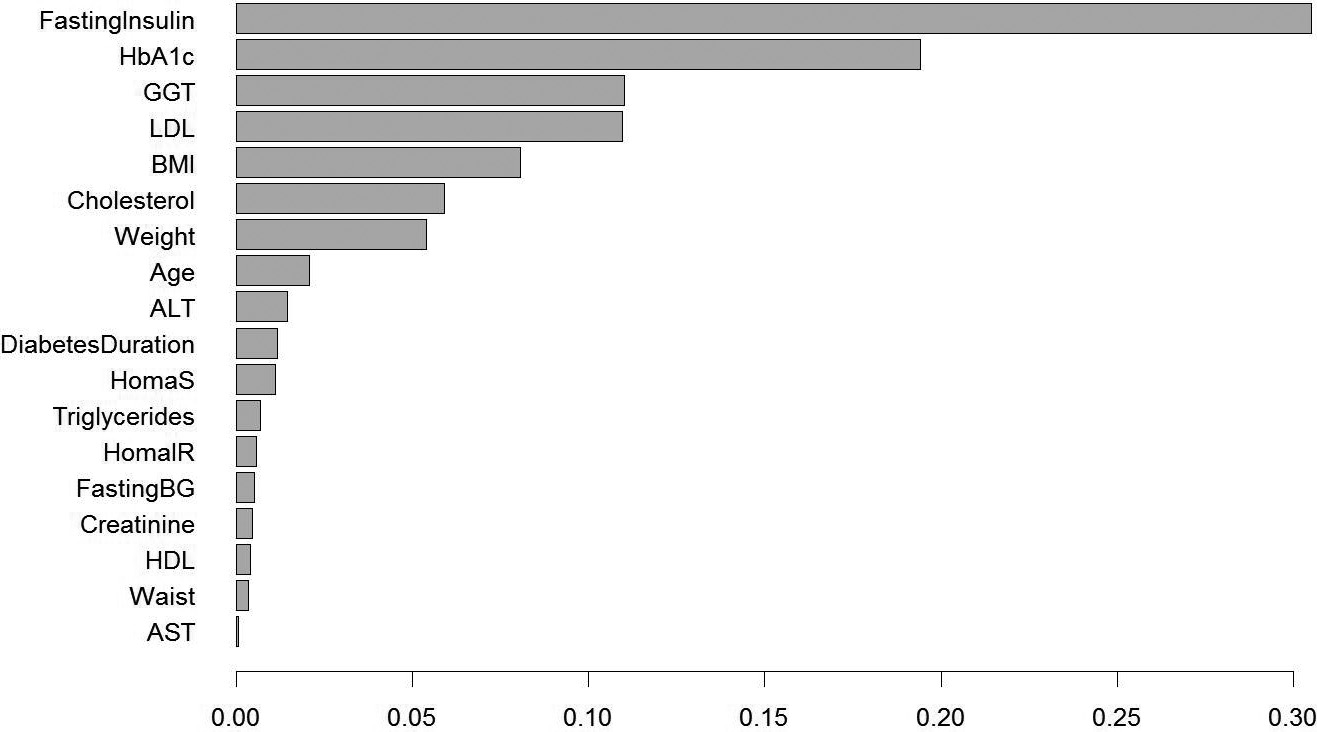
In our analysis, we include 22 biomarkers measured at baseline. They are: Age, ALT, AST, BMI, Diastolic blood pressure, Systolic blood pressure, Cholesterol, Creatinine, Duration of diabetes, Fasting blood glucose, Fasting insulin, GGT, HbA1c, HDL, HomaB, HomaIR, HomaS, LDL, Pulse, Triglycerides, Waist, Weight. The reason that we use acronyms for some of these biomarkers is because they are standard names in clinical practice which could be used more often than their full names (e.g. BMI vs. body mass index).
As an initial step, we fit our data with a depth equal to 3. Therefore, we have 35,925,120 candidate ITRs to define the partition of our patient population. Each ITR is corresponding to a value function which measures the overall benefit under this rule. We select the top 0.01% ITRs which have the smallest value functions (smaller HbA1c change from baseline means a better efficacy). Then we plot the frequency of the biomarkers in Fig. 7. From the figure, we can see that the top 2 biomarker fasting insulin and baseline HbA1c are standing out. Therefore, we decide to use depth equal to 2 to fit the data.
HbA1c Reduction Before and After Following ITR. Patients with baseline fasting insulin
We fit our final model with depth equal to 2. Then there are 224,532 candidate ITRs. We rank all the value functions corresponding to each ITR. The smallest value function is associated with the ITR is that baseline fasting insulin
This simple rule is not only easy to use but also medically meaningful. It is known that pioglitazone is insulin sensitizer which makes patients more sensitive to insulin. Gliclazide belongs to a class of sulfonylurea which push patients beta cell to produce more insulin. For patients with high fasting insulin, pushing out more insulin by gliclazide may not be a solution since they already have good amount of insulin. However pioglitazone make patients more sensitive to insulin, and as a consequence patients can better utilize their insulin to lower blood glucose. Patients who have higher fasting insulin and higher HbA1c are those patients who are insulin resistant while still have a good amount of insulin in their body. It is not surprising that insulin sensitizers, like pioglitazone, work better for those patients. This finding is aligned with the mechanism of action of these two drugs, and consistent with other results (Charbonnel et al., 2005).
In this paper, we connect the outcome weighted learning approach by Qian and Murphy (2011) and Zhao et al. (2012) to traditional subgroup identification problems. This framework is general enough to handle data from randomized control trials as well as observational studies with 2 or more than 2 treatments. Furthermore, we developed a searching algorithm which is particularly tailored for drug developing for pharmaceutical companies. The algorithm focuses on searching easy to interpret treatment recommendation rules with an ability to select and rank variables.
One limitation of the current algorithm is not able to incorporate large number of coavariates. In current clinical trials, the number of key baseline covariates including demographic and lab data are often less than 50. We can safely say that our algorithm can handle most current late phase studies. However, when we consider more comprehensive biomarkers including genetics data, our algorithm will fail. As a future work, tree algorithms (Hastie et al., 2011) could be a solution to reduce the computational complexity.
Currently we are working on an extension to incorporate meta-analysis into this framework. Sample sizes for most of clinical trials are powered for the primary objectives of those studies, and often not for personalized medicine or subgroup identifications. Synthesising evidence from multiple studies could potentially develop more robust ITR. In particular, our current framework allows the treatment to depend on covariates, and
Footnotes
Acknowledgments
The authors are grateful to the editor, associate editor, and referees for review this article.