
Abstract
High-technology business acts as an important driver of any economy. Microeconomic factors influencing employment in small high-technology companies are identified and assessed in the paper. The case of high-technology manufacturing and knowledge-intensive services in Russian transition economy is discussed. The empirical part of this research is based on data provided by Business Environment and Enterprise Performance Survey (BEEPS). A two-step assessment procedure was applied in order to determine and estimate the factors of growth. Significant factors were selected with the help of best subsets regression and then these factors were further analyzed using OLS. Such an approach enables an increased explanatory power of the obtained results. It was found that younger companies have greater influence on job creation than older ones. Significant differences in growth factors between companies in high-technology manufacturing and knowledge-intensive services were demonstrated. This difference constitutes a new result in the research of growth of high-technology companies in transition economies. The suggested model could help to construct the companies’ rating, which would be useful for investors in the emerging markets with high volatility of assets’ prices and lack of information for investment analysis.
Keywords
Introduction
Which companies are growing? What are the vehicles and determinants of their growth? These questions are included in the agenda of a variety of academic research on industrial and corporate development. Several particular areas were defined among these studies.
One research path is based on Gibrat’s law of companies’ growth rates. Robert Gibrat in 1931 proposed that relationship between company’s size and its growth has a stochastic nature (Eeckhout, 2004), therefore growth rates do not depend on the firm’s size. This idea was supported in later years and was used in many empirical studies (Hall, 1987). The results of several contemporary studies have an ambivalent character and do not confirm Gibrat’s proposition for large and mature companies (Coad and Hölzl, 2012). However new empirical papers return to the idea of stochastic shocks which affect growth (Cefis and Marsili, 2005). (Audretsch et al., 2004) analyzing a survey of nearly 60 empirical studies proved that Gibrat’s law worked for services where growth rates were independent of size. The initial assumption of the second path can be summarized in the statement that most companies have a constant size and do not grow. Only a small group of specific companies provides the main contribution to the economy’s growth. Cohorts of gazelles (Birch, 2006), high-impact companies (Acs and Mueller, 2008; Acs et al., 2008), hidden Champions (Simon, 2009) are defined among these high-growth or fast growth companies (HGCs, FGCs). Many empirical papers confirm that young companies make the main contribution to job creation as well as to industry sales growth (Daunfeldt et al., 2014). Review of contemporary empirical research of HGCs based on developed European countries data is presented by Coad (Coad et al., 2014). The unstable character of growth is demonstrated there. Growth instability is especially strong when growth is measured in terms of employment. Most firms demonstrate employment growth only during a one-year period. “Stylized facts about HGCs” were determined based on the analysis of literature review (Acs et al., 2008; Kane, 2010; Audretsch, 2012; Haltiwanger et al., 2013). They include following elements:
Most companies do not grow, so a small number of companies generate the largest part of new jobs; HGCs in most cases are rather young but not necessarily small. Most growing companies are younger than average firm in the industry, and they create new jobs; The HGCs could be found in every industry and are not concentrated solely in high tech industries; High growth rates are not stable over time and it is difficult to predict which firms will demonstrate fast growth. The third path is related to the conclusion that companies’ growth depends on the combination of external and internal conditions. Many papers deal with macroeconomic level and their results prove that companies’ growth is influenced by macroeconomic and institutional conditions, regulative environment, regional characteristics and many other factors. Numerous empirical research devoted to microeconomic aspects of growth could be found, they demonstrate a wide range of determinants of the companies’ growth (Audretsch et al., 2006). Special attention of researchers and politicians both in developed and developing countries is paid to the perspectives of high tech and knowledge intensive companies’ growth. Their capacity to create innovations and absorb new technologies and markets determines national and regional competitiveness. UNIDO study (2015 report) shows that sustainable economic growth correlates with manufacturing industries’ growth rates; in addition, specialization on high tech industries positively influences the economy’s growth. New and growing high tech companies could be an employment source as well as a safety bag under economic decline (Haltiwanger et al., 2009; Stangler and Litan, 2009). In general, microeconomic determinants of high tech companies’ growth demonstrate different performance in developed and developing economies. The main goal of our research is to find out and to assess the influence of technological and strategic factors on private high tech companies’ growth in the Russian transition economy. Focusing our research only on Russia, we concentrate on the analysis of microeconomic growth determinants assuming that macroeconomic factors are similar for all national companies. Some spatial heterogeneity effects, which will be described later, are taken into consideration indirectly.
Most researchers separate general (external) influence factors from specific ones. General factors are related to supply and demand characteristics, and external environment. Demand factors deal with consumers’ needs, their attitude to risk and existing market realities. Supply factors include availability of technological information, raw materials and finance. Environment factors embrace legal norms, administrative rules, political modes etc. Corruption and competition limitations are often listed in this context for developing countries.
Company’s resources including innovative capacities and technical competencies, financial and labor resources, management system and corporate culture, business model and others are associated with specific factors.
Many research papers are devoted to growth factors of high tech entrepreneurship in developed countries. Piatier report was a pioneer research paper, which focused on high tech companies’ growth factors (Piatier, 1984). Several general factors including learning effect, bank financing availability, venture capital influence, and role of standards in new products development, were identified in this publication. Audretsch (Audretsch, 1995) found three factors, which shaped industrial evolution: technology, scale economies, and demand. Similar studies based on new empirical data appeared recently (Cefis and Marsili, 2005; Coad and Rao, 2008; Colombo and Grilli, 2010; Kane, 2010; Hall et al., 2016). It is reported that key factors include personal qualities of entrepreneur, market orientation, resources access, human capital, social capital, financial capital, intellectual property and others. Most studies assume that there is positive relationship between high technologies, innovations and growth. However, this statement needs to be tested. Daunfeldt (Daunfeldt et al., 2015) studied distribution of fast growing companies according to 4-digit NACE industries. Results revealed that high tech industries have fewer shares of HGCs than industries with lower level of research intensity. At the same time, there are more growing companies in knowledge intensive services sector.
There are rather few studies of microeconomic factors of high tech business growth in developing economies including Russia. This could be explained by the short-term period of Russian entrepreneurship in general and by the lack of reliable data.
Russia is a country with transition economy with combination of high level of research and education development and low level of innovative entrepreneurship. Many factors and barriers determine the development of high-tech business at macro, meso, and micro levels.
Lack of entrepreneurial traditions (Kihlgren, 2003), unfavorable institutional environment (Aidis et al., 2008; Bhaumik and Estrin, 2007), high level of administrative barriers (Molz et al., 2009) and other external factors still have great influence on the development of new business in Russia (Zhuplev and Shtykhno, 2009).
Authors of a few papers dealing with Russian technological companies (Shirokova et al., 2010) point out that Russian companies operate in hostile and instable environment therefore they have to find new ways to develop competitive business. Leadership characteristics of company’s founder and team quality become extremely important (Bruton and Rubanik, 2002). Shirokova (Shirokova et al., 2012) discovered three significant variables, which influence positively company’s growth (measured in volume of sales terms): quality certificate, restructuring, and environment hostility. Authors came to paradoxical conclusion about a positive influence of hostile environment, which is explained by the fact that in such case firms go through great fruitful efforts resulting in sales growth and costs decrease in short term. Under favorable conditions, they pay attention to long-term goals, which are not necessarily directly related with sales growth.
A brief review of empirical research of microeconomic determinants of company’s growth is presented in Table 1. Research problem, methods and results of each research are included in the table.
Selected empirical research of microeconomic determinants of company growth
Selected empirical research of microeconomic determinants of company growth
Consequently, the results of microeconomic determinants’ assessment are ambiguous; they depend on data sets and selected methods of assessment.
In most cases, researchers choose for assessment OLS, general regression models, logit and probit regression methods (Daunfeldt et al., 2013).
Characteristics of empirical data subsets make it attractive to use non-parametric methods, which are less sensitive to upwards excursions and violation of assumptions concerning distributions type. For example, Coad (Coad, 2010; Coad and Broekel, 2011) applied a vector autoregression model with quantile regressions to observe the coevolution of key variables. Haltiwanger (Haltiwanger et al., 2013) also used a non-parametric regression approach.
Researchers who work with companies’ surveys data face such typical instrumental problems as:
Data omissions and non-representative samples; Differences in observation periods. This is especially important for developing markets with a high instability of conditions and employment; Extremely skewed statistics; Regression to the mean that typically brings about a bias in favor of smaller firms.
As it was shown by Coad (Coad, 2010), the explanatory power of variables used in empirical research is not high (R-squared values are low), therefore the factors yet unknown might have a significant influence.
The empirical part of our research is based on the data on private companies created with the help of companies’ surveys conducted by World Bank once in 4 years – Business Environment and Enterprise Performance Survey (BEEPS).
BEEPS collects data from key manufacturing and service sectors in different countries. In the Surveys, a standardized survey instrument and a uniform sampling methodology are used in order to minimize measurement error and to yield data that are comparable across different economies. The last survey was done in 2012. According to the aims of our research, we formed a subset of Russian high-tech companies with number of employees from 20 to 100 according to Eurostat classification.
We divided our subset to two groups according to sectoral patterns of technological innovation: high-tech manufacturing sector and knowledge-intensive services.
According to Pavitt’s taxonomy (Pavitt, 1984) these groups include mainly companies which are specialized suppliers and companies providing informational services. Differences in technological trajectories are related to different growth determinants in these groups.
In order to form the sample of high-tech firms, we used an aggregation of the manufacturing industry (HTM companies) according to technological intensity. It is based on NACE Rev. 1.1 at 2-digit level (EUROSTAT Statistics) for compiling aggregates related to high technology and medium-high-technology: high technology includes the NACE codes 30, 32 and 33; medium-high-technology includes the NACE codes 24, 29, 31, 34 and 35.
The sample of high-tech knowledge-intensive services (KIS companies) was based on NACE codes 64, 72 and 73.
We selected sectors of high tech manufacturing (HTM companies) and knowledge intensive service (KIS companies), and chose companies which have 20–100 employees. We analyzed only companies, which existed during the whole period (until 2012). As we are interested only in “organic” growth, we do not take into account employment changes due to mergers and acquisitions. Companies with incomplete data were excluded from the subset. Finally, we obtained two groups, which are described below.
General characteristics of sample
General characteristics of sample
The sample of high-tech manufacturing consists of 176 observations (162 after correction for missing data) and the sample of knowledge–intensive services includes 88 ones (77 after correction for missing data).
Service companies are on the average younger and have fewer employees but these employees are more qualified. In the majority of cases, companies in both samples are controlled by only one owner.
The average size of a high-tech manufacturing firm has diminished in past 3 years. The average growth rate is positive, yet less than half of the sample is growing.
The average size of KIS companies, on the other hand, has increased, and more than half of the sample is growing, with the average growth rate exceeding one for manufacturing companies. It should be pointed out that similar results were initially obtained for developed countries by (Henrekson and Johansson, 2010).
The share of high growing companies (companies with annual growth rates no less than 20%) in the HTM group is 9.7% while in the KIS group it is 11.4%. It should be noted that both figures are rather high.
Distribution of companies according to the number of employees’ growth rates.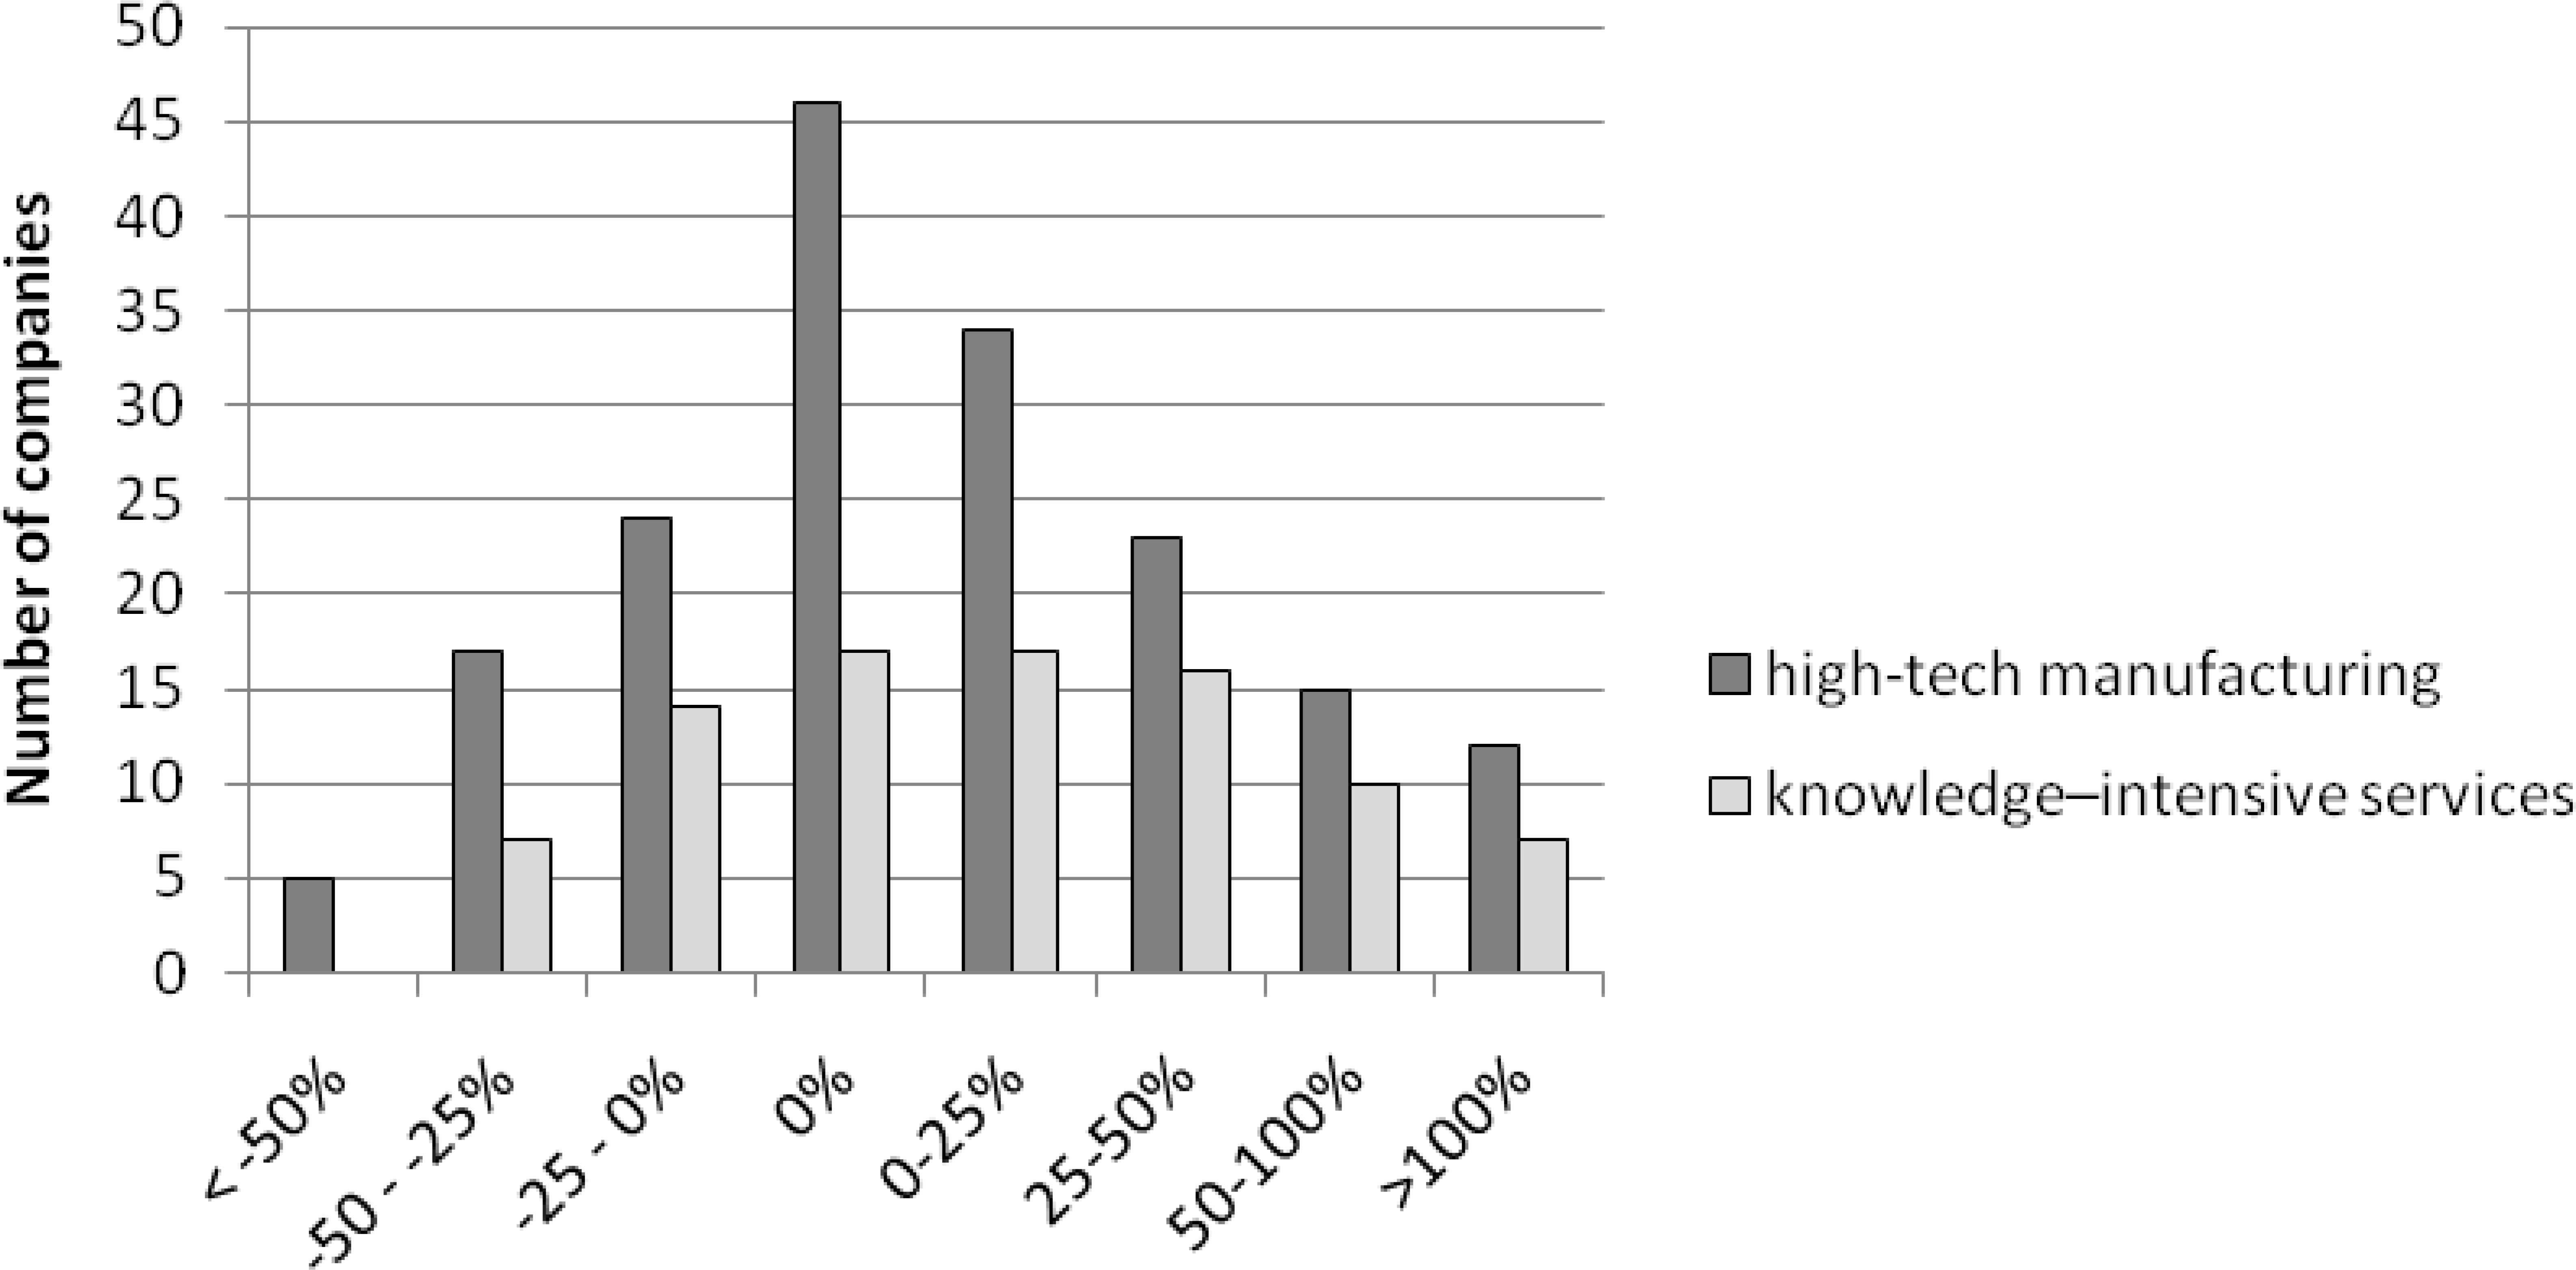
Service companies receive fewer subsidies and less often ask for bank credits. At the same time, they buy machines and equipment as often as high-tech manufacturing companies and use more foreign licensed technologies.
General analysis of innovative activities showed that on average high-tech manufacturing companies are more engaged in innovation activities and spend more money on R&D comparing to service companies.
General sample characteristics are presented in Table 2 and Fig. 1.
Figure 1 shows how many companies have the number of employees’ growth rates in certain intervals. We observe that 26% of high-tech manufacturing companies and 19% of knowledge-intensive services have zero growth rates – they did not change in size. 26% and 24% of the companies have become smaller. The majority of the companies – 48% of high-tech manufacturing companies and 57% of knowledge-intensive services – are growing. Shares of companies belonging to the intervals with higher growth rates are higher for knowledge intensive services. On average knowledge-intensive services are growing faster – average growth rate is 25.9%, with average growth rate in high-tech manufacturing being 18.3%.
A majority of authors use growth indicators like dynamics of employee number, sales, productivity, value added, etc. In general, these indicators are controversial (Shepherd and Wiklund, 2009; Daunfeldt et al., 2014). Indicator choice depends on the research aim and data availability. We are interested in the role of companies in job creation, therefore we have chosen dynamics of employees number as a dependent variable in our analysis.
In this research, we focus on specific growth factors, which are crucial given a common national macroeconomic environment.
The traditional Ordinary Least Squares regression (OLS) method was complemented with the application of a non-linear response transformation (within the framework of generalized linear models) and the best subsets approach; this made it possible for us to deal with the problem of skewed distributions of continuous variables in our sample. MINITAB (version 17) was used to implement the regression and other statistical procedures.
We used the percentage growth (PG) in number of employees during last three years as the dependent variable (V1), and its non-linear transformations.
Explanatory variables were selected based on previous research of Russian companies (Shirokova et al., 2010; Shirokova et al., 2012; Bahadir, 2009) and availability of data in BEEPS.
Among specific factors influencing company’s growth we have chosen factors related to innovation capability (V4, V6, V7, V8, V9), human capital (V11), resource conditions (V10) and financial and credit constraints (V13 and R1-R5). Regional characteristics are reflected by the distance from company’s residence region to Moscow (V12). All variables used in our analysis and their brief description are presented in Table 3.
Variables used in equations
Variables used in equations
Probability plot of PG, knowledge-intensive services.
Knowledge-intensive services
After cleaning up the initial sample and correcting for missing values, we ended up with 77 companies with a number of employees from 20 to 100.
While running OLS procedures for the response variable V1 (PG), residual analysis confirms the presence of heteroscedasticity and skewness of the distribution of response. Fast growing companies become the outliers, and their growth is poorly explained by a linear model (see Fig. 2 for normality testing of PG: Anderson-Darling test rejects normality with
That prompted us to transform the dependent variable (within the GLM framework). The best transformation, which achieved a feasible normality of
which allows one to address both positive and negative values of the initial response and also to maintain their sign (see the results of Anderson-Darling normality testing in Fig. 3).
Best subsets regression with predictors V2-V13 and R1-R5 suggested two candidate models with minimal Mallows’ Cp-statistic. The first model has four predictors: V2, V3, V11, V13 (the adjusted R-square equals 20.27%). The second model (the adjusted R-square equals 21.4%) in addition to the listed includes V6 (introduction of new or improved services), but this variable proves to be not statistically significant at 0.1 level. The model summary is presented in Table 4.
Regression equation and model summary, knowledge-intensive services
Regression equation and model summary, knowledge-intensive services
Probability plot of transformed PG (TPG), knowledge-intensive services.
It should be noticed that variables V3, V11 and V13 are also obtained by OLS for non-transformed dependent variable PG. However, V2 is significant only in the model with transformed response. Coefficients are statistically significant at 0.1 level. There is no evidence of substantial multicollinearity, which is illustrated by low values of variance inflation factors (VIFs).
For this model we observe only four outliers (three of them on the negative side), which indicates a satisfactory fit for fast growing companies. Residual plots look reasonable since the transformation of the dependent variable helps to address heteroscedasticity.
Additional analysis of individual significance of the binary variable V13 (application for credit or loans) and categorical variables R1-R5: two sample t-test for the difference of means was applied to the sample of TPG split into two subsamples by the values of V13. One-tailed t-test is significant at 0.01, which suggests that binary predictor V13 is significant for the service company growth.
Non-parametric Mann-Whitney test was applied to the sample of PG split into two subsamples by the values of V13. The results of the test are insignificant.
The results of one-way ANOVA analysis of the dependence of TPG on R1-5 were also insignificant.
After cleaning up the initial sample and correcting for missing values, we ended up with 162 companies (out of 176) with a number of employees from 20 to 100.
Similarly to the case of knowledge-intensive services, in order to address the cases of fast growing companies, we apply to the response variable “percentage growth in employment (PG)” the same square-root transform (TPG).
Best subsets regression with predictors V2-V13 and R1-R5 suggested only one candidate model (see Table 5). One may observe that variables V3 (age of company, negative impact) and V11 (education level of employees) have a similar effect to one reported for knowledge-based services. However, positive impact of V5 (subsidies) and V10 (fixed assets purchase) is unique for high-tech manufacturing and was not detected for services. The negative impact of variable V6 requires some additional explanation. All coefficients are statistically significant at 0.1 level. Absence of multicollinearilty is illustrated by low values of variance inflation factors.
Regression equation and model summary, high-tech manufacturing
Regression equation and model summary, high-tech manufacturing
Normality test for residuals for TPG, high-tech manufacturing.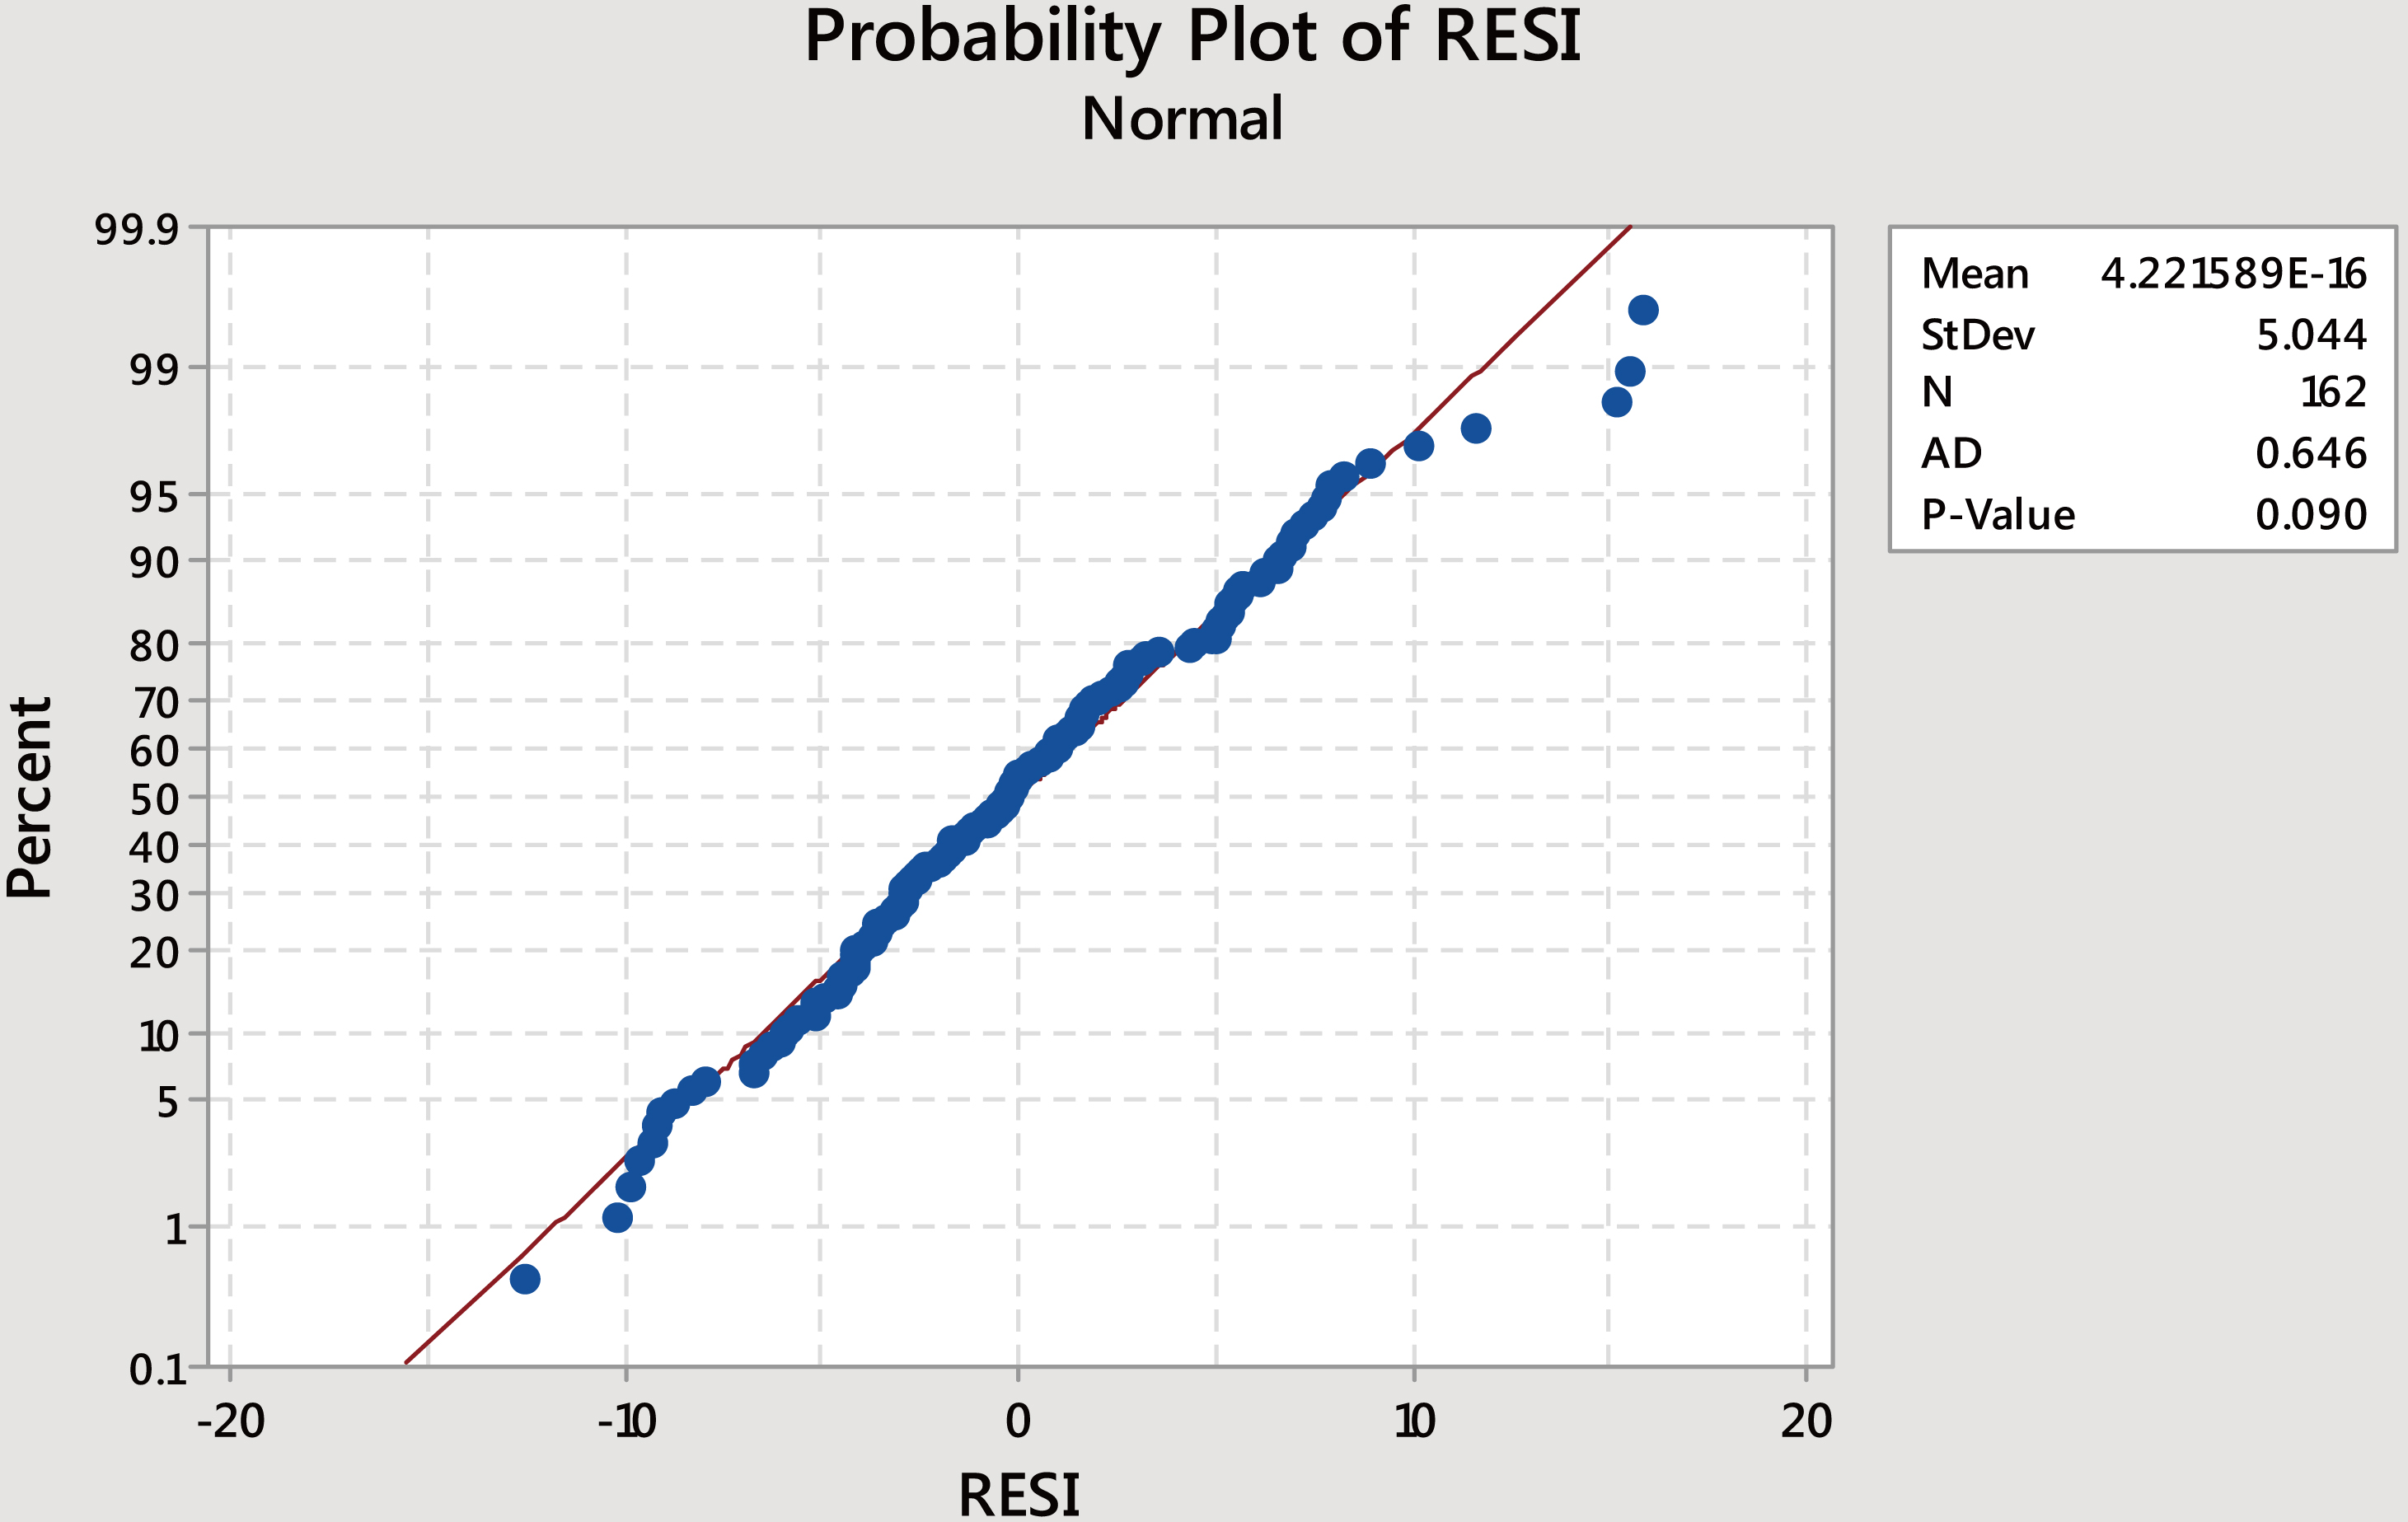
We observe multiple outliers (both high residual values and high leverage values), which indicates a more problematic fit for manufacturing companies, especially for fast growing companies. Residual plots look reasonable since the transformation of the dependent variable helps to address heteroscedasticity.
More particularly, Anderson-Darling normality test for residuals brings about satisfactory results, hypothesis of normality is not rejected at the level 0.1.
Additional analysis of individual significance was applied to the categorical variables R1-R5 and also to the binary variables V5 and V10. The results of one-way ANOVA analysis of the dependence of TPG on R1-R5 were insignificant similar to the case of knowledge-based services.
One-sided non-parametric Mann-Whitney test was applied to the sample of TPG split into two subsamples by the values of V5 and V10. The results of the test for V5 are insignificant at 0.1 level, while the results of the test for V10 are significant at 0.0005 level, which allows for the suggestion that the purchase of fixed assets plays an important role in the employment growth of high-tech manufacturing companies.
The presented method application made it possible to define different factors, which are significant for the explanation of employment dynamics in Russian small high-tech companies.
Age of the company is a common growth determinant negatively related to employment increase. This means that new jobs are created mainly by young companies. This conclusion confirms previous results obtained by other researchers (Kane, 2010; Henrekson and Johansson, 2010; Haltiwanger et al., 2013; others).
Share of employees with a university degree is another common factor having positive influence on jobs creation. It should be noted that lack of qualified staff is considered to be the main growth barrier by Russian high tech companies.
Technological characteristics of companies are reflected in differentiation of significant growth factors for high-tech manufacturing companies and knowledge-intensive companies in services. This can be possibly related to the fact that high-technology manufacturing deals with long-circle technologies, high entry costs, capital intensity and long-term production. Services, which are represented in our sample mainly by IT firms, are based on short-circle technologies with low entry barriers, quick changes and low capital intensity.
Knowledge-intensive companies in services
Employment growth of KIS companies is negatively related to company’s age and positively related to highly qualified employees. Two more factors also turned out to have positive influence. They are: “Percentage of the firm owned by the largest owner” and “Application for any loans or lines of credit in the fiscal year”.
In most Russian companies, ownership is highly concentrated. One can assume that ownership consolidation helps to make quick operative decisions and to decrease agent’s costs related to disperse ownership structure. Besides as entrepreneurship in Russia has rather short history usually in small and medium size businesses company’s owner acts as chief executive manager (CEO).
Application for credits is a signal that managers and owners are confident of growth perspectives. Lack of financial limitations also helps to hire new employees.
High-tech manufacturing companies
In addition to the common determinants mentioned earlier employment growth in HTM companies depends also on state subsidies and fixed assets’ purchase.
Nowadays government in Russia (both federal and regional) continues to support industrial enterprises in the form of subsides, remains a significant investor in equity and takes an active part in market transactions using state procurement system.
State subsidies are to some extent a substitution of undeveloped financial markets and serve as significant source of investments for manufacturing companies, helping to deal with financial limitations. “New assets” purchase means an increase in operation scale and new jobs creation.
Negative relationship between innovations in previous three years and employment increase turned to be an unexpected result. Possible explanation could be that companies are orientated on process innovations, which are capital-intensive and labor saving and lead to jobs’ cut. Such a result needs more studies and analysis.
Our results seem to be significant not only for growth and industrial evolution studies but for state innovative policy also.
Revealed characteristics of high tech companies and suggested approach to the assessment of factors influencing their growth could be interesting for asset managers and investors in the start-ups companies. When making a decision to invest in Russian high tech companies, it is worth looking at young companies with highly qualified employees as our research shows that the age of the company and share of employees with a university degree are important growth factors.
The suggested model can help to construct the companies’ rating, which would be useful for investors in the emerging markets with high volatility of assets’ prices and lack of information for investment analysis. The appendix provides some details about the model factors and model performance for two sectors of high tech companies: knowledge-intensive services and high-tech manufacturing.
The suggested rating approach could be recommended for the investment analysis of different high-tech companies. However it works better for knowledge-intensive service sector. We consider that this is due to the peculiarities of the selected growth indicator (the number of employees’ dynamics). The indicator is more adequate to the specifics of the high-tech service sector represented in our sample mainly by ICT companies. It is the human capital of the ICT companies that creates competitive advantage, growth prospects and, consequently, their investment attractiveness.
The developed companies’ rating based on the contribution of the factors identified in the model, is more focused on avoiding Type II errors. Companies with low growth rates do not get to the top of the rating, though companies with high growth rates can stay at the bottom. It is assumed that for a rational investor with moderate risk aversion, it is better to leave a high growth company on a low position than to put a company with zero or negative growth to a high position. Real losses are worse than lost profits.
Footnotes
Acknowledgments
The study presented here is the part of the Project No 17-02-00221 “Development of High Tech Companies in Russian Regions: Factors and Barriers of Growth”, supported by Russian Humanitarian Scientific Fund. Accordingly, we are grateful to the individuals and institutions involved in this project. Finally, we are grateful for the constructive comments of two anonymous reviewers. Nonetheless, any errors in analysis and interpretation remain our own.
Appendix: Construction of companies’ investment rating
The rating of companies is based on the factors identified by our model. Each of these factors contributes to the explained variance of the observed variable – the growth of the number of employees. According to this contribution, we define the weights assigned to each factor.
For the knowledge-intensive services model we get the following data (see Table 6).
Factor analysis for knowledge-intensive services
Rating Eq. 1 for KIS
Rating
V2
V3
V11
V13
Residuals
Sum of squares
132.6729
226.3235
85.4186
89.7100
1649.0469
Deg. of freedom
1
1
1
1
72
Weight
0.2484
0.4237
0.1599
0.1680
The most significant factor is the age of the company (V3), the next is the percentage of the company owned by the largest owner (V2). The rest of the factors: V11 (the percentage of permanent full-time employees with a university degree) and V13 (application for any loans or lines of credit in the fiscal year) make approximately the same contribution and are less significant.
For the high-tech manufacturing model, the following data are obtained (Table 7).
Factor analysis for high-tech manufacturing
Rating Eq. 2 for HTM
Rating
V3
V5
V6
V10
V11
Residuals
Sum of squares
471.301
78.591
32.783
290.012
71.852
4096.317
Deg. of freedom
1
1
1
1
1
156
Weight
0.4990
0.0832
0.0347
0.3070
0.0761
The most significant factor here is also the age of the company (V3), the second factor in the contribution to the explained variance is V10 (purchase of any fixed assets), the contribution of the other factors is much smaller.
To calculate the rating scores, the values of the factors are normalized on a scale from 0 to 1. We obtain the following:
Binary dummies (V5, V6, V10 and V13) take the values 0 or 1 by definition; Variables V2 and V11 are percentages (normalized from 0 to 1); Variable V3 is ranked into 4 groups (designation of a firm to a particular group depends on the average growth of the number of employees for firms of the same age).
Grouping for Variable V3
Variable V3’
Knowledge-intensive services
High-tech manufacturing
1
Under 4 years
Under 5 years
0.75
From 5 to 8 years
From 11 to 15 years
0.5
From 9 to 14 years
From 6 to 10 years
0.25
From 15 years
From 16 years
We present the rating of companies obtained according to Eqs 1 and 2. The rating score is normalized from 0 to 1, where 1 is the highest score corresponding to the most attractive company.