
Abstract
Gradient boosted decision trees are statistical learning ensemble methods that iteratively refit decision tree sub-models to residuals. The aim of this research was to apply gradient boosted decision trees and investigate their ability as statistical techniques to predict gender based upon psychological constructs measuring motivations to participate in masters sports. Comparison was made between previously published research utilizing logistic regression, discriminate function analysis, radial basis functions and multilayer perceptrons with a selection of unboosted and boosted decision tree based models. The tree models selected were J48, C5.0, gradient boosted machine (GBM), XGBoost and LightGBM. The sample consisted of 3928 masters athletes (2010 males) from the World Masters Games, the largest sporting event in the world (by participant numbers).
The efficacy of tree based models for prediction in this environment was established with even baseline older implementations, giving higher prediction accuracy than any methods used in prior research. The highest predictive accuracy was achieved using GBM (0.7134), exceeding accuracies of models using XGBoost (0.7012) or LightGBM (0.6904). These two recent implementations of boosting may have given lower predictive accuracy than GBM due to the high dimensionality relative to the number of cases in the data.
Introduction
Background
With an obesity pandemic (R. Wallace & D. Wallace, 2016) linked to high levels of inactivity in obese adults, it is highly relevant to examine the psychological motivations of those individuals competing in sport at older ages. The aim of this study was the application of recent machine learning techniques in order to test the accuracy of gender prediction based upon the psychological motivations behind competition in sport for older adults. The nexus between health, physical activity and aging is a multifaceted complex problem, with differences apparent between genders (Meldrum, Morris & Gambone, 2017). Various studies have identified many characteristics and biochemical parameters as being significant factors behind obesity and elevated body mass index (BMI) (Das, 2011). Inactivity is a major cause of obesity, which in turn has a non-linear relationship with aging (Walsh et al., 2011a). The adverse effects on psychological well-being from obesity have long been recognized (Jackson, Beeken & Wardle, 2015). Additionally, many of the causes behind physical inactivity are also psychological, such as depression (Blaine, 2008). The billions of dollars in costs (Walsh et al., 2011b) both financially, but also in terms of lives with obesity the leading preventable cause of death behind smoking (Walsh et al. 2011b) make any investigation of this complex relationship a worthwhile endeavour. This manuscript does not aim to solve this multifaceted, global problem rather this manuscript deals with exploration of just one aspect, only loosely connected to a large a complex problem. However it is believed that by applying new modelling techniques and examining the potential for improvement to predictive accuracy, it may advance predictive capabilities and advance knowledge connected to relationships between gender and psychological motivations behind participating in sport or possibly identify better statistical learning techniques (or conversely identify poor techniques) and approaches that can be applied in sport and exercise science in order to further research these relationships.
Previous research (Heazlewood et al., 2016a) compared four supervised learning (Hastie, Tibshirani & Friedman, 2009a; Cambon et al., 2015) models in terms of their ability as statistical techniques to classify the different genders based upon 56 psychological motivational questions associated with motivations to participate in masters sports. The four supervised learning models used were neural networks (radial basis functions and multilayer perceptron), discriminant function analysis (a more traditional statistical approach under the general linear model) and logistic regression. This in turn built on previous research assessing classification accuracy for karate ability using neural networks and discriminant function analysis (Heazlewood & Keshishian, 2010). Comparing the four methods (Heazlewood et al., 2016a) none of these classification techniques based on neural network analyses, the multivariate method of discriminant analysis or logistic regression were overtly superior to each other. Classification accuracy was highest for each gender individually and also in overall terms (0.644) using a multilayer perceptron (MLP) whilst the radial basis function neural network displayed classification accuracy slightly lower (overall 0.605) than the other three methods (0.633 for discriminant function analysis and 0.630 for logistic regression). The classification accuracy of 0.644 for the MLP marginally outperformed the other methods and displayed a reasonable level of predictive validity.
These studies, whilst showing reasonably similar classification accuracies for the different models did not include any tree based (based on decision trees) supervised learning methods. The aim of this study was to investigate whether prior predictive accuracy scores could be improved in order to make more effective group membership predictions based upon gender using gradient boosted (Friedman, 2001) ensembles of decision trees. Five methods were investigated, a provisional test using a very traditional decision tree without boosting and its more modern evolution, a gradient boosting machine (GBM) (Friedman, 2001) a more recent implementation of this method referred to as extreme gradient boosting (XGBoost) (Chen & Guestrin, 2016), as well as another alternative methodology for building on GBMs, Microsoft’s LightGBM. Current accuracy scores from prior research using MLP of 0.644 (Heazlewood et al., 2016a) have some promise, however it was believed if the accuracy of prediction could be significantly improved more cogent outcomes could then be applied in terms of gender classification based off these scales. It was our hypothesis that there would be improvement in accuracy using tree based methods to be significant when compared to previous research results (Heazlewood et al., 2016a), however whilst a progression, this still might not be adequate for meaningful practical applications of gender prediction from psychological motivations.
The World Masters Games and the motivations of Marathoners Scale
This manuscript hypothesises that it may be possible to improve accuracy of gender prediction from motivational psychological variables for athletes competing in masters sport by implementing more modern computational methodologies than used in prior literature. If significant improvement in accuracy is obtained there will be a better understanding of the relationship between motivation to compete in masters sport and gender. In this case it would warrant looking further to identify which variables provided the greatest difference between the genders, the establishment of a hierarchy of factor-variable importance. This might lead to practical applications in terms of for example motivating people to participate in sport throughout life. The following sections give a background to the World Masters Games, the largest sporting event in the world (by participant numbers) where the experimental data was gathered. Also the Motivations of Marathoners Scale was used to structure the psychological motivations questionnaire is presented.
World Masters Games
As defined by Raeburn and Dascombe (2008), masters athletes are those systematically training for and competing in organised sporting events designed specifically for older adults. The minimum qualifying age for competition in masters sport, varies by sport (Raeburn & Dascombe, 2009), gender and tournaments. Most masters athlete events structure competition between athletes of similar age ranges where possible. The World Masters Games (WMG) is the largest international sporting competition in terms of participant numbers. It is a non-invitational, quadrennial sporting event attracting tens of thousands of older adult participants, typically over the age of thirty (though as mentioned the exact age requirements for masters competitors vary by sport). In 2009, the Sydney WMG attracted 28,089 competitors who represented 95 countries, competing in 28 sports (Sydney 2009 World Masters Games Committee, 2009). Previous research has been conducted on health (Climstein et al., 2011; DeBeliso et al., 2011; Walsh et al., 2011c; Walsh et al., 2012, DeBeliso et al., 2014; Climstein et al., 2016), body mass index (Walsh et al., 2011a; Walsh et al.; 2011b), injury (Walsh et al., 2011d; Heazlewood et al., 2017) and psychological motivations to compete (Heazlewood et al., 2011; Sevene, 2012; Heazlewood et al., 2016b) at this competition.
Motivations of Marathoners Scales
The Motivations of Marathoners Scales (MOMS) (Masters, Ogles & Jolton, 1993) is used to gauge the importance of a range of psychological factors in determining sports participation. The age ranges in the research used to develop the MOMS survey instrument had significant overlap with age ranges of participants at the WMG and items identified in the MOMS have been demonstrated in other studies (Ogles & Masters, 2003; Havenar & Lochbaum, 2007; Ruiz & Zarauz Sancho, 2011; Buning & Walker, 2016) as important motivational constructs, with significant relevance (Heazlewood et al., 2012; Heazlewood et al., 2015; Heazlewood et al., 2016b; Heazlewood et al., 2016c; Heazlewood et al., 2016d) to masters athletes.
The MOMS psychometric instrument assessed participant motivation by nine constructs/factors using factor scores from a 56 item seven Likert type survey instrument measuring motivations to participate. The nine factors were health orientation, weight concern, personal goal achievement, competition, recognition, affiliation, psychological coping, life meaning and self-esteem. The most significant factors related to participation in the WMG cohort were the socializing environment of sport, getting physically fit and improving competitive personal best performances (Heazlewood et al., 2011). It should be noted that the MOMS scale has been used by psychology researchers for more than 20 years (and is still being used both within and external to the set ‘masters athletes’). Being able to predict gender or other attributes of participants from MOMS data has value of its own based solely on the additional information produced. Additionally further research on relationships between gender classification prediction and this scale may lead to supplementary insights that might assist in other research using the MOMS instrument.
The instrument was based upon a series of 56 questions and scored on a seven point Likert scale, where masters athletes were requested to rate each of the following items according to the scale below in terms of how important it is as a reason for them participate in their sport. A score of 1 would indicate that the item is “not a reason” for participation, whereas a score of 7 indicates that the item is a “very important reason” for participation and scores in-between these extremes represented relative degrees of each reason. The following are sample questions which sought responses to word stems such as: “To control my weight, To compete with others, To earn respect of peers, To improve my sporting performance, To earn respect of people in general, To socialize with other participants, To improve my health, To compete with myself, To become less anxious, To improve my self-esteem, To have something in common with other people, To add a sense of meaning to my life, To prolong my life and To become less depressed.”
With DFA and logistic regression using step-wise methods only a limited number of questions would be used in formulating a predictive model, hence the 56 questions were collapsed into 9 distinct factors in order to increase accuracy. Boosted trees utilize an ensemble of low accuracy predictors, meaning more data is often required, but subtle interactions can be modelled. Whilst there was some concern that the volume of participant cases might be low, modelling with gradient boosted and un-boosted trees was conducted using the raw 56 questions as opposed to collapsing the questions into 9 factors.
Machine learning methods investigated
Data mining methods, including tree, regression and neural network based models have been used across a wide variety of exercise and sports based applications (Heazlewood & Walsh, 2017; Soto Valero, 2016). A brief outline of the methods referred to in this study follows.
Decision trees
Decision trees (Quinlan, 1986) have been used for prediction for more than fifty years (Loh, 2014). A decision tree algorithm is a tree like model of decisions that usually works in a top down fashion (Rokach & Maimon, 2005).
A fairly conventional decision tree was used initially to provide a general bench mark for comparison of the boosted tree based models both with each other and also with prior research using other model types (e.g. neural network based models). For this a J48 decision tree was chosen. This is a Java based decision tree called using the RJava and RWeka packages to allow Java algorithms to be run in an R environment. The J48 decision tree is based on the C4.5 decision tree (Quinlan, 1993) traditionally is widely used and perhaps fair to consider as a gold standard for providing a bench mark as a traditional and established decision tree. There is a more modern version of C4.5 by the same author called C5.0. At one point access to C5.0 was restricted requiring a fee for use, however it is now freely accessible.
The J48 model was chosen as the basic benchmark as it is a non-boosted model, it was felt this would give a more appropriate comparison to the multi-layer perceptron, which in itself is not the most cutting edge application of neural networks (e.g. other implementations such as deep neural networks). If the benchmark accuracy of gender classification prediction scores was deemed to be comparative to those of other methods such as RBF and MLP, when using a model with an older methodology, then this would be a promising sign. The implication of this would be confirmation of the hypothesis that boosting tree based methods might be able to give an accuracy lift compared to previously researched methods such as MLP. It would also give justification for undertaking the computational intensive work involved with tuning more modern methods over a great range of parameters. Non-boosted decision trees share an advantage with the step-wise logistic regression and step-wise discriminant function analysis utilized in previous research (Heazlewood et al., 2016a), namely the models they produce are easy to interpret without hidden layers (Cambon et al., 2015). In order to give more comparative information on using decision trees, use of the more modern C5.0 decision tree was also investigated.
Decision tree algorithm
The basic format of a decision tree algorithm is similar for J48/C4.5 and an unboosted C5.0 decision tree. The C5.0 has several other features such as winnowing and allocating error costs.
Adapted from Kotsiantis (2007) and Kotsiantis, Zaharakis and Pintelas (2007) an example pseudocode algorithm for supervised learning with decision trees is:
Check for base cases (conditions where the method no longer needs to call on itself) For each attribute Let Recurse on the sub-lists obtained by splitting on
Neural networks (Fausett, 1994; SPSS, 2007a) are a loosely related family of models, characterized by a large parameter space and flexible structure, descending from studies of brain functioning. As the family grew, most of the new models were designed for non-biological applications, though much of the associated terminology reflects its origin in biology (Fausett, 1994; SPSS, 2007a). Specifically, a neural network resembles the brain in that knowledge is acquired by the network through a learning process whilst interneuron connection strengths, known as synaptic weights and analogous to human synapses, are used to store the knowledge.
A neural network can approximate a wide range of statistical models without requiring the researcher to hypothesize in advance certain relationships between the dependent and independent variables. Predictive neural networks are particularly useful in applications where the underlying process is complex, especially pattern recognition and classification problems that are based on predictive and concurrent validity.
Neural networks used in predictive applications, such as the multilayer perceptron (MLP) and radial basis function (RBF) networks, are supervised in the sense that the model-predicted results can be compared against known values of the target variables. These target variables are identified on an a priori criteria by the researcher. A neural network is a massively parallel distributed processor that has a natural propensity for storing experiential knowledge and making it available for use and is analogous to human brain function.
A neural network can approximate a wide range of statistical models without requiring that one hypothesize in advance certain relationships between the dependent and independent variables, a non a priori model. Instead the form of the relationships is determined during the learning process (Fausett, 1994; SPSS, 2007b). A type of neural processing phenomenology in this context. The trade-off for this flexibility is that the synaptic weights of a neural network are not easily interpretable. Thus, in order to explain an underlying process that produces the relationships between the dependent and independent variables, it would be more advantageous to use a more traditional statistical model, such as discriminant analysis, logistic regression or non-boosted decision trees. However, if model interpretability is not important, good results can be obtained using a neural network (Fausett, 1994; SPSS, 2007b). Although neural networks impose minimal demands on model structure and assumptions, unlike inferential statistics, it is useful to understand the general neural architecture or neural network structure. The multilayer perceptron (MLP) and radial basis function (RBF) networks are functions of predictors (also called inputs or independent variables) that minimize the prediction error of target variables (also called outputs) (Fausett, 1994; SPSS, 2007b).
Multilayer perceptron process
The MLP algorithm uses forward pass and backpropagation of error and is known as the Generalised Delta Rule (GDR) or the Back Propagation (BP) algorithm. A neural network has unknown parameters referred to as weights. As per other machine learning techniques we train models to identify optimal weights. In order to identify these weights a MLP requires minimization of a cost function
Where
MLP neural networks require an activation function to determine the output of a neuron, based on multiple neuron inputs. A common selection is a Sigmoid Function that will give a value between 0 and 1 as output and is differentiable. Sigmoid functions are valuable components of many machine learning methods. Using a Sigmoid Function Eq. (2) as the activation function, the term in Eq. (1),
The MLP neural network algorithm for training a predictive model is shown below:
Initialize network weights Train the network via the following steps and repeating this process until training is finished:
Conduct forward propagation to get Compute the cost function Compute partial derivatives of the cost function Minimize the cost function via gradient descent
The formula utilised for a RBF network is demonstrated in Eq. (4). On occasion this equation is expanded by adding further conditions or lower order polynomials. Equation (4) can be utilised as a simplified neural network using radial basis functions as the activation functions of the network. The three layers of the network are an input layer, a RBF hidden layer and an output layer.
Where
Each radial basis function has centre
Each radial basis function is weighted by
The choice of the RBF
Consider a continuous function defined on the subset
Discriminant function analysis (DFA) (Fisher, 1936), or discriminant analysis, based upon classification modelling, is applied to classify cases into the values of a categorical dependent variable, usually a dichotomy (SPSS, 2007b; Norusis, 1985). In this scenario males compared to females on different psychological motivations for competition. Prior research used a step-wise DFA approach (Heazlewood et al., 2016a).
Discriminant function analysis equations
DFA can be used via a classical or Bayesian approach. Consider an example with the classical approach, namely Fisher Discriminant Analysis (Fisher, 1936), for binary prediction. We have two classes (such as male and female)
Similarly variance,
For the
Discriminant Analysis aims to identify a weighting w which maximises Eq. (11). This is analogous to a signal to noise ratio. The value of
An expression for w can be derived as:
Logistic regression is similar to a linear regression model, however is suited to models where the dependent variable is dichotomous. Logistic regression coefficients can be used to estimate odds ratios for each of the independent variables in the model. Logistic regression is applicable to a broader range of research situations than discriminant analysis. Prior research used a step-wise logistic regression approach (Heazlewood et al., 2016a).
Logistic regression equations
In linear regression, the dependent variable is continuous, in logistic regression the dependent variable is a catergorical variable. Logistic regression is demonstrated by Eq. (13), where
The logistic function (Pierre-François, 1838) is used to give
A gradient boosting machine (GBM) is an ensemble method that iteratively refits decision tree sub-models to residuals. The foundations of GBMs were laid by Friedman (Friedman, 2001; Friedman, 2002), building on Friedman, Hastie and Tibishirani (2000) and proposing the GBM.
Simple ensemble methods rely on various methods of averaging sub-component models to produce a collaborative prediction. With boosting, new models are added in an iterative sequence with additional poorly predicting base learners trained with respect to the whole ensemble at each new step (Natekin & Knoll, 2013). GBMs fit new models by creating base learners at each step that are maximally correlated with the negative gradient of the loss function for the whole ensemble (Natekin & Knoll, 2013). Due to increased complexity, models created using GBMs and other boosted methods can lose some interpretability with regard to the underlying model structure compared to decision trees (Cambon et al., 2015).
Gradient boosting algorithm
Gradient boosting aims to minimise a loss function
The generic algorithm for gradient boosting using steepest descent is (Adapted from Friedman (2001), Hastie, Tibshirani and Friedman (2009b) and Benner, 2002) shown below:
First Initialize
Then for
It is necessary to fit
Estimate the unconstrained negative gradient using the expression of Compute the gradient step used by minimization of the loss function to generate required
Step 3 above minimises
In Eq. (18)
XGBoost is short for eXtreme Gradient Boosting. It is an efficient and scalable implementation of a gradient boosting framework (Friedman, 2001; Friedman, 2002). The XGBoost R package includes a linear as well as a tree (decision tree) based learning algorithm. For this study the tree based learning algorithm was used. A distinct advantage of XGBoost over GBMs is its automated parallel computation, however even in single threaded implementation it has been reported to be twice as fast as GBMs (Chen & He, 2015). In order to reduce overfitting, XGBoost implements dropout regularization for regression trees (DART) (Vinayak & Gilad-Bachrach, 2015). The main parameters for XGBoost are as follows:
Gamma: Gamma is the Lagrangian multiplier, it is utilized to control model complexity. This is the minimum loss reduction required to make a further partition on a leaf node of a decision tree. Its input is in the range from zero to infinity with a gamma value of zero representing no regularization and as gamma gets larger, the level of regularization increases (providing a more conservative algorithm).
Eta: eta is a learning rate, it is a step size shrinkage used to prevent overfitting. Following each boosting step, eta shrinks the feature weights for the new features, making the boosting process more conservative in terms of overfitting. Eta can take values between zero and one.
Maximum depth: this is the maximum depth of a decision tree.
Minimum child weight: larger values of minimum child weight help to reduce overfitting, when tree partition steps result in a leaf node with the sum of instance weight less than the minimum child weight, then further partitioning is halted.
Number of rounds: the number of rounds is the number of decision trees.
Subsample and column sample by tree: subsample is the fraction of records to sample without replacement, whilst column sample by tree is the fraction of predictors (i.e. attributes) to sample without replacement.
XGBoost is often a core component of winning models in machine learning prediction competitions (Chen & Guestrin, 2016) and it was expected to outperform all other models in this experiment, except possibly LightGBM.
XGBoost regularization and loss function equations
In boosted tree based models, the objective function (the function that is to be minimised)
XGBoost has a regularization term that uses penalties based on L1 regularization (Ng, 2004), L2 regularization (Ng, 2004) and also number of the leaves. The regularization term expressed in terms of these penalties (Chen, 2014) is given by:
Where
Example of hyper parameter tuning via grid search methods for J48 decision tree. Minimum instances per leaf is plotted against ROC (via Cross-Validation). The highest ROC value (produced via cross-validation) was 0.6367324.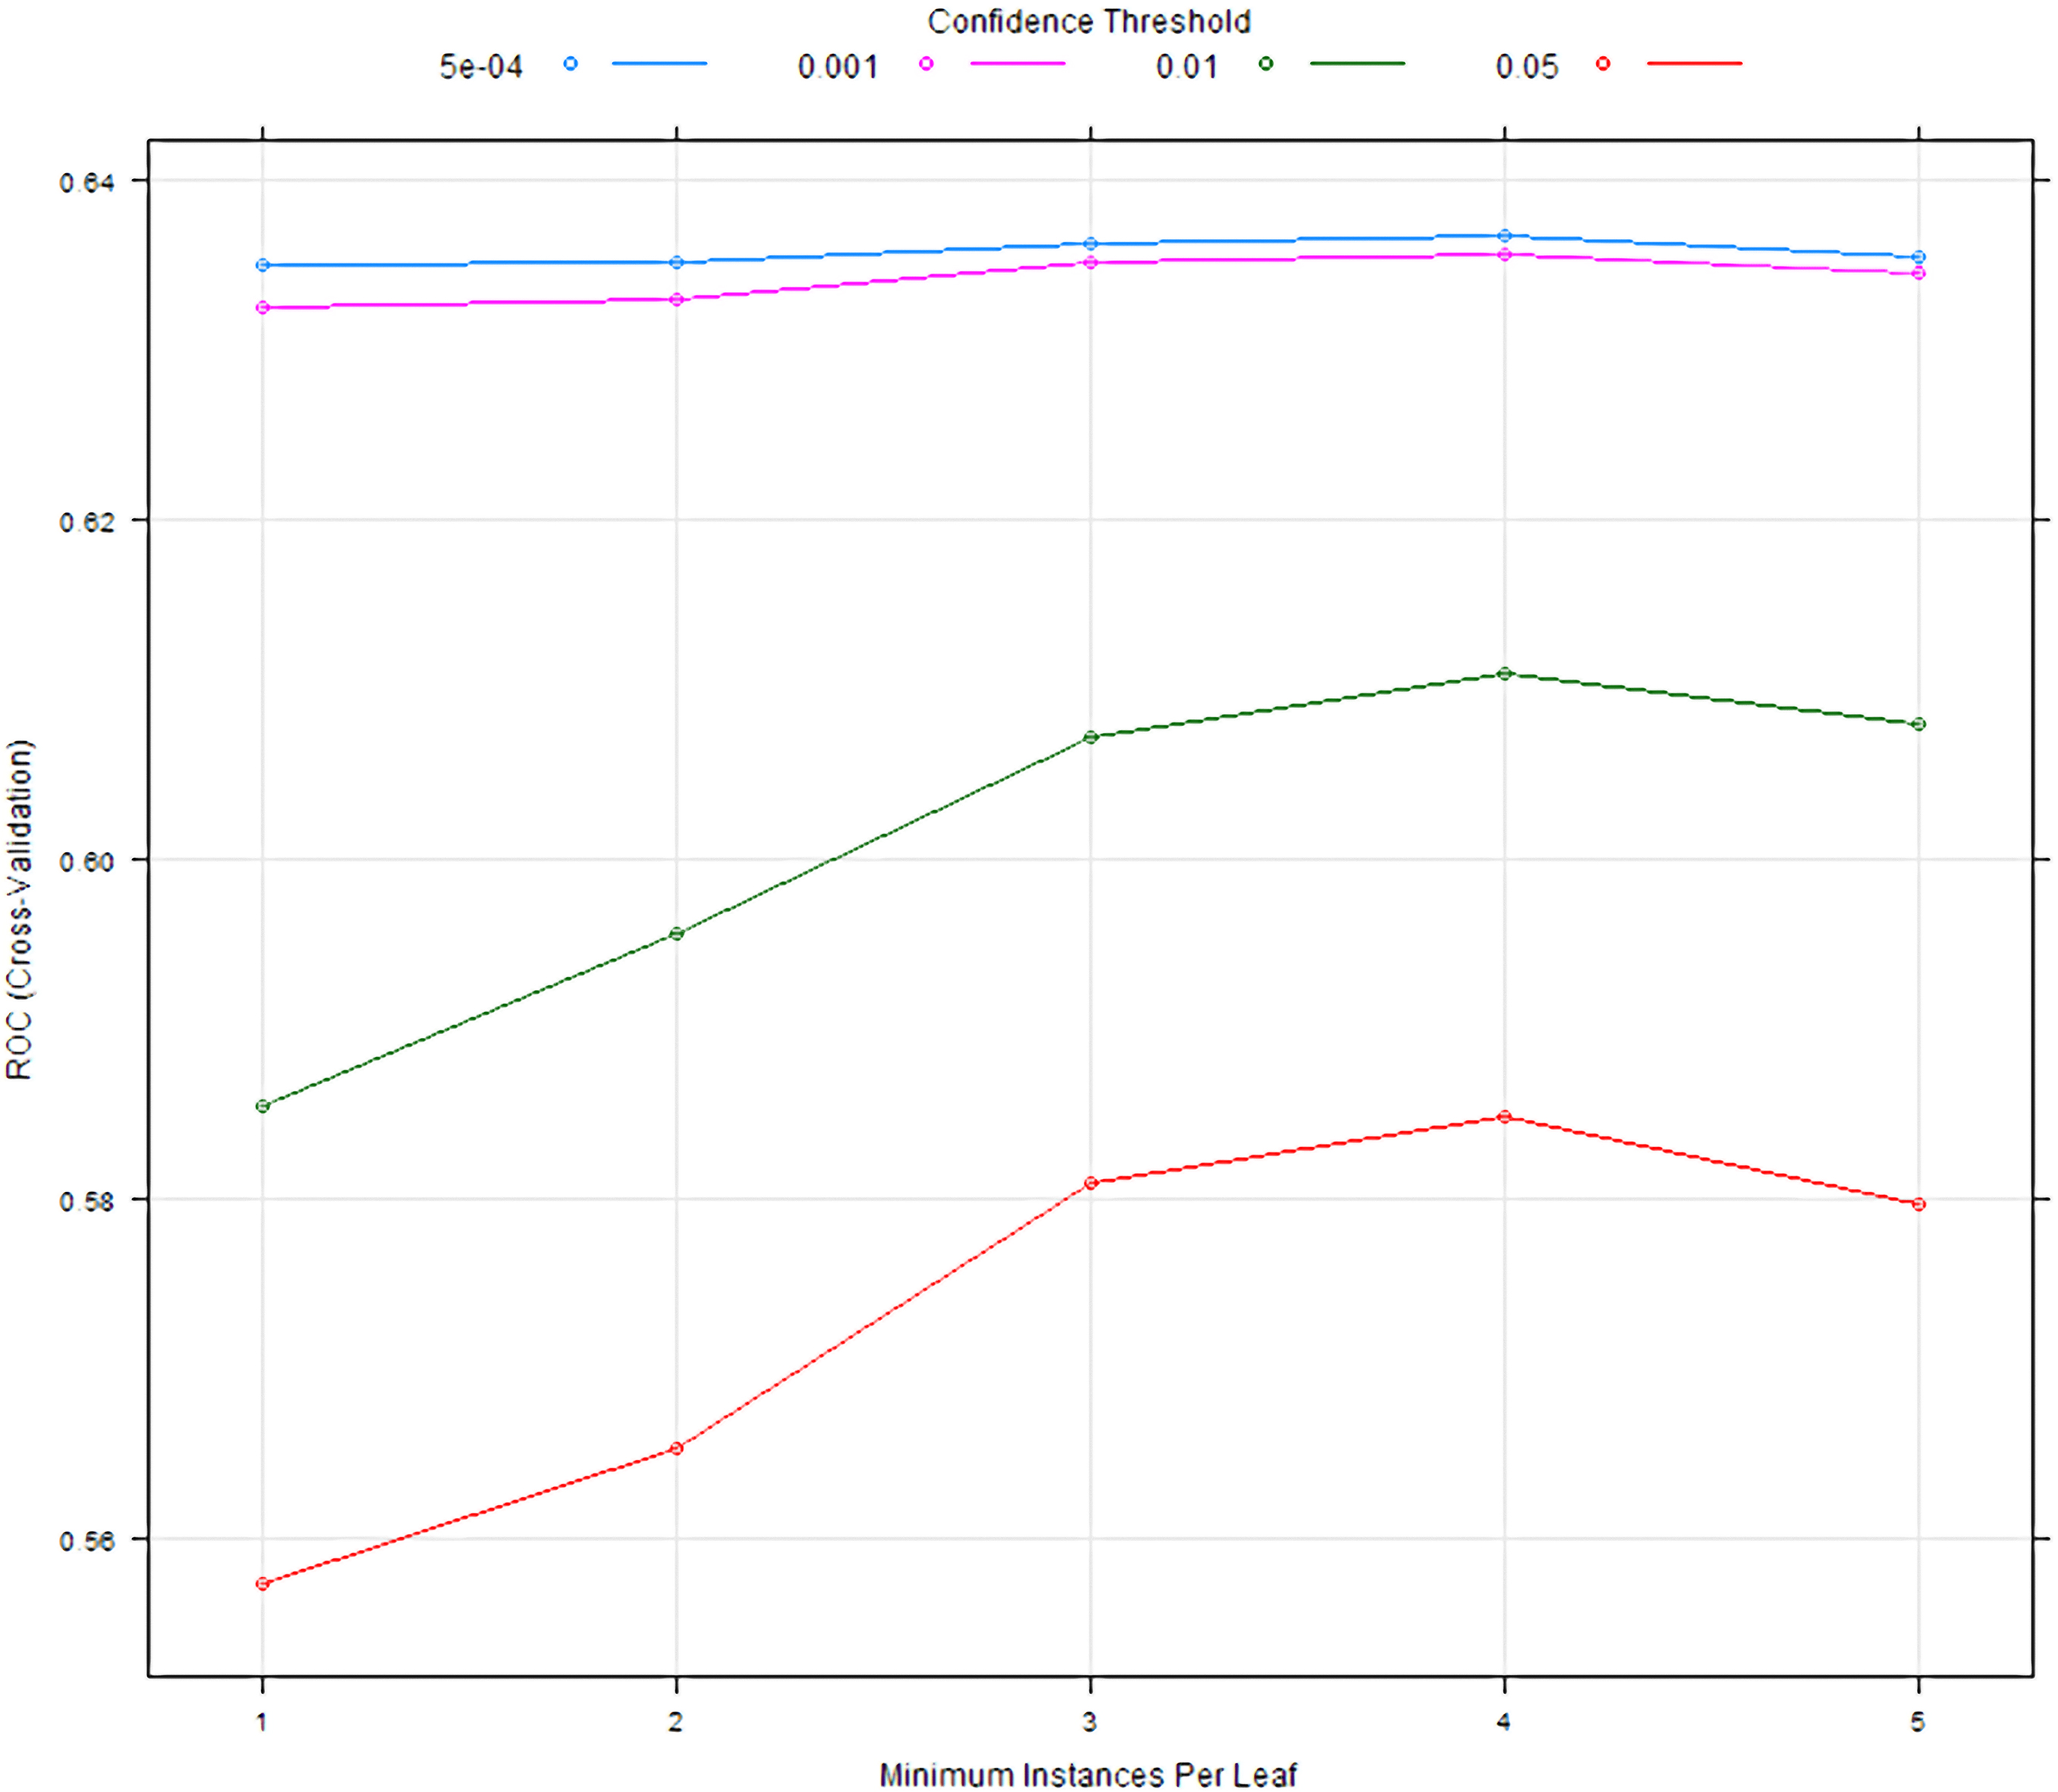
LightGBM is a fast, distributed, high-performance gradient boosting framework based on the decision tree algorithm. It is given the name ‘Light’ due to its speed. Like other trees, LightGBM can be used for ranking, classification and many other machine learning tasks. LightGBM was developed by Microsoft. The beta python version was made available on a Microsoft github repository on 2
LightGBM has some fundamental differences to both GBM and XGBoost. The LightGBM algorithm splits the tree leaf wise according to the best fit obtained whereas other boosting algorithms split the tree by depth or level. The theory behind this is when growing on the same leaf in Light GBM, the leaf-wise algorithm can reduce more loss than a level-wise algorithm. This should result in an increase in prediction accuracy.
LightGBM takes its inspiration from XGBoost, it is a very similar algorithm with minor changes, which under some circumstances may be improvements. A particular focus on LightGBM is speed and a speed lift is given by using a histogram algorithm. This allows grouping continuous variables into discrete bins. When splits are computed, they need only be iterated over the number of bins, as opposed to the number of points. This can give a considerable time saving. It should be noted that XGBoost can also be implemented using the histogram algorithm, though this was not done in this study as model accuracy was prioritised over speed.
LightGBM parameters are slightly different from those used in GBM and XGBoost. The parameters for LightGBM were the number of iterations, the learning rate, the number of leaves, the minimum gain to split, feature fraction, the minimum sum of hessians in one leaf to allow a split (here higher values potentially can reduce overfitting), the minimum data in a leaf, bagging fraction (a case subsampling proportion), l2 lamda, the tree learning method used and the bagging frequency.
Data and method
Data used for this research was collected in accordance with the ethical standards of the Helsinki Declaration. Electronic invitations were sent to masters games athletes who provided a valid email address and a total of 3928 masters athletes comprising of two genders (2010 males, 1918 females) completed all 56 questions in the MOMS via an online survey created using Limesurvey
Analysis was conducted using the R programming language version 3.3.2 (2016-10-31) “Sincere Pumpkin Patch” on platform Windows x86_64-w64-mingw32. In order to evaluate our supervised learning models and optimize performance on the data set, hyperparameter optimization (Bergstra, Bardenet, Bengio, & Kégl, 2011) was conducted using a grid search/hyperparameter sweep. This is an exhaustive search through manually specified subsets of parameters. The cartesian product of these parameter subsets can be computationally expensive. Alternative methods include random search (Bergstra & Bengio, 2012) and using a Bayesian approach (Snoek, Larochelle & Adams, 2012) to optimization of hyperparameters. However after provisional tests conducted with both random search and Bayesian Optimisation, given the ability to conduct long model runs and with cross fold validation to reduce likelihood of over-fitting, grid search was deemed a preferable choice.
The models were built on an 80:20 train test split with the training data internally validated with cross fold validation to reduce overfitting due to the large number of hyperparameters in the grid search.
As a bench mark a J48 decision tree model was trained first. The RWeka version of this model that was used has two parameters that were tuned, the confidence threshold (that is between zero and one) as well as the minimum instances per leaf, which is an integer. The C5.0 decision tree has different parameters to tune. The C5.0 decision tree has a winnowing parameter, which determines whether a subset of the input variables is better to use than the full dataset. The other variable is number of trials. The C5.0 was tuned across a range of trials, both with and without winnowing. It was expected that winnowing might not have a meaningful impact as reducing the number of input variables is often used in much larger datasets (or in time dependent processes) where computational efficiency is at a greater premium than for our relatively small dataset (relative to industrial data modelling with e.g. millions of cases). There were however some implications of dimensionality, due to the relatively low number of cases, so it would be interesting if winnowing produced a more optimal model.
A GBM model was tuned next. The parameters used were the number of trees, interaction depth, shrinkage, the minimum number of observations in a node and the number of folds for cross-validation.
Following this an XGBoost model was tuned. The parameters used were the number of rounds, subsample ratio of columns when constructing each tree, subsample ratio of the training instance, maximum tree depth, gamma, eta and the minimum sum of instance weight (hessian) needed in a child.
The final model investigated was created using Microsoft’s LightGBM package. The parameters used for LightGBM were slightly different from those used in GBM and XGBoost. The parameters for LightGBM were the number of iterations, the learning rate, the number of leaves, the minimum gain to split, feature fraction, the minimum sum of hessians in one leaf to allow a split (higher values potentially can reduce overfitting), the minimum data in a leaf, bagging fraction (a case subsampling proportion), l2 lamda, the tree learning method used and the bagging frequency.
Results
J48 decision tree
A J48 decision tree was tuned using grid search method and receiver operator characteristic (ROC) was used to select the optimal model using the largest value. The final values used for the model were confidence threshold
C5.0 Decision tree
The highest ROC value from grid tuning hyper parameters for the C5.0 Decision tree was 0.7113223, obtained with number of trials set at 14 and without winnowing. The C5.0 decision tree model developed predicted on the test set with accuracy 0.6841 and a 95% CI (0.6503, 0.7165). As the predictions in prior research (Heazlewood et al., 2016a) were all below this confidence interval, this more modern implementation of decision trees predicted more accurately than accuracy scores from past methods and justified expending the computational resources using boosted models such as GBM. Model evaluation metrics for the C5.0 model and the other four tree based models are shown in Table 1.
GBM
Tuning the input parameters for the GBM using grid search optimization provided optimal results using an eight fold cross-validated model. The ROC score was the metric selected to identify the optimal model, using the largest value. Visualisation of this process for a small subset of hyperparameters, utilising eight fold cross validation is given in Fig. 2 below. Each point is a separate GBM model, itself composed of many decision trees. It should be noted that Fig. 2 is a toy example in order to assist concise graphical demonstration of the process. Hyperparameters in Fig. 2 are heavily restricted to just two values per hyperparameter (except number of trees restricted to a range of 50–5,000 trees). Outside this toy example a wide range of parameters were used and then refined with higher granularity in areas where local maximums for ROC were deemed likely.
Example of hyper parameter tuning via grid search methods conducted for the GBM. For this toy visualisation into the wide range of hyperparameters tested, the minimum terminal node size was restricted to 7 (blue points) and 8 (purple points), the interaction depth was restricted to 4 (lower panels) and 5 (upper panels), the shrinkage was restricted to 0.01 (left hand side panels) and 0.05 (right hand side panels), whilst the number of boosting iterations was restricted between 50 and 5,000 in steps of 50 (x-axis). Cross validation ROC is shown on the y-axis, with higher ROC values used as a rating of hyperparameter performance.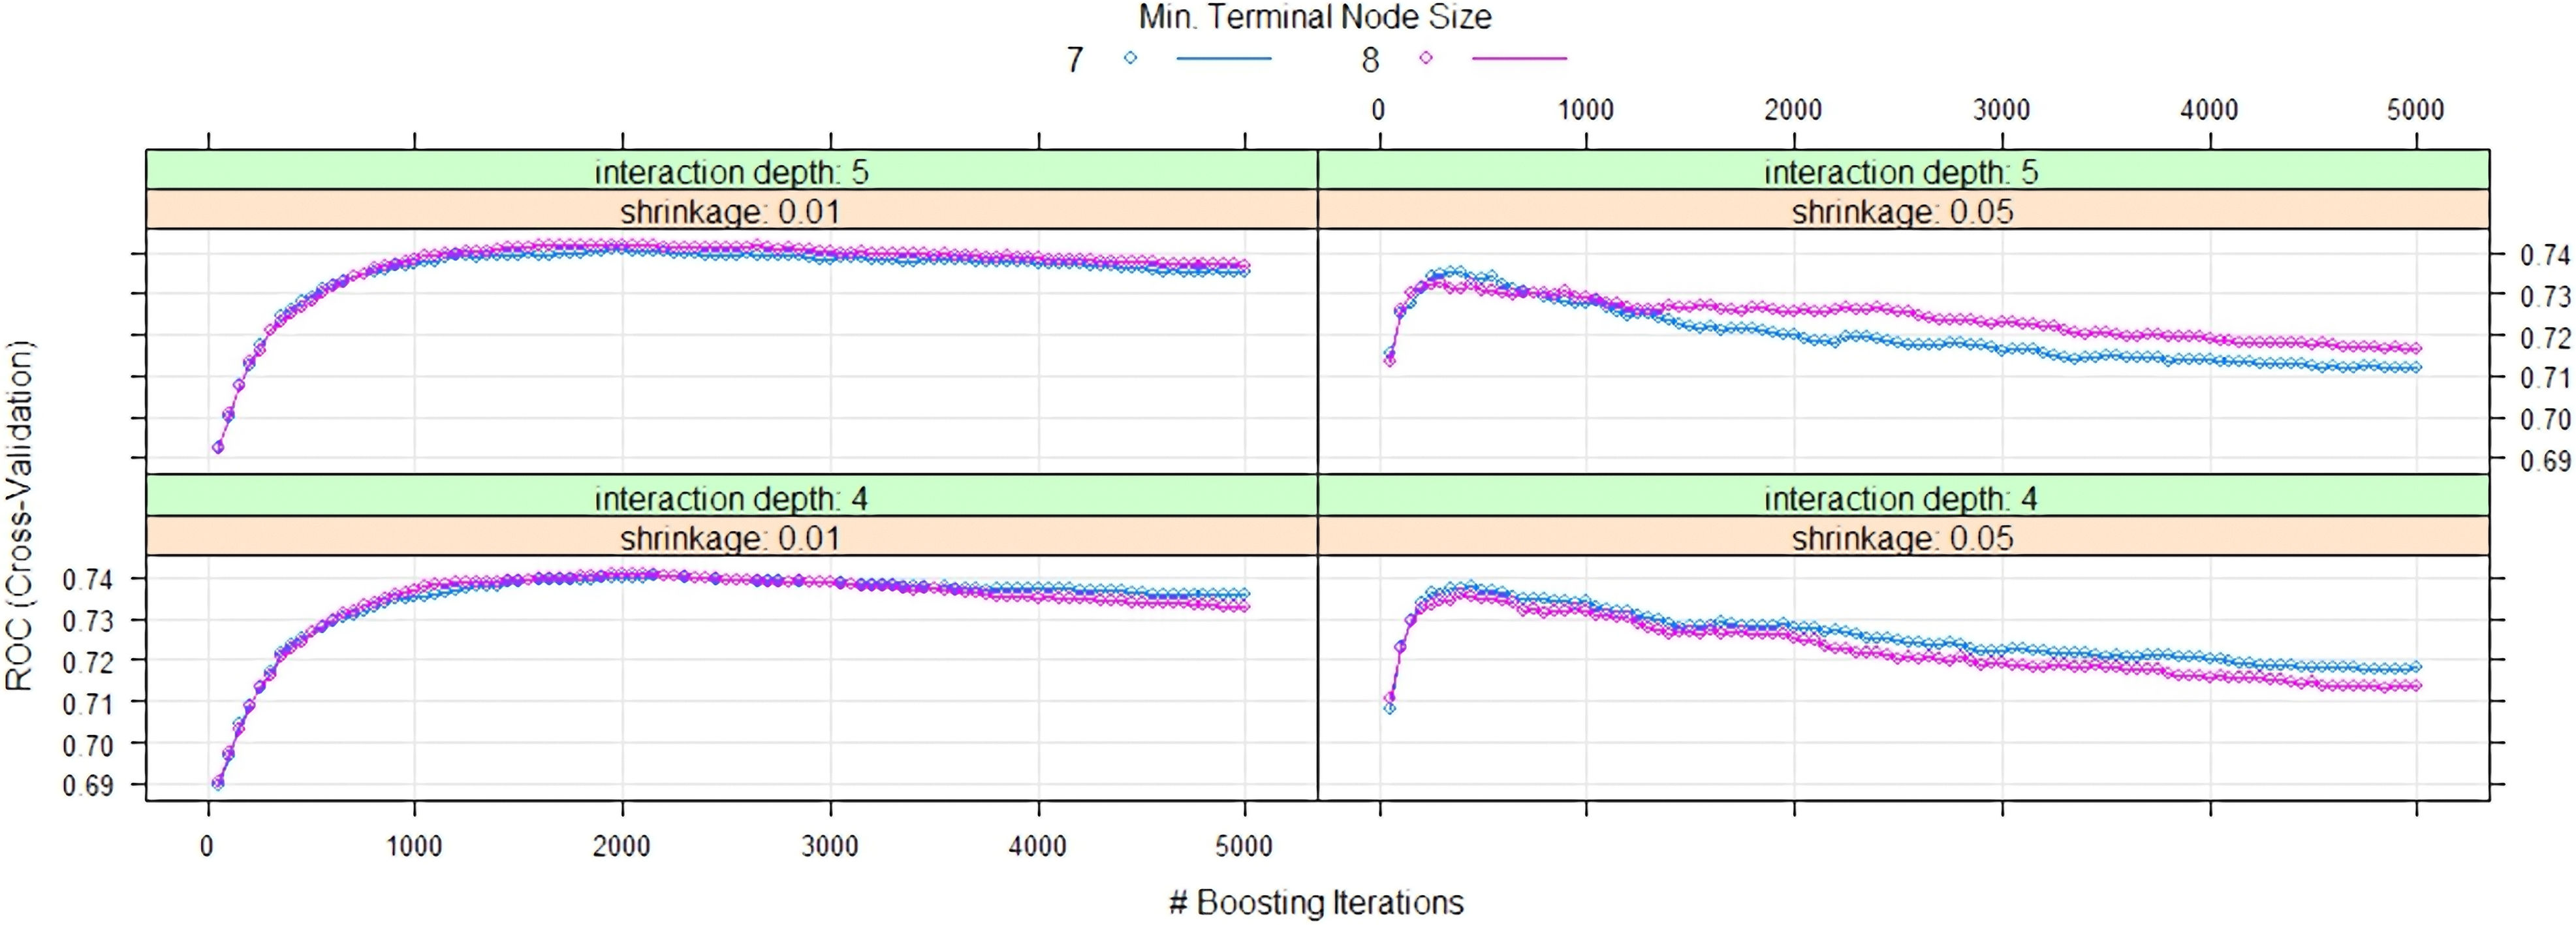
The optimal parameters for the final GBM model based on grid search hyperparameter tuning for the optimized solution (ROC
number of trees selected 2050 interaction depth 4 shrinkage 0.01 minimum number of observations per node 7
The grid search tuned GBM gave an overall accuracy of 0.7134 with 95% confidence interval (CI) (0.6803, 0.7448). This compared favorably with the 64.4% accuracy from prior studies (Heazlewood et al., 2016a) obtained using a MLP. The balanced accuracy for the GBM model (adjusting for gender imbalances in the masters athlete cohort) was 0.7126. Model evaluation metrics for the GBM model and the other four tree based models are shown in Table 1.
An 8 fold cross validation was also selected as optimal for XGBoost (using grid search comparison of ROC scores). Tuning was conducted over several weeks starting with a wide range of hyperparameter values and then focusing with more granularity on areas with increased ROC. To illustrate the process an example of ROC scores for a narrow window of hyperparameter tuning using grid search methods to optimise XGBoost predictions is demonstrated by Fig. 3. The optimized model with the highest ROC score using XGBoost was obtained using the following hyperparameters: number of rounds
Example of hyper parameter tuning via grid search methods conducted for XGBoost. For this narrow window into the wide range of hyperparameters tested, maximum depth is held at a constant value of 10, the number of rounds is tested using three values (5550, 600, 650), column sample by tree (upper and lower panels) is tested over two values (0.8, 0.9), the minimum sum of instance weight is tested across three values (1.75, 2, 2.25) as represented by the three different coloured lines and subsample percentage (x-axis) is tested across three values (0.1, 0.2, 0.3). Cross validation ROC is shown on the y-axis, with higher ROC values used as a rating of hyperparameter performance.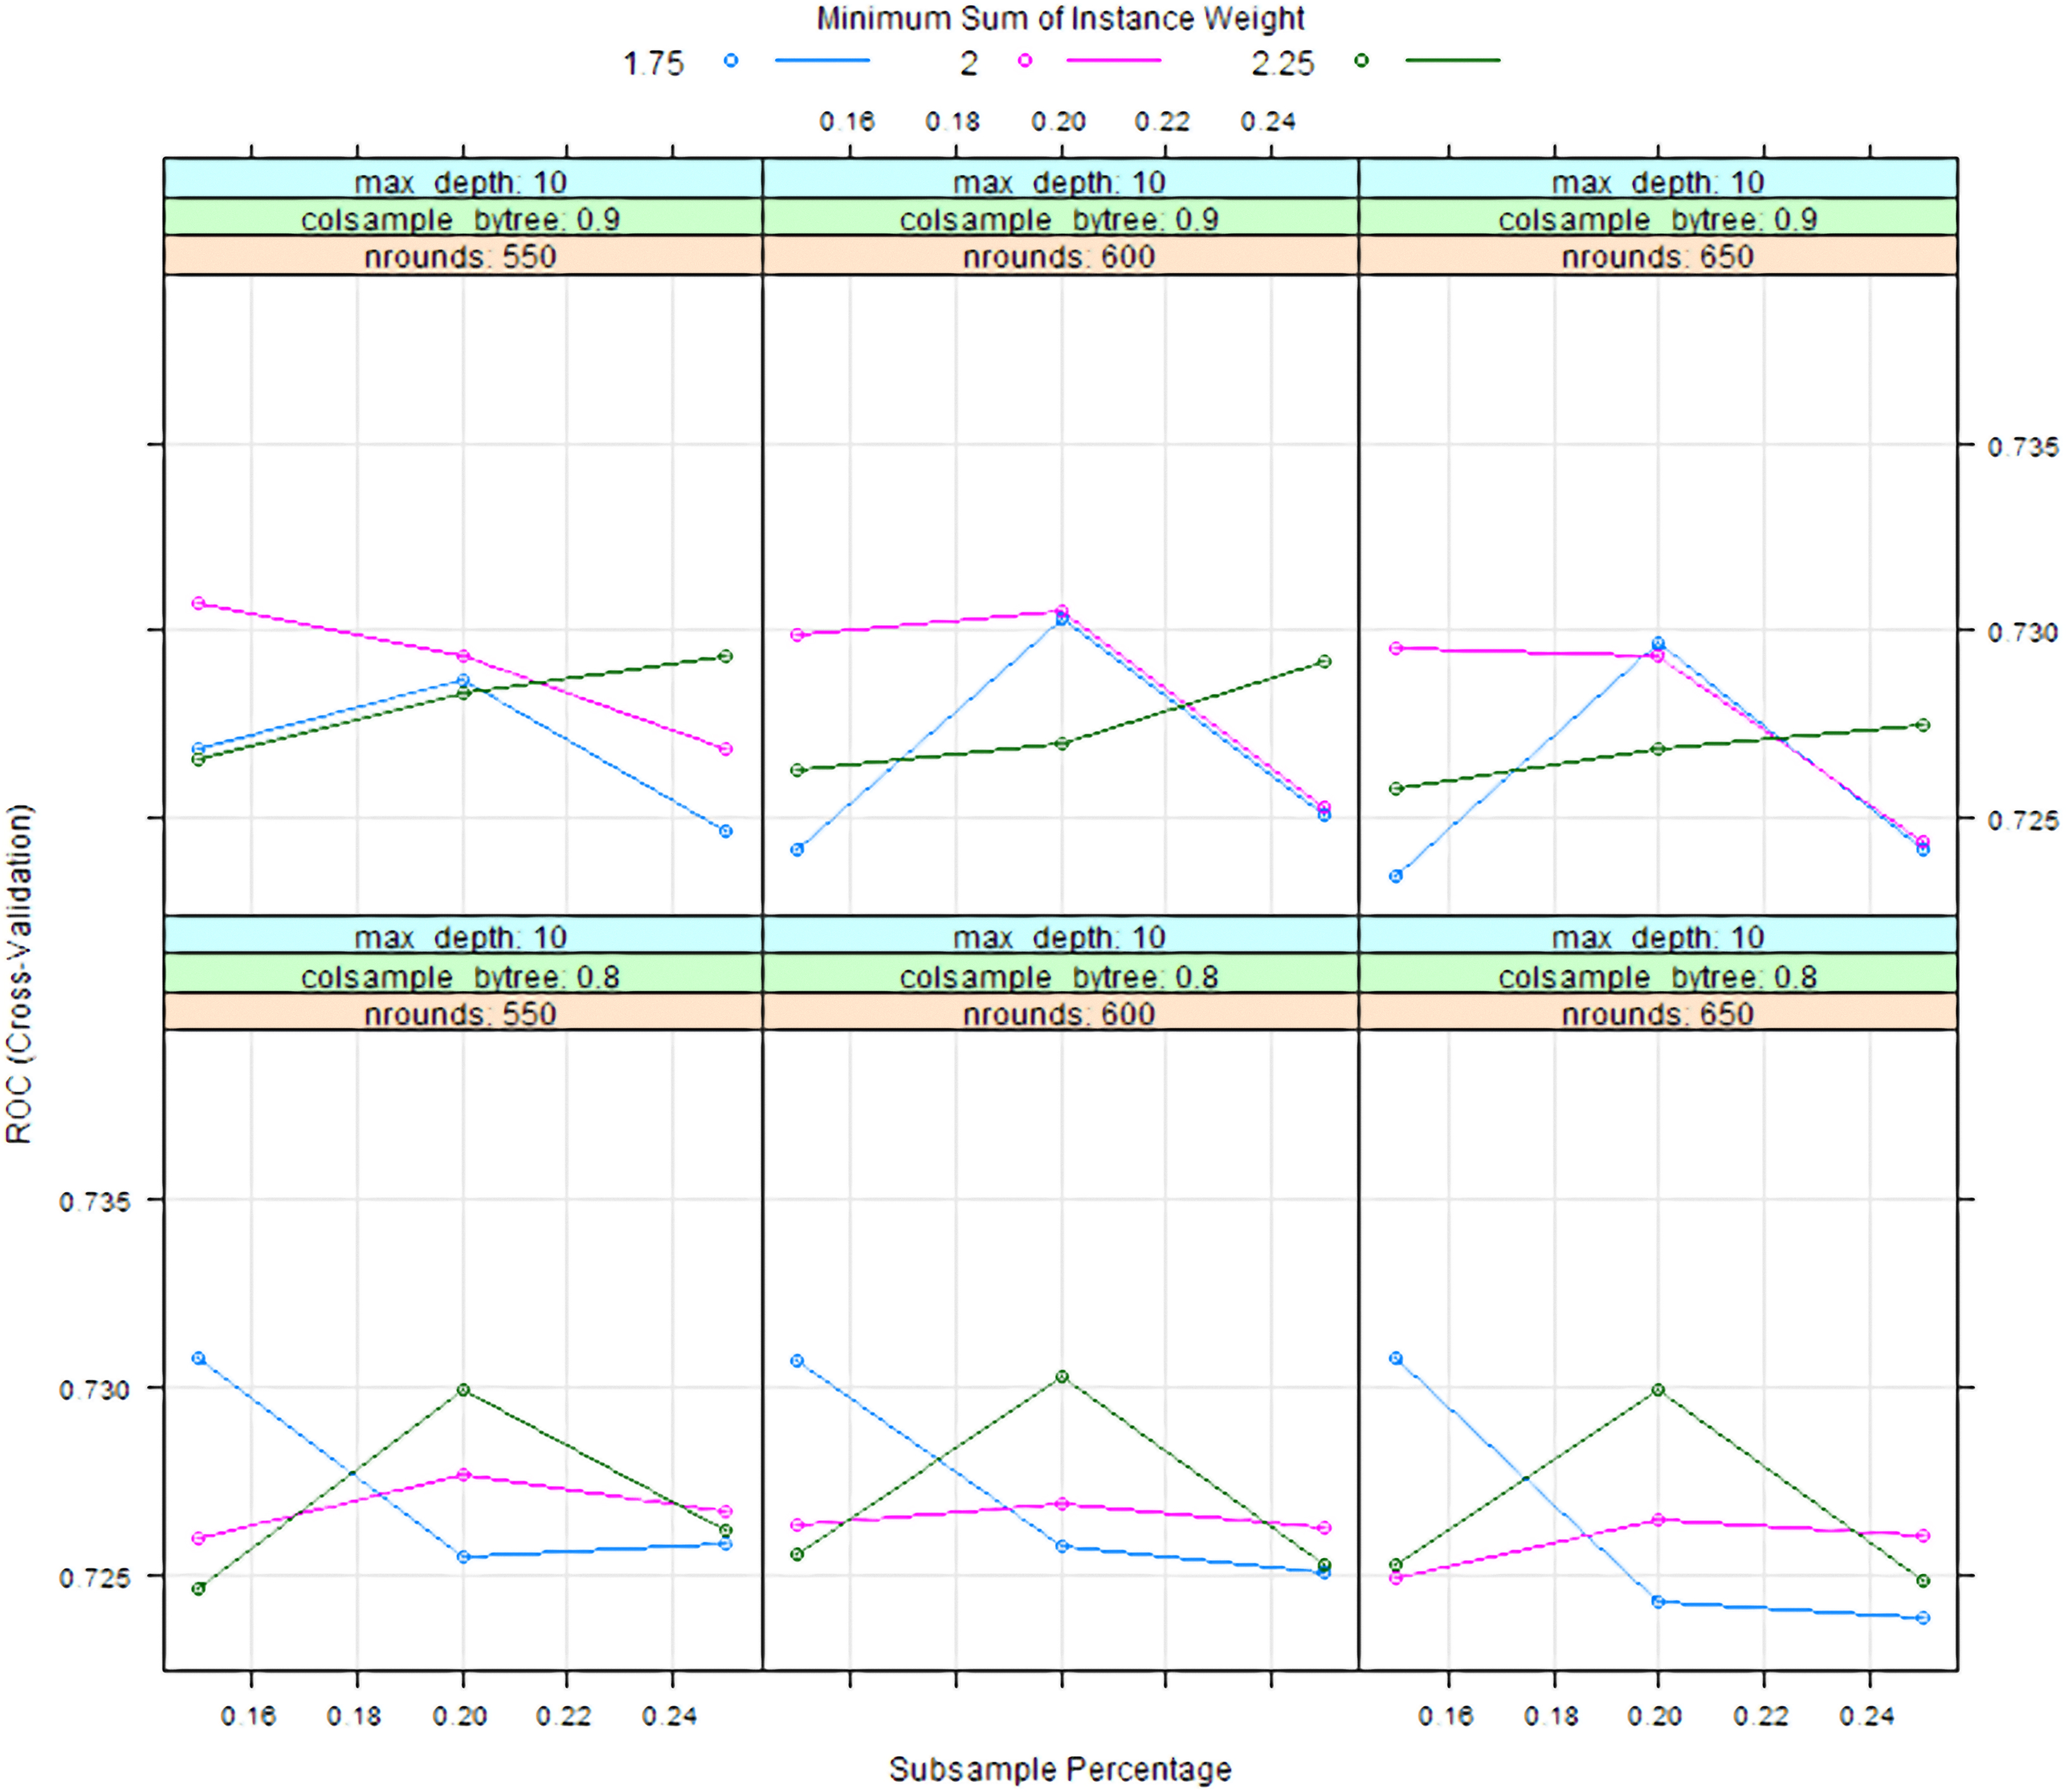
The overall accuracy was 0.7012 with 95% CI (0.6741, 0.7272), a figure less than GBM and greater than the MLP, non-boosted J48 and C5.0 decision tree benchmarks. The balanced accuracy was 0.7002. Model evaluation metrics for the XGBoost model and the other four tree based models are shown in Table 1.
The parameters used for LightGBM were slightly different from those used in GBM and XGBoost. Binary logloss and AUC were used in tuning to select the optimal parameters via grid search methods.
The final values used for the model were number of iterations
The accuracy for LightGBM was lower than XGBoost at 0.6904. Model evaluation metrics for the LightGBM model and the other four tree based models are shown in Table 1.
Comparison of model evaluation metrics for the five tree based models developed to predict gender classification
Comparison of model evaluation metrics for the five tree based models developed to predict gender classification
The aim of this study was to investigate whether prior predictive accuracy could be improved in order to make more effective group membership predictions based upon gender using gradient boosted ensembles of decision trees. It was our hypothesis that there would be enough improvement in accuracy using boosted tree based methods to be statistically significant when compared to previous research results (Heazlewood et al., 2016a) obtained using neural networks, specifically MLP and RBF networks, step-wise method DFA and step-wise logistic regression for classification accuracy.
Whilst there was a hypothesis that boosted tree models such as GBM could produce better accuracy than MLP, the accuracy of predictive models developed with traditional, un-boosted decision trees such as J48 exceeded our expectations. The benchmark model, included to test viability of a tree-based approach with an older generation of decision tree produced a higher accuracy model than MLP on the first run. Moving to a more recent iteration of the C4.5 algorithm (C5.0) further increased model accuracy. All the tree based models tested gave a higher prediction accuracy than any of the non-tree based models from previous research. The range of the 95% CI of the C5.0 prediction (0.6503, 0.7165) lay above the accuracy benchmarks from logistic regression (0.630) or DFA (0.633). As mentioned in the introduction non-boosted trees share an advantage with the step-wise logistic regression and step-wise DFA utilized in previous research, namely a white-box model without hidden layers that is straight-forward to interpret. If the researcher is trying to explain an underlying process that produces the relationships between the dependent and independent variables, for such an interpretable model C5.0 decision trees would be the optimal modelling choice, over DFA or logistic regression, if a decision is made solely on these results. Introducing boosting produced higher scores in all the boosted trees investigated than those obtained for the J48 and C5.0 bench marks.
Whilst J48 had a higher accuracy than MLP (0.644), the 95% CI of the J48 prediction (0.6113, 0.6794) was relatively quite large and overlapped the MLP based prediction accuracy. The 95% CI for C5.0 (0.6503, 0.7165), GBM (0.6803, 0.7448), XGBoost (0.6741, 0.7272) and LightGBM (0.6568, 0.7227) all gave a range above the prediction accuracy of MLP. Therefore we have 95% confidence that for these models the prediction accuracy is above a reference accuracy of 0.644.
The GBM prediction exceeded that obtained for the later generation models XGBoost and LightGBM. XGBoost and LightGBM are highly regarded machine learning algorithms and it was an expectation that the accuracy shown by these more modern models would exceed the performance of a GBM. The results obtained were in fact the opposite of these expectations. Given in machine learning comparative evaluations with larger datasets, usually XGBoost and LightGBM are reported to perform better than GBM to find a situation where the reverse occurred was a finding worth further analysis. Although GBM prediction accuracy exceeded XGBoost and LightGBM, the 95% CI of the three models overlapped, therefore the higher accuracy for GBM was not a statistically significant result in terms of CIs alone. Despite overlap of CIs, a higher prediction value for GBM is a rare event and should be given some consideration. One possible explanation could be due to the relatively very small sample size involved. In predictive modelling contests in which models that incorporate a more recent implementation of boosted trees such as XGBoost or LightGBM often the data set is in terms of millions of rows. It might be that the training set was not large enough and due to random effects on a (relatively) smaller scale, either within the test or training sets the GBM produced the highest accuracy. The same test/train split was used for all models, the seed influenced how the data was split as well as probabilistic modelling processes and therefore influenced the result. This is a small non-homogeneous data set and therefore more influenced by the test/train split than a larger data set is likely to be. Random effects on a small scale could be investigated by repeating the experiment with different random seeds to initialize this split and the model pipelines.
A GBM is a well regularized model and both XGBoost and LightGBM are also highly regularized. One very important difference is XGBoost implements dropout regularization for regression trees (DART), possibly in this case the regularization method did not suit the data. It would be interesting to examine how the models performed on out of sample data on different masters events (e.g. Pan Pacific Masters Games or other WMG, held in other years) and to see whether this regularization allowed model transference between events. This would be a good test of the accuracy scores from the different models, by applying them in another context. This can be future extension of this project, as it is a good assessment of a cogent outcome of this modelling.
It is also possible that with feature pruning the model fit could be improved. It is likely that the combination of too powerful a model in terms of XGBoost and LightGBM together with not enough data and too many features has caused the data to suffer from the curse of dimensionality and overfitting. Partitioning the dataset in this manner might also lead to a more generalizable model.
Initial test exploration with minimal tuning of LightGBM resulted in poor accuracy, even for exploration. There may be higher dependency on hyperparameters with this cutting edge algorithm. The sample size may also be too low for this model for which one of the design goals was a light weight model that could deal efficiently with big data (millions or billions of cases as opposed to our situation with merely thousands). This may be an explanation for the lower accuracy than GBM. It should be noted that the model used was an earlier version of the model and perhaps the Python version or a more stable version in future will have additional, accessible hyperparameters and be able to produce more accurate results.
In prior research (Heazlewood et al., 2016a) MLP produced the highest accuracy of the models investigated. It should be noted MLP is an older implementation of neural networks. In more recent times adding additional layers and methods to neural network models has shown exceptional results for image processing. The advancements in knowledge from this has then been applied with great success to use neural networks to model numerical data. This study has clearly shown improvements from applying boosted trees to model the WMG psychological data. It would be interesting to apply more recent advances in neural networks and see if a modern application of neural networks can further improve these new prediction benchmarks. In a similar fashion there are alternative linear models such as ridge regression that may be promising alternatives to using logistic regression and these also would make interesting investigation. This is particularly relevant as boosted trees are regularized models and it would be interesting to see if adding regularization to linear models could boost accuracy over their non-regularized counterparts. As this manuscript used a relatively (relative to data sets in modelling contests) small data set and given linear models with less complexity can sometimes perform better than their more complex alternatives when data is limited, this avenue would be worth investigation.
Conclusion
This manuscript hypothesises that it may be possible to improve accuracy of gender prediction from motivational psychological variables for athletes competing in masters sport by implementing more modern computational methodologies than used in prior literature. If significant lift in accuracy was obtained there would be a better understanding of the relationship between motivation to compete in masters sport and gender. Specifically five decision tree based machine learning models were investigated in terms of their applicability for a predictive modelling research task, predicting gender classification based upon psychological survey data for masters athletes. It was hypothesized that boosted models would improve prior accuracy achieved in previous research using MLP. The efficacy of tree based models for prediction in this environment was established with even older implementations, used primarily as a baseline, giving higher prediction accuracy than any methods used in prior research. Boosting with ensemble methods via GBM, XGBoost and LightGBM all gave significantly higher predictions than benchmark scores using other methods from prior studies, confirming the research hypothesis of this study.
The highest prediction accuracy was achieved using GBM, exceeding accuracies of models using XGBoost and LightGBM. These more recent implementations of boosting may have given lower predictive accuracy due to the high dimensionality relative to the number of cases in the data. With more cases or possibly feature reduction it may be possible to further improve the accuracy of these models. It may also be possible to improve prediction by applying other techniques, both in terms of model choice and treatment of the training data.
Whilst prediction accuracy exceeding 70% may still not be high enough (in the authors’ interpretation) to fully realise cogent outcomes from this research, it is a significant improvement on previous research and a progression to this desired outcome. With increased predictive accuracy a better understanding of the relationship between gender and psychological motivations for competing in sport at older ages could be established. Further research as well as focusing on improving accuracy could focus on identifying which variables provided the greatest difference between the genders, the establishment of a hierarchy of factor-variable importance. Differences between genders can be used in development of intervention strategies as males and females may need a different model, in terms of marketing focus, to encourage exercise at older ages.
With an obesity pandemic linked to high levels of inactivity in obese adults, it is very relevant to examine the psychological motivations of those the competing in sport at older ages. Any advancement in knowledge on the important relationships between gender and psychological motivations behind participating in sport is an interesting progression and may well prove of some assistance in future work on this subject. Additionally identifying improved techniques such as utilising boosted trees that can be applied in sport and exercise science, may also provide benefit in further researching these and other relationships.
Footnotes
Acknowledgments
This paper builds on initial model predictions using MLP, RBF, DFA and logistic regression first presented at the 10th International Symposium on Computer Science in Sport (ISCSS 2015), September 09–11, 2015, Loughborough, UK. Helpful comments and insights from other researchers at the conference was greatly appreciated and positively influenced this further investigation. It is also important to acknowledge the reviewers of Model Assisted Statistics and Applications made some helpful suggestions that were incorporated into and improved the paper.