Under nonlinear models, optimal design truly depends on the pre-specified values of model parameter. If the nominal values of the parameter are not close to the true values, optimal designs become far from optimum. In this study, we focus on constructing an optimal design that works well for estimating multiple s taking into account the parameter uncertainty. To address the parameter dependency, an adaptive design technique is applied by incorporating Bayesian paradigm. One challenging task for the Bayesian approach is that it requires heavy computation when search for the Bayesian optimal design. To overcome this problem, a clustering method can be employed.
We propose an adaptive Bayesian c-optimal design that works fairly well for estimating multiple values of simultaneously, whilst accounting for the parameter uncertainty. We use the flexible 4-paramter logistic model to illustrate the methodology but our approach can be extended to other types of nonlinear models. We also examine the performance of our proposed design by comparing with other traditional designs through different scenarios of simulations given a wide range of mis-specified model parameters.
Experimental designs are increasingly expensive to conduct especially in dose-finding studies. A dose-finding study plays a critical role in drug development process. It mainly determines the dose of an agent for further study in large scale clinical trials. One challenge in dose-finding study is the relatively small sample size for ethical and financial reasons. Thus, setting up appropriate designs that allow researchers to gather as much accurate information as possible at minimal cost becomes crucial. One effective way to save cost and resource is to answer multiple research questions simultaneously from one single study by applying optimal design theory. However, an optimal design that works well for one research objective could perform poorly for another in dose-finding trials. Several pioneering studies have been conducted regarding multi-objective experiments recently, examples see (Miller et al., 2007; Padmanabhan & Dragalin, 2010; Hyun & Wong, 2015); While there is little in literature on developing one experimental design to investigate multiple target doses such as in dose-finding study. The is the effective dose that achieves % of the maximum treatment effect within the observed dose range and is given between 0 and 100 (Ting, 2006; Bretz et al., 2010). For instance, is the median effective dose producing 50% of the maximum treatment effect. In practice, rather than studying one specific , researchers are often interested in dual target doses such as and or multiple target doses such as , , , and to conduct the dose-range studies (Beloeil et al., 2007; Louie et al., 2001).
In general, optimal designs use different optimality criteria for studying different objectives in dose-finding trials. One primary objective for the dose-finding trial is to study an interesting target dose . Zhang and Hyun (2016) stated that under the 4-parameter logistic (4PL) model, the c-optimal design for estimating one specific works poorly when estimating other . They proposed a robust c-optimal design that works well for estimating multiple under the assumption that the parameter values are known. However, in practical terms, model parameters are often unknown and optimal designs under nonlinear models are very sensitive to model parameters. Typically, the construction of the optimal design is based on the initial guess of the parameter values. However, if the initial guess is not close to the true values, the optimal design is far from optimum (Chernoff, 1953; Wang & Yang, 2014). Our aim is to construct one optimal design for estimating various values of under mis-specification in nominal values of model parameter for a biopharmaceutical application, and study the design effectiveness and robustness.
To reduce the uncertainty of the parameter values, we study an adaptive two-stage design technique by incorporating Bayesian approach into the second stage design. The Bayesian optimal design utilizes the probability distribution of the unknown parameters instead of a single set of parameters to derive a better design (Dette, 1996; Albert, 2009). A two-stage procedure offers an efficient way to learn about the parameters from the first stage and apply the accrued data to determine the augmented design at the second stage. At the first stage, a small proportion of the subjects are assigned according to a fixed design. At the second stage, the posterior distribution of the parameters is generated based on the information learned from the first stage.
One challenge for seeking the Bayesian optimal design is that it needs heavy computation in the numerical calculations. To overcome this problem, a clustering method can be applied. Previous researches commonly used the k-means clustering method to alternate the full posterior distribution (Dror & Steinberg, 2006; McCallum & Bornkamp, 2015). K-means clustering reduces the computation of the high-dimensional data by partitioning observations into clusters by minimizing the within-cluster sum of squares (Hartigan & Wong, 1979). Various of other clustering methods have been developed such as kernel k-means and fuzzy c-means. Each of them has their own features. For instance, the kernel k-means handles the non-linear structure and the fuzzy c-means allows a data point to belong to two or more clusters (Dhillon et al., 2004; Welling, 2013; Dunn, 1973; Bezdek, 1981). In this research, we are also interested in comparing the performance of the three clustering methods to see if different clustering methods change the performance of the Bayesian c-optimal design. Without loss of generality, c-optimal design constructed in this paper is locally c-optimal design.
Section 2 shows the statistical model along with the information matrix. In Section 3, adaptive Bayesian c-optimal design for estimating multiple which account for the parameter uncertainty are proposed. Several scenarios of simulations are set up to check the performance of the proposed adaptive Bayesian c-optimal design compared with other traditional designs such as uniform design and D-optimal design. Additionally, we compare our design with the two-stage robust c-optimal design that was proposed by Zhang and Hyun (2016). All the design performance are evaluated by estimating multiple over a wide range of mis-specified model parameters. The final discussion is given in Section 4.
Statistical model
It is often observed that the dose-response relationship follows a sigmoid curve. It leads to the 4PL model which is frequently used for many toxicological and biological systems. It is a highly flexible nonlinear model taking into account the minimum dose, maximum dose, , and the slope of the dose-response curve. The mean response for the 4PL model at a given dose is defined as
where is the minimum mean effect; is the maximum mean effect; is the , and is the slope parameter.
Let be a continuous response at a given dose range , where 0 is the placebo dose and is the maximum dose. The continuous response for the dose level that applies to subject can be written as
where , ; is the residual error with the assumption of independent and normally distributed with variance . The total sample size is ; Let denotes the approximate design that allocates subjects into dose level. Then the normalized Fisher information matrix under the 4PL model is
where is the partial derivative of the mean response with respect to the model parameters (matrix details see Padmanabhan & Dragalin, 2010; Zhang & Hyun, 2016). The Fisher information matrix contains the design and model parameters. Hence, it is a key component in searching optimal designs in the next Section.
Adaptive bayesian c-optimal designs
Bayesian c-optimality
The explicit expression of the target dose is , where represents the % of the maximum treatment response. Once is fixed, the becomes a function of model parameters, and it only depends on and . To estimate the function of model parameters, c-optimality can be applied, which minimizes the variance of estimating parameters. Let denotes the maximum likelihood estimate of the ; then the c-optimality can be redefined as minimizing the variance of estimating the ,
where is partial derivative of the with respect to ; is the generalized inverse of the Fisher information matrix in Eq. (3).
Our research interest is conducting one single study to estimate multiple s taking into account the parameter uncertainty. One method to address the parameter uncertainty is applying the Bayesian paradigm at the second stage. Instead of using a single set of the parameters, the Bayesian approach considers the design incorporated with a prior probability for the parameters. To estimate the target dose , we adopt the Bayesian c-optimality which minimizes the weighted average of the variance for estimating the (Atkinson & Donev, 1992):
where denotes the prior probability given to , and . If there is no prior knowledge of the probability and all values of the parameters are considered equally important, we can simply set . The fact is that the Bayesian optimal design truly depends on the prior distribution of the parameters. To reduce the prior dependency, the posterior distribution is applied instead, which can be obtained bases on the response data collected in the first stage design and the pre-determined prior density (McCallum & Bornkamp, 2015).
Two stages are involved in searching the adaptive Bayesian c-optimal design: In the first stage, a small proportion of the subjects is assigned to a fixed design such as uniform design. In the second stage, the posterior distribution of the model parameters is obtained based on the prior distribution and the information that is collected from the first stage. Next, the generated posterior distribution is incorporated into the Bayesian c-optimality.
There are two challenges to construct adaptive Bayesian c-optimal design at the second stage: (1) computing the undefined posterior distribution; (2) heavy numerical evaluations of the optimal criterion. In order to consider conservative performance of the adaptive Bayesian c-optimal design, the Jefferys prior distribution is used: , where is the fixed design at the first stage. Due to the Jeffreys prior distribution is included, the posteriors distribution becomes an undefined distribution. In this paper, we simulate sampling draws by using the Markov Chain Monte Carlo (MCMC) with Metropolis-Hastings (M-H) algorithm to generate 10,000 samples with 1000 burn-in from the posterior distribution of the parameters. As an illustration purpose, we adopt the same experimental setup values from Padmanabhan and Dragalin (2010) to perform the numerical search in the first stage design. That is, the dose range and the initial parameters . Under the 4PL model, let , and we simply assign a small sample size of 40 subjects into a fixed design, say four points uniform design,
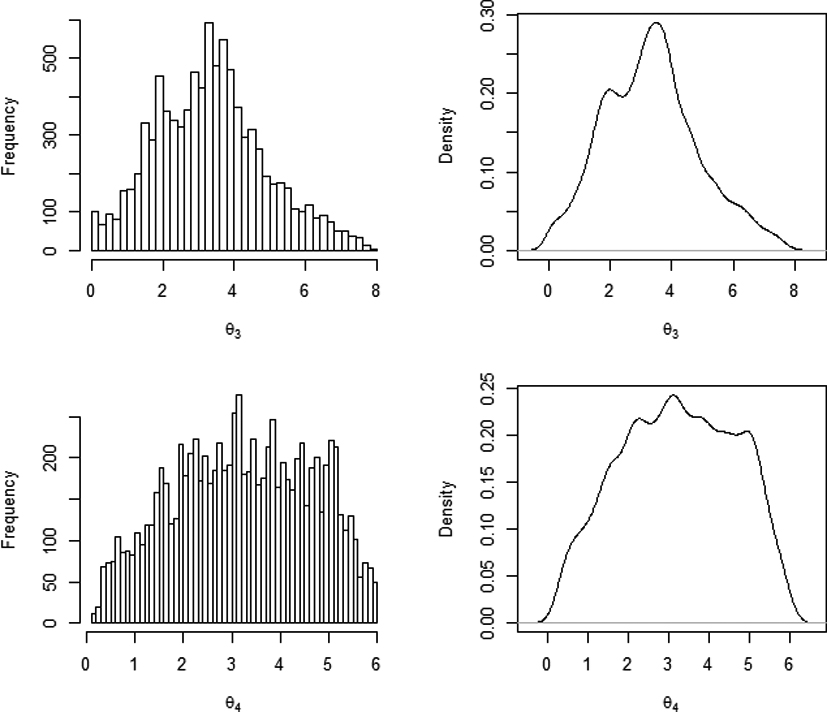
within the continuous dose range from 0 to 8. Once all the initial values are fixed, we can start to generate the response data and use for searching the posterior distribution of the parameters. Since the c-optimal design under 4PL does not depend on and , we focus on generating the posterior distributions for and . Based on the collected information from the first stage, a sample size of 9000 for and are generated, respectively. Their histogram and density plots are given in Fig. 1. The adaptive Bayesian c-optimal design using the sampling parameters from the posterior distribution are obtained in the following subsection.
Histogram and density plots of the posterior distributions for and with generated sample size of 10,000 and 1000 burn-in, respectively.
Adaptive Bayesian c-optimal design for estimating the
For simplicity, we start with searching for an adaptive Bayesian c-optimal design for estimating the , which minimizes the weighted average of the variance for estimating the . The directional derivative of the Bayesian c-optimality criterion in Eq. (5) leads to the sensitivity function as below:
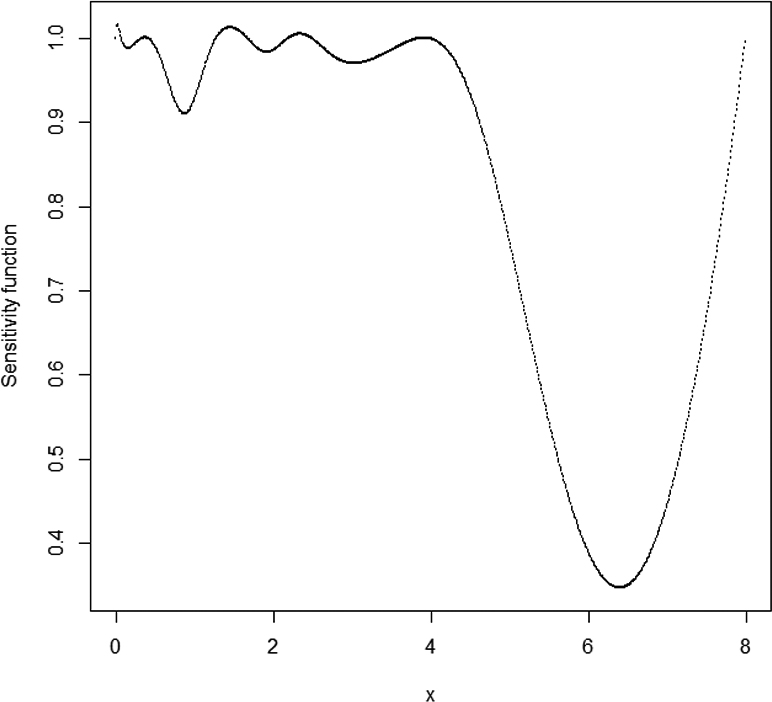
where is the weight of each set of the and is set to with sampling draws. According to the General Equivalence Theorem, the equal sign holds, if and only if, is one of the design points in the adaptive Bayesian c-optimal design . One issue for the design implementation is that 9000 parameter samples from the posterior distribution requires a computation of 9000 iterations of the Fisher information matrix for searching one design. It is very time-consuming to complete the whole procedure.
In illustration of using the full posterior distribution, we randomly select a sample size of 200 from the 9000 samples to obtain the adaptive Bayesian c-optimal design for estimating the . The Bayesian optimal design is searched by adopting the modified Yang-Biedermann-Tang (YBT) algorithm which proposed by Hyun and Wong (2015). Instead of starting with some arbitrary design as an initial design, the modified YBT algorithm starts with a better initial design that suggested by running a traditional algorithm for several iterations (such as V-algorithm). At each iteration, the modified YBT algorithm adds the design point that maximizes the sensitivity function into the current design to create a new design. The weights for the new design point are computed using the Newton-Raphson method by optimizing the design criterion over the design space (Yang et al., 2013; Hyun & Wong, 2015; Zhang & Hyun, 2016). The obtained Bayesian c-optimal design is verified by the Equivalence Theorem in Fig. 2. The adaptive Bayesian c-optimal design, , for estimating the by using the 200 sample parameters from the posterior distribution is given by:
One can observe that the adaptive Bayesian c-optimal design for estimating the contains 8 design points including the lower bound and the upper bound of dose levels. Dose levels 0.42, 2.20, 3.86, and 7.99 take most of the design weights than others. It suggests that most of the subjects are allocated into these four dose levels.
Plot of the sensitivity function of adaptive Bayesian c-optimal design for estimating the under the full posterior distribution with 200 sets of parameters that randomly selected from the generated 9000 samples.
McCallum and Bornkamp (2015) proposed an efficient alternative to reduce the laborious evaluations by adopting a k-means clustering method instead of using full posterior samples. They also proved that the k-means clustering provided good theoretically approximations when number of clusters . In our study, we classify samples into clusters using k-means clustering algorithm to conduct the adaptive Bayesian c-optimal design for estimating the . In this scenario, the in the sensitivity function (6) becomes the weight of each clusters, which is the proportion of the samples associate with each cluster center. As a comparison, kernel k-means and fuzzy c-means clustering methods are studied in searching the Bayesian design. Constantly, the kernel k-means and fuzzy c-means also use clusters. K-means, kernel k-means, and fuzzy c-means clustering can be easily computed in R software.
The adaptive Bayesian c-optimal design for estimating the using k-means, kernel k-means, and fuzzy c-means clustering methods are given in Table 1. All the searched designs are verified by the General Equivalence Theorem (verification plots are not shown here). Table 1 states that the design points and design weights are varied from the three different Bayesian designs, but all the designs contain 8 design points include lower bound and upper bound of the dose range.
For further investigation of the obtained designs performance, we compute the design efficiencies for the cases using the full posterior, k-means, kernel k-means, and fuzzy c-means. Design efficiency measures how a design performs with respect to some optimality criterion. Our research goal is to estimate the target dose , so we use c-efficiency which is the ratio of the variance of a design against the variance of c-optimal design for estimating the . It is defined a
Adaptive Bayesian c-optimal designs that obtained by using k-means, kernel k-means, and fuzzy c-means clustering methods. , , represents the adaptive Bayesian c-optimal design with k-means clustering, kernel k-means clustering, and fuzzy c-means clustering, respectively.
Clustering methods
K-means
Kernel k-means
Fuzzy c-means
The locally c-optimal design for estimating the provides the minimum variance, thus the c-efficiency is always between 0 and 1. Higher value of c-efficiency indicates better performance of the design .
As a comparison, traditional designs, such as uniform design and D-optimal design, are studied. D-optimal design is widely used for estimating the dose response curve. Even though it is not the goal of D-optimal design, it is also commonly used as an illustration for estimating a particular dose such as or (Dragalin et al., 2007; Li et al., 2008). The searched D-optimal design for estimating using D-optimality is given by
Considering the obtained adaptive Bayesian c-optimal designs all contain 8 design points, we compare with the 8 points uniform design,
Additionally, we are interested in examining how the Bayesian technique enhances the performance of traditional uniform design by searching Bayesian optimal weights for each uniform design points. To find the Bayesian optimal weights, we maximize the Bayesian c-optimal criterion function over the weights for the given 8 design points. The searched 8 points uniform design with Bayesian optimal weights for estimating is
Note that after applying Bayesian technique, the design weights are not equally distributed into the 8 design points in the traditional way. The Bayesian optimal weights suggest to allocate most of subjects into dose levels into lower bound 0.001, middle levels 2.28 and 4.57, and upper bound 8.00. We are also interested in checking how the two-stage robust c-optimal design performs under the wide range of 9000 sampling parameters, which was proposed by Zhang and Hyun (2016). The summary statistics of 25% quartile, median, mean, and 75% quartile of the c-efficiencies are provided in Table 2.
From the summary statistics table, we note that there are very slight differences among the four adaptive Bayesian c-optimal designs and the uniform design with Bayesian optimal weights when estimate the . One potential reason that the uniform design with Bayesian optimal weights performs as well as the Bayesian optimal designs could be that it contains 8 equally spaced design points which is very close to the Bayesian optimal designs. If we reduce the 8 uniform design points to 4 or 5 design points, the uniform design with Bayesian optimal weights would perform much poorer.
Summary statistics of c-efficiencies of the designs for estimating the under the 9000 . , , , and represent the adaptive Bayesian c-optimal design with full posterior distribution, k-means clustering, kernel k-means clustering, and fuzzy c-means clustering, respectively; represents the two-stage c-optimal robust design; represents the D-optimal design. represents the 8 points uniform design; represents the 8 points uniform design with Bayesian optimal weights
25% Q
Median
Mean
75% Q
0.4981
0.5931
0.5763
0.6601
0.4996
0.5763
0.5596
0.6189
0.5074
0.5704
0.5696
0.6327
0.5062
0.5777
0.5723
0.6438
0.3219
0.4762
0.5022
0.6662
0.1388
0.3855
0.3649
0.5890
0.4481
0.4775
0.4739
0.5026
0.5018
0.5800
0.5668
0.6382
As expected, the two-stage robust c-optimal design for estimating the works worse compared with the Bayesian optimal designs. The mean efficiency of the two-stage robust c-optimal design is around 7% lower and its lower quartile is much lower. This implies the two-stage robust c-optimal design is not as robust as the adaptive Bayesian c-optimal design for mis-specified parameter values. Table 2 shows that the median and the mean design efficiencies for the Bayesian designs and uniform design with the Bayesian optimal weights are around 10% higher than the traditional uniform design, and 20% higher than the D-optimal design. Overall, we conclude that after reducing the parameter dependency, the adaptive Bayesian c-optimal designs still work better than the uniform design, D-optimal design and the two-stage robust c-optimal design. Since D-optimal design works the worst under a wide range of mis-specified parameter values, we exclude D-optimal design in our following design comparisons.
Adaptive Bayesian c-optimal design for estimating multiple s
From the previous section, we show that k-means, kernel k-means, and fuzzy c-means perform similarly when compared with the full posterior method. For simplicity, we use the k-means algorithm to extend our study in searching the adaptive Bayesian c-optimal design for estimating multiple s. The sensitivity function can be updated from the Eq. (6) by summarizing the weighted multiple values of :
where is the number of s, is the number of the clusters, represents the weight of each cluster, and represents the weight of each . Here we set and . Note that the values of , and in the Eq. (9) can be specified as any value depending on the research interests. Again, by the Equivalence Theorem, the equal sign holds if, and only if, is one of the dose levels in the adaptive Bayesian c-optimal design, . Again, the modified YBT algorithm is applied to search the design for estimating multiple s , as below:
Again, the is verified by General Equivalence Theorem.
Note that we illustrate our study by including the five s above to conduct the adaptive Bayesian c-optimal design, but it can be any s values. Next, we investigate the performance of the design for estimating other s. Considering cover all the possible values of we use ten s (, , , , , and ) to compute the design efficiencies. We randomly select ten sets of model parameters from the 9000 samples and check how the adaptive Bayesian c-optimal design works to estimate the ten under the ten sets of parameter values. The randomly selected ten sets of model parameters are shown in Table 3. In the c-efficiency computation, the adaptive Bayesian c-optimal design, the uniform designs, and the two-stage robust c-optimal design are all fixed design. Take estimating the under the model parameter as an example, first we search the c-optimal design for estimating the under , then we compute the c-efficiency by using one of the fixed designs, for instance, the adaptive Bayesian c-optimal design , against the c-optimal design. For each design (, , , ), this procedure repeats 9000 times until all the c-efficiencies are computed based on the 9000 parameter samples. The detailed summary statistics of the c-efficacies are shown in Table 4.
Ten sets of model parameters that are randomly selected from the generated posterior distribution
Table 4 shows that when estimate the and the , the mean efficiencies of the two-stage robust c-optimal design are slightly higher than the other designs in the simulation. However, for estimating the , , and , adaptive Bayesian c-optimal design and the 8 points uniform design with Bayesian optimal weights work better than the two-stage robust c-optimal design. This suggests that two-stage robust c-optimal design sometimes works better, but sometimes not when compared with the adaptive Bayesian c-optimal design. No substantial difference is observed between the adaptive Bayesian c-optimal design and 8 points uniform design with Bayesian optimal weights, which further support our discussion in the previous sections. However, when we further investigate the two designs, the 25% quartile of the adaptive Bayesian c-optimal design are always higher than the Bayesian enhanced 8 points uniform design. It suggests that the adaptive Bayesian c-optimal design is much safer to use when estimates a wide range of the since its worst case is always better than others. As we expected, the traditional 8 points uniform design always works the worst with varied values of the and the mis-specified model parameters.
Summary statistics of c-efficiencies of the designs for estimating multiple s ( and ). represents the adaptive Bayesian c-optimal design; represents the two-stage robust c-optimal design; represents the traditional 8 points uniform design; represents the 8 points uniform design with Bayesian optimal weights
25% Q
Median
Mean
75% Q
0.4030
0.4657
0.4656
0.5260
0.3536
0.4835
0.4837
0.5817
0.3303
0.3763
0.3884
0.4654
0.3656
0.4387
0.4391
0.5111
0.4715
0.5369
0.5203
0.5879
0.4330
0.5579
0.5444
0.6621
0.3855
0.4671
0.4411
0.5122
0.4381
0.5349
0.5114
0.6049
0.5216
0.5550
0.5526
0.5830
0.4316
0.5540
0.5268
0.6511
0.4489
0.4783
0.4777
0.5032
0.5138
0.5666
0.5561
0.6074
0.4916
0.5269
0.5314
0.5684
0.3986
0.4907
0.4707
0.5396
0.4177
0.4534
0.4596
0.5049
0.4824
0.5375
0.5302
0.5820
0.5059
0.5570
0.5553
0.6155
0.2969
0.4342
0.4326
0.5489
0.4350
0.4918
0.4766
0.5469
0.4748
0.5737
0.5418
0.6204
Discussion
A key objective of dose-finding trials is often to study the dose-response curve or to estimate target dose levels of interest such as . In this research, our interest lies in conducting an optimal design to estimate multiple target doses, , simultaneously, whilst accounting for parameter dependency. We employ the two-stage design procedure to construct the adaptive Bayesian c-optimal design that incorporated the Bayesian paradigm in the second stage. It is shown that the proposed design reduces the parameter dependency without lose much design efficiency.
One challenge using the full posterior distribution to carry out the Bayesian paradigm in the second stage is the laborious evaluations of the information matrix for searching one Bayesian design. To overcome the heavy computation issue, three clustering methods such as k-means, kernel k-means, and fuzzy c-means are utilized as alternatives in constructing the Bayesian optimal design. Summary statistics of the simulation demonstrates that there is not much change among the performance of the three clustering methods Bayesian optimal designs.
From the c-efficiency histogram plots over the varied sets of parameter values, we state that the adaptive Bayesian c-optimal design and the uniform design with Bayesian optimal weights work reasonablely well for estimating varied values of s compared with traditional uniform design and two-stage robust c-optimal design. However, a minimal difference exists between the adaptive Bayesian c-optimal design and the 8 points uniform design with Bayesian optimal weights. One potential reason as discussed earlier could be the uniform design with optimal weights has 8 equal spaced design points which are relatively close to the adaptive Bayesian c-optimal design. Comparable results are found in the later computation of the c-efficiencies. The c-efficiency results demonstrate that the two-stage robust c-optimal design works slightly better when estimating lower value of ( and ); However, when estimating higher value of (, and ), adaptive Bayesian c-optimal design become better.
In summary, this research shows that the proposed adaptive Bayesian c-optimal design accounting for parameter uncertainty works fairly well for estimating multiple s. Compared with the adaptive Bayesian c-optimal design, the two-stage robust c-optimal design sometimes works better, sometimes not. The adaptive Bayesian c-optimal design works similarly with the 8 points uniform design with Bayesian optimal weights. However, when estimates wide range of the s, the Bayesian c-optimal design is much safer to use because its worst case is always better than the other designs. Another result of note is that the uniform design with optimal weights employing the Bayesian technique significantly enhanced the design performance compared with the traditional uniform design.
References
1.
AlbertJ. (2009). Bayesian Computation with R. Springer, New York.
2.
AtkinsonA. C., & DonevA. N. (1992). Optimum Experimental Designs. Oxford University Press, Oxford.
3.
BeloeilH.EurinM.TheveninA.BenhamouD., & MazoitJ. X. (2007). Effective dose of nefopam in 80% of patients (ED80): A study using the continual reassessment method. British Journal of Clinical Pharmacology, 64, 686-693.
4.
BezdekJ. C. (1981). Pattern Recognition with Fuzzy Objective Function Algoritms. Plenum Press, New York.
5.
ChernoffH. (1953). Locally optimal designs for estimating parameters. Annals of Mathematical Statistics, 39, 1266-1281.
6.
DetteH. (1996). A note on Bayesian c- and d-optimal design in nonlinear regression models. The Annals of Statistics, 24(3), 1225-1234.
7.
DhillonI. S.GuanY. Q., & KulisB. (2004). Kernel k-means, Spectral Clustering and Normalized Cut. Retrieved from http://www.cs.utexas.edu/users/inderjit/public_papers/kdd_spectral_kernelkmeans.pdf.
8.
DragalinV.HsuanF., & PadmanabhanS. F. (2007). Adaptive Designs for Dose-finding Studies Based on Sigmoid Emax Model. Journal of Biopharmaceutical Statistics, 17, 1051-1070.
9.
DrorH., & SteinbergD. M. (2006). Robust experimental design for multivariate generalized linear models. Technometrics, 48(4), 520-529.
10.
DunnJ. C. (1973). A fuzzy relative of the ISODATA process and its use in detecting compact well-separated clusters. Journal of Cybernetics, 3, 32-57.
11.
HartiganJ. A., & WongM. A. (1979). A k-means clustering algorithm. Applied Statistics, 28, 100-108.
12.
HyunS. W., & WongW. K. (2015). Multiple-objective optimal designs for studying the dose response function and interesting dose levels. The International Journal of Biostatistics, 11(2), 1557-4679.
13.
LouieA.KawP.LiuW.JumbeN.MillerM. H., & DrusanoG. L. (2001). Pharmacodynamics of daptomycin in a murine thigh model of staphylococcus aureus infection. Antimicrobial, Agents and Chemotherapy, 45(3), 845-851.
14.
LiG., & MajumdarD. (2008). D-optimal design for logistic models with three and four parameters. Journal of Statistical Planning and Inference, 138, 1950-1959.
15.
McCallumE., & BornkampB. (2015). Accounting for parameter uncertainty in two-stage designs for Phase II dose-response studies. Modern Adaptive Randomized Clinical Trials: Statistical and Practical Aspects, Boca Raton: Chapman & Hall/CRC Press, 427-450.
16.
MillerF.GuilbaudO., & DetteH. (2007). Optimal designs for estimating the interesting part of a dose-effect curve. Journal of Biopharmaceutical Statistics, 17, 1097-1115.
17.
PadmanabhanS. K., & DragalinV. (2010). Adaptive dc-optimal design for dose finding based on a continuous efficacy endpoint. Biometrical Journal, 52, 836-52.
18.
TingN. (2006). Dose Finding in Drug Development. Springer, New York.
19.
WangT. H., & YangM. (2014). Adaptive optimal designs for dose-finding studies based on sigmoid Emax models. Journal of Statistical Planning and Inference, 122, 188-197.
20.
WellingM. (2013). Kernel k-means and spectral clustering. Retrieved from http://www.ics.uci.edu/∼welling/teaching/273ASpring09/.SpectralClustering.pdf.
21.
WongW. K. (1994). Comparing robust properties of a, d, e and g-optimal designs. Computational Statistics & Data Analysis, 18, 441-448.
22.
YangM.BiedermannS., & TangE. (2013). On optimal deigns for nonlinear models: A general and efficient algorithm. Journal of the American Statistical Association, 108, 1411-1420.
23.
ZhangA., & HyunS. W. (2016). Robust c-optimal design for estimating multiple edps under the 4-parameter logistic model. Statistics, Optimization and Information Commutating, 4, 278-288.