
Abstract
This study introduces a measure called coefficient of within-cluster proximity (CWP) to evaluate the similarity of probability density functions (DFs) within clusters. After surveying the under and upper, and the computational problems of CWP, a fuzzy clustering algorithm for DFs is proposed. This algorithm can determine the suitable number of clusters and find the probability for each DF to belong to specific cluster. The convergence of the algorithm is considered in theory and illustrated by the numerical examples. The algorithm is applied to image recognition. The results show strong advantages of it in comparison to other algorithms. They also indicate the potential of the proposed approach in application to the data of different types.
Introduction
Cluster analysis is intended to separate the initial data into sub-groups or “clusters” in such a way that the elements in the same clusters are more similar to each other than the elements form other clusters based on any criteria (Thao & Tai, 2017). It is a crucial development of pattern recognition and an interesting topic of multidimensional statistics. Cluster analysis has a basis role in data mining as well as data analysis used in many areas. Therefore, it has been concerned by many statisticians (Chicco et al., 2003; Austin et al., 2005; Ciszak, 2008).
Normally, the elements for clustering are the discrete elements and the probability density functions (DFs). For these objects, there are two main approaches for clustering. They are hierarchical and non-hierarchical methods. Clustering of discrete elements (CDE) has been studied and widely used in many fields. Clustering for density function (CDF) has been developed in recent years from requirements of some applications. Since the DF can represent the information in an object, it has advantages in analysing for the complex data (Thao & Tai, 2017). For clustering, CDF shows the outstanding benefit when compared with CDE in many cases (Chen & Hung, 2015; Tai & Thao, 2018). As a result, it has been preferred in some recent studies. Goh and Vidal (2008) proposed the effective algorithm in computing because it reduced the number of dimensions based on the unit Hilbert sphere. Montanari and Calò (2013) introduced a method for CDF based on estimating non-parametric of DFs, and used the mixture models for hyper-spherical data. Chen and Hung (2015) proposed a simple algorithm that could analyse the automatic clusters for DFs. Thao and Tai (2017) contributed three different algorithms for fuzzy hierarchical and non-hierarchical methods. Tai and Thao (2018) proposed the non-fuzzy clustering algorithm for DFs by a new criterion in evaluating the similarity of elements. Recently, Diem et al. (2018a) proposed a fast and efficient approach for CDF by applying
The other aspect, how to evaluate the similarity of DFs is also an important problem. Until now, several distance notions have proposed for the separation of DFs. For example, Matusita (1967) proposed a measure based on the weighted product of DFs. However, it was very complex in computing and inefficient in clustering (Tai, 2017). In 2008, Pham-Gia et al. (2008) proposed the
In cluster analysis, the crisp and fuzzy algorithms are the main approaches. In the crisp clustering, each element only belongs to a cluster with probability as 1. Therefore, some boundary elements may not be evaluated precisely. In fuzzy clustering, each element can be assigned to one or more clusters with different probabilities. With this feature, the fuzzy clustering is more advantageous than the crisp one. Fuzzy cluster analysis has been extensively studied for CDE, but it is limited for CDF (Tai & Thao, 2019). The important results about fuzzy clustering of CDF have presented in Chen and Hung (2015), Thao and Tai (2017). Since these studies used the normal distance as the criterion to evaluate the similarity of DFs, they had the disadvantage in applying.
Nowadays, in technological development, clustering analysis for images is very important thanks to its applications for different fields. There are several methods to classify the images into different groups. Almost all these methods have taken the input data based on the extracted features from the image such as colour, texture, co-occurrence matrix, and shape. Among them, the studies about texture and colour are preferred. Setia et al. (2006) used the co-occurrence matrices of local relational features to classify images, whereas Eleyan et al. (2011) introduced a new approach to recognize the face based on gray level co-occurrence matrices. Guo et al. (2005) segmented the images by HRRS method based on the unsupervised texture. These studies only performed with input data to be the discrete elements. Clustering for images based on DFs has not been given much attention. The significant contributions for this application were presented by Chen and Hung (2015) and Thao and Tai (2017). It is noticed that the above studies only focus on texture and shape from the features of the image. In addition, cluster analysis for images is usually used as a numerical example in these studies, not the major purpose. These days, in state-of-the-art studies, DFs is just estimated in one-dimensional space. For three-dimensional spaces, it is still restricted (Tai et al., 2019). We don’t find the documents to compare the effectiveness of clustering for images with the extracted DFs in one-dimension and three-dimensions. The applications for images also show the reasonableness and the advantages of the proposed algorithm in comparison with the existing ones.
The rest of this article is structured as follows. Section 2 presents the definition the coefficient of within-cluster proximity, the bounds, and the problem to compute this measure. The proposed algorithm and its convergence are given in Section 3. Section 4 applies the proposed algorithm in recognizing images. Section 5 is conclusion. Appendix of the article gives the proofs of Theorems.
Coefficient of within-cluster proximity
The definitions
Let
The CWP of the cluster with only one DF is defined as 1.
For
where
The larger for the value of CWP is, the higher for the similarity degree of the DFs is.
In non-fuzzy cluster analysis,
where
From Eq. (3), we can prove that
where
Proof The proof of this theorem is presented in Appendix 1.
To compute CWP, we need to find the
Given
i) For one-dimension
Solve the equations With root Give If then If then If then In the above algorithm,
From this algorithm, we have established a Matlab procedure to find the
ii) For multi-dimensions
In case of multi-dimensions, it should be very complicated to obtain the closed expression for
The algorithm
Let
Set Set Update the representing DFs by the formula:
where
with Repeat Step 2 until After Step 3 stops, the DFs in the same cluster will converge to the representative DF. If there are Let
Update the new cluster probability matrix
Calculate Repeat Step 6 and Step 7
After Step 8 ends, we have a matrix with
Diagram of the proposed method is presented in Fig. 1.
The diagram of the proposed algorithm.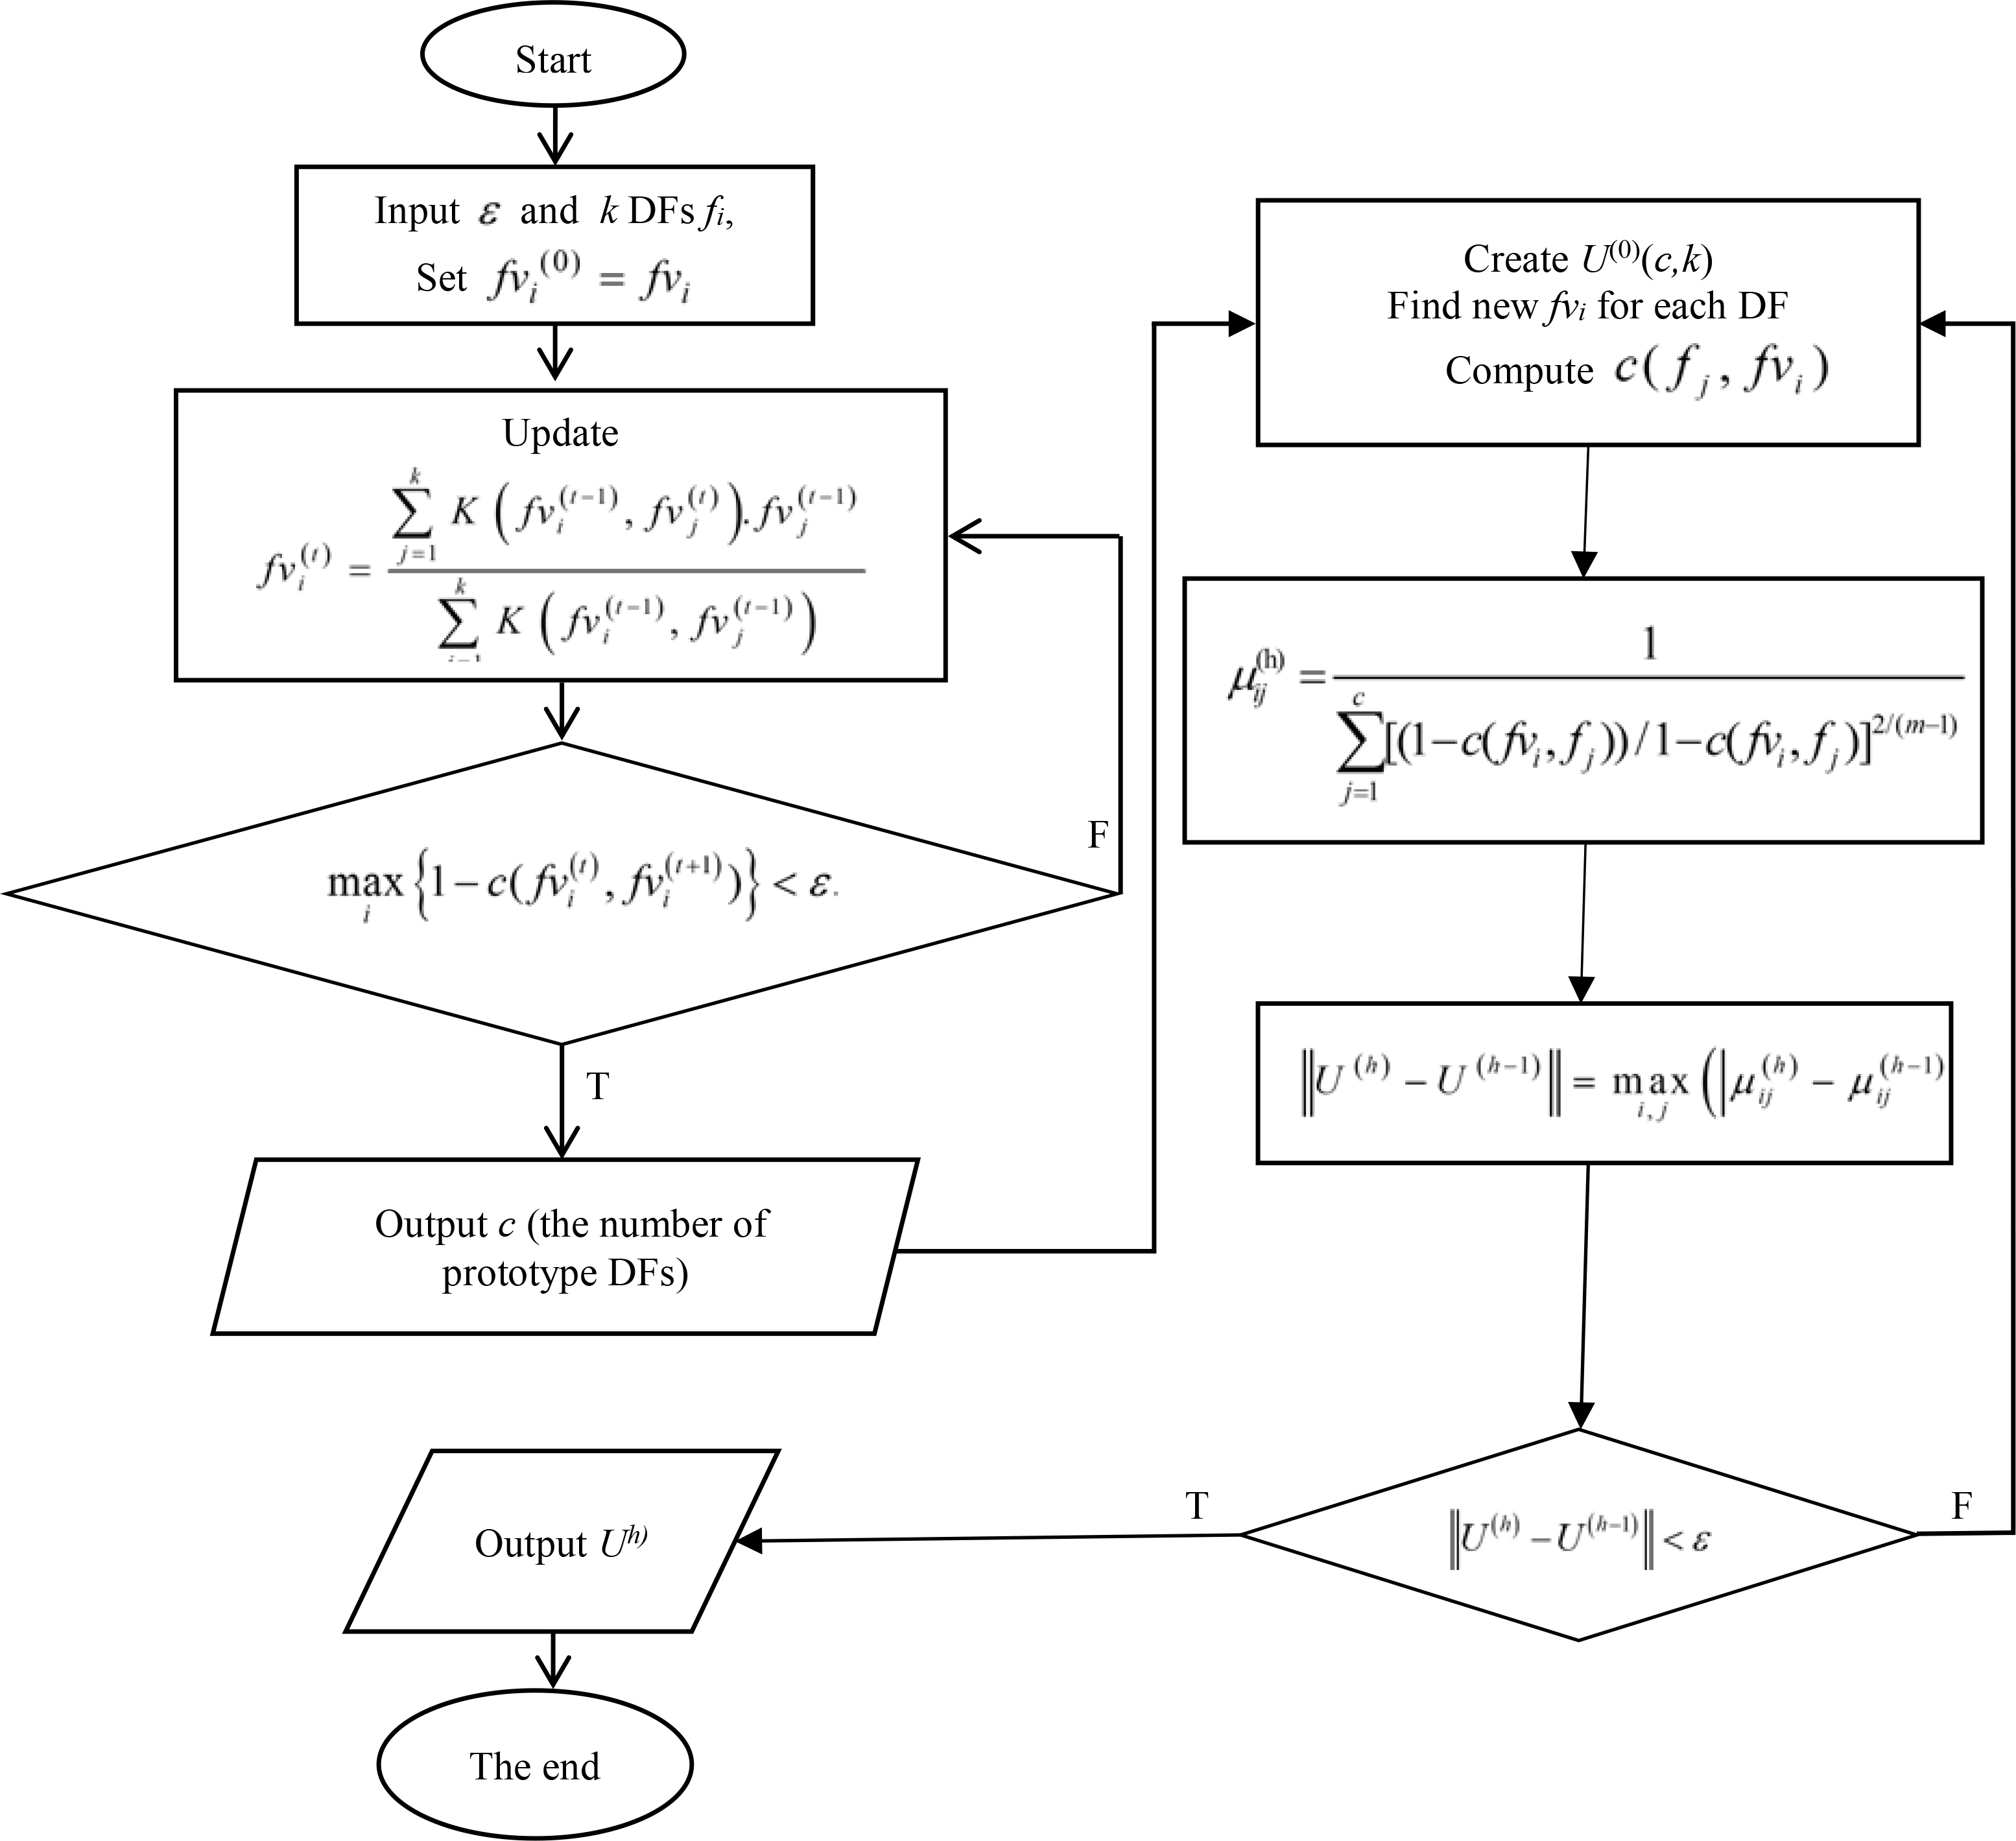
In the proposed algorithm, we need to notice the following problems.
(i)
(ii)
(iii) The value of
(iv) In practice, data usually contain discrete elements, so we firstly have to estimate the DFs to apply the proposed algorithm. There are many methods to solve this problem. This research uses the kernel function method, the most popular one in practice. It has the following form:
where
For Eq. (8), the choice of smoothing parameter and the type of kernel function are important. Although some authors such as Tai (2017), Thao and Tai (2017) had many discussions about this problem, the optimal choice still has not been found yet. In this article, the smoothing parameter is chosen by Thao and Tai (2017), and the kernel function is the Gaussian kernel function (Thao & Tai, 2017).
(v) We have established the complete Matlab procedure for the proposed algorithm. This algorithm can extract the features of images based on their colours, find the suitable number of clusters, determine the elements in each cluster, and give the probability belonging to clusters of each element at the same time. It has been applied quickly and effectively for examples and applications of this article.
The proposed algorithm has two phases. Phase 1 contains Step 1, Step 2, and Step 3, which provides the suitable number
Proof The proof of this theorem is presented in Appendix 2.
Illustration for the algorithm
Given 100 univariate normal DFs
50 DFs with
Perform Phase 1, after 10 iterations (see Fig. 2), we have 3 clusters:
The convergence of Phase 1 for 100 DFs.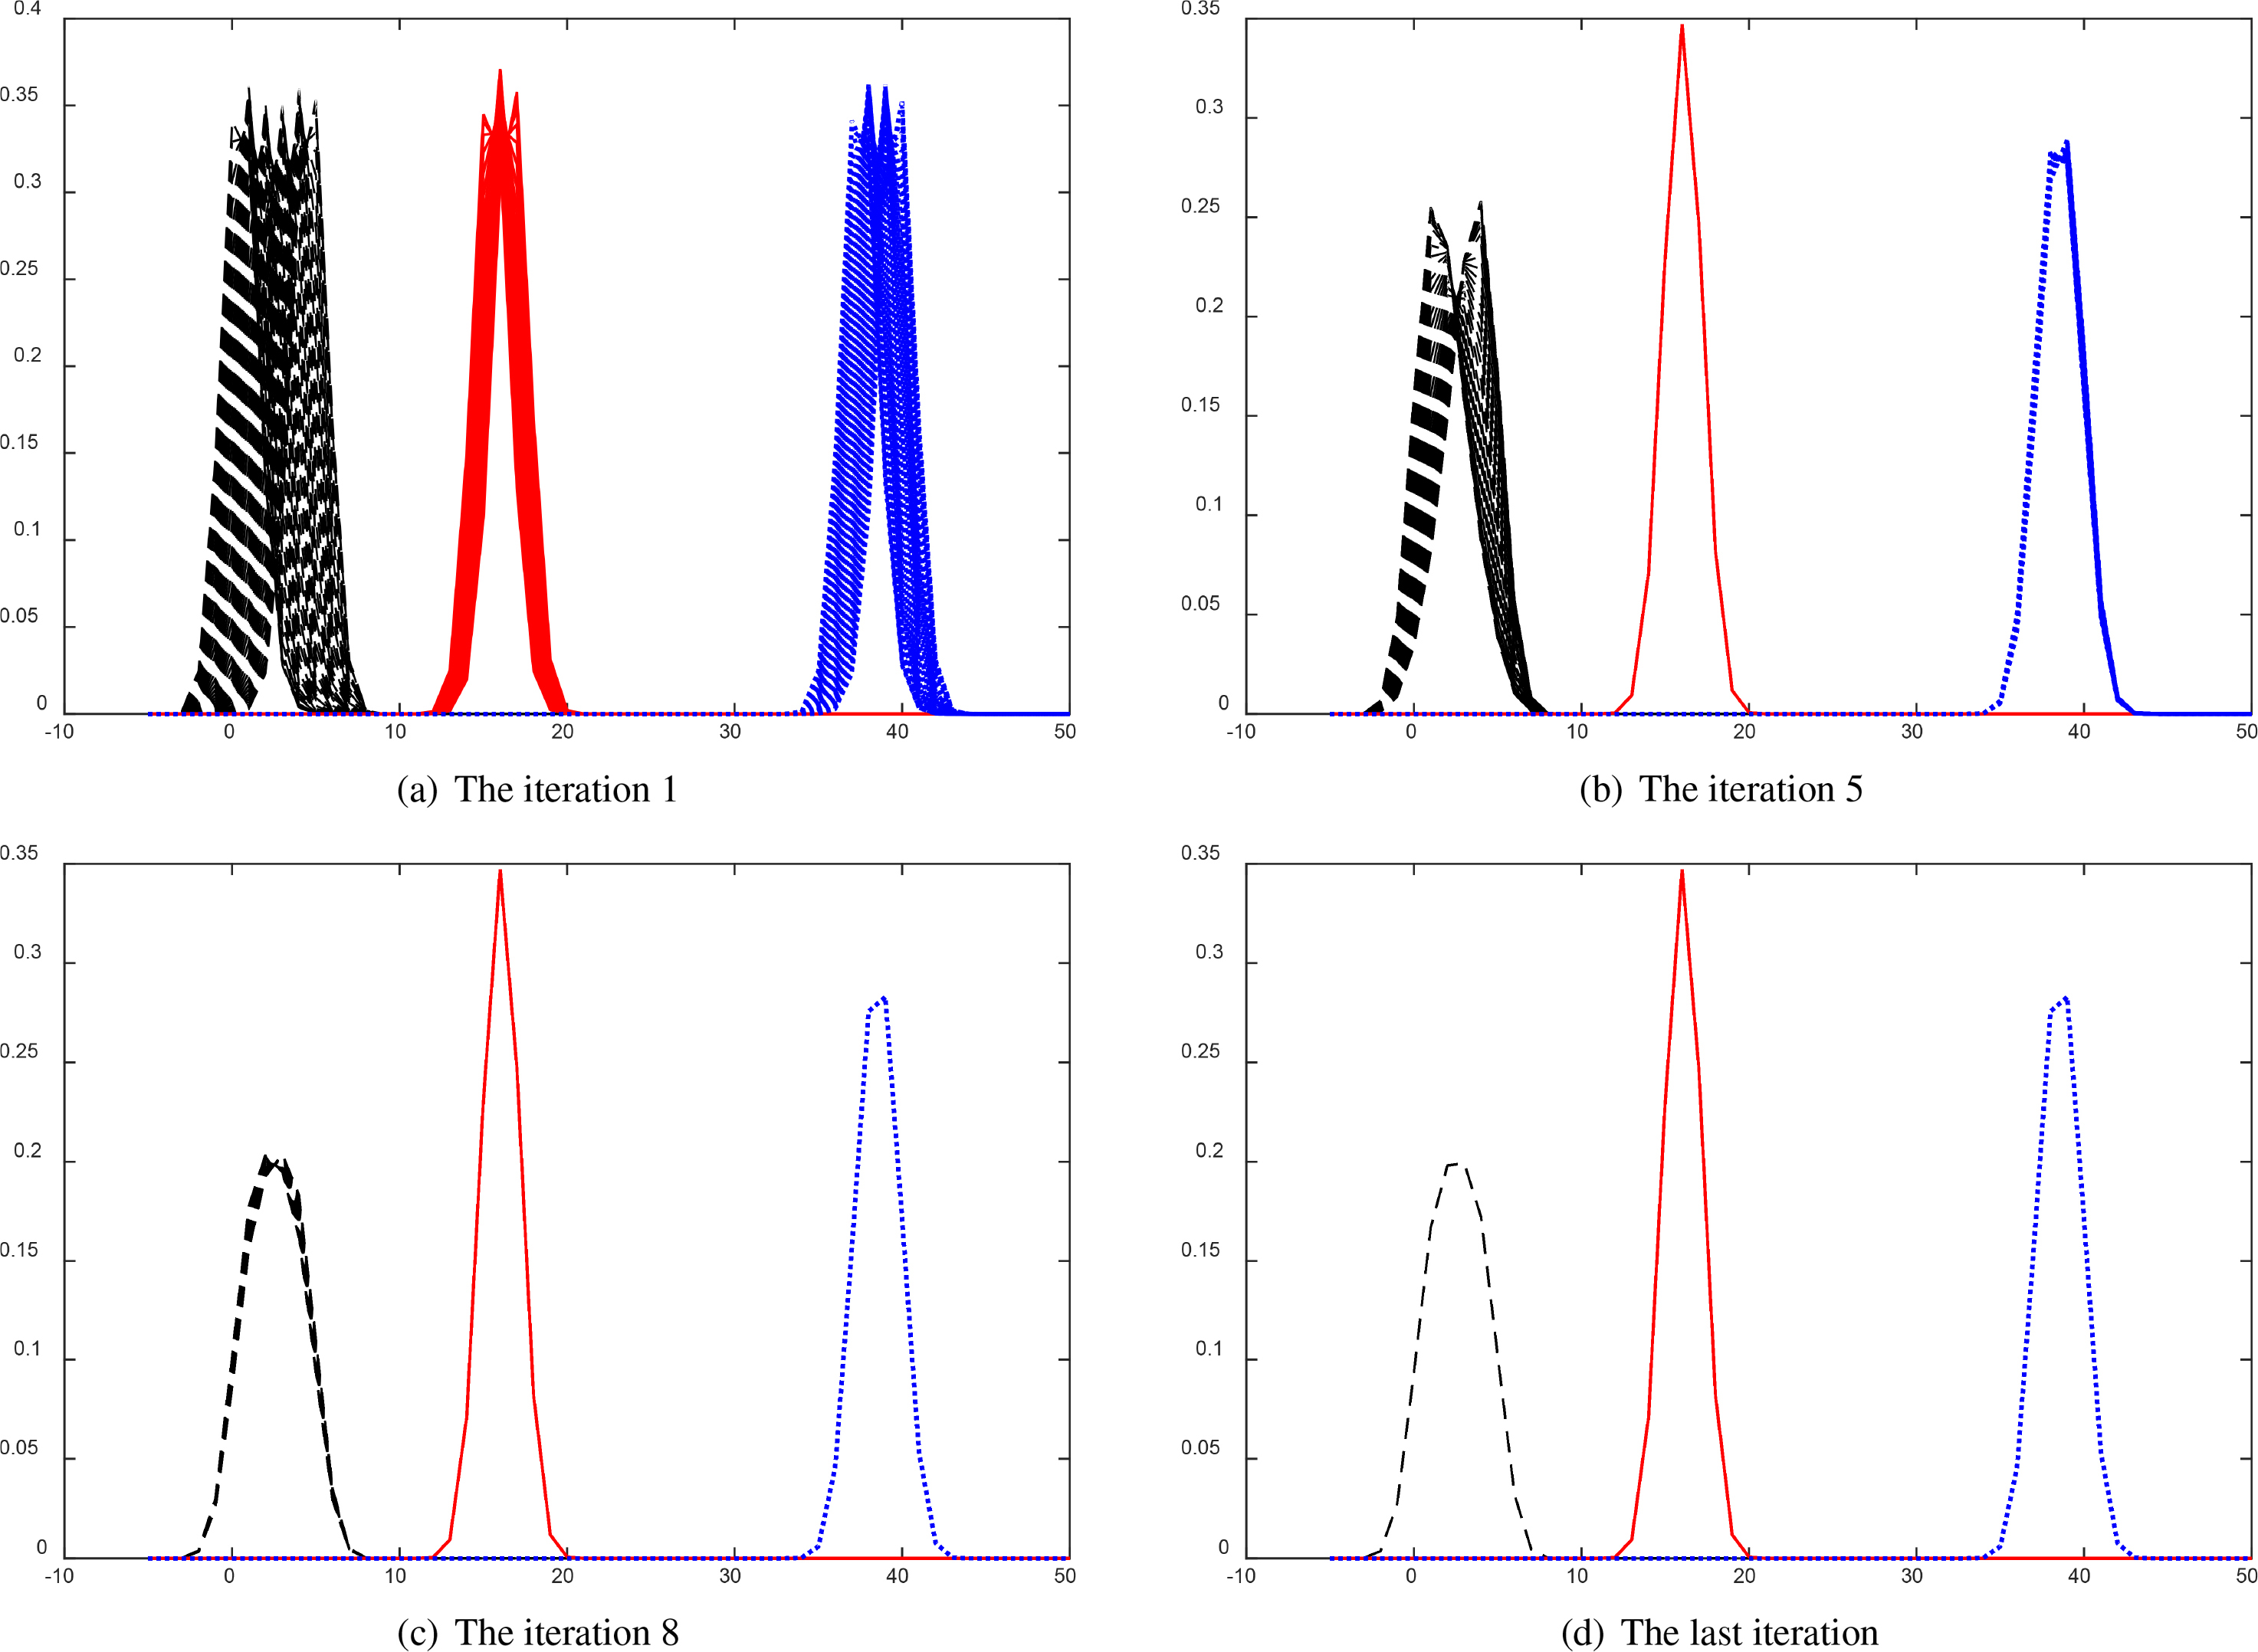
Continuing Phase 2 with 15 iterations, we receive the final probability partition matrix as follows:
These probabilies are shown in Fig. 3.
Probability of 100 normal DFs belonging to 3 clusters.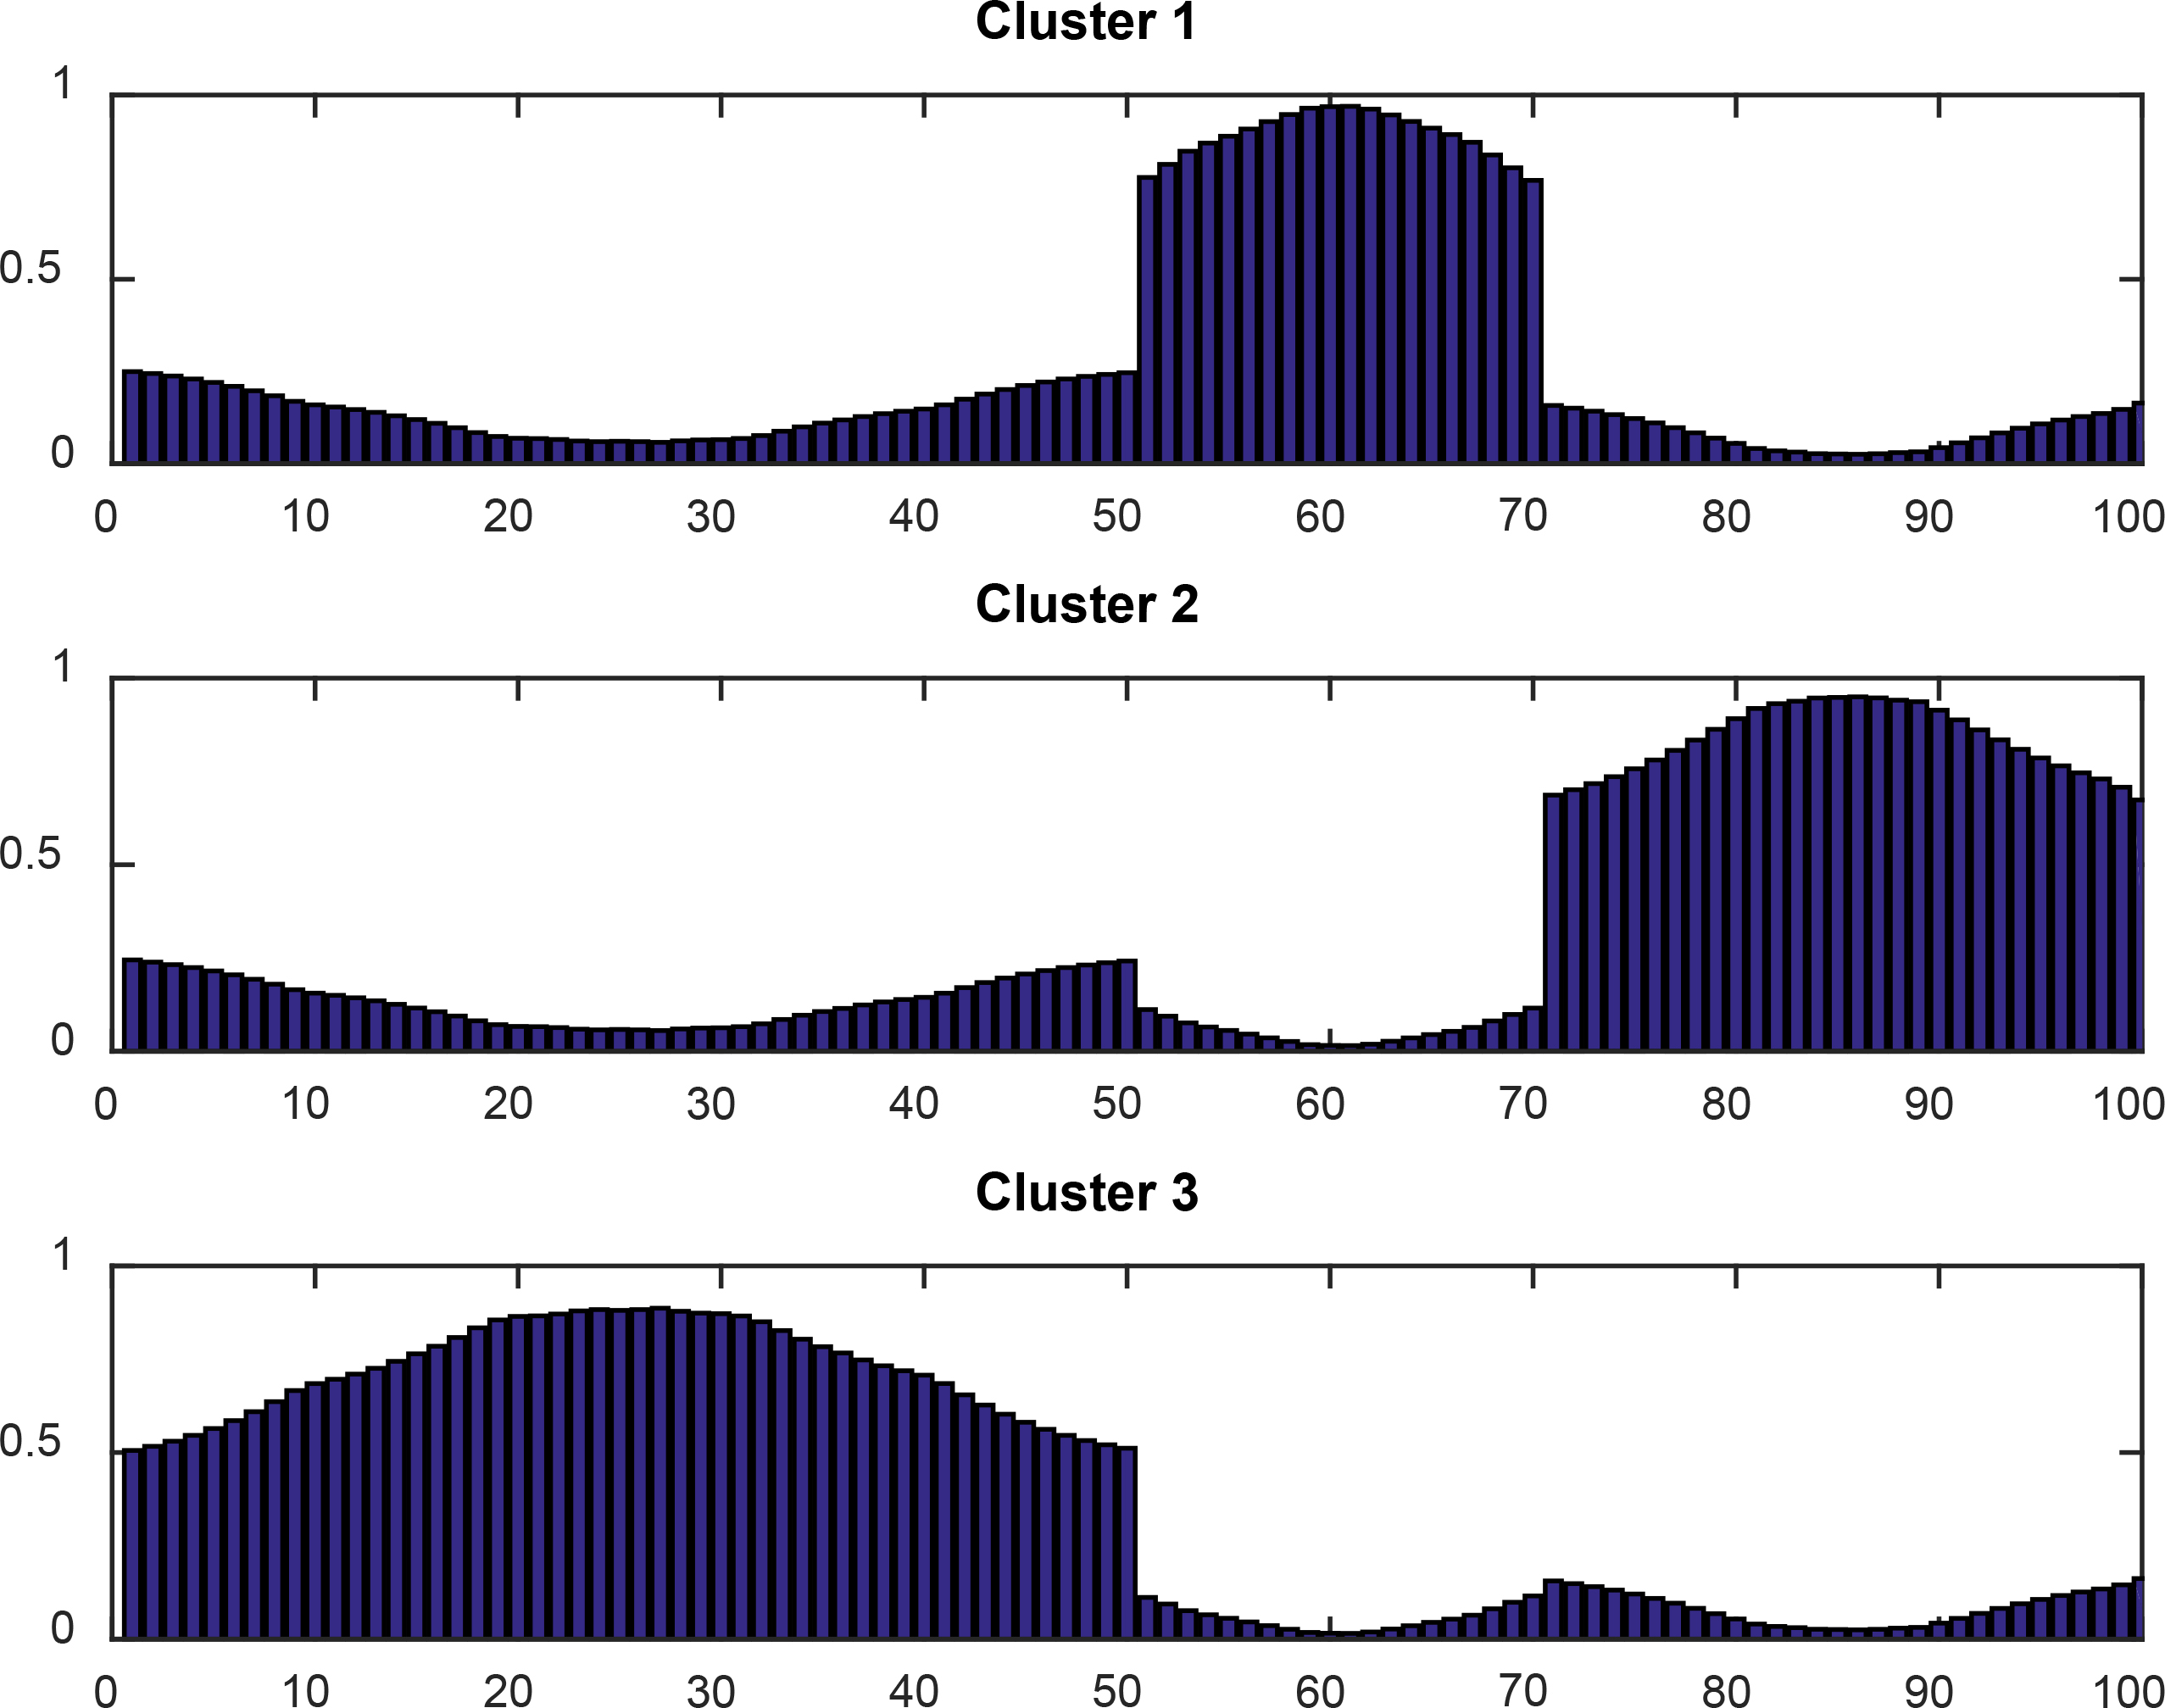
In short, the proposed algorithm has given the good result in this data. The number of clusters has determined suitably and the probability of each DF belongs to its right cluster.
Problem of extracting color features for images
i) Using the
scale
The gray level co-occurrence matrix (GLCM) for an image with size
where
After calculating GLCM for each image, using the Eq. (8) to estimate density function. It means that each image is now represented by a DF of one variable.
ii) Using the RGB scale
The image is extracted by three colors (R: Red, G: Gray, B: Blue) that each color is also performed similar as i). In this case, each image is represented by a DF of three variables.
In this section, two numerical examples are performed to apply the proposed algorithm in clustering of images. For these examples, the images are examined on both G and RGB scales. Example 1 realizes the CUReT images with three main types of structures (see
For the parameters ASWC, PBM, and ARI, the larger these parameters are, the better the algorithm are. However, the value of MR has the opposite meaning. Moreover, to confirm the stability as well as the accuracy, each algorithm would be executed in 30 independent iterations and the result will be appreciated by an average value.
Three original texture samples in CUReT database.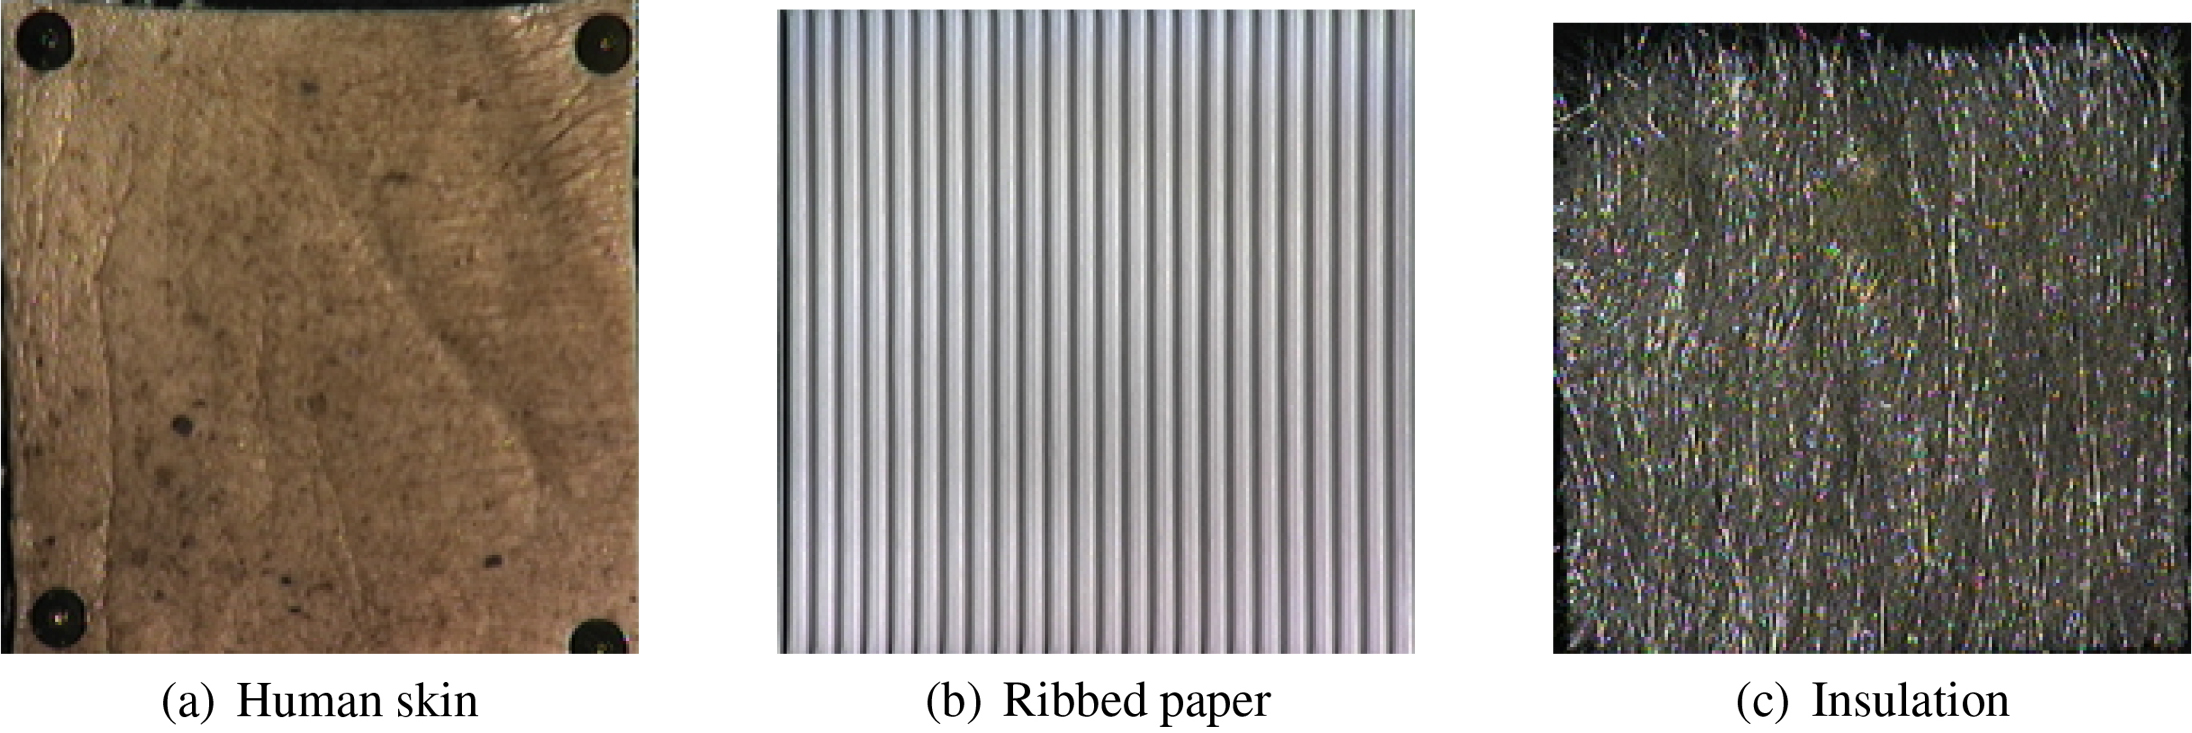
The DFs are estimated based on the G and RGB scales of the image pixels. In case of G scale, the DFs is demonstrated by Fig. 5.
The estimated DFs based on G scale of 218 images.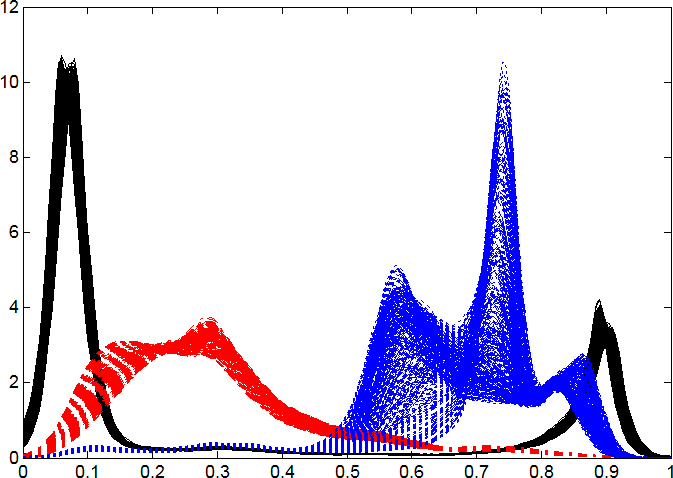
Perform Phase 1, both G and RGB scales give the number of clusters as 3. For example, the 5
Execute Phase 2 of the proposed algorithm, we have the probability partition matrixes in cases of G and RGB scales as follows:
Grayscale:
RGB scale:
These probabilities for two cases are shown by Figs 8 and 9, respectively.
Comparing the algorithms performed in the Grayscale of CUReT database
The 5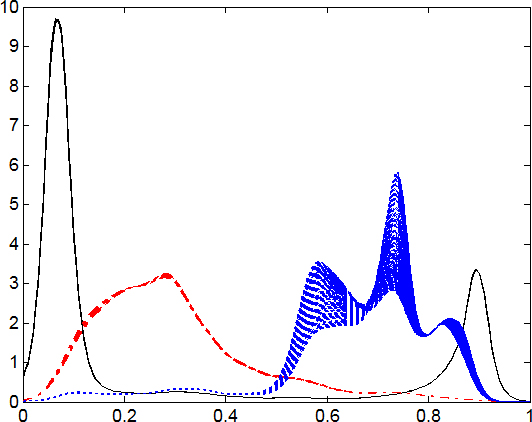
The final iteration for CUReT database in G scale.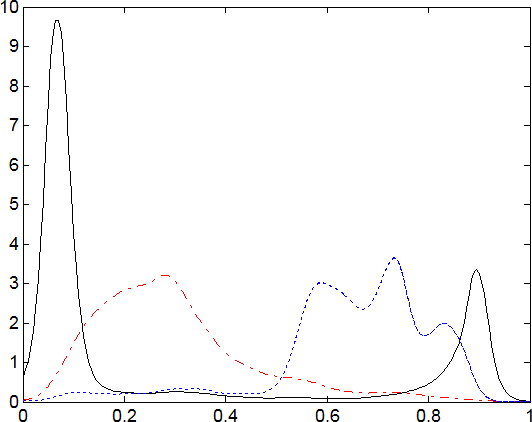
Probability of each image belonging to three clusters in G scale.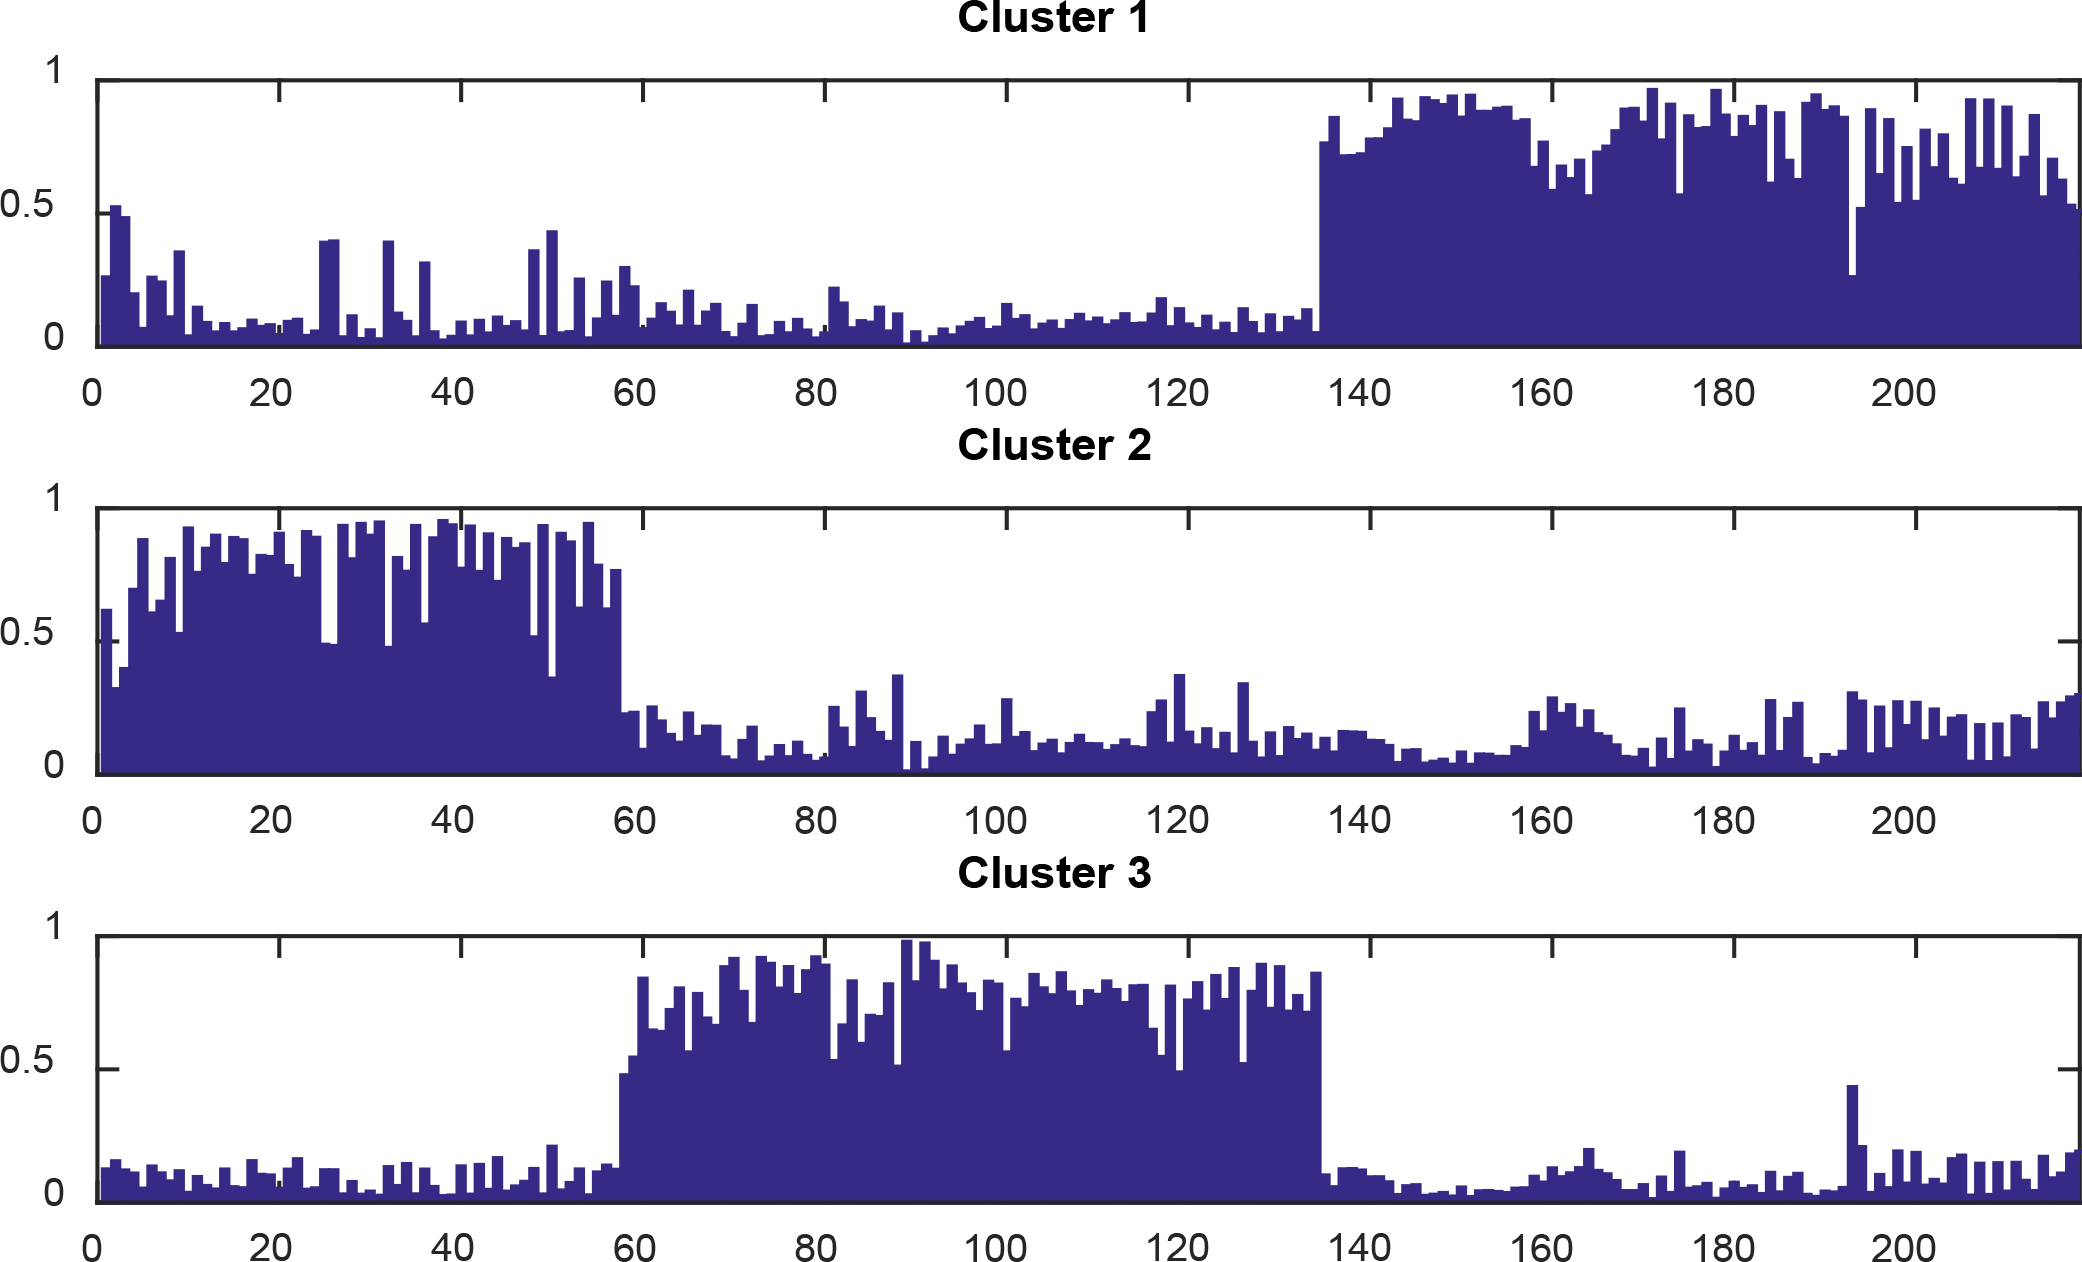
Probability of each image belonging to three clusters in RGB scale.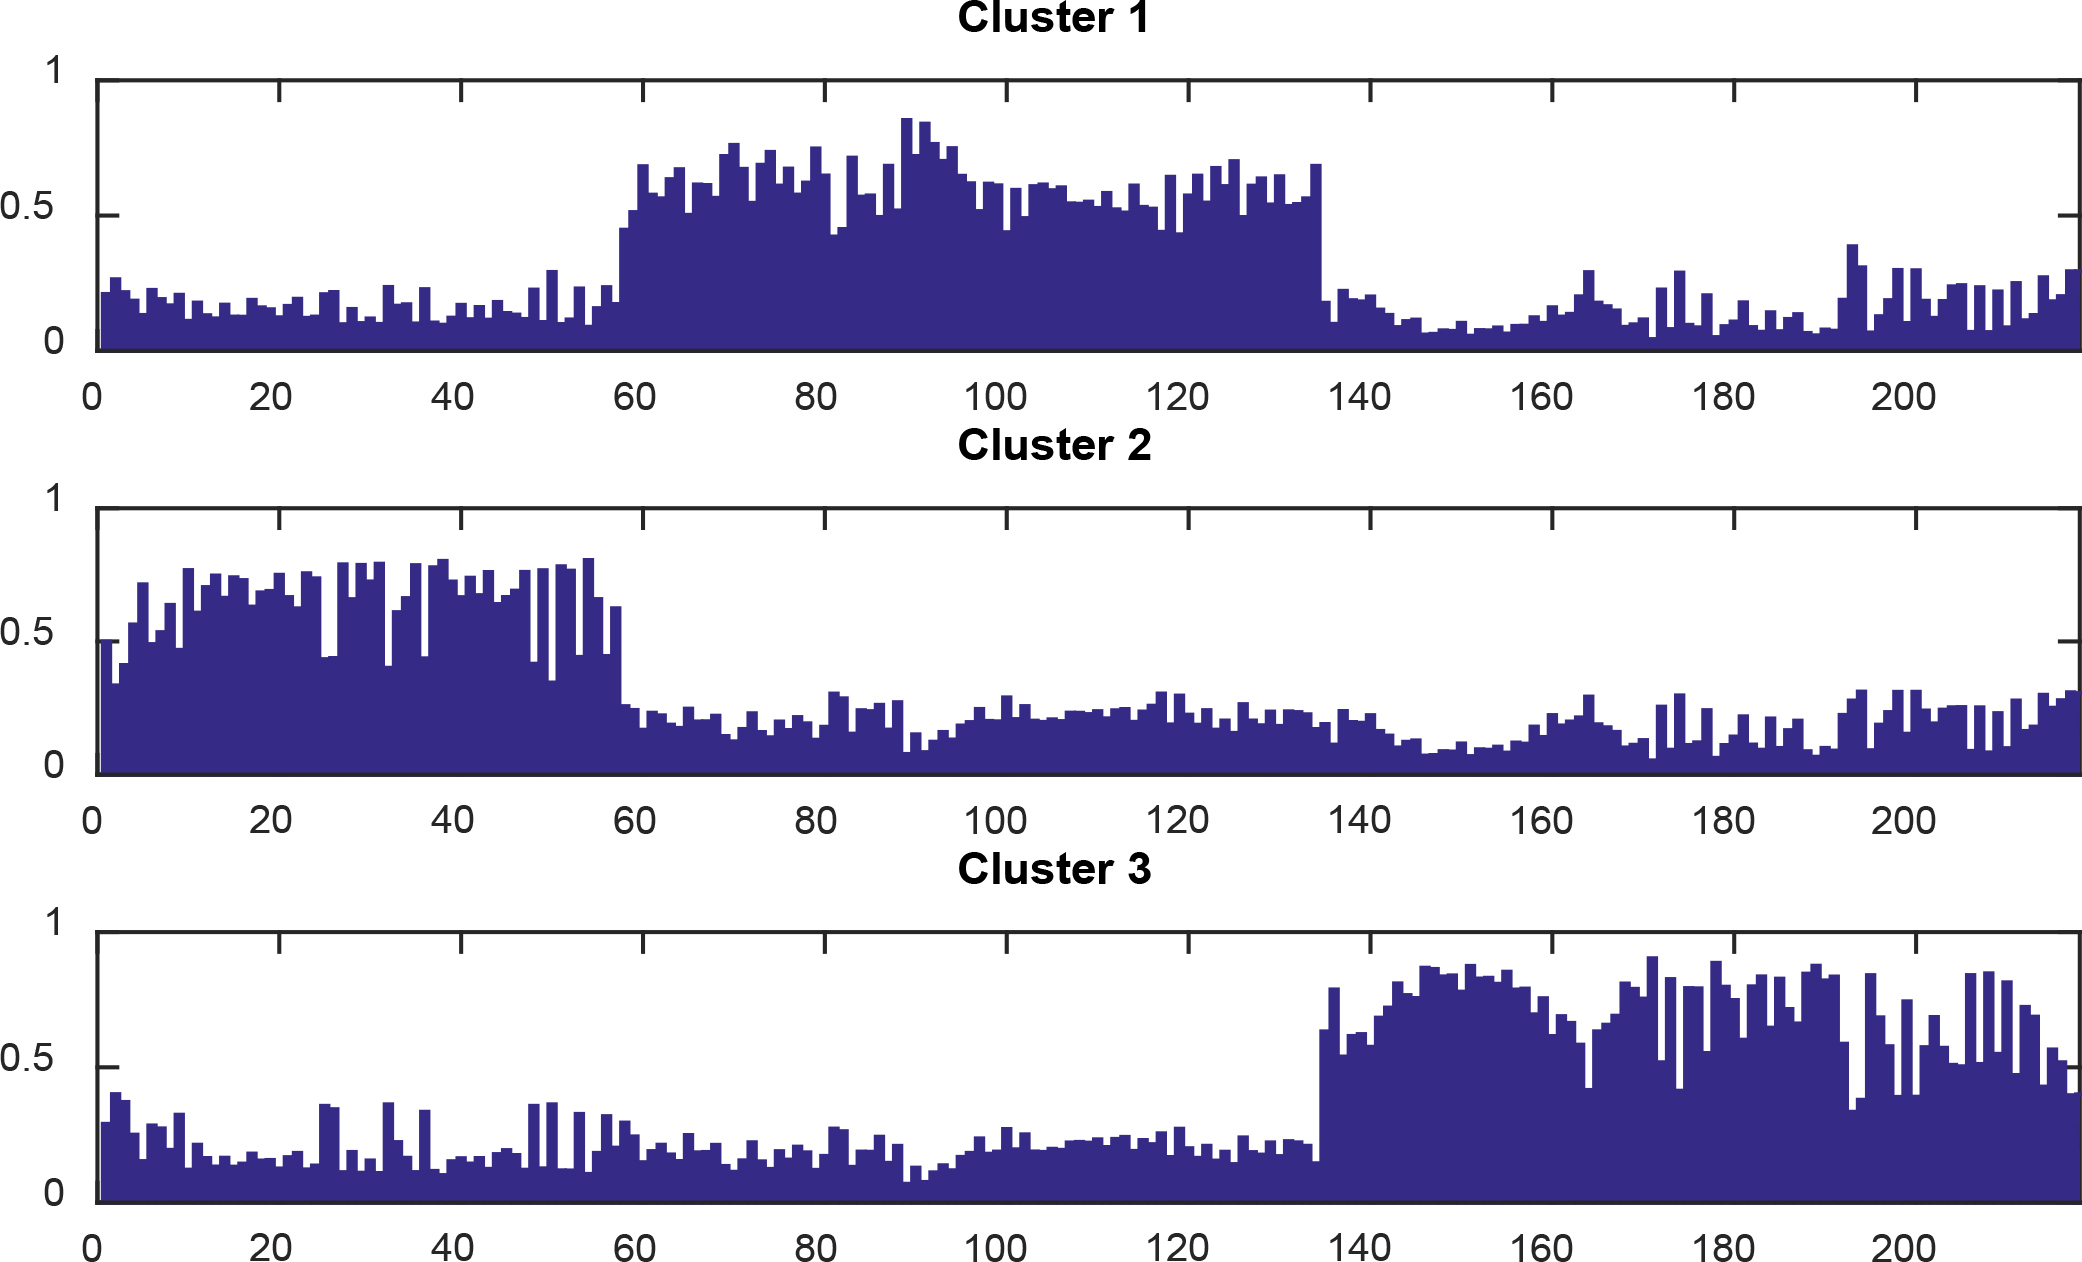
In both the above two matrixes, the probability each image assigned to its right cluster is fairly high. Comparing the proposed algorithm to the existing ones, we have Table 1.
In short, the proposed algorithm has given the accurate result about the number of clusters with this image data. The probability belonging to its right cluster is also suitable. In addition, Table 1 shows that the proposed algorithm has the best result in comparing to the existing ones for all the considered parameters.
Sample images of two groups for Data 1.
Comparing the result of algorithms or Data 1
Comparing the result of algorithms for Data 2
Sample images of three groups for Data 2.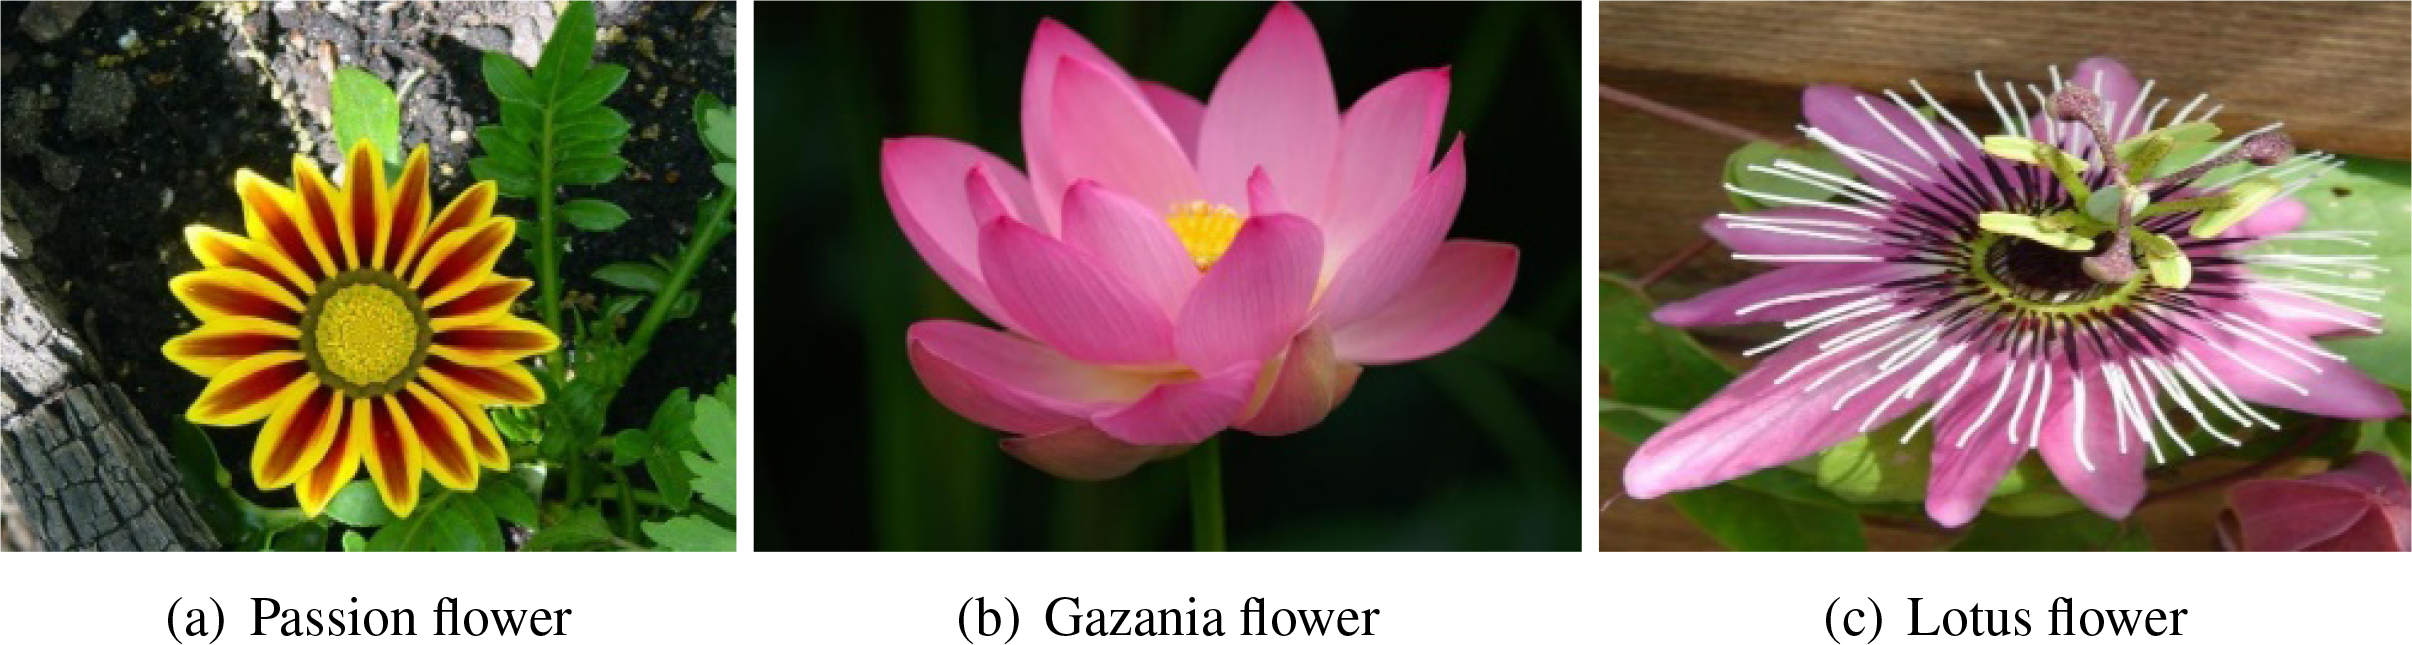
Implementing Phase 1 of the proposed algorithm, we obtain the number of clusters for Data 1 and Data 2 are 2 and 3, respectively. These are suitable results for two data sets. The algorithm of Chen and Hung (2015) gives 2 clusters for both two data sets. It means that the number of clusters is only suitable for Data 1, and it is not for Data 2. Because other algorithms do not have the approaches to determine the number of clusters, we use the number of clusters from the proposed algorithm to compare the clustering process. They are shown in Table 2 (Data 1) and Table 3 (Data 2).
Although the extracted DFs from two data sets have high overlap, the proposed algorithm still obtains good results in determining the suitable number of clusters, and finding the probability to belong to clusters of images. Table 2 and Table 3 show that the proposed algorithm has the best result in comparing to the existing ones.
This paper proposes the fuzzy clustering algorithm for probability density functions with several improvements. Firstly, a measure called CWP is proposed for evaluating the within-cluster proximity. Secondly, defining bound of CWP as well as calculating CWP in real problem are also established. Then, the specific steps of the proposed algorithm based on CWP are presented. This algorithm can determine the suitable number of clusters, the elements in each cluster, and give the probability belonging to clusters of each DF. The convergence of the proposed algorithm is also considered in theory and checked by the numerical examples. This algorithm can perform effectively by the established Matlab procedure. Finally, the practical application of the proposed algorithm is considered in the image recognition problem. Various types of images with different sizes and quantities in many fields have shown that the proposed algorithm outperforms the existing ones. This research can extend for practical applications in other fields such as security, medical, and economics. This would be one of our indispensable researches.
Footnotes
Acknowledgments
The authors would like to thank the anonymous reviewers for their careful reading and insightful suggestions of the manuscript. We wish to thank Lien Nguyenthi, the lecturer of Van Lang University, who has the helps to complete this article.