Abstract
COVID-19 is a severe acute respiratory syndrome caused by the new Coronavirus. COVID-19 outbreak is a Public Health Emergency of International Concern, declared by WHO, that killed more than 2 million people worldwide. Since there are no specific drugs available and vaccination campaigns are in the initial phase, or even have not begun in some countries, the main way to fight the outbreak worldwide is still based on non-pharmacological strategies, such as the use of protective equipment, social isolation and mass testing. Modeling of the disease epidemics have gained pivotal importance to guide health authorities on the decision making and applying of those strategies. Here, we present the use of the Weibull distribution to model predictions of the COVID-19 outbreak based on daily new cases and deaths data, by non-linear regression using Metropolis-Markov Chain Monte Carlo simulations. It was possible to predict the evolution of daily new cases and deaths of COVID-19 in many countries as well as the overall number of cases and deaths in the future. Modeling predictions of COVID-19 pandemic may be of importance on the evaluation of governments and health authorities mitigation procedures, since it allows one to extract parameters that may help to guide those decisions and measures, slowing down the spread of the disease.
Introduction
Since the World Health Organization has declared the COVID-19 outbreak a Public Health Emergency of International Concern, in January, 30
Before the development of efficient vaccines, many non-pharmacological strategies have been proposed to fight COVID-19. Most of them are based on slowing the virus spread by self-care measures, as the use of personal protection equipment, mass testing and restriction of social contact, through patient quarantine, social isolation and lock down. Despite many discussion, social isolation and mass lock down measures have been described as successfully strategies for slowing the virus spreading (Anderson et al., 2020; Lau et al., 2020; Mitjà et al., 2020; Saez et al., 2020; Sjödin et al., 2020; Wilder-Smith & Freedman, 2020). Mass testing has been shown to be one of the most effective strategies, since it allows tracing precisely the contact network of each contaminated person and apply isolation and quarantine measures. Success of some countries, such as South Korea, in slowing down the spread of the virus has been attributed to mass testing and selective quarantine (Choi, 2020).
Comparison of the evolution of epidemic curves among countries may be of pivotal importance to predict the effect of the mitigation measures taken. It is possible, based on the data analysis, to model the evolution of the disease and to predict the number of infected, healed and deceased people along days and weeks. Such predictions may be extremely helpful in the decision taking by health authorities. Many papers have presented predictions of the epidemic evolution by different methods (Ciufolini & Paolozzi, 2020; Gupta et al., 2020; Kim et al., 2020; Li et al., 2020). In this work, we have used the Weibull distribution in a selected set of data, depicting the number of daily new cases and deaths, from countries that present distinct epidemic patterns. Weibull distribution is one of the most commonly used parametric lifetime model (Lawless, 2003), mostly for its parsimony, its ability to satisfactorily model data which are commonly encountered in survival analysis and its availability in statistical software packages (Khan, 2018; Lawless, 2003). We believe that data from daily new cases and deaths of COVID-19, as well as from other epidemic outbreaks, may be modeled by the Weibull distribution, resulting in valuable information to be used for supporting mitigation measures taken by governments and health authorities worldwide.
Materials and methods
Data on the daily number of confirmed new cases and deaths, for every country, were extracted from Our World in Data project (Roser et al., 2020) as comma-spaced values (CSV) files, processed with R (R Core Team, 2013) using Rstudio 1.2.5042 (RStudio Team, 2020) for Linux. Data were subset in order to select countries names, dates of registers and the number of daily new cases and deaths for each country, since the beginning of the pandemic (December, 31
Data on daily new cases and daily new deaths were adjusted to a 4-parameter Weibull distribution using Markov Chain Monte Carlo simulation (MCMC). A modified Weibull 4-parameter equation was used to adjust the data to the prediction model, described as:
where
Some cases in which data calculations required the use of bimodal Weibull distribution will be presented bellow. In such cases, a bimodal Weibull distribution, adapted from Eq. (1), was used:
where
Markov Chain Monte Carlo Simulations (MCMC) were performed using random walk Metropolis algorithm (Metropolis et al., 1953) within a five dimensional space to accommodate
Starting parameters for Metropolis-MCMC
Selection of the starting parameters for the Metropolis-MCMC procedures is a key feature for the efficiency of the simulation. These initial values should not be too far away from a typical set of parameters (where posterior density is high) because the Metropolis-MCMC algorithms would need too many iterations to reach the convergence if the initial values are far in the tail of the posterior distribution (Korner-Nievergelt et al., 2015). Since 4-parameter Weibull distribution was specifically used to model COVID-19 epidemic curves, we have used simple rules, based on the analysis of the graphical role of the Weibull parameters (Eq. (1)), as described below:
Location parameter (
where Scale parameter (
Starting values for the area parameter (
Fitting procedures described in this paper were summarized in a R language package named “weibull4”, designed to fit epidemiological data, in special for COVID-19, using Weibull 4-parameter equation (Eq. (1)) by Metropolis-MCMC algorithm. The package weibull4 is available for downloading and installing at the Comprehensive R Archive Network (CRAN) repository (R Core Team, 2013).
Supplementary material
Figure S1, described in the text, is available as Supplementary Material. The R script called “Moreau_weibull_ 2021”, with the codes for every calculation and plots in this paper is available in the Code Ocean server (
Results
Data analysis can be of outstanding importance during infection diseases outbreaks, mainly if fast decision making is crucial to slow down the spread of the disease. Modeling of the course of the COVID-19 pandemic in highly affected countries is a live-saving demand (Eberhardt et al., 2020; Verma et al., 2020), since it can be used to support and guide decision makers to quickly act and block the spread of the disease. Data on daily new cases and daily new deaths were extracted from Our World in Data project on Coronavirus (Roser et al., 2020). Data from countries that faced the COVID-19 pandemics earlier, such as Italy, France, Spain, etc, formed a well defined single peak in a first moment. Such pattern allowed us to evaluate statistical modeling to proper fit the data. The Weibull distribution was chosen for this goal because of its potential in modeling life time events (Lawless, 2003). Such analysis allows us to forecast predict epidemiological outcomes, as death toll and the future number of daily new cases and deaths in the studied countries.
Panel A: Profile of the first wave of daily new cases (open circles) and deaths (closed circles) of COVID-19 in Italy. Data were fit within an unimodal 4-parameter Weibull distribution (lines). Arrows show the 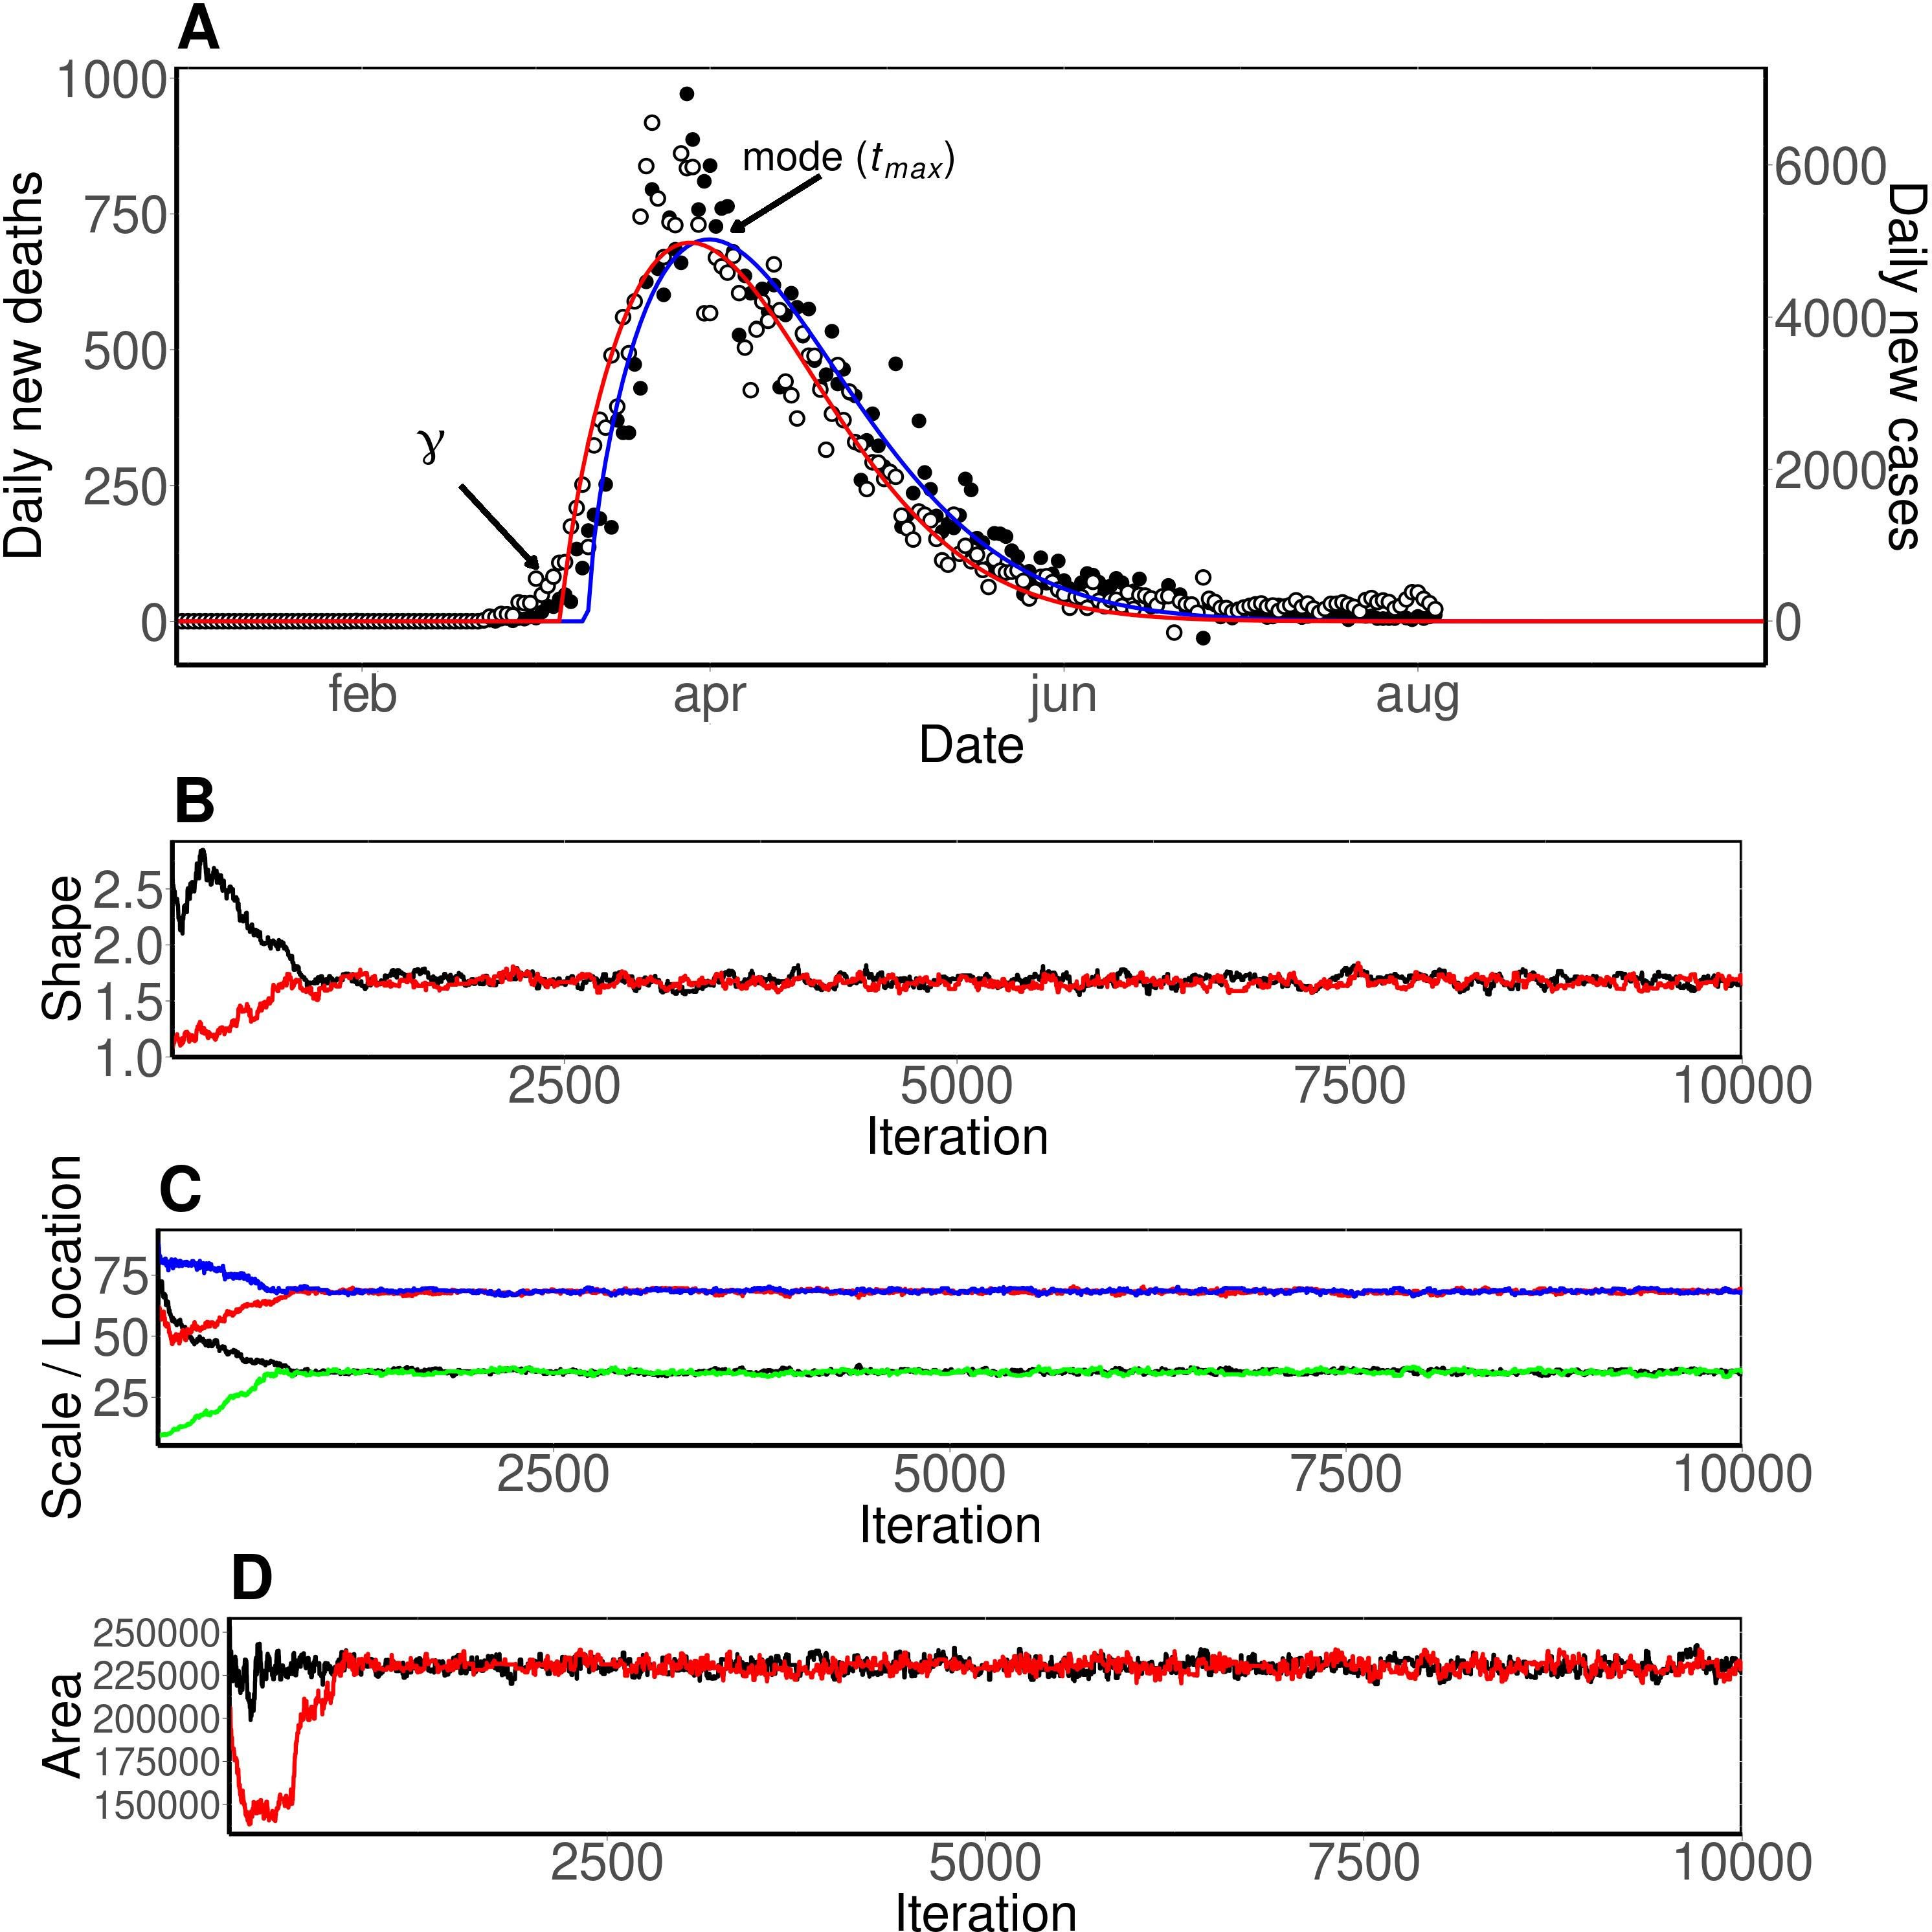
Figure 1 shows plots for the initial single peaks of daily new cases and deaths of COVID-19 registered in Italy, as well as the curve fits calculated for them. As seen, the Weibull distribution can properly fit the evolution of the epidemic peak and to be used to model and to forecast predict the number of daily new cases and deaths. Panel A of the Fig. 1 also illustrates the positions of the scale parameter (
where
Data on daily new cases and deaths of COVID-19 from nine selected countries used as examples of customized analysis. Upper panels show countries in which two unimodal Weibull distributions were used, with split date on August, 1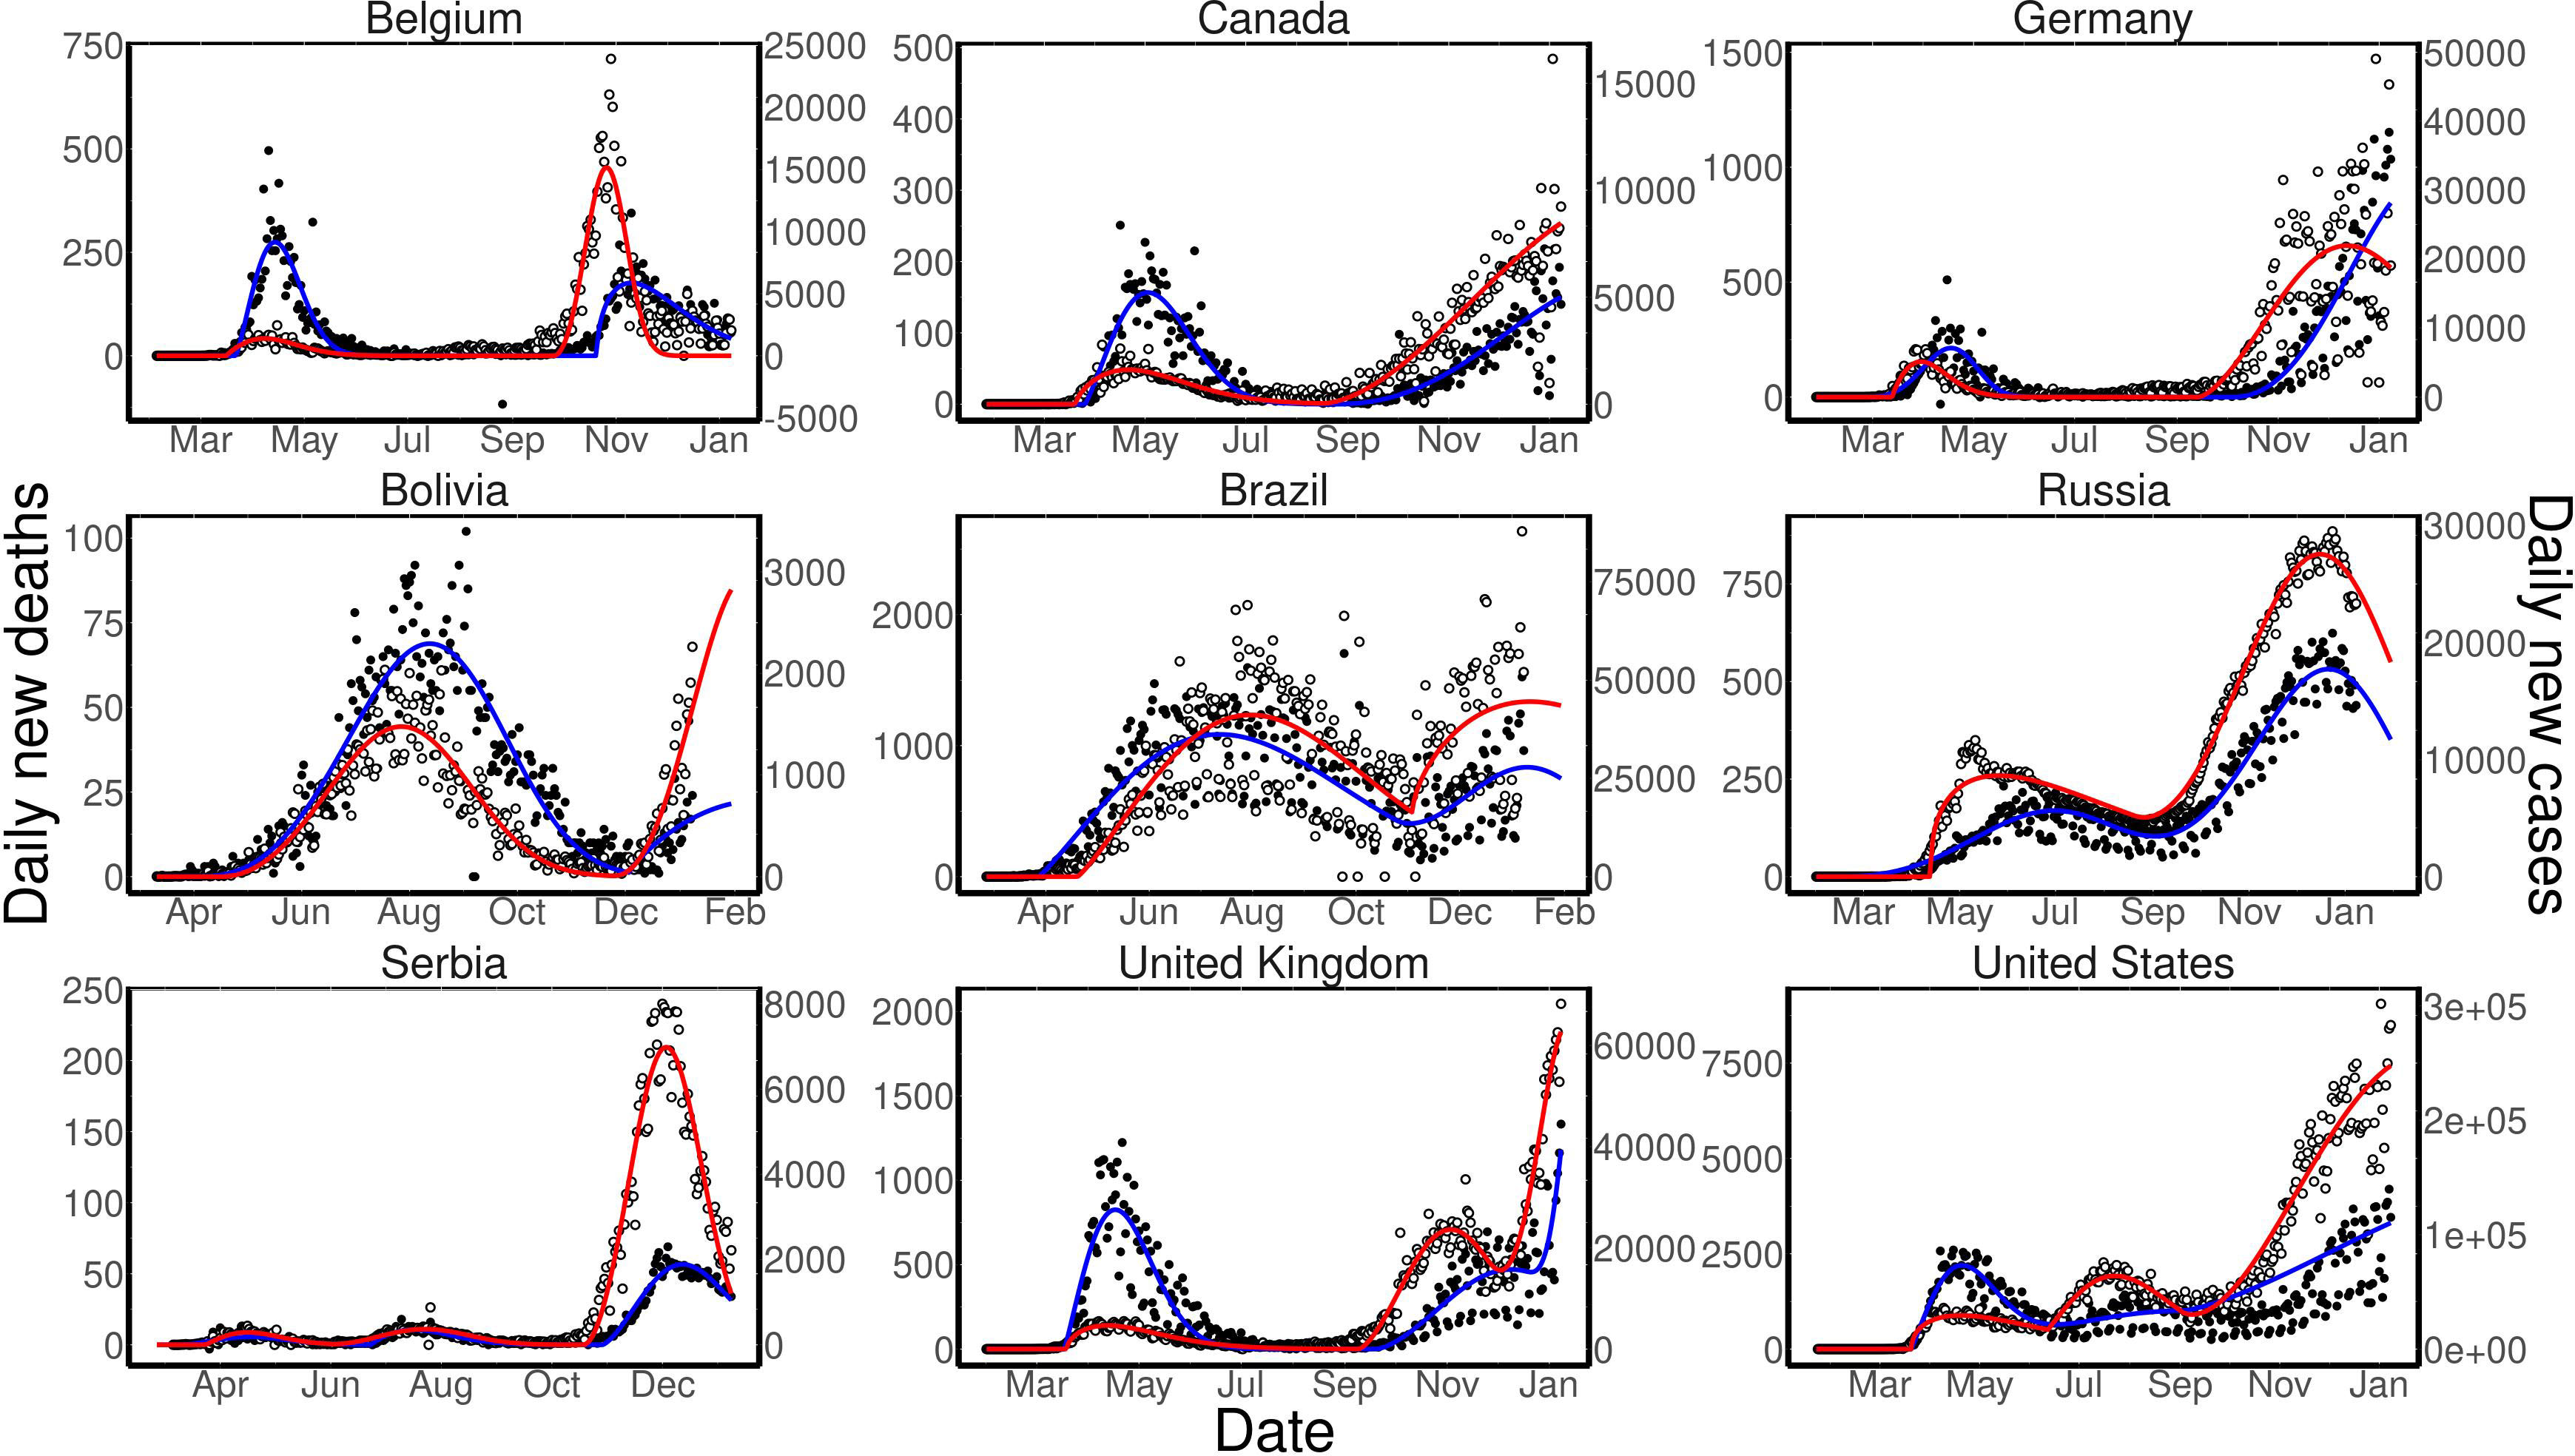
Recently, most countries have entered in a second wave of COVID-19 infections. Due to this second wave, such countries began to present a multimodal pattern of daily new cases and deaths. Additionally, some countries have shown more complex patterns, with more than two mixed waves. Such puzzling patterns make harder, or even impracticable, to perform proper statistic analysis and predictions. Even so, such complex data on COVID-19 daily new cases and deaths could be analyzed if multimodal distributions were used. This is possible by splitting the data by date to perform the analysis with two Weibull distributions, being one before and one after the splitting date. Optional arguments were included into the weibull4 R package (see Material and Methods) in order to allow users to choose the dates for split the data in two parts, as well as to set the unimodal or bimodal Weibull distribution to be used before and after the split date. More explanations about such arguments functionality are described under the package documentation files (not shown).
Examples on the data analysis performed with the Weibull distribution within the countries COVID-19 daily new cases and deaths data are shown in Fig. 2, in three distinct ways: i. Upper panels display countries in which data were analyzed by two separated unimodal distribution (Belgium, Canada and Germany), with data splitting on Sep, 1
The suitability of the model can be further evaluated by the residuals and by the Determination Coefficient (
Distributions of the residuals of the fitted data for daily new cases (Panel A) and deaths (Panel B) of COVID-19 calculated with customized analysis for each country. Split dates, as well as the number of modes in each used Weibull distribution were as described in Table 1. Normal distributions, calculated with the same means and SD of each respective residuals distributions, are shown in lines. Panels C and D show the residuals plots of daily new cases and deaths for countries versus the estimated fits in custom mode, as described in Table 1. Straight lines were draw with slope 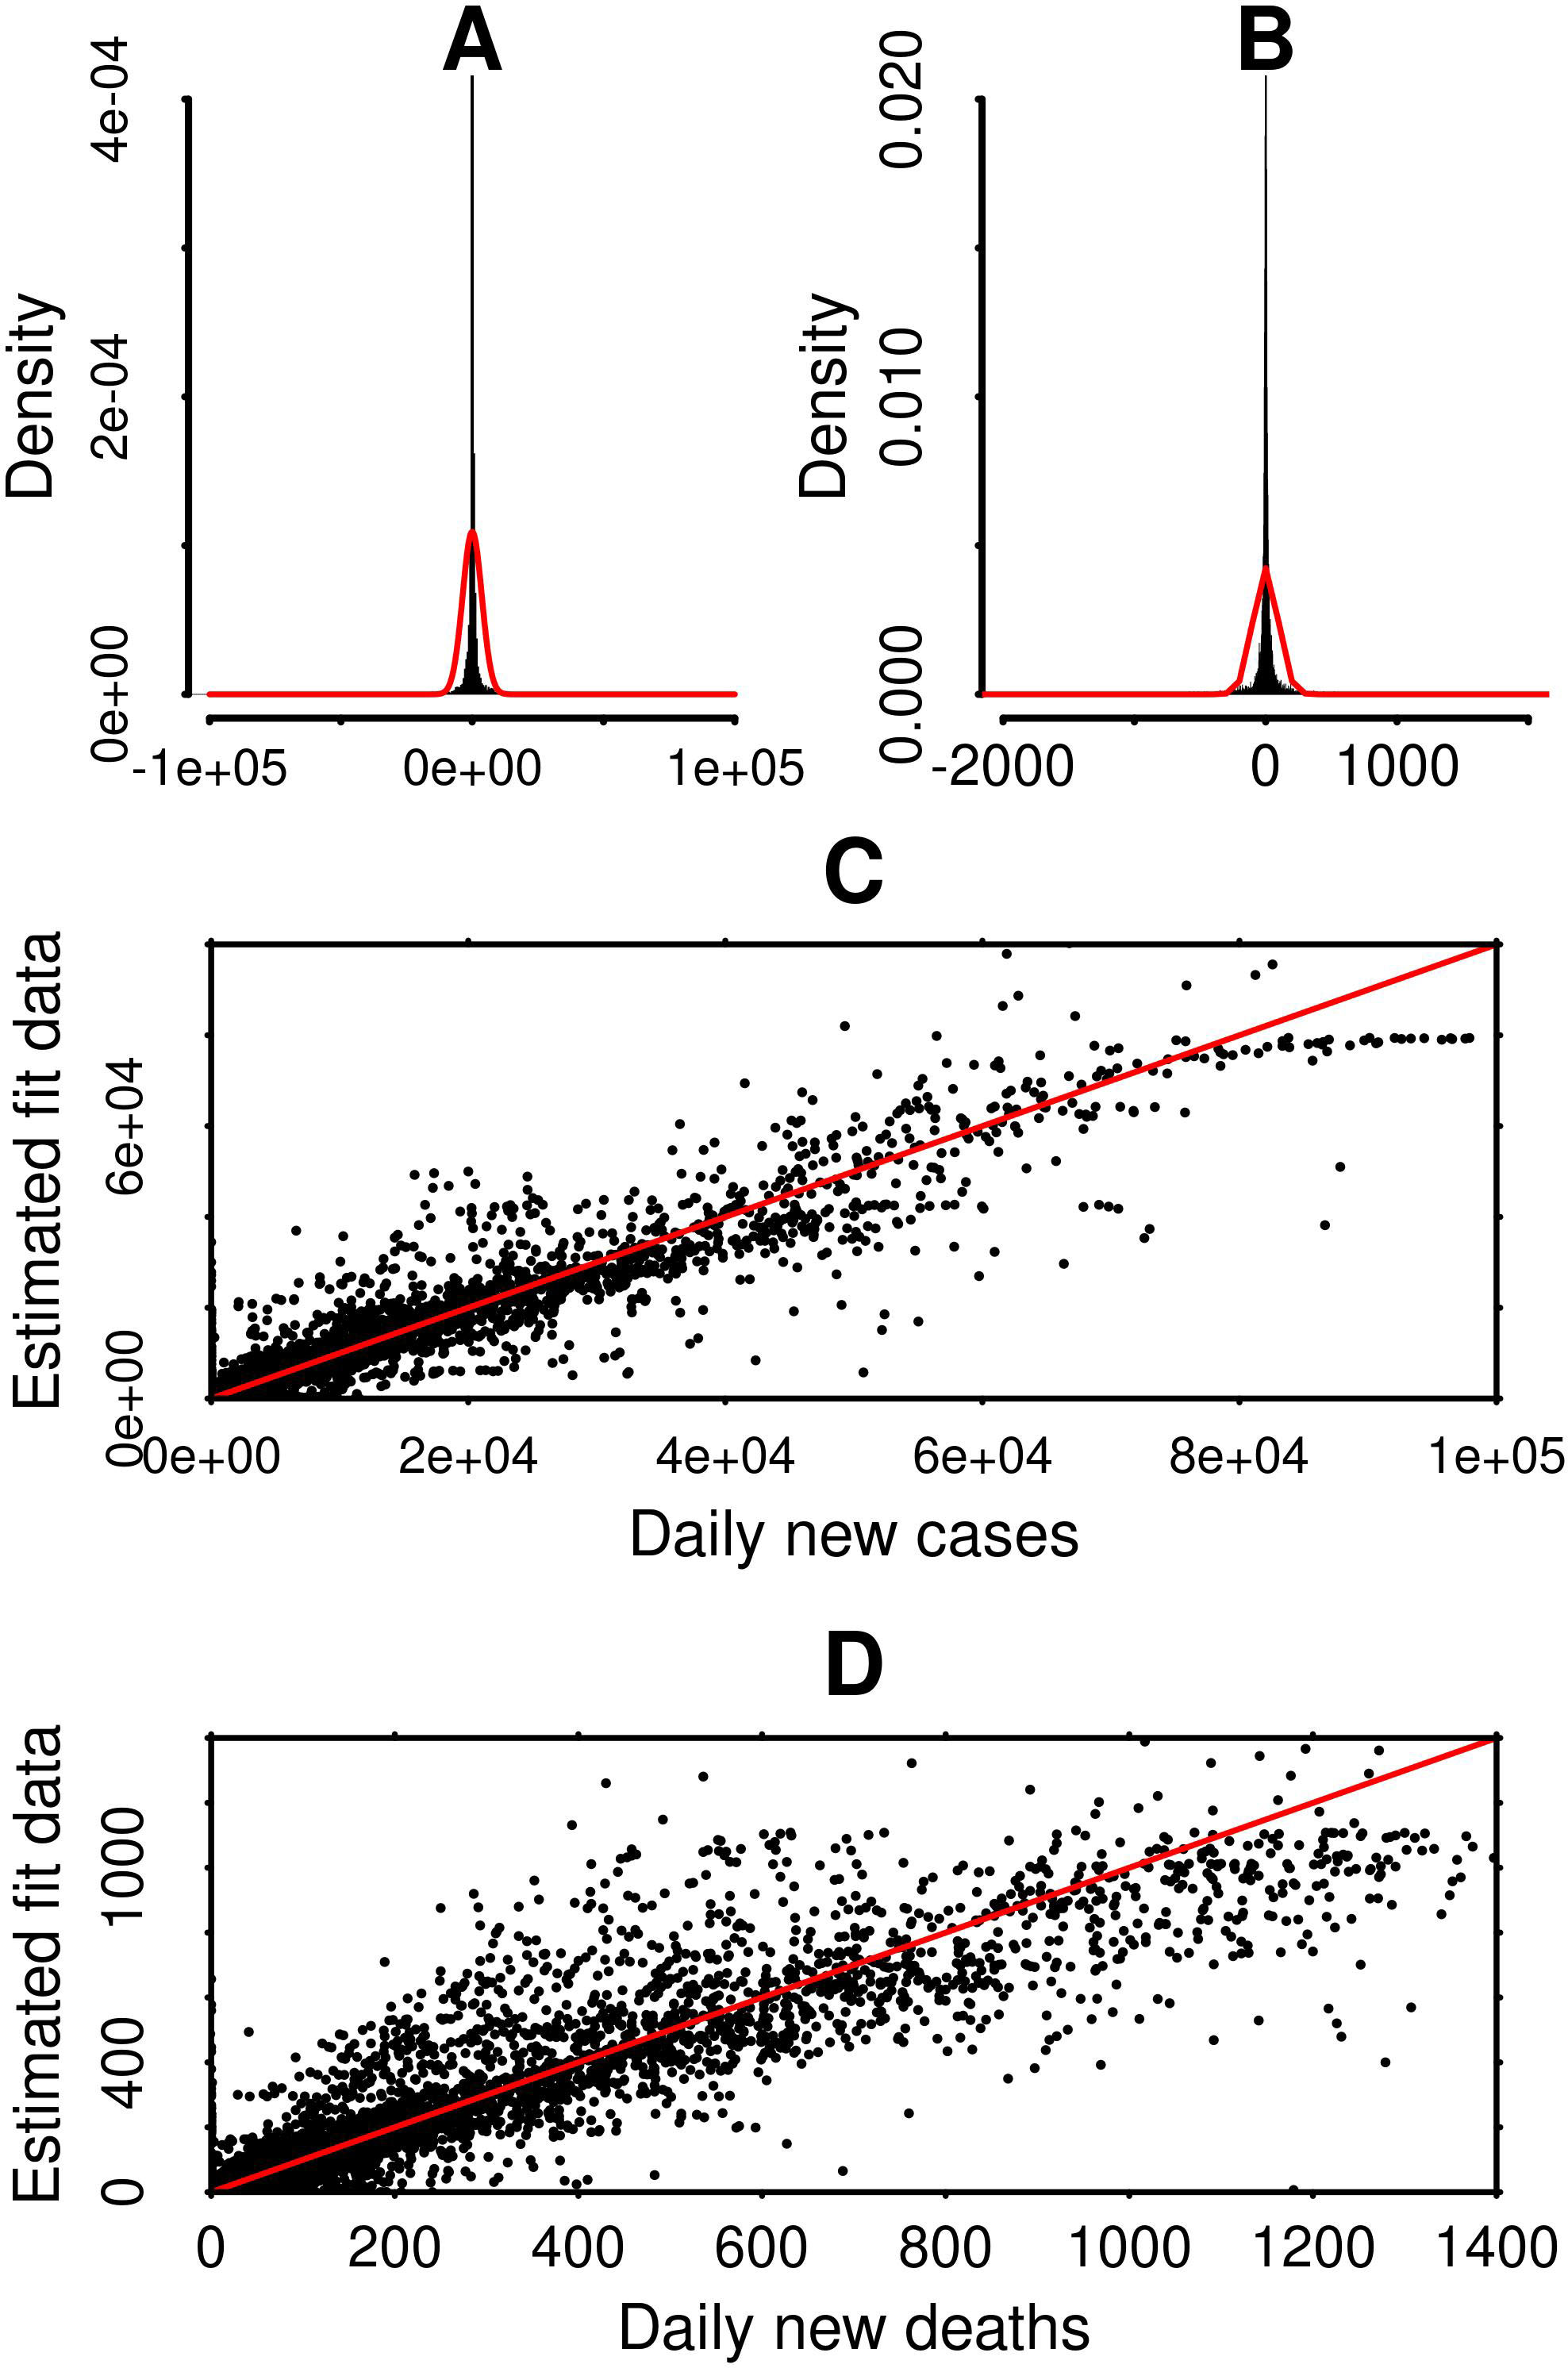
Estimated overall death tolls calculated from customized analysis, updated to January, 7
Modeling of natural processes is of primordial importance for predicting forecast tendencies of similar phenomena in the future, as well as for extracting information from the model that allows one to better understand it. The estimated death toll is one of the parameters that can be extracted from the calculations used to model the COVID-19 data here. Modeling of the COVID-19 curves of daily new cases and deaths allows us to predict both the number of daily new cases and deaths in the future, as well as the overall death toll for COVID-19 in a given country. Table 1 shows the total expected death tolls for COVID-19 for all the studied countries. Data fitting were performed, for each country, using the split dates and the number of modes for the first (Mo1) and the second (Mo2) distributions, as displayed in Table 1 (Mo1
Discussion
COVID-19 is a global health emergency that is going to change the way in which people, institutions and governments manage and execute their lives and duties. The fact that specific drugs or vaccines for COVID-19 have only been developed recently, raises the importance of behavioral strategies, as social isolation, lock-down (Anderson et al., 2020; Lau et al., 2020; Mitjà et al., 2020; Saez et al., 2020; Sjödin et al., 2020; Wilder-Smith & Freedman, 2020) and mass testing (Choi et al., 2020; Peto, 2020; Salath et al., 2020) to keep fighting the pandemic. In this scenario, modeling and forecast predicting the course of the pandemic play an important role by providing information for evaluating the measures taken by governments and health authorities. Parameters extracted from modeling and forecast predictions may be used to determine better strategies to mitigate the impact of infection diseases in the population (Verma et al., 2020). With this in mind, we proposed the use of the Weibull distribution to model data on daily new cases and death of COVID-19 pandemic from some selected countries. In our previous work, the Weibull distribution has been used to model forecast predictions of COVID-19 data in Brazil (Moreau, 2020). From our knowledge, that was the first time in which such approach was used with this end, and the present work is the first report of the use of the Weibull distribution to model COVID-19 data in a sistematic worldwide analysis.
Weibull distribution has been shown to fit well to a COVID-19 daily new cases and deaths single peak. Figure 1 displays the daily new cases and deaths data from the first wave of COVID-19 infections in Italy. Italy was chosen because it was one of the countries that displayed a well defined single peak of new cases and deaths, probably because of strict lock downs and wide mass testing measures taken in response to the first wave of infections. This pattern allows us to use the Italy data to evaluate the application of the 4-parameter Weibull distribution to fit the COVID-19 epidemic data. Similar results could be obtained when data from the first peak of dailly new cases and deaths were analyzed in other countries that displayed a clear initial single wave of infections, such as Belgium, Canada, China, France, Germany, Netherlands, Portugal, Spain, Switzerland and United Kingdom (data not shown).
Figure 2 shows examples of five distinct customized ways to model the daily new cases and deaths for COVID-19, depending on the pattern of the countries epidemic curve. It was possible to model the data by performing non-linear curve fitting with in a single unimodal Weibull distribution (Eq. (1)), within a single bimodal distributions (Eq. (2)) or within two Weibull distribution. Two distributions can be applied to the modeling calculation by splitting the data in a given date. Actually, the split date may be set to a day in the deepest valley between the end of one epidemic wave and the beginning of another wave. Figure 2 brings examples of the customized analysis in which the fitting parameters were set to reach better fit results. Data from Belgium, Canada and Germany (upper panels), were modeled within two unimodal Weibull distribution and split point at August, 1
Data analysis of the results presented did not allow us to determine correlations between the goodness of the fit and any key parameter related to the response measures from the countries governments to the COVID-19 pandemic, such as the number of deaths per million or the Oxford COVID-19 Government Response Tracker (Hale et al., 2020), for instance (data not shown), though the goodness of fit might be associated to misconduct data collection and processing. Well defined peaks for daily new cases and deaths, with the clear presence of ascending and descending phases, may tend to conform better to the unimodal Weibull distribution, as shown in Fig. 1A. We speculate that fuzzy patterns for the daily new cases and deaths, presented by some countries, might be associated to misleading strategies taken by such country to fight COVID-19 pandemic, what would make the number of daily new transmissions strongly vary, due to undesired spreading of the virus through out the community. This misconducting might lead to what is called “multiple waves” of the disease. In cases in which multiples waves are present, alternative ways to perform the Weibull analysis were presented here (Fig. 2 and Table 1).
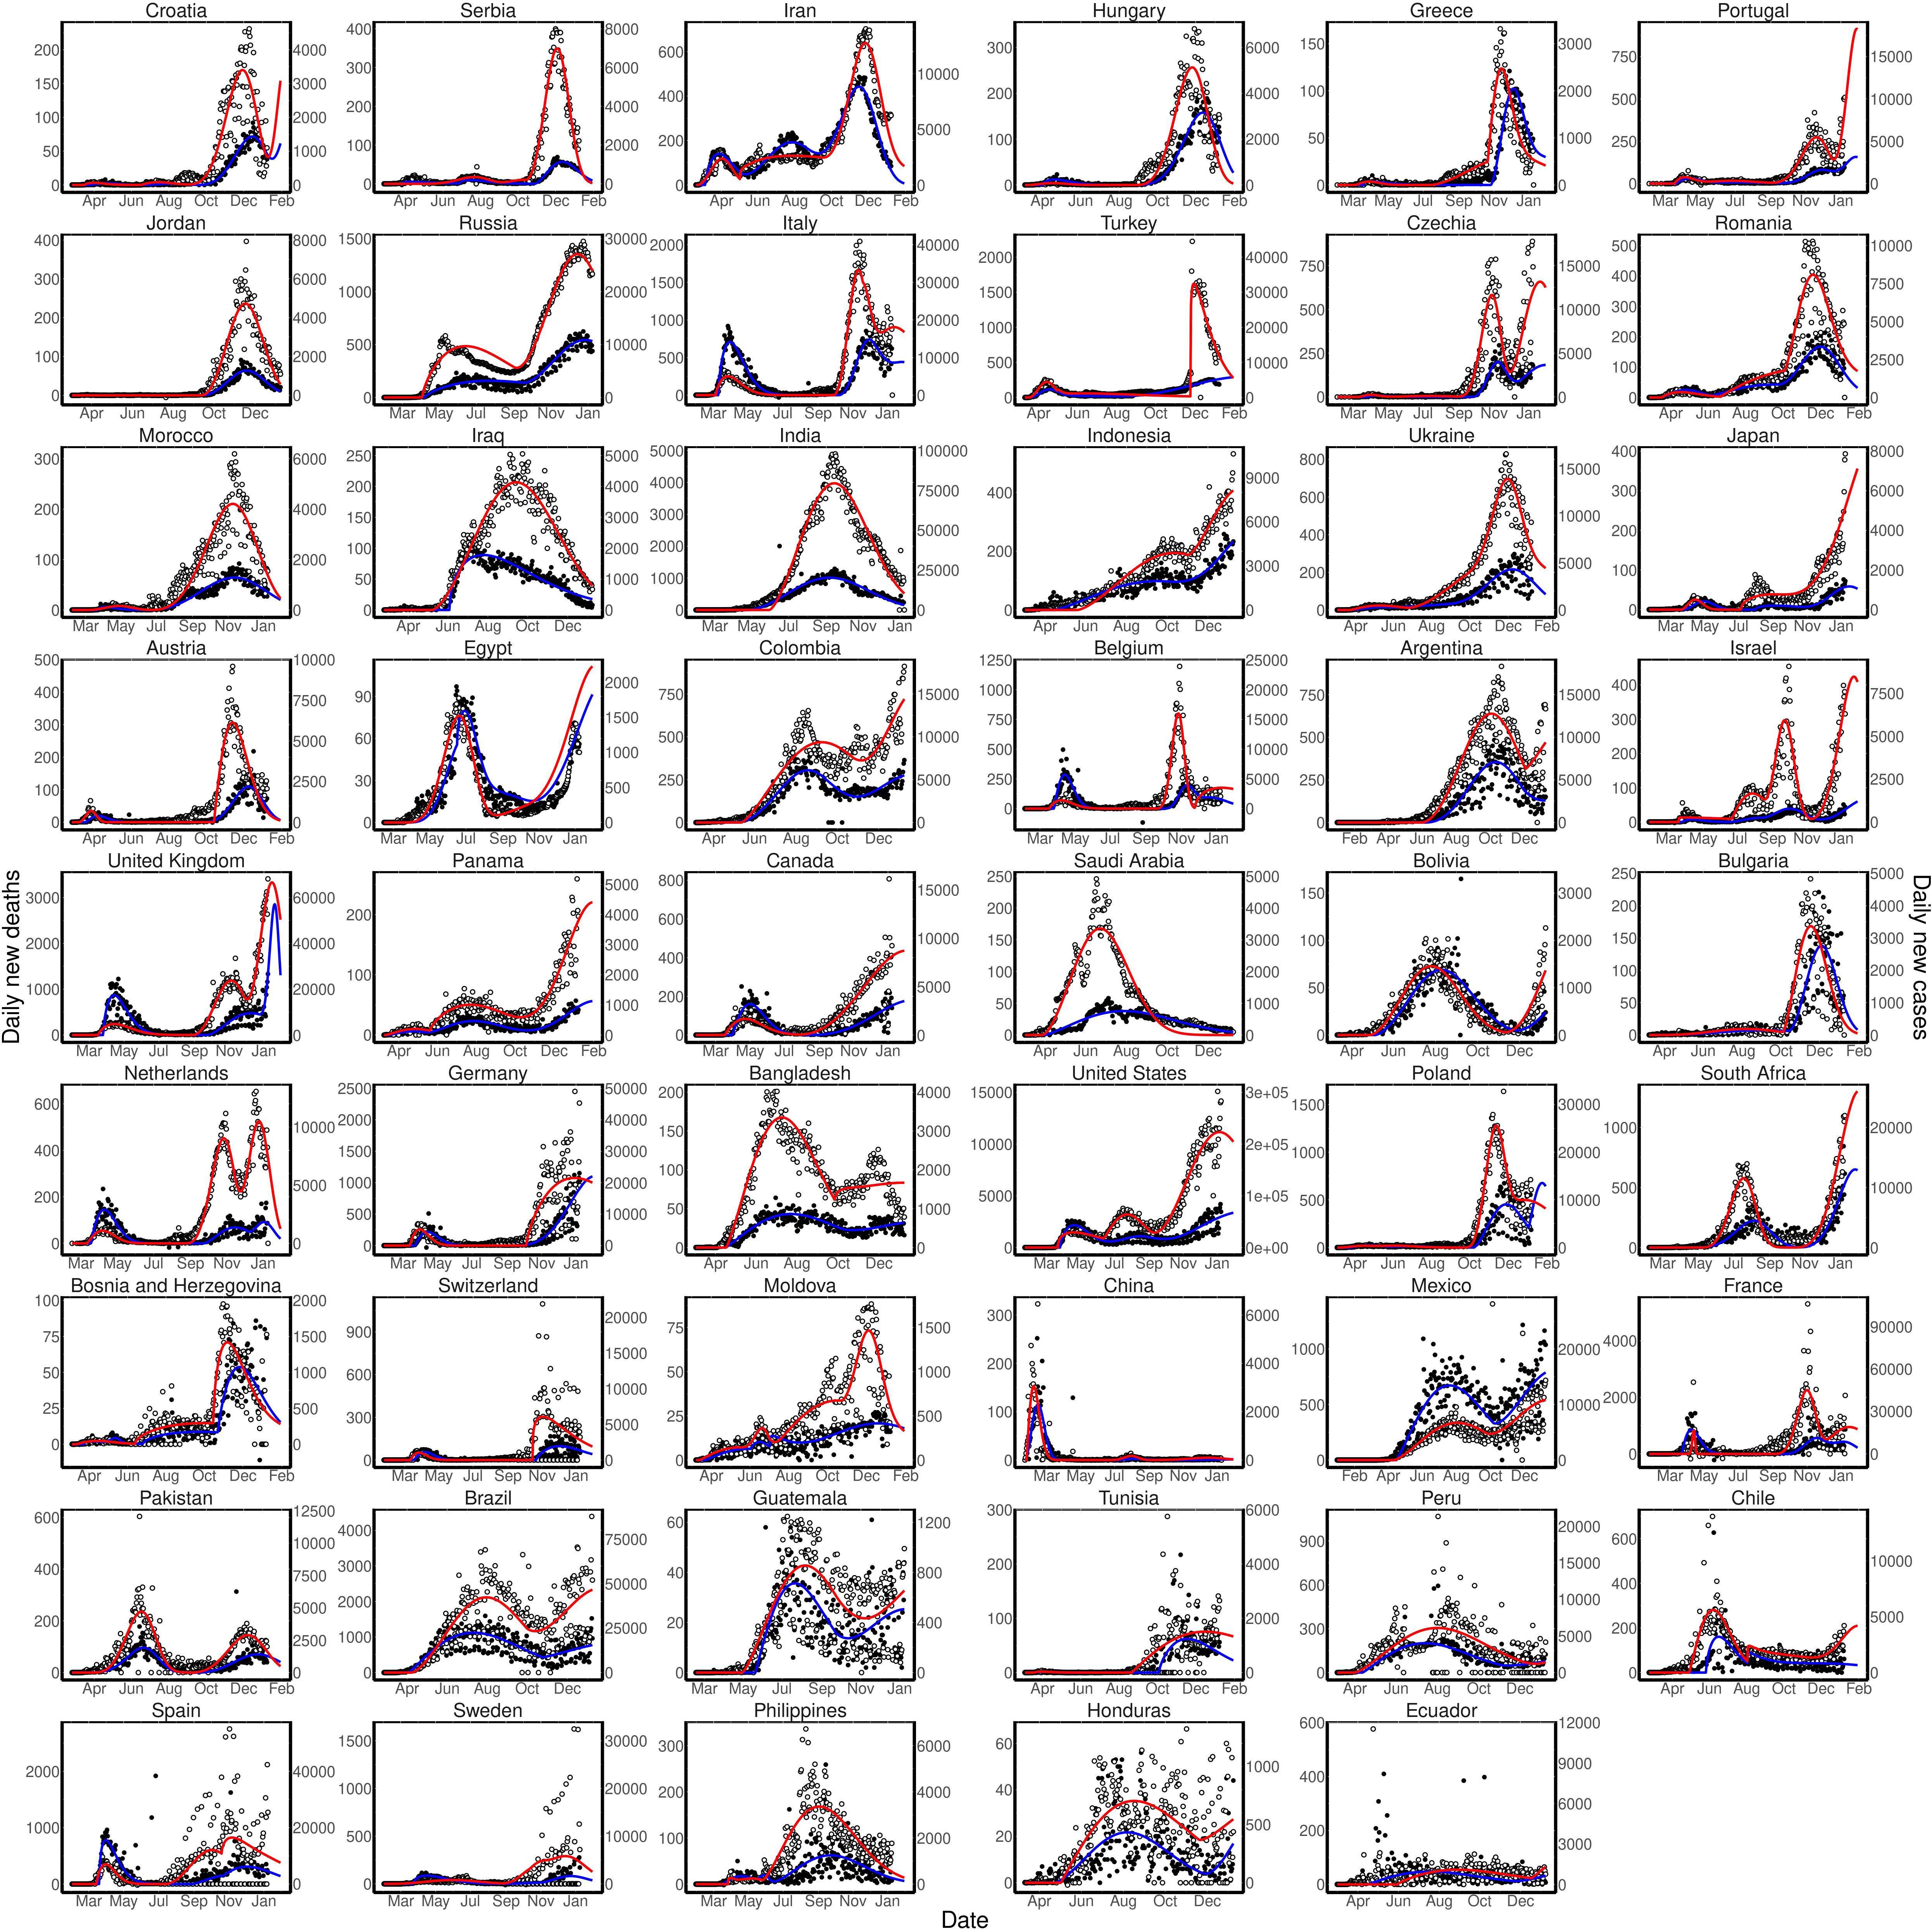
Figure S1 (Supplementary Material) shows the customized analysis, performed with a single (no split date) or two Weibull distributions for every country data that present more than 3,000 deaths up to January, 7
In a overall point of view, the 4-parameter Weibull distribution showed to be a suitable modeling distribution for the COVID-19 pandemic, when applied to daily new cases and deaths data. Figure 3 summarizes the residuals analysis of the non-linear regression of the daily new cases and deaths data from every country used in this work. Residuals from both daily new cases and deaths form narrow distributions around zero. Lines in Panels A and B represent normal distributions with the mean and SD for each respective panel data. It is worth to note that the residuals distributions are narrower than the normal distribution of residuals, with same mean and SD values. This observation denotes the presence of highly dispersed outliers in the residuals. Panels C and D display more evidently those outliers. In despite of the presence of the outliers, data both from new cases and deaths display sharp residuals distributions within the Weibull distribution fit, what reinforces the use of such method for suitably modeling, forecast predicting and parameters extracting from daily new cases and deaths data of COVID-19.
Non-linear regressions used here were performed by Metropolis-MCMC algorithm built in a R language script and coded in a R package called “weibull4”. This module may be quite useful to be applied not just to COVID-19, but to any epidemic data that displays similar spreading pattern. Weibull4 R package can be used for non-linear regression of daily new cases and deaths data using both unimodal and bimodal 4-parameters Weibull distributions (Eqs (1) and (2)), with the location parameter (
Predictions of COVID-19 epidemic evolution based on daily new cases and deaths are especially efficient, because they can be revised day-by-day, giving to governments and health authorities the opportunity of re-conducting their measures as new data arise. Additionally, 4-parameters Weibull distribution, as well as weibull4 R package, may be suitable to perform analysis on epidemic data from other diseases or, eventually, from future pandemics, since it seams to be a consensus in the scientific community that we are in imminent risk of them (Osterholm, 2005). We believe that such predictions would be useful for decision makers in order to define strategies to fight epidemic and pandemic outbreaks, nowadays and in the future.
Footnotes
Acknowledgments
The author would like to thank to Dr. Gilson Carvalho for worthful discussion and to Dr. Juliana Cortines for the critical reading of the manuscript.
Supplementary data
The supplementary files are available to download from https://dx-doi-org.web.bisu.edu.cn/10.3233/MAS-210510.
Plots of daily new cases (open circles) and deaths (closed circles) for COVID-19 in every country used in this work, calculated with customized mode. Split dates and the number of modes in the Weibull distribution used to fit the data before and after the split date are shown in Table 1. Data were fit (lines) using weibull4 R package (see Material and Methods). Charts are ordered from higher to lower Determination Coefficients (