
Abstract
“Amazon Big Data”, conducts a thorough analysis on the e-commerce industry using big data and how certain trends can affect the functioning of the organizations delving in the field. With the growth of e-commerce, there has been a significant rise of the online consumers’ footprint.
Companies such as Amazon, Flipkart and other e-commercial platforms have accrued huge chunks of consumer information, especially since the start of the pandemic. In this industry, reviews and ratings given to a product play a crucial role in determining the sentiments of the customers associated towards making the final purchase. Such factors account for the brand’s sales and image. In today’s landscape, a careful customer goes through the ratings of the product, its reviews which serve as a medium of screening. In a tie between two similar products, customers purchase a product with higher ratings and better reviews.
Therefore, this leads us to the development of an ideal rating metric that is significant for the sales of the product. Moreover, become a tool for product differentiation. This manuscript is a method to standardize the ratings of customers and preserve the sanctity of the data. We discuss models which are an amalgamation of customer ratings, their respective reviews and a sentiment scored derived from the same review. These models also help us define customer clusters with different personalities based on their reviews and ratings. In addition to this, customer segmentation is a future scope to deep dive into the sales data and understand the financial behavior of a customer.
Introduction
As per Statistica, the online e-commerce industry saw a boost of 26% in purchase of essentials due to the covid imposition. With this boost, e-commerce giants such as Amazon, have had to strengthen their business model to cater their customers. In this project, we focus on the last step of a customer’s purchase journey. This implies the post sales customer service and review analysis.
We have broken down our business problem into two parts for a holistic perspective:
Many a times, the numeric ratings of a product are not indicative of what the words say about the product. Since, the ratings serve as a gateway to help customers get a better idea of the product and its usage, the wrong ratings could end up hurting the sales of the product and ruin the customer experience. Thus, we provide a Sentiment Analysis on the text of the review and compare it with the original rating provided by the customers. There are two possible outcomes to the results we get,
An increase in the predicted ratings than the original ratings may indicate an opportunity loss for Amazon, as the product is being undersold. A decrease in the predicted ratings than the original ratings could have a negative impact on the customers with a product that does not live up to its expectations, thus negatively impacting Amazon’s customer experience. In addition to this, people have varying personalities. This implies that even though two customers may have the same experience with a product, their numeric ratings may differ due different personality traits. Thus, normalizing the ratings is significant to our analysis in order to standardize the reviews to completely capture the sentiment around the product.
To get a more realistic and real-time result, we extract live data for Amazon customer service in the form of tweets by using the Google Cloud Platform (GCP). We have also aggregated datasets in a smaller size that capture the reviews and numeric ratings of customers on the Amazon website along with product details. As a part of our analysis, we developed a pipeline on the Google Cloud Platform brought an API connection to take the analysis to python for further text analysis on the reviews. While the live dataset was being populated in the Google BigQuery table, we worked on the Amazon’s review dataset to capture the true essence of the reviews into numeric ratings. This is based on our analysis wherein we observed a discrepancy between people talking about the product negatively but end up giving a higher rating, or vice versa. In an attempt to solve the discrepancy and identify customer pain points in various categories, we developed three prediction models which captures sentiment of the user.
Using those models, we are able to predict ratings which incorporate sentiment of the user with the user’s actual rating to provide an unbiased Rating. Every customer is unique and each one can rate the same experience differently on the basis of their personality traits. These different customers were then modeled into 3 separate categories:
Stringent Reviewers Generous Reviewers Standard Reviewers
These clusters can be used as a distinction factor while measuring different KPIs for Amazon. The end purpose would be to improve the targeted marketing for consumers.
As per Wlodarczak et al. (2014) the use of opinion mining as a technique of machine learning is a method of utilizing the vast global opinions on Twitter to be able to achieve more targeted business decisions. They perform four phases as a part of their research which include data collection, data pre-processing, data mining and post-processing. They make use of an ensemble model which includes bagging, boosting and stacking. The challenge involved is application of these models requires high experience and research. A singular, simpler model which does not reduce prediction performance is more preferred. With respect to Amazon, the authors make use of web scraping to perform their POS tagging feature extraction analysis after data processing. The main drawback of this study is that it is performed on only one product and cannot be generalized to a broad variety of products. Jain, Vineet et al. (2020) propose a methodology to perform sentiment analysis on the product reviews of Amazon to capture the overall perspective of customers with respect to a product. They use the Cross Industry Standard Process for Data Mining as their methodology to conclude principal component analysis is the next step to develop a generalized model. The ongoing narrative suggested the research is in its preliminary stages. Furthermore, Ihsan Zul et al. (2018) made use of K-Means and Naïve Bayes algorithms as their fundamental models to perform sentiment analysis on social media. This study has mainly focused on comparing a variety of different models with accuracy as their metric to observe which algorithm performs the best after cleaning and processing the data from Facebook from Excel’s Power Query and Twitter API.
Research methodology
We performed a Sentiment Analysis using Sentiment Intensity Analyzer and computed the compounded scores for each review and ascertain each review as Positive and Negative Reviews. From Fig. 1, we observed a strong correlation (0.385) between the compounded scores and actual user ratings. Our objective, now, was to get the best curve/function according to the compound scores and incorporate the same to the actual user rating in order to capture the True Rating.
Sample computed score.
Rolling backward model.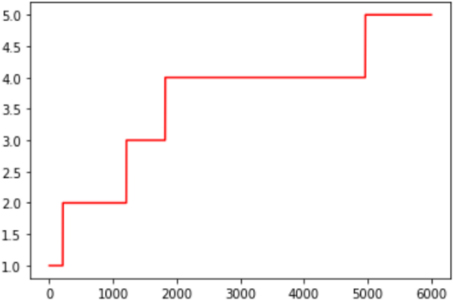
Rolling front model.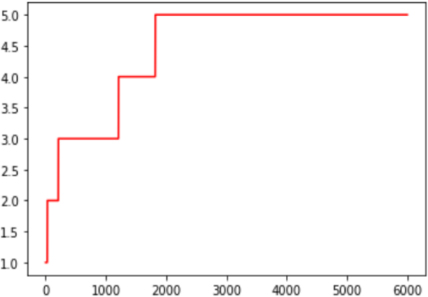
Rolling method
In this method compound scores which are scored from
def Back (x): return round (((x def standard_Back (x): if x return 1 else: return x
def Front (x): return round (((x def standard_Front (x): if x return 5 else: return x
Curve Fitting Method –
In this method, we remove the discrepancies and sort the compound scores to get a generalized graph of the population.
Avg. rating and sentiment scores.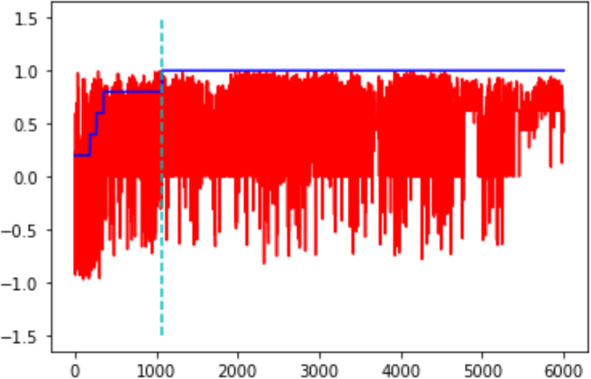
Figure 4, shows the sorted average rating and respective Sentiment Scores, we observe certain anomalies: Reviews with 5 rating have negative sentiment compound scores and Reviews with 1–2 Ratings have Positive Sentiment.
Compound scores.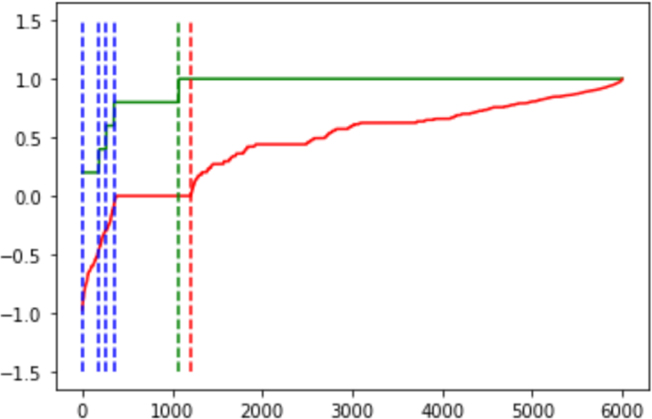
Moreover, we notice that the compound scores are more populated around the given ratings, but we observe anomalies which encircled in black (Fig. 5).
From Fig. 5, the main observation we can obtain is that the cluster of people who rate generously, have a neutral review description, give full rating to the product. In contradiction, we also observe the people who are the opposite to the abovementioned category. As people are unique and their reviews are subjective, they tend to rate the same product/service differently. Thus, the ratings need to be normalized using the sentiment of their reviews.
Choice of the best models from the proposed solutions is a difficult task. The graph generated by the compound score which shows the maximum ratings in correspondence to the actual user ratings deems appropriate. After performing a correlation analysis for the above methods, we can conclude that the Curve fitting Model has the highest correlation with the user ratings. Correlation of the Sentiment Score C (Scores of Curve Fitting Model) were better than the correlation of actual user ratings with the compound scores generated by the default Sentiment Analyzer library. Figure 6 summarizes the obtained scores for every model.
Final scores comparison.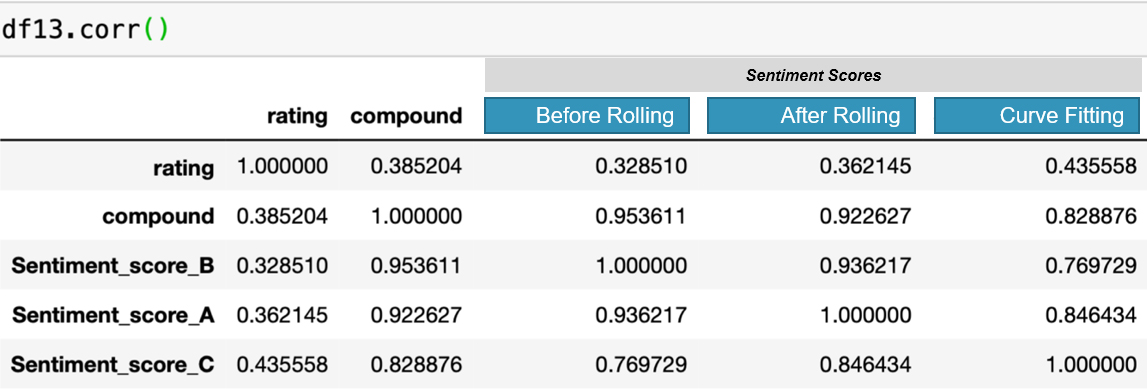
Compound scores vs user rating.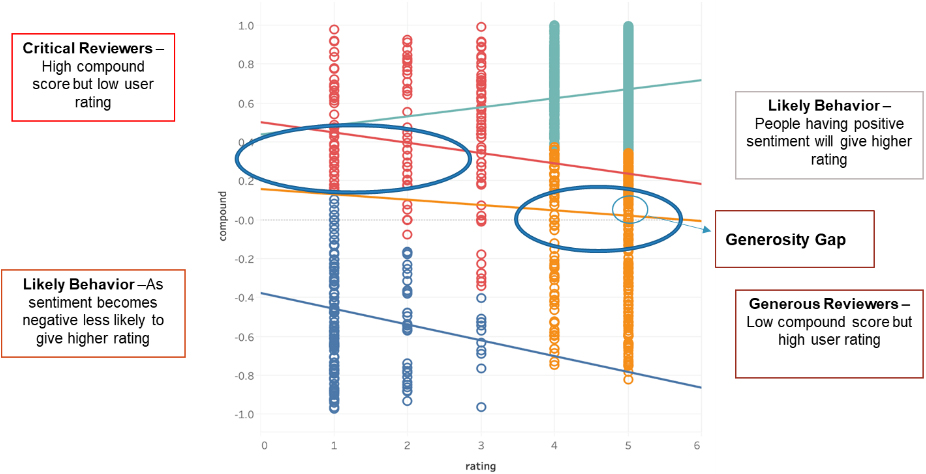
Understanding the ratings.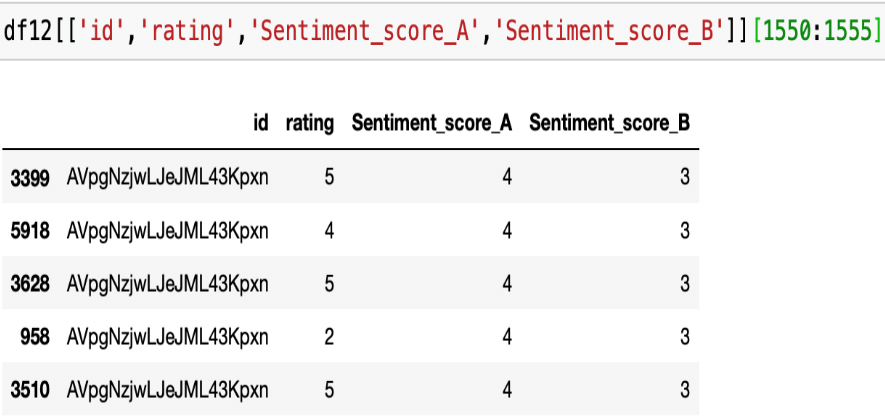
Let us plot the compound score against the ratings provided by the user. From Fig. 7, we can see 3 types of behaviors generally shown by the people. We got trend lines to understand the different kinds of cluster behaviors. Figure 8 gives us a clear understanding on how the scores can be used to classify the customer into the three different categories.
Likely Behavior –
If the description has a low compound score (Negative), the user is less likely to give higher rating (Identified from the Blue Cluster). If the description has a high compound score, then the user is more likely to give higher rating.
Generous Reviewers – Customers with a low compound score and relatively higher user rating.
Critical Reviewers – Customers with a high compound score and relatively low user rating.
The sentiments of the text reviews are used to convert them into more accurate numeric ratings using the developed model. This can be used for the purpose of targeted and more direct consumer marketing. We recognized three categories of customers:
Generous reviewers: Higher numeric rating with low positive sentiments involved.
Critical reviewers: Lower numeric rating with high positive sentiments involved.
Likely Behaviors
Since, there are a set of people who rate generously, there lies a set of people on the opposite side of this spectrum, those who rate strictly. In conclusion, to capture the exact sentiments of the customers towards the product, we can categorize customers into different categories for a variety of different goals, such as a targeted marketing campaign depending on which of the following Amazon wishes to achieve:
Higher Customer Retention Rate Increase in Frequency of Product Sales Higher brand loyalty Ratings of Sentiment Curve Fitting Model could be incorporated with User ratings to reach a True Product Rating.
Footnotes
Acknowledgments
We would like to give a heartfelt vote of thanks to our guide and mentor, Dr. Ashu Sharma. She helped us achieve a 360-degree business outlook on our project and made sure that we remain relevant to the industry. We would also like to express our appreciation to our chairperson, Prof. Binesh Nair. He guided us into a technical direction and helped us stay true to the data at hand.
We would also like to thank the Dean of SBM, Dr. Prashant Mishra, who gave us the opportunity to be a part of this curriculum’s exponential learning curve in this prestigious institution.