
Abstract
In a classification scenario, we usually come across data with and without class labels. If the class labels of individuals are unknown or masked by hidden components, the classifier rules must include the identification of the actual number of subcomponents in the data. Also, the presence of measurement errors in the data may influence the measures of the receiver operating characteristic model. In this paper, a mixture of multivariate receiver operating characteristic models is proposed to deal with multi-model patterns in the data, and a bias-corrected estimator is derived for estimating the area under the curve of the proposed model. The proposed methodology is supported by the real dataset and simulation studies.
Introduction
The receiver operating characteristic (ROC) curve is a widely used classification technique for evaluating the test’s performance and is also useful in comparing diagnostic tests by means of its area under the curve (AUC) and sensitivities. AUC is a measure of accuracy that defines how well a diagnostic test can distinguish or allocate an individual into one of the predefined classes. It takes a value between 0 and 1. However, the theoretically acceptable value of the AUC is between 0.5 and 1. A higher AUC value indicates better performance of a diagnostic test. The authors in Balaswamy and Vishnu Vardhan (2016) have provided exhaustive coverage of several bi-distributional parametric ROC models that were developed for normal and non-normal data.
The most widely used parametric ROC model is the bi-normal model, which assumes that both populations are distributed according to normal distributions. The bi-distributional ROC models that are available in the literature are mostly based on a univariate setup. In the recent past, multivariate versions of the ROC curve were also proposed under the assumption that the population follows a multivariate normal distribution (Su and Liu, 1993; Yin and Tian, 2014; Sameera et al., 2016).
The profile of patients or subjects will be derived from measurements derived from a diagnostic test or a marker in a univariate or multivariate setup. Most often, such measurements are highly susceptible to errors. These errors may arise due to the instruments used in the laboratory, the knowledge of the technicians, biological variability, temporal changes in subjects, etc. In medicine, for example, technicians will use laboratory instruments to obtain recordings of a patient’s systolic and diastolic blood pressure. Such recordings may be subject to measurement errors if the instruments or the person reporting them produce incorrect results. The presence of such measurement errors (MEs) may generate both bias and huge variability in the data, which in turn reduces the power of the study and contaminates the true information expressed by the measures of the ROC curve. In a ROC setting, the authors in Coffin and Sukhatme (1996) demonstrated that in the presence of measurement errors, the area estimates of a bi-normal ROC curve are downward. As a result, they developed a bias corrected approximation for correcting the AUC. The asymptotic distribution of these corrected estimators was given by Kim and Gleser (2000). Faraggi (2000) derived the confidence intervals and coverage probabilities for the AUC in the presence of MEs. References on defining the confidence intervals of the AUC in the presence of MEs include Reiser (2000), Schisterman et al. (2001), Tosteson et al. (2005) and Perkins et al. (2009).
The ROC models that have been discussed so far were developed with prior knowledge of the class labels. Even if class labels are known or unknown, identification of subcomponents needs to be carried out. The determination of subcomponents within the known class labels is quite essential. This is because the information will be masked if we proceed with the existing class labels. For illustration purposes, the Vertebral Column dataset is considered and the probability density function plots for each variable are drawn. This supports the claim that, after identification, the dataset has two more components within the diseased population. In total, the dataset has three components: (Healthy (
The rest of the paper is organized as follows: In Section 2, the proposed methodology is discussed in detail. The derivations pertaining to mixture ROC models and the estimation of the AUC in the presence of measurement errors are also reported in this section. Further, the proposed methodology is appended with simulated and real datasets in Section 3. The summary of the entire work is presented in Section 4.
Methodology
Mixture of Multivariate Receiver Operating Characteristic (mMROC) curve
Hypothetically overlapping probability density curves of healthy and diseased populations.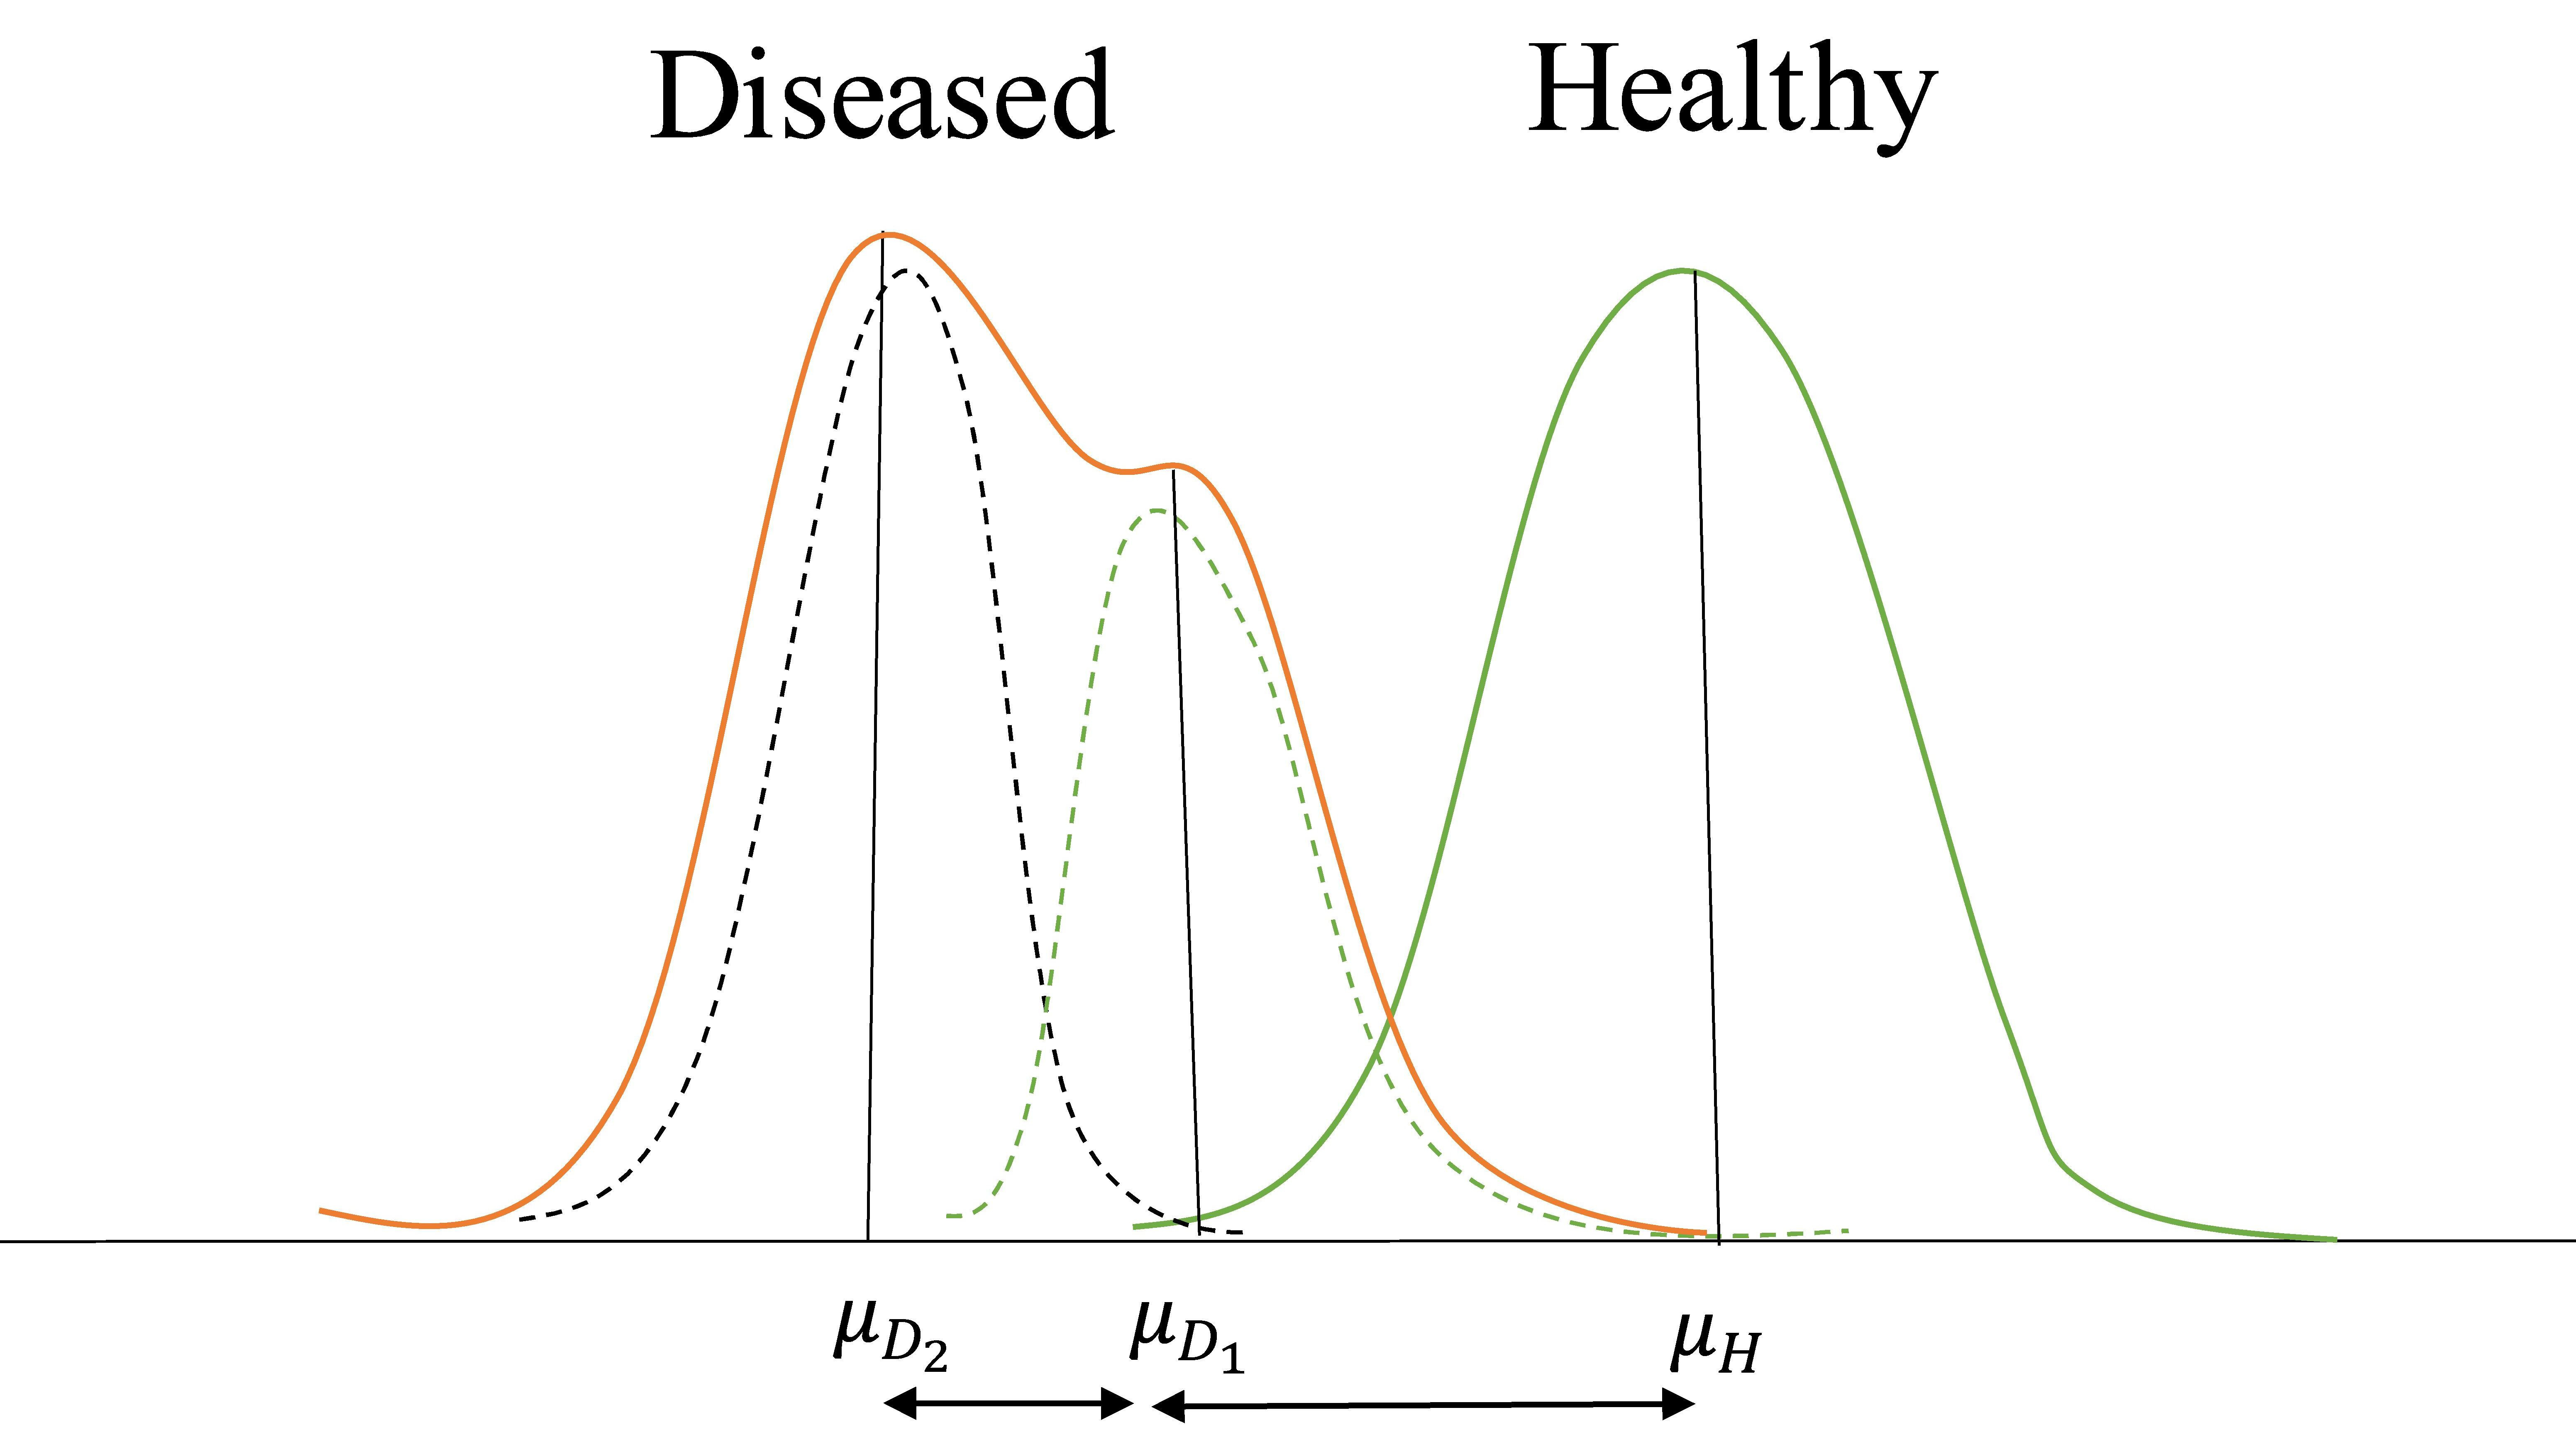
Let us assume that a total dataset has three subcomponents based on the hypothetical structures shown in Fig. 1. Let
Notationally, we can set
The expressions for FPR and TPR in the mixture form are defined as
where
By definition, we write
where
where
where
where
The expression of the mMROC in terms of AUCs is
that is
Suppose the markers are subject to measurement errors, then, instead of observing
and
where
where
where
where
Simulation study
Considered mixing proportions, mean vectors and covariance matrices for simulation studies
Considered mixing proportions, mean vectors and covariance matrices for simulation studies
In this section, we have conducted extensive simulation studies to support the proposed methodology. Using the arbitrary parametric values in Table 1, two different sets of bivariate random samples with different sample sizes (
Also, two cases of error covariance matrices are considered to generate random error observations, such as:
Case (i): the presence of measurements errors with a common error variance, i.e.,
Case (ii): the presence of measurement errors with different error variances, i.e.,
The Bias and MSE of the estimated and bias-corrected estimator of the AUC
The true ROC curve and contaminated ROC (with ME) curves at various sample sizes.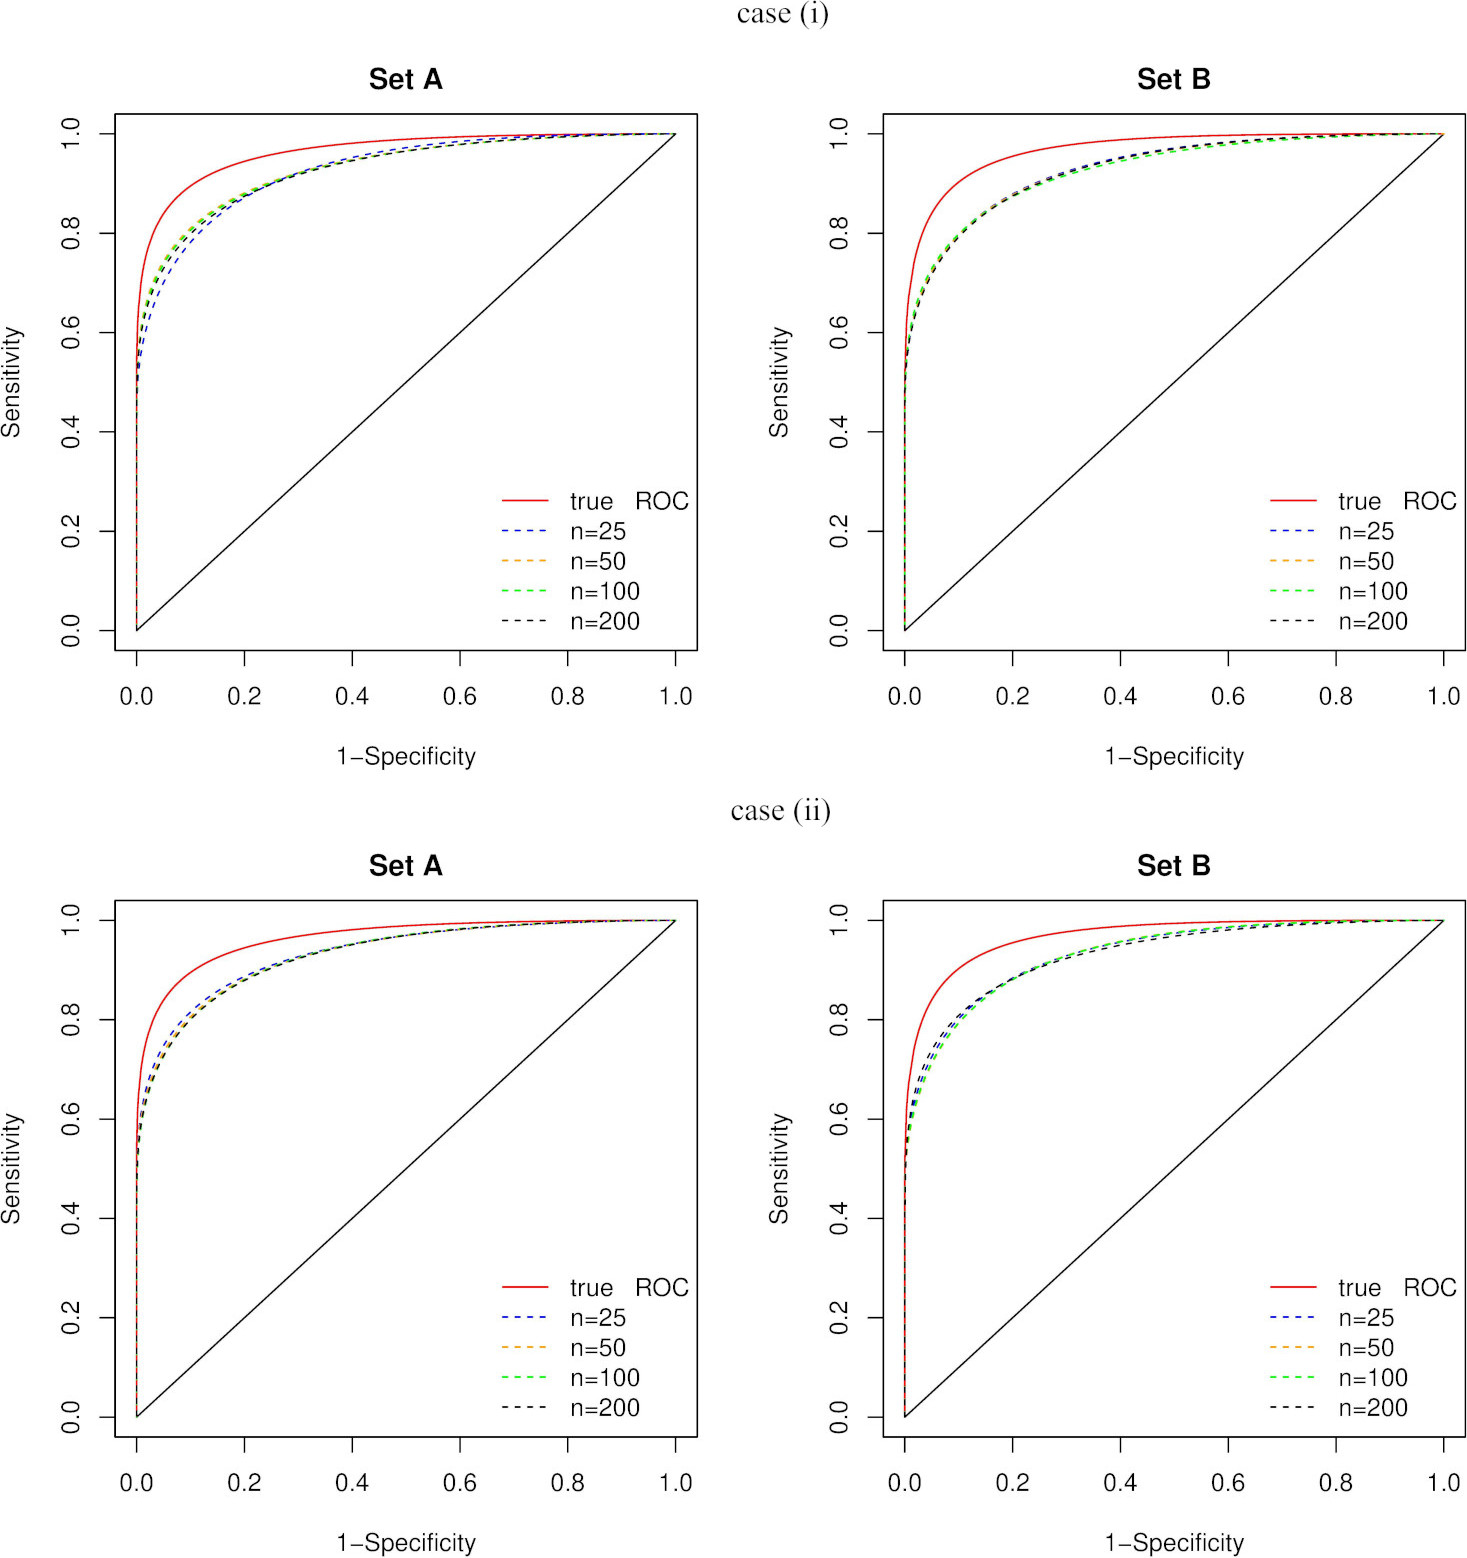
In each case, the computations (AUC’s, bias and MSE) are made and presented in Table 2.
The accuracy measures in all three cases, according to Table 2, have achieved lower values than the true AUC (
The corresponding mMROC plots are drawn and shown in Fig. 2 to support the numerical results. From this figure, we can see how the mROC curves are affected due to measurement errors.
Bias and MSE of estimated and corrected estimator of the AUC of the Vertebral Column dataset
Bias and MSE of estimated and corrected estimator of the AUC of the Vertebral Column dataset
Identified mixture probability density function plots for each variable in Vertebral Column dataset.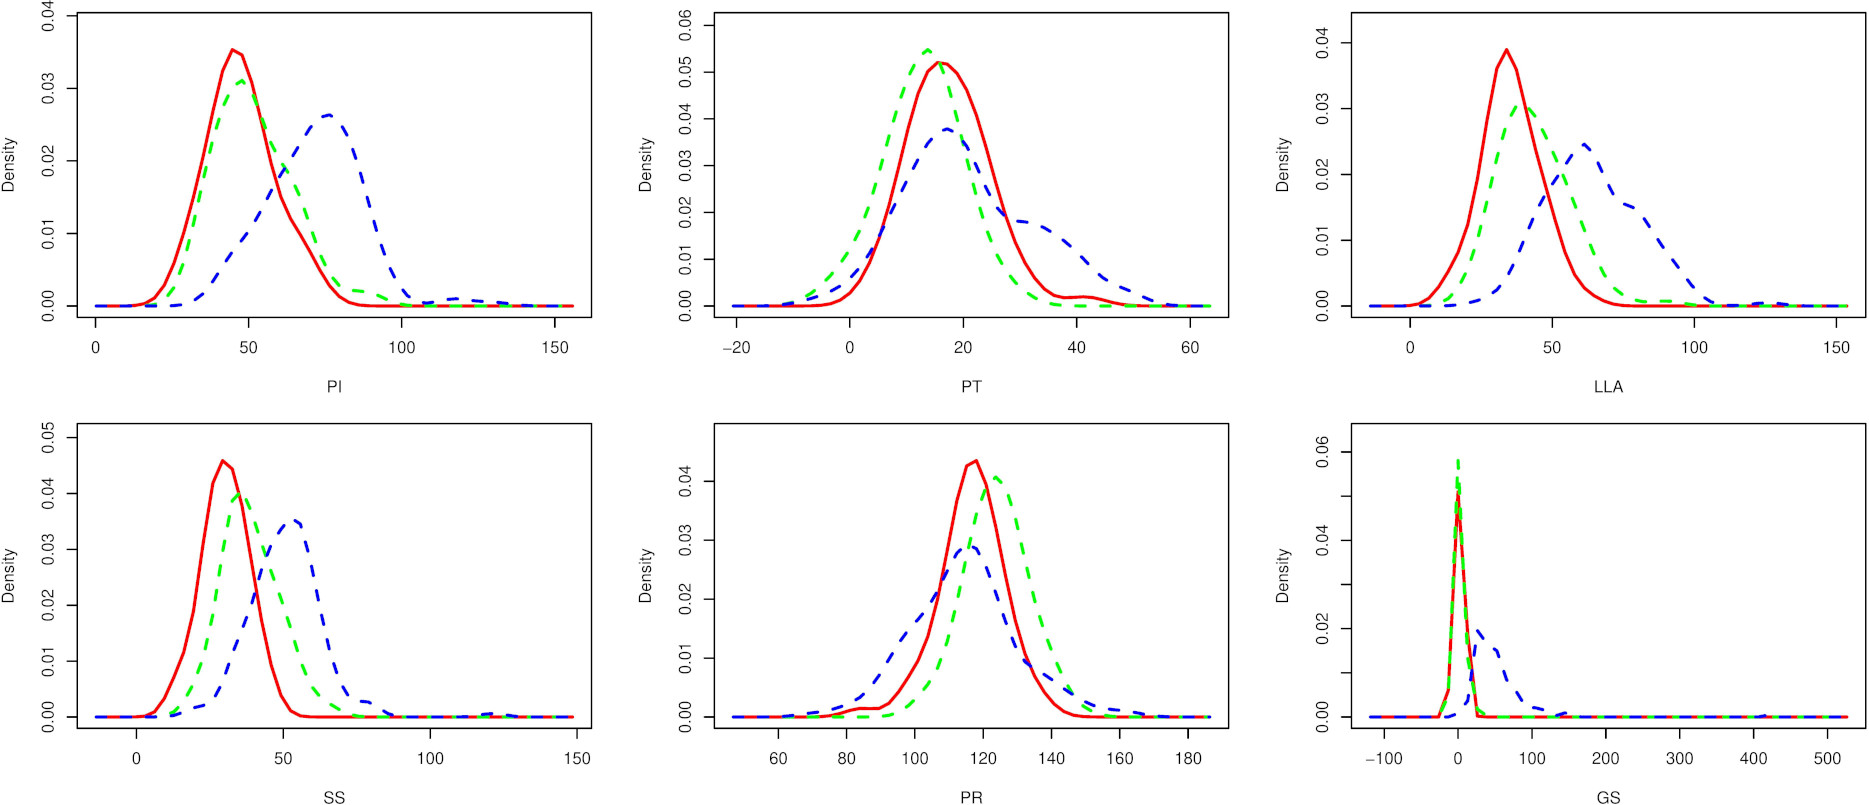
True and contaminated ROC (with ME) curves for the Vertebral Column dataset.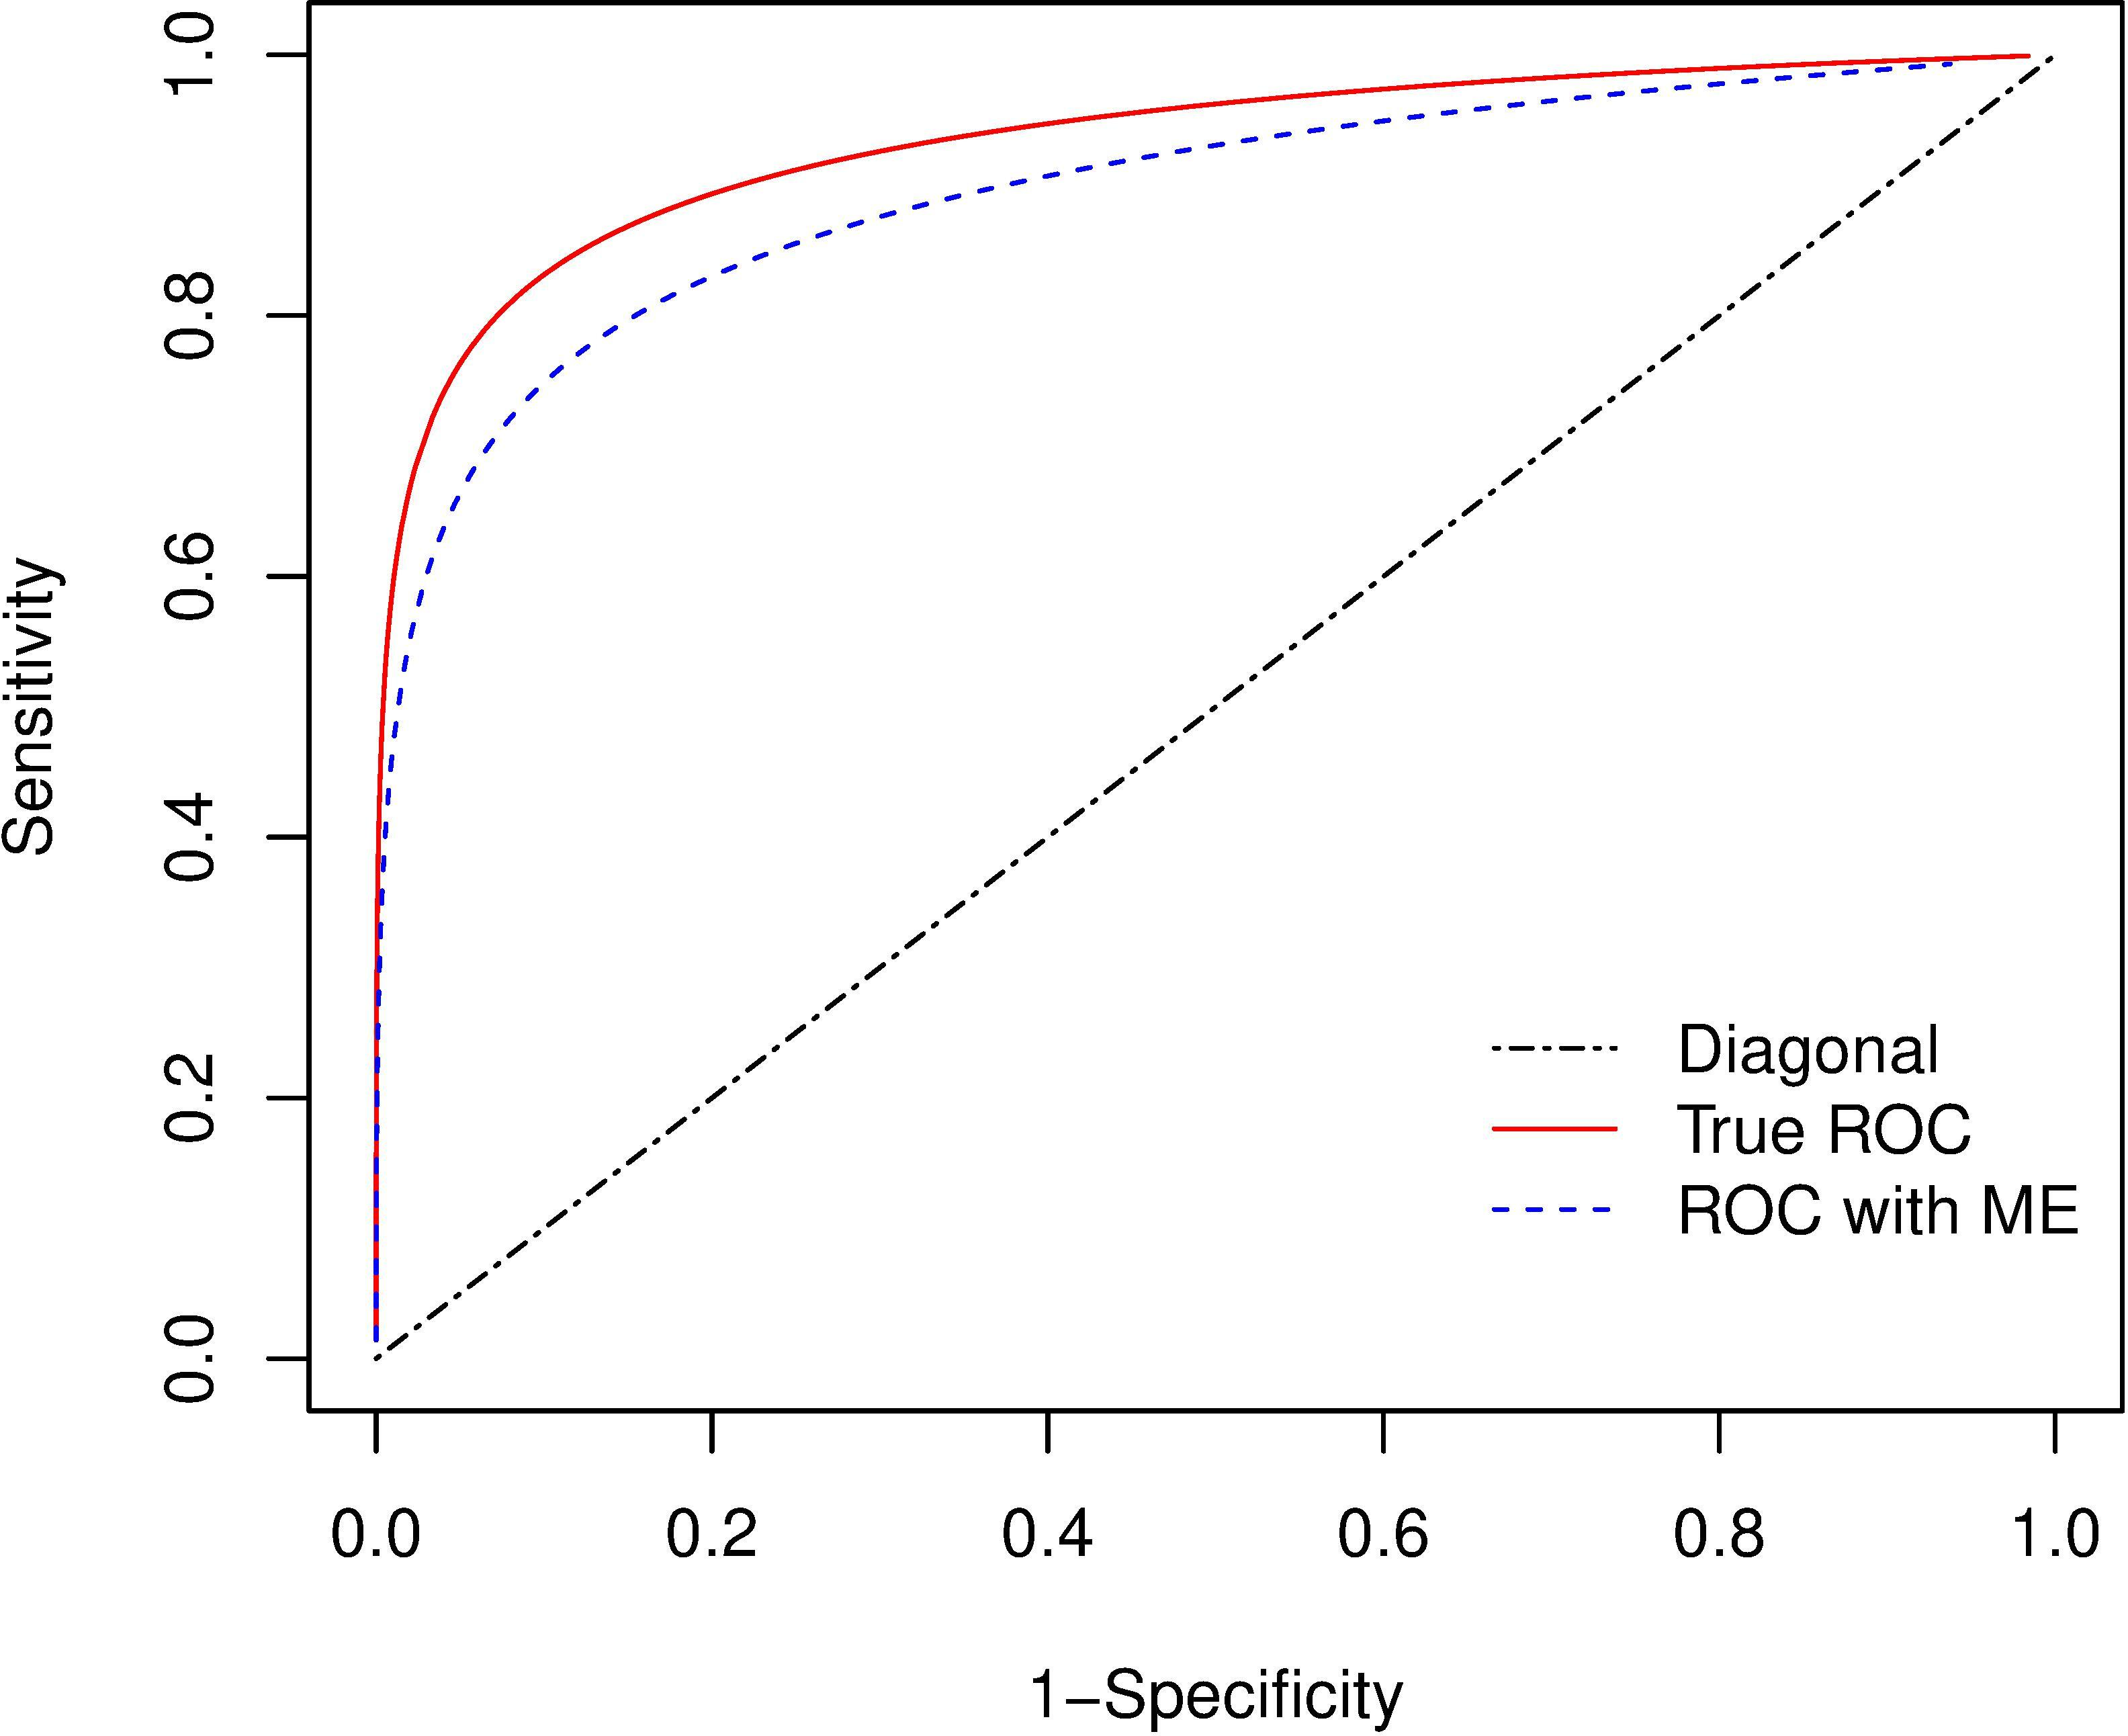
The Vertebral Column (Guilherme and Ajalmar, 2011) dataset is considered, which consists of 310 samples and 6 characteristics (pelvic incidence (PI), pelvic tilt (PT), lumbar lordosis angle (LLA), sacral slope (SS), pelvic radius (PR) and grade of spondylolisthesis (GS)) measured based on the shape and orientation of the pelvis and lumbar spine. For demonstration purposes, the known or available class labels of this dataset are ignored. Upon implementing the EM algorithm, three components are identified and matched to the classes given in the actual data. The probability density function plot exhibits a tri-model pattern (see Fig. 3).
Further, to mimic the presence of MEs the samples are generated using the error covariance matrices, as shown below.
The AUC (
From the results, the true AUC is
In this paper, we make an attempt to address the problem of constructing an ROC model when there are multiple model patterns in the known class labels. In a medical scenario, most of the datasets exhibit such multi-model patterns. In such situations, before proceeding to model the data, it is suggested to look at the hidden probability density function patterns in each class, particularly the diseased population. An illustration of this kind is demonstrated, and to model such patterns, a mixture of multivariate ROC models is proposed.
Later, discussions are presented on the impact of measurement errors in estimating the AUC of the mixture MROC curve. When the data possesses measurement errors, it is shown that the AUC will be biased downward. To address this, a bias-corrected estimator is derived, and through the simulated and real datasets, the support and usefulness of the proposed estimator are discussed in detail. The corrected AUC values are observed to have less bias and a minimum MSE.