
Abstract
Network data arises naturally in a wide variety of applications in different fields. In this article we discuss in detail the statistical modeling of financial networks. The structure of such networks red has not been studied thoroughly in the past, mainly due to limited accessible data. We explore the structure of a real trading network corresponding to transactions within the natural gas future market over a four-year period. The detection of meaningful communities of actors within networks is particularly relevant to understand the topology of a complex system like this. We explore the usage of stochastic block models in conjunction with a nonparametric Bayesian approach in order to identify clusters of traders in a flexible modeling framework. Our findings strongly indicate that the proposed models are highly reliable at detecting community structures.
Introduction
Due to recent substantial computational advances as well as vast data resources, the interest in developing methods to analyze data associated with network structures has dramatically increased in diverse research areas during the last two decades. In this regard, Newman (2003) provides a general classification for network data in four groups: Information networks, technological networks, biological networks, and social networks. A popular example of a network with information elements is the World Wide Web citations between web pages, while the Internet and telephone systems are examples of technological networks. There is a variety of biological systems that can be represented trough a network structure, such as food webs and neural networks. Finally, social networks represent relationships between individuals, also known as actors in this context. Examples of social networks include networks of friendships in a community and financial exchanges between traders.
Statistical methods for network analysis are mainly oriented to explore local and global features, in order to explain the structure of the network as well as the processes that created it. Basic analysis tools have been developed to describe properties such as centrality and connectivity of the network elements, but more sophisticated analysis allow us to estimate unobserved structural features and make inference about the network properties.
Basics
A network is defined as a collection of inter-connected entities. Such elements are typically called nodes or vertices. The underlying structure of the network is given by the so-called links or edges between pairs of vertices. Networks can be regarded as weighted networks when each edge is associated with a particular number known as weight, as opposed to binary networks, in which only the presence or absence of an edge between vertices is relevant. For example, weights might represent costs of transactions between companies, distances between locations, or the strength of the relationship between individuals.
An edge between a pair of vertices can be directed, meaning that knowing which element initiated the connection is relevant for the structure of the network. In this case, the network is said to be a directed network, and it is called undirected network otherwise. A classical example of a directed network is the network of citations between academic papers, where there is an intrinsic edge directionality due to the chronological nature of the system. Examples of undirected networks include the network of sexual contacts within a community and the network of diplomatic exchange between countries.
For the analysis of networks, the associated graph is commonly represented using an adjacency matrix, also known as sociomatrix. In the case of a binary networks with
Descriptive methods
The properties of a networks and its elements are useful to explore the overall structure of the entire system. Some characteristics and measures of interest are the following:
where
where a triangle is a set of three vertices connected to each other by three edges, and a connected triple is a sub-graph of three vertices connected by two edges.
Other relevant properties of a network are resilience, community structure, and mixing patterns. See Kolaczyk and Csárdi (2020) for a pragmatical discussion about these and other network related topics. Centrality measures reflect the importance of a vertex in the topology of the network, which allows us to identify those vertices that by being removed cause structural changes in the full system, and therefore, affect the network resilience. In addition, it is often important to identify clusters of vertices with a large number of edges between them and a low connectivity with other vertices belonging to other groups. This behavior is commonly observed in social networks reflecting a community structure, which is natural in this type of data. More generally, it is common to observe selective linking between actors leading to mixing patterns in the network. For example, assortative mixing or homophily occurs when actors with similar attributes are more likely to relate to one another. This phenomenon of assortativity is a possible source of community structure as well as transitivity in the network. However, a network can have assortative mixing patterns and no community structure.
This project is particularly interested in methods for community detection in networks. Hierarchical clustering has been traditionally used to find communities by assigning linkage weights to pairs of vertices according to a similarity measure. In particular, two vertices can be considered similar when they are connected to the same vertices. This similarity criteria is known as structural equivalence (pattern in which nodes can be divided into groups such that members of the same group have similar patterns of relationships) and, for binary networks, it is usually measured by means of the Hamming (or edit) distance. Such structural equivalence approach for community structure identification was extended in the stochastic block modeling literature first introduced by White (1976). More measures and properties for general networks are discussed in Newman (2003) and specific analyses in social network applications are widely developed in Wasserman and Faust (1994). See also Nowicki and Snijders (2001) for foundational aspects related to specifics of the stochastic block modeling approach.
Network modeling
Descriptive analysis techniques such as the ones discussed above allow us to explore network features that can be difficult to associate with a particular global process as the complexity of the network increases. However, it is also of interest to estimate as well as make inferences about unobserved structural features of the network. Hence, statistical modeling strategies for network analysis becomes relevant.
The simplest model for networks is the class of random graphs proposed by Erdos and Rényi (1960). In this model,
where
where the approximation is obtained by assuming a constant mean degree
where
In order to tackle the transitivity issue described above and built more realistic models for social networks, Frank and Strauss (1986) proposed the introduction of Markov dependence in the context of exponential random graph models (also known as
where
Alternatively, Holland and Leinhardt (1981) proposed the class of
where the natural parameters in
with
A related approach was introduced in Hoff et al. (2002) using latent space models. Under this perspective the interaction probability among actors decreases as their latent positions become distant in the so called social space. Latent positions
where
In order to address the issue of cluster identification, the notion of stochastic block models (SMBs) was first introduced in Wang and Wong (1987) for data with pres-specified groups (also known as clusters, blocks, or factions). The block modeling approach relies on the concept of structural equivalence to create a partition of similar subjects allowing the modeler to learn about the community structure of the network. Structural equivalence implies that the probability distribution of links with other subjects is approximately the same for vertices in the same group, in a way that the partition is induced not only by the inner relations within clusters, but also by the interactions among subjects belonging to different clusters Wasserman and Faust (1994).
Wang and Wong (1987) proposed to generalize
where
To conclude this brief review, it is important to distinguish the network modeling approaches discussed here from other areas, such as graphical models (also called Bayesian networks), in which nodes represent random variables and the goal of the model consists in inferring the structure of the graph rather than understand how the network itself arises.
Community structure is a common feature in real social networks, and the ability to find and interpret clusters can provide a powerful tool in understanding the structure of a given network. This work is mainly focused on SMBs for directed binary networks, but further extensions to undirected and weighted networks are also feasible. Thus, the entries of
where
Under the Bayesian paradigm, the cluster-specific interaction probabilities can be modeled by imposing a prior directly on
The Bayesian Information Criterion (BIC) is useful for a naive exploration of the number of groups as well as the agglomeration method detecting optimal clustering patterns. The traditional BIC cannot be computed for the model given in Eq. (3) when blocks with only zeroes or ones are observed. In that case, the maximum likelihood estimator of the probability of ties in a generic block is simply
where
is a shrinkage estimator of
Bayesian nonparametric modeling
A fully Bayesian approach for making inference using the model given in Eq. (4) requires a prior specification for both
and
Under the previous prior specification, the cluster assignments
where
where
The classical Sampson network dataset consists of the relationships among
The first panel in Fig. 1 shows the values of
Our findings show that three tight factions of monks are observed, which is reflected in the interaction probability matrix by the high values in the corresponding groups (red blocks) and low interaction probabilities between them. The identified factions are consistent with the original observations made by Sampson, in which the monks were classified in four groups: The loyal opposition consists of the novices who entered the monastery first (Bonaventure, Ambrose, Berthold, Peter, Louis), the young turks who joined later (Winfrid, Jhon, Gregory, Hugh, Boniface, Mark, Albert), the outcasts who were not accepted in the last two groups (Basil, Elias, Simplicius), and the interstitial group with monks that wavered between the two main factions (Ramuald, Victor, Amand).

Incidence matrices (first row) and posterior interaction probability matrices (second row) for the Probit and Beta-Binomial models.
In addition to the previous characterization, the generalized linear model
was fitted conditional on
Finally, we consider fully Bayesian SBMs using two slightly different approaches:
In both cases, we let
Figure 2 presents the incidence matrices (first row) and the posterior interaction probability matrices (second row) for the two proposed models. The incidence matrix represents the proportion of times in which two monks belong to the same community. These results are based on a Markov chain with 30,000 iterations after a burn-in period of 10,000 iterations. The mixing of the algorithms for these data is fast due to the strong cluster signals. As expected, the results for the two models are very similar, and consistent with the initial analysis. The three initial factions are identified by the models with an additional advantage of better discrimination of the actors according to their roles into the bigger communities. For example, Amand wavered between the three factions as it is shown by the posterior interaction probabilities under the two models.
Trading networks belong to the more general category of social networks. In this type of application, the actors are traders and the edges represent transactions between a pair of traders. Trading networks in Finance are particularly interesting as the structure of a network can be affected by failure/success of traders in the market and by market changes over time. These factors are relevant to study the global resiliency and the evolution of the network as well as to determine how traders’ relationships impact both themselves and the market.
Descriptive analysis
We used data from transactions within the natural gas futures market during the period from January 2005 to December 2008 to construct directed binary networks. The natural gas futures were traded on the New York Mercantile Exchange (NYMEX) only through the traditional open-outcry trades until September 5, 2006. After this date, a platform of electronic trading was introduced. The networks were constructed based on weekly trades. For each week in the four-year period, a link from trader A to trader B was established if there was at least one transaction during that week in which A was the seller and B was the buyer.
Summary of descriptive statistics computed over the 201 weekly networks of the natural gas market
Summary of descriptive statistics computed over the 201 weekly networks of the natural gas market
Graph of the trading network for the week starting at July 1st, 2005. The network has 263 active traders participating in a total of 6377 transactions. Red nodes represent traders with a low number of links during this week.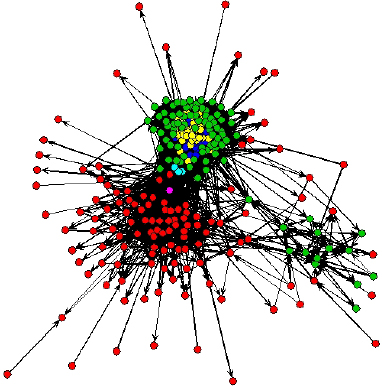
A total of 970 traders were involve in transactions during the 201 weeks with an average of 277 active traders per week. Figure 3 displays the graph of the trading network for the week starting at July 1st, 2005 showing only those traders participating in the market that week. The the arrows directionality is determined by the direction of the financial transaction such that a vertex with an out-going (in-coming) arrow is referred to as seller (buyer). The total number of weekly networks is 201.
Table 1 presents some summary statistics computed over the whole observation range (201 networks), including the number of active nodes, the mean and maximum in- and out-degree values, the degree correlation, and the clustering coefficient. The number of active nodes through the 201 weekly networks is small compared to the total number of traders involved in the market during the four-year period, producing very low mean values for both the in- and the out-degree. This feature also reflects a high presence of transient traders, which is partly a consequence of traders failure. The high positive values of the degree correlation suggest that traders tend to make buy and sell transactions with the same partners.
Time series plots for the number of active traders, clustering coefficient, mean degree, and maximum degree of the trading network. The vertical line represents the week of introduction of electronic trading, and the horizontal lines represent the median during each period.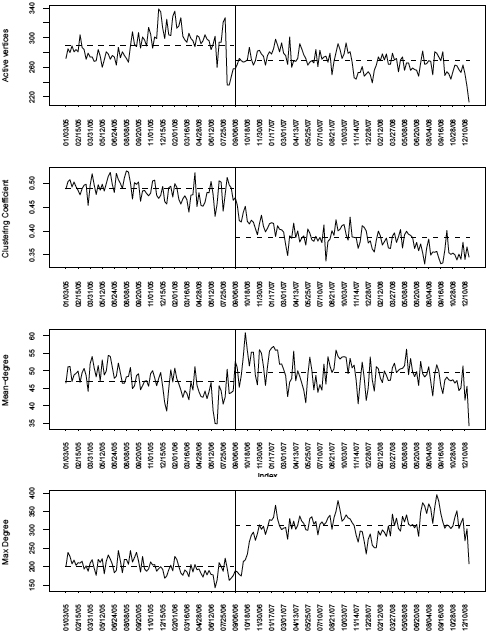
It is particularly interesting to observe the evolution of the network over time as the introduction of electronic exchange represents a drastic shift in the trading mechanism. This perturbation in the market environment puts to the test the resiliency of the network and the ability of traders to adapt and survive. Figure 4 shows time series plots for the number of active traders, the clustering coefficient, and the mean and maximum total degree (sum of in and out degrees). From this plot it is observed that the number of active traders and the clustering coefficient tend to decrease while the maximum degree increased significantly after the first week of September. Wilcoxon rank tests were performed to evaluate the differences in the median values of these metrics before and after the implementation of the hybrid trading exchange. The results show significant differences in all cases (
The dramatic increment in the maximum degree suggests the advent of central traders hoarding a big number of partners. This behavior has an expected effect on the network transitivity shown by the decrease of the clustering coefficient values. Furthermore, the role that traders play can be perturbed by changes in the market structure as it may cause prominent traders to exit the market and low profile traders to become important. Figure 5 displays the betweenness time series for six selected traders. The first four traders DOIT, GALT, JTAV and WACK played a key role in the network before the electronic trading, but their centrality drops dramatically afterwards. In contrast, the traders identified as EDFM and PIOF had a very limited number of partners during the first period but became central after the implementation of electronic exchange.
Evolution of betweenness for six selected traders with the highest values through the four-years period.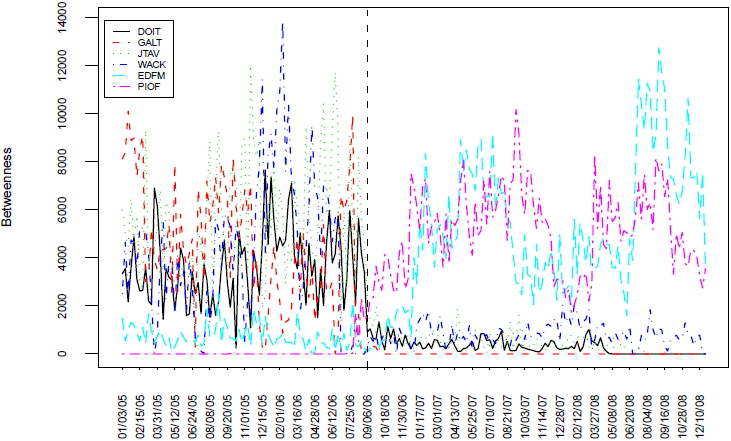
The topology of a network can be further explored through SBMs in order to identify community patterns. In this section, each week is treated independently by grouping traders being structurally equivalent. We first measure structural equivalence among subjects using the Hamming distance along with a number of different clustering methods. The number of groups and the method of agglomeration are chosen in an optimal way by using our modified version of the BIC.
In the first row, values of 
To illustrate the results, three weeks were selected according to the maximum (week 31), approximate mean (week 91) and minimum (week 179) observed values of the clustering coefficient through out the 201 weekly networks. For these selected weeks, the first row of Fig. 6 displays plots of the
The second and third row of Fig. 6 present plots of the raw data and the estimated interaction probabilities for the selected 290 traders. The raw data shows high reciprocity as expected from the high in- and out-degree correlation values in Table 1. The probability plots in Fig. 6 allow us to see how the structure of the network changes over time in terms of community structure. In week 31, most of the communities show an assortative pattern, but after the establishment of electronic trading the communities in weeks 91 and 179 are mainly disassortative.
Additionally, it is of interest to understand how stable the communities are over time. The average incidence matrix
where
Recently, the usage of a Dirichlet process (DP) as a prior specification for
Optimal number of clusters, maximum likelihood estimates of model parameters
and
, and maximum log-likelihood Lik, for DP and PDP prior models
Optimal number of clusters, maximum likelihood estimates of model parameters
The estimates for the model parameter
To complement the previous analysis, Bayesian SBMs were fitted independently to each of the three selected weeks for the reduced data with 290 traders. The results for the Probit and Beta-Binomial models using the Poisson-Dirichlet process prior for
Adjacency matrices, incidence matrices, and the posterior interaction probability matrices, under the probit and Beta-Binomial models, for 290 selected traders in weeks 31, 91, and 179 (not shown here), reordered according to the optimal clustering given by week 31 (not shown here) show how a portion of the network structure is preserved over time.
Again, these results are based on a Markov chain with 30,000 iterations after a burn-in period of 10,000 iterations. Such findings are quite consistent with the data and the block model analysis based on
Discussion
In this paper, we have provided a rigorous statistical framework using stochastic block models and Bayesian nonparametric methods to perform clustering tasks of directed binary networks. Our findings strongly indicate that our proposal is highly reliable at detecting community structures, since our experiments with real trading data produce consistent clustering patters.
Also, we strongly believe that our approach is quite beneficial because it is flexible (cluster assignments are based on nonparametric methods) as well as prolific (cluster and interaction probabilities can be easily obtained), among others (e.g., prediction). Lastly, our proposal has been formulated by means of a well-established statistical model, and therefore, it is susceptible of generalization and formal evaluation.
The MCMC algorithms showed poor mixing when applied to the trading network data. For the probit model, the method introduced in Held and Holmes (2006) was used to address mixing issues, but the improvement was not substantial compared with other conventional Gibbs sampling algorithms. This is likely due to the fact that the community indicators
Additionally, nowadays there are available more sophisticated methods to address slow convergence and mixing problems. Thus, we can go beyond the typical cluster assignments sampler considered here, in which we sample each indicator one at a time from its full conditional distribution. Some of them include DP mixture models type of algorithms (Neal, 2000), the split-merge algorithm (Jain & Neal, 2004), and the the chaperons algorithm (Betancourt et al., 2016). The main idea behind these samplers consists in generating new Markov chain states by modifying several cluster assignments simultaneously through either more plausible moves or cluster merges and splits.
Finally, reciprocity is commonly observed in directed social networks. By including this parameter, we would be able to explain tie patterns in the network. In this way, it is of interest to extend the probit model in such a way that
where
Footnotes
Statements and declarations
The authors declare that they have no known competing financial interests or personal relationships that could have appeared to influence the work reported in this article.
Appendix
MCMC algorithm: Probit model
Let us introduce a latent variables
where
However, the method described in Held and Holmes (2006) suggest to sample from the leave-one-out marginal predictive densities
where, for
The full conditional for the means are given by
for
Finally, the posterior full conditional of the faction indicator
where
and finally,
MCMC algorithm: Beta-Binomial Model
The posterior full conditional for the interaction probabilities is
where
The posterior full conditional of
Notation
The cardinality of a set
Matrices and vectors with entries consisting of subscripted variables are denoted by a boldfaced version of the letter for that variable. For example,