
Abstract
A précised and reproducible HPLC method was developed for simultaneous estimation of antidiabetic drug, pioglitazone HCl and antihypertensive losartan potassium. Diabetics are prone to hypertension hence co-administration of antihypertensive and antidiabetic drugs is most common. The method is applied for their determination in pure form, in pharmaceutical formulations and in plasma sample using a Phenomenex column (100×4.6 mm, 5 μm particle size) in an isocratic mode. The mobile phase consisted of aqueous phosphate buffer (0.05 M, pH 3.5) and acetonitrile (70:30, % v/v). The detection was carried out at 225 nm. The method was linear over the concentration range 0.5–7.0 μg/ml and 0.1–7.0 μg/ml for pioglitazone HCl and losartan potassium respectively. The analytical validation of the proposed method was carried out using ICH guidelines.
Introduction
Diabetes increases the risk for many serious health problems such as hypertension and renal diseases. Hypertension also contributes to progressive deterioration of renal function in persons with diabetic nephropathy. We can say that both of these diseases are synergistic to each other and often occur together. With the correct treatment, many people are able to prevent or delay the onset of complications. Combination therapies are commonly prescribed. Antihypertensive drugs are commonly prescribed for the treatment of patients with both diabetes and hypertension. Combination of losartan potassium and pioglitazone HCl are used for patients suffering from the diabetes mellitus which leads to end stage renal disease.
Pioglitazone HCl is (±)-5-{p-[2-(5-Ethyl-2-pyridyl)-ethoxy] benzyl}-2, 4-thiazolidinedione hydrochloride [1]. It is a thiazolidinedione oral antidiabetic that used in the management of type 2 diabetes mellitus. Different methods were reported for determination of pioglitazone HCl as chromatographic, voltammetric and spectroscopic methods. Pioglitazone-HCl has been determined by HPLC in pharmaceutical preparations [2–4] or in biological fluids [5–9]. Voltammetric [10] and spectroscopic methods [11–13] have been reported.
Losartan potassium is 2-Butyl-4-chloro-1-[p-(o-1H-tetrazol-5-ylphenyl) benzyl] imidazole-5-methanol potassium [1]. It is used in the management of hypertension, particularly in patients who develop cough with ACE inhibitors and to reduce the risk of stroke in patients with left ventricular hypertrophy, and in the treatment of diabetic nephropathy. Many analytical methods like HPLC [14–16], spectrophotometric [17–19], HPTLC [20], capillary electrophoresis [21], electrochemical [22, 23] were reported for determination of losartan potassium in alone and in combination with other antihypertensive drugs.
Combination of losartan potassium and pioglitazone HCl exert more beneficial effects for both hypertension and diabetic diseases. A literature survey regarding quantitative analysis of these drugs revealed that different methods were reported for the estimation of pioglitazone HCl and losartan potassium individually in single component or with combinations with other drugs. However no one has reported RP-HPLC method for the simultaneous estimation of the studied drugs together till dated in plasma. In this work we reported a simple, rapid and sensitive RP-HPLC method for simultaneous determination of pioglitazone HCl and losartan potassium in pure form, pharmaceutical formulations and in plasma sample.
Experimental
Instruments
The HPLC analyses were carried out on a Finnigan Surveyor PDA Plus HPLC system composed of binary pumps, autosampler and Photo diode array detector (PDA) with a Chromquest 5.0 software installed on a PC (Thermo Electron Corp., Bellefonte, PA, USA). Detection was performed at 225 nm. The ultraviolet spectra of the drugs (λ max values) were taken on a single cell holder JENWAY 6715 UV/Visible spectrophotometer. Other instruments used in the study: Jenway 3510 pH meter, UK, VELP® Scientifica RX3 vortex mixer, and Hettich Zentrifugen universal 320/320 R centrifuge, FRG.
Chemicals and reagents
Pioglitazone HCl (was obtained from Unipharma (El-Obour city, Egypt) with purity of 100.23% according to comparison methods [11]. Losartan potassium was obtained from SIGMA pharmaceutical industries) with purity of 100.32% according to comparison methods [17]. The plasma sample was obtained from a local blood bank in lithium heparin-coated plastic bags and was stored at –20 °C prior to analysis. The following routine reagents were obtained as indicated: acetonitrile and methanol (Fisher chemical® HPLC grade), orthophosphoric acid (Fisher chemical® laboratory reagent grade), potassium phosphate monobasic (Fisher Bioreagents®), potassium dihydrogen orthophosphate buffer pH 3.5 [24], and doubly-distilled deionized water.
Pharmaceutical formulations
Diabetonorm® tablets containing 45 mg pioglitazone equivalent to 49.6 mg pioglitazone HCl per tablet were obtained from October Pharma S.A.E. 6 October city, Egypt) Batch No. B00410117. Losar® tablets containing 50 mg losartan potassium per tablet were obtained from Uni Pharma Al-Obour city, Cairo, Egypt) Batch No. 0024.
Standard stock and working solutions
Stock solutions of 1 mg/mL of both pioglitazone HCl and losartan potassium were prepared in methanol. Working solutions were prepared by diluting aliquots of each stock solution to obtain a concentration of 10 μg/mL.
Chromatographic conditions
Samples were analyzed using a Phenomenex column (100×4.6 mm, 5 μm particle size). Elution pumps ran isocratic mobile phases which consisted of 0.05 M phosphate buffer (pH 3.5) and acetonitrile in the ratio of 70:30 (% v/v). The autosampler utilized acetonitrile as a rinse solution, injection volume was 20 μL and flow rate of mobile phase was 1.8 mL/min.
General procedure
Aliquots of working solutions, ranging from 0.1 to7.0 ml, containing 0.10 to 7.0 μg/ml, were pippetted into a series of 10 ml volumetric flasks and diluted to mark with methanol. 20 μl of drug solution was injected in the chromatographic system and eluted with the mobile phase under the optimum chromatographic conditions and detected at 225 nm. The standard calibration graphs were obtained by plotting peak area versus the corresponding concentration, and then the linear regression equations were derived.
Procedure for pharmaceutical preparations
Ten tablets of each formulation, one for pioglitazone HCl and the other for losartan potassium, were weighed and crushed. Accurately weighed amounts of the powder equivalent to 100 mg of each drug were dissolved in 100 ml methanol, filtered into 100 ml measuring flask then diluted further to obtain concentrations ranging from 0.5 to7.0 μg/ml pioglitazone HCl and 0.1–7.0 μg/ml of losartan potassium.
Procedure for plasma sample
This involved spiking of the binary synthetic mixture into plasma and extraction from the plasma by protein precipitation. Frozen plasma was thawed at room temperature. From standard solution of the binary mixture, 0.5 mL was pipetted out and spiked into 0.5 mL of plasma in a centrifuge tube. The tube was cyclo- mixed for 5 min Then 4.0 mL of 1:1 mixture of acetonitrile and methanol was added to the tube and centrifuged for 30 min at 5000 rpm. The supernatant liquid was filtered and 20 μl of the filtrate was injected into the column. The procedure was then completed as mentioned above under the general procedure.
Results and discussion
Conditions affecting the chromatographic performance of pioglitazone HCl and losartan potassium were carefully studied in order to recognize the most suitable chromatographic system. The choice was based on the best resolution with acceptable peak symmetry in a reasonable time.
Method development
Detection wavelength
The main advantage of the photodiode array (PDA) detection is the ability to collect multi-wavelength spectral information from one injection; the absorbance ratio at different wavelengths can be applied to confirm absence of any co-elution of different components in a signal chromatogram. Pioglitazone HCl and losartan potassium showed main absorption peaks at 225, 250 and 270 nm. Analyte peaks were monitored using the three different wavelengths; 225 nm was found to be optimum for detection at which the highest detector response was obtained.
Mobile phase
Several modifications in the mobile phase composition were performed using various combinations of acetonitrile, phosphate buffer and methanol phases in order to study the possibilities of separation and improving the performance of the chromatographic system. These modifications included the change of pH, the type and the mobile phase ratio, buffer molarity and the flow rate.
The pH of phosphate buffer was changed over the range 2.7–5 using 0.1% orthophosphoric acid. Buffer of pH 3.5 was used throughout the work giving well-resolved peaks in reasonable time separation.
Ionic strength of buffer
Studying the change of phosphate buffer molarity on the chromatographic performance was investigated using mobile phases containing concentration of 0.01–0.05 M of potassium dihydrogen orthophosphate buffer. The concentration of 0.05 M was used to be the most suitable giving good resolution and highest number of theoretical plates.
Mobile phase composition and ratio
Both methanol and acetonitrile were used as organic modifiers, different ratios of them and phosphate buffer were tried. Using methanol with acetonitrile and phosphate buffer (pH 3.5) resulted in elongation of the retention time of pioglitazone-HCl and losartan potassium without enhancing separation. Pioglitazone HCl and losartan potassium peak symmetry, retention time and number of theoretical plates were more affected by changing ratios of organic modifier. The ratio of (30:70) of acetonitrile and phosphate buffer (pH 3.5) was the most suitable as it gave reasonable number of theoretical plates and symmetrical peaks in short time about (5 minutes).
Flow rate
The effect of flow rate was studied to optimize the chromatographic efficiency and improve the resolution of the eluted peaks. The flow rate was changed over the range of 1–3 ml/min and a flow rate of 1.8 ml/min was optimum for good separation in a reasonable time. A brief summary of the optimized chromatographic conditions are presented in Table 1 for quantification of pioglitazone HCl and losartan potassium within 5 min. The chromatograms of the two drugs are shown in Fig. 1.
Analytical performance data and optimum chromatographic conditions for HPLC determination of pioglitazone HCl and losartan potassium
Analytical performance data and optimum chromatographic conditions for HPLC determination of pioglitazone HCl and losartan potassium

Representative chromatogram of a mixture of pioglitazone HCl (a) and losartan potassium (b).
Pretreatment for plasma sample including a cleanup step of protein precipitation was carried out to choose the working solvent to be used as deproteinizing agent of plasma. Acetonitrile, methanol, and ethanol were examined, of which 1:1 mixture of acetonitrile and methanol was selected as the most appropriate as it showed the maximum % recovery values. This is particularly simple, easy-handled, and allows short-time analysis without a tedious extraction procedure.
Method validation
The proposed method was further subjected to validation in accordance to ICH guidelines [25] by testing the primary parameters.
Linearity
The chromatogram peak areas were plotted against concentrations for each drug. The graphs were linear over the range of 0.5–7 μg/ml for pioglitazone HCl and 0.1–7.0 μg/ml for losartan potassium. The linear regression equations were derived using the least-squares method and statistical analysis [26]. The data shown in Table 2 provides evidence for the good linearity.
Assay results for the determination of pioglitazone HCl and losartan potassium in pure form by the proposed method
Assay results for the determination of pioglitazone HCl and losartan potassium in pure form by the proposed method
*mean of three different experiments.
ICH guidelines [25] described several approaches for determination the detection and quantitation limits including visual evaluation, signal-to noise ratio and the use of standard deviation of the response and the slope of the calibration curve. The third approach was used to evaluate the LOD and LOQ using, LOD = 3.3σ/S and LOQ = 10σ/S, where σ= the standard deviation of the intercept and S = the slope of the calibration curve of the analyte. Results are given in Table 2.
Accuracy and precision
3.2.3.1. Accuracy. To estimate the method accuracy, the proposed method results were compared with those of the comparison methods for the drugs in their pure forms. Statistical evaluation [26] of the results using student’s t-test and variance ratio F-test at 95% confidence level revealed that the calculated values did not exceed the theoretical ones. No significant difference between the performances of the two methods was found (Table 3).
Statistical analysis of results obtained by the proposed and the comparison methods
Statistical analysis of results obtained by the proposed and the comparison methods
*The corresponding theoretical values for t and F tests at p = 0.05.
3.2.3.2. Intra-day precision (repeatability). Repeatability was studied at three different concentrations (selected from the linearity ranges) of the pure form for each drug using three replicate determinations for each concentration within one day. The values of relative standard deviation were calculated, and percentages relative error (Er %) of the suggested method were also calculated (Table 4) using the following equation: Er% = [(found – added)/added]×100.
Precision data for determination of the cited drugs by the proposed method
3.2.3.3. Inter-day precision (intermediate). The intermediate precision was determined by analyzing three experimental replicates of three different concentrations selected from the linearity ranges of each drug in its pure form over period of 3days using proposed method. Relative standard deviation and percentages relative error (Er %) were calculated (Table 4). The validity, applicability of the proposed method and the reproducibility of the results are supported by the information provided in Tables 3 and 4.
The capability of the method to determine the studied drugs in their synthetic combined pharmaceutical formulations without any interference originating from sample matrix and common additives confirmed the specificity of the developed method as shown in Figs. 2 and 3.
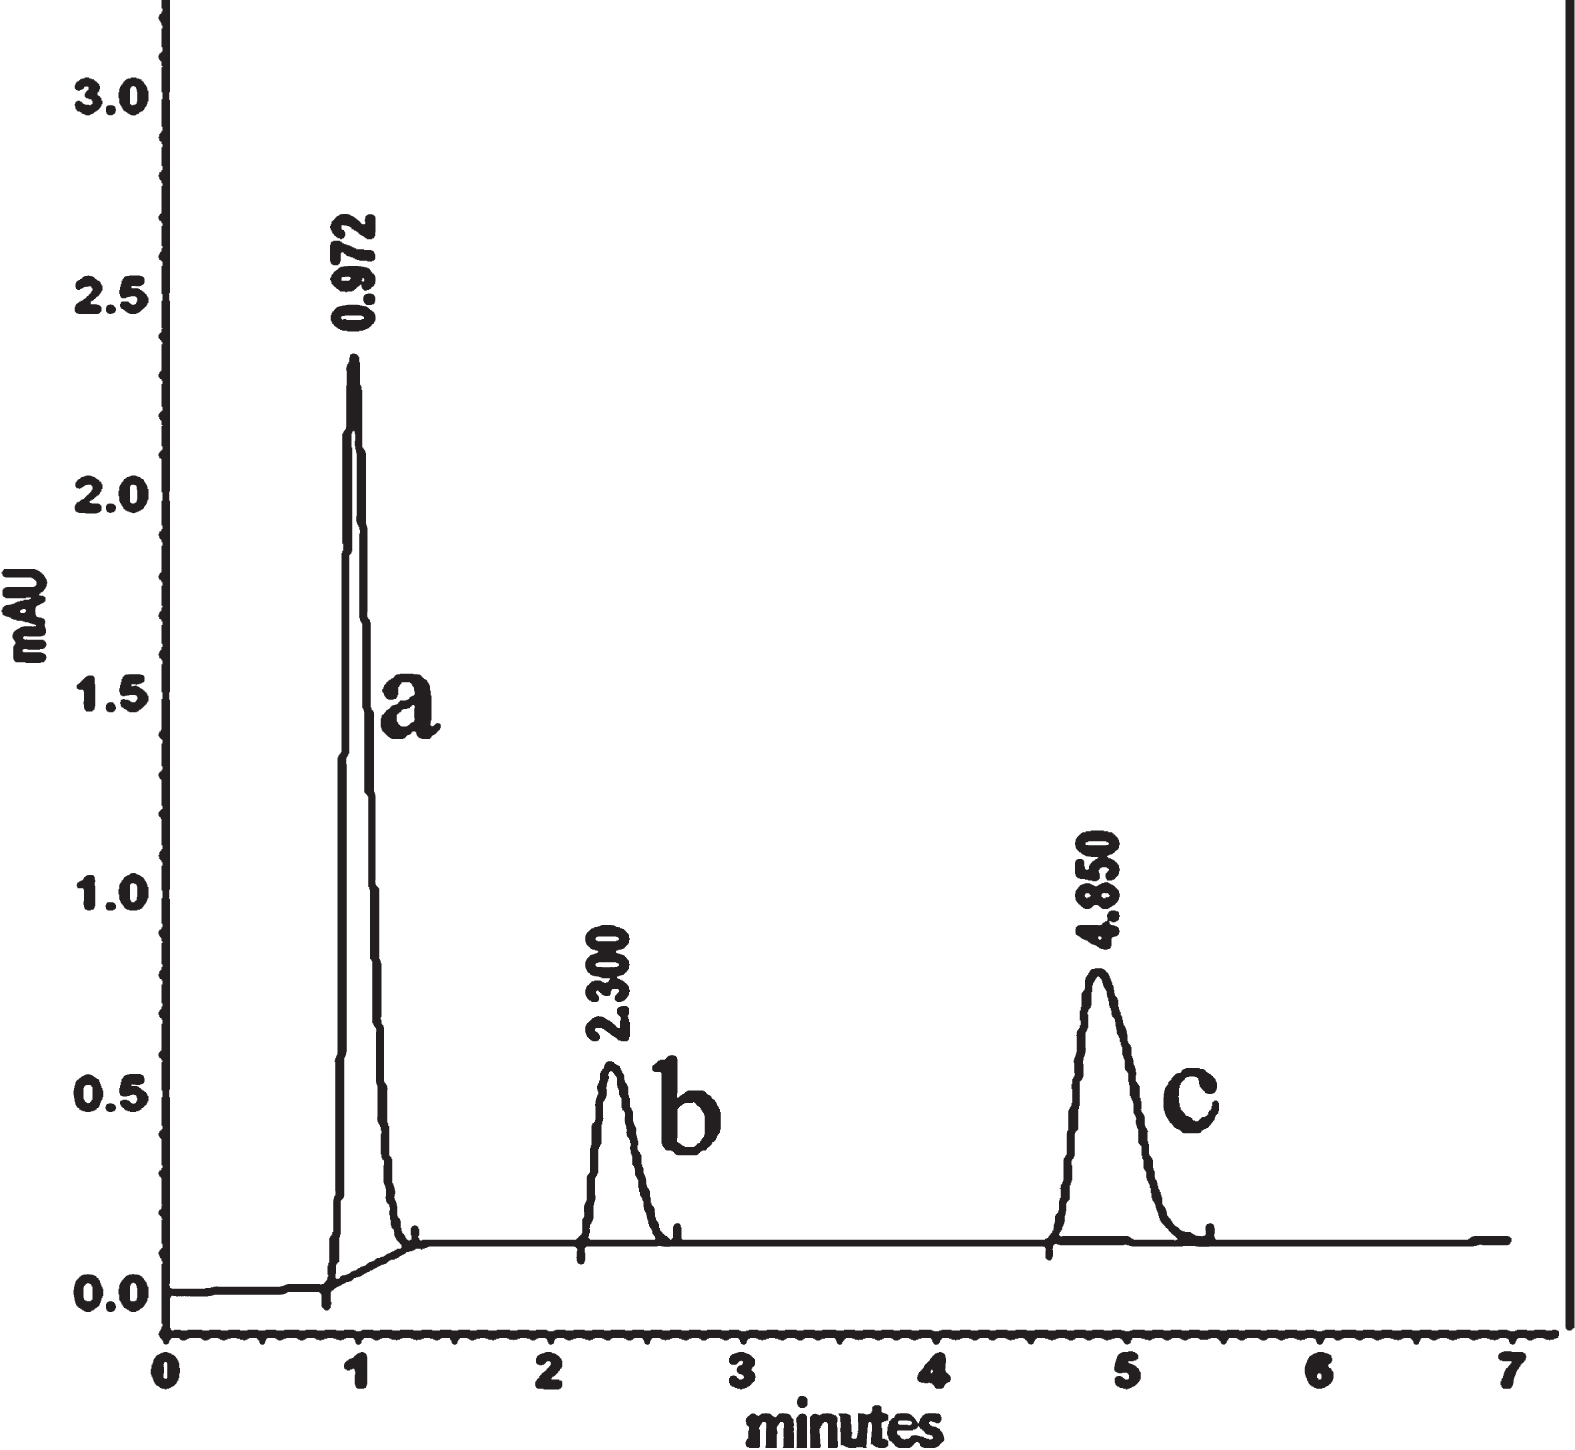
Representative chromatogram of pioglitazone HCl (b) and losartan potassium (c) in plasma (a) under the described conditions.
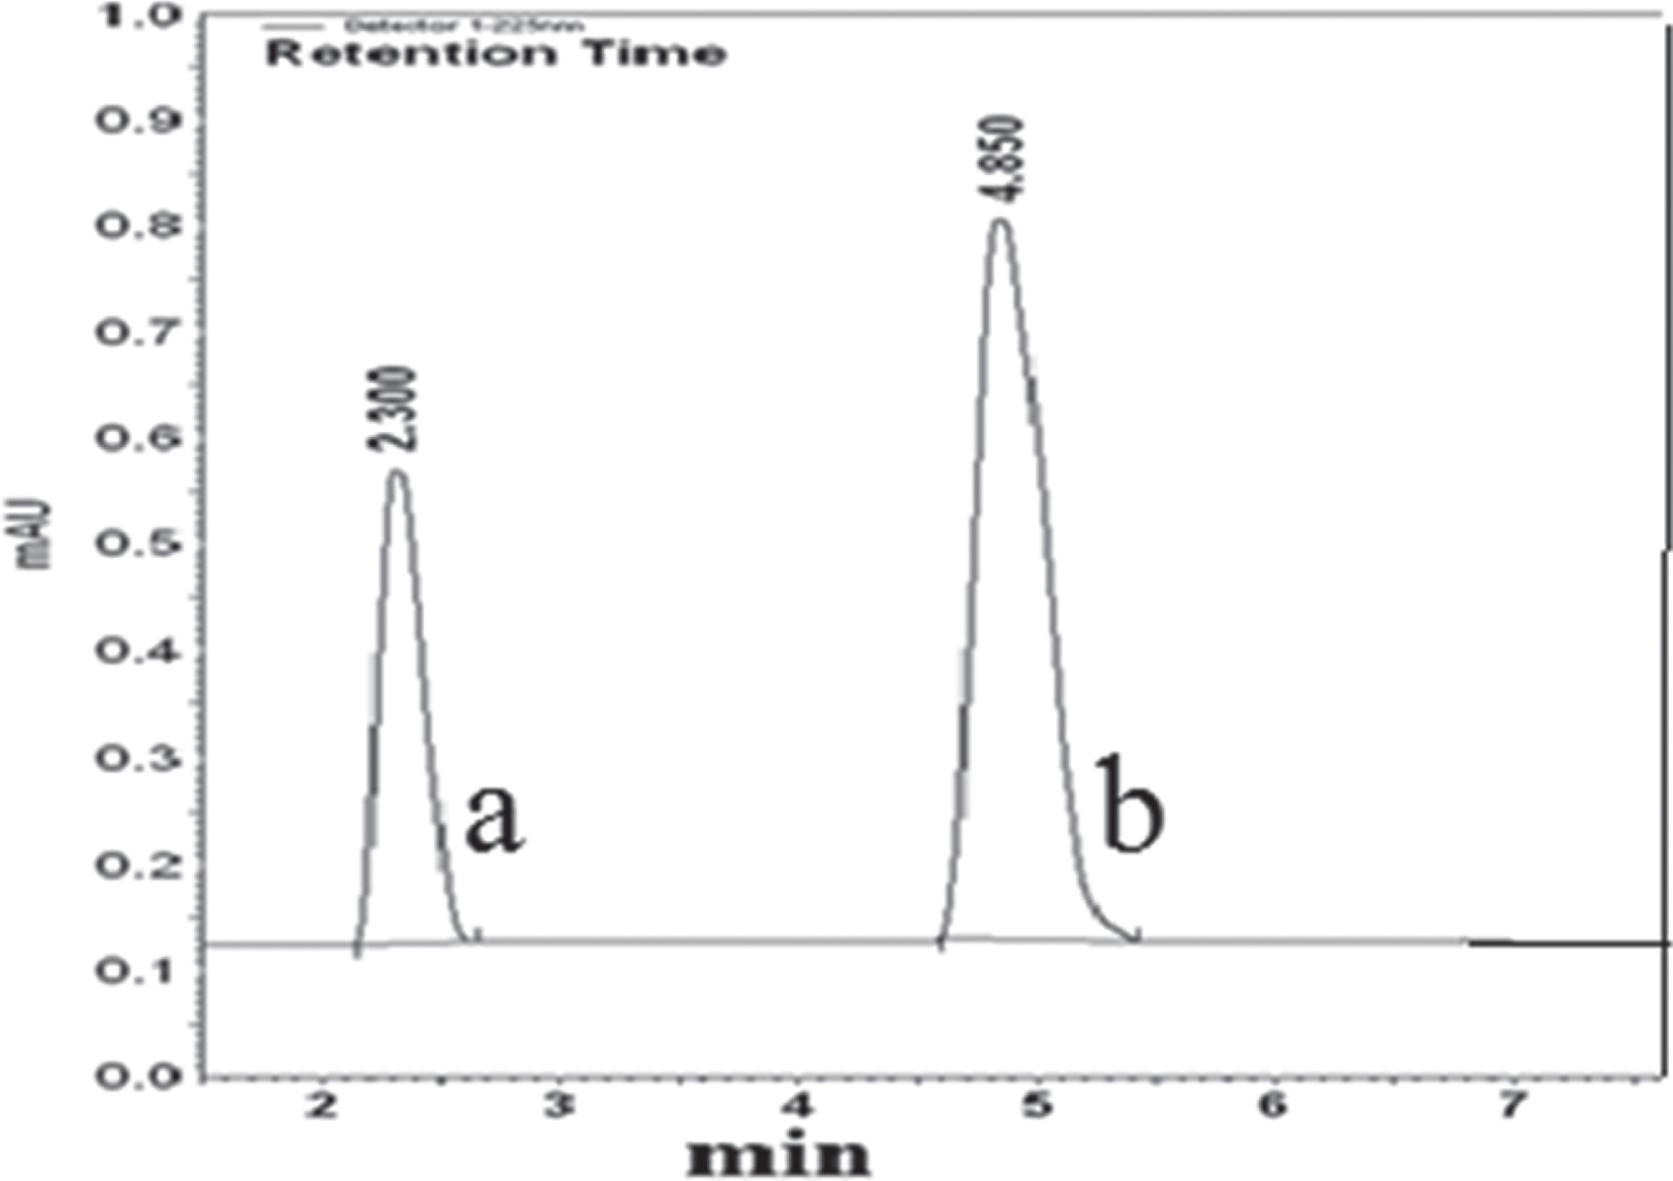
Representative chromatogram of pioglitazone HCl (a) and losartan potassium (b) in tablet dosage forms.
To test robustness of the analytical procedure, the influence of slight variations in one parameter chromatographic conditions while keeping all the others constant was evaluated. The studied variables included flow rate (1.8±0.01), injection volume (20±0.5), acetonitrile content (30±0.1) and wavelength (225±1 nm). Retention time and peak area were recorded upon these minor changes to indicate the robustness of the developed method as shown in Table 5.
Robustness of the proposed method
Robustness of the proposed method
Simultaneous determination of the cited drugs in laboratory prepared mixtures in bulk and their pharmaceutical formulations was successfully performed using the proposed method. The percentage recoveries of different concentrations of the drugs were satisfactory with the label claim proving the suitability of the developed method (Table 6). Furthermore, statistical analysis of the results of pure drugs revealed no significantly difference between proposed and comparison methods as shown in Table 3. Representative chromatogram for determination mixture of pioglitazone HCl and losartan potassium in their dosage forms was shown in Fig. 3.
Application of the proposed method for determination of the cited drugs in their pharmaceutical formulations and plasma sample
Application of the proposed method for determination of the cited drugs in their pharmaceutical formulations and plasma sample
*mean of three different experiments.
Simple validated RP-HPLC method with ultra violet detection was suitable for simultaneous determination of pioglitazone HCl and losartan potassium in a binary mixture in bulk, pharmaceutical formulations and in a plasma sample. The proposed method was rapid, where the total analytical separation occurred within about 5 min for both drugs without any interference proving its suitability for the routine analysis.
Footnotes
Acknowledgments
The authors wish to acknowledge the support of this work by Department of Analytical Chemistry, Faculty of Pharmacy, Zagazig University, Egypt. The authors also thank the above-mentioned companies for the friendly supply of analytes.