
Abstract
Mercury (Hg2+) is remarked as toxic and hazardous element to global environment. Here, carbon quantum dots (CQDs) were synthesized by simple microwave assisted technique for Hg2+ detection in water samples via. fluorescence quenching and FT-IR spectroscopic approach. The morphology and chemical structure of synthesized CQDs was investigated by TEM, FT-IR, 13C-NMR, fluorescence and UV-vis spectroscopic technique. The resultant CQDs bears spherical morphology with an average size of 2–4 nm. The binding parameters, as Stern-Volmer quenching constant (Ksv) and binding constant for CQDs-Hg system was investigated by fluorescence method, whereas UV-vis techniques was employed for determination of thermodynamic parameters, as Gibb’s free energy (ΔG), enthalpy (ΔH) and entropy (ΔS) at three different temperature (295, 298 and 305 K). Moreover, selectivity assay for Hg2+ detection has been studied in presence of other metal ions by FT-IR as well as fluorescence spectroscopy. Analytical assay was also successfully applied for Hg2+ in spiked water samples collected from different areas of Chhattisgarh, with 98–99 recovery %. The detection of Hg2+ has been demonstrated in the range of 0 to 5.0μM with 3.25 nM detection limit. The present method is found to be simple, highly sensitive and selective for sensing of Hg2+ in aquatic environmental samples using CQDs as sensing probe.
Introduction
Mercury (Hg2+) is considered as one of the most toxic heavy metal due to its bioaccumulation nature which causes serious harmful effects to human health even at very low concentration [1–3]. Hg2+ ions accumulates in human organisms, such as lungs, kidney and liver which causes acute or chronic poisoning to the organs ultimately leading to death [4, 5]. Hg2+ are generally exposed into environment from industrial and domestic wastewater [6, 7]. The contamination of drinking water by water-soluble Hg2+ ions is still the most common health hack. Therefore, accurate monitoring of Hg2+ is highly required in order to protect the human health and environment [8, 9]. Literature survey highlights that a variety of methods have been used for Hg2+ detection includes atomic adsorption spectroscopy (AAS), inductively coupled plasma mass spectrometry (ICPMS), ion selective electrode, gas chromatography (GC) and surface enhanced Raman scattering (SERS) [6–9]. They have wide detection range with high sensitivity but these methods have certain limitation such as complicated and time consuming detection process. It is well known that carbon quantum dots (CQDs) have better fluorescence, luminescence stability, high biocompatibility and low cytotoxicity, so it has been used extensively in the fields of cell imaging, targeted tracer, analytical chemistry, optical devices and drug carriers [10–14]. Recently, CQDs have been employed for the detection of heavy metal on the basis of fluorescence quenching process [15–20]. Different metal ions, such as, silver (Ag), copper (Cu), Hg, cobalt (Co), lead (Pb), iron (Fe) and other molecules like hydrogen sulfide, glutathione, curcumin, dopamine, DNA etc. and other small molecules [21–23] have also been detected using CQDs.
CQDs are preferred for the detection of heavy metals as they have several merits such as their eco-friendly nature, lower-toxicity, non-photobleaching property with better stability than other semiconductor QDs and excellent water dispersibility [11, 12]. On the other hand, carboxyl group presents on the surface of CQDs have relatively higher affinity to Hg2+ in comparison to other ions. This shows high selectivity and specificity of CQDs towards detection of Hg2+ [13–15]. Li et al. found that Hg2+ interacts with oxygen-containing group to make aggregation of CQDs, leading to radiation-free recombination of excitations, results in reducing fluorescence intensity [20]. Recently many researchers reported the fluorescent based sensor for the detection of Hg2+ in trace concentration levels using CQDs as sensing-probe [11, 17–19]. Yan et al. developed CQDs-based fluorescence off–on switching for the detection of Hg2+ and L-cysteine in water with the detection limit of 0.017 mM [24]. A photoluminiscent (PL) CQDs was synthesized using citric acid as the carbon source and diethylene-triamine as the surface passivation reagent and reported limit of detection (LOD) of 0.20 mM for Hg2+ ions [25]. CQDs synthesized from citric acid, urea and thiourea by a microwave-assisted method using plant as the carbon precursor for quantification of Hg2+ in water samples with 0.062 mM and 0.015 mM LOD, respectively [26, 27]. However, these synthetic methods involve complexity for the synthesis of CQDs as it require different temperature set up system and variety of chemical reagents even after that the developed CQDs are found to be unable to associate very low affinity towards Hg2+ detection.
Herein, we report an eco-friendly and facile microwave approach for the synthesis of CQDs and have been characterized by spectroscopic techniques, like fluorescence, UV-vis, fourier transform infra-red (FT-IR), transmission electron microscopy (TEM) and carbon nuclear magnetic resonance (13C-NMR). Further, the sensing-probe have been employed for Hg2+ detection in aqueous tap water samples. Herein, different parameters such as Stern-Volmer constant (Ksv) and binding constant (Ka) have been determined using fluorescence spectroscopic technique which is based on quenching of fluorescence (FL) intensity of CQDs by Hg2+ presumably due to complex formation and irradiative electron annihilation through an effective electron transfer process [28]. The FL quenching phenomena was then be recovered with the addition of Cysteine (Cys) which acts as strong chealator and forms Hg–S bond. It leads to removal of Hg2+ from the surface of CQDs. The detection of Hg2+ has been investigated by FT-IR technique on the basis of shifting in stretching frequency of functional groups present onto the surface of CQDs before and after addition of all the different metal ions solution. Further, the feasibility of CQDs for Hg2+ detection was investigated at three different temperatures, (295, 298 and 305 K) using UV-vis spectroscopy and it has been applied further for determination of various thermodynamic parameters such as Gibb’s free energy (ΔG), entropy (ΔS) and enthalpy (ΔH). The analytical assay demonstrates that CQDs serve as effective fluorescent sensing-probe for label-free, sensitive and selective detection of Hg2+ with lower LOD. The merit of this proposal is that the method applied for the synthesis of CQDs is eco-friendly. The extreme small size of CQDs enables to penetrate the selective membranes which simultaneously upgrade its application for further sensing of various heavy metal ions. CQDs perform these detection with high sensitivity and selectivity in biological membrane as well as environmental samples.
Experimental section
Chemicals and reagents
Glucose (purity ≥99.5%), polyethyelene glycol (PEG-200) (purity ≥99.5 %), HgCl2 (purity ≥99.5%), ZnCl2 (purity ≥99.5 %), MnCl2 (purity ≥99.5 %), CaCl2 (purity ≥99.5%), MgCl2 (purity ≥99.5 %), CdCl2 (purity ≥99.5 %), PbNO3 (purity ≥99.5 %), sodium hydrogen phosphate (Na2HPO4) (purity ≥99.5 %) and potassium di hydrogen phosphate (KH2PO4) (purity ≥99.5 %), Whattman filter paper-42, were purchased from Sigma Aldrich Pvt. Ltd. Bangalore, India and were used without further purification. All the experiments were carried out in double distilled water.
Instrumentation
UV-vis spectrophotometer
The absorption spectra were recorded at room temperature using a Cary-60 (Agilent Technologies), UV-vis spectrophotometer. The absorption spectra of CQDs as well as CQDs-Hg system were measured in the wavelength range of 200–400 nm in 0.1 M phosphate buffer (pH 7.4) used as medium. The absorbance measurements were performed by concentration based manner of Hg2+ and CQDs concentration was kept constant.
Fluorescence spectrophotometer
The fluorescence quenching mechanism were investigated on a Cary Eclipse (Agilent Technologies), Fluorescence Spectrophotometer using a quartz cell with 1.0 cm path length in a thermostatically controlled cell holder at room temperature. The fluorescence spectra CQDs recorded under the excitation of 330 nm and in the range of 300–600 nm. Both the excitation and emission slit widths were kept fixed at 5 nm.
Transmission electron microscopy
TEM image of CQDs (Fig. 2A) was measured by JEOL, JEM-2100F operated at accelerating voltage of 200 kV. For which, CQDs was mixed with alcohol and ultra-sonication procedure has been performed for obtaining the well dispersed CQDs. The solvent was evaporated under the strong and intense light. A drop of resulting aqueous suspension was kept onto the copper grid coated with a holey amorphous carbon film.
Fourier transform infrared spectroscopy
FT-IR spectra were taken by Nicolet iS10, Thermo Fisher scientific instrument, Nadison, USA, with sample prepared using KBr pellet. All the spectra were characterized by averaging 32 scan at 4 cm–1 resolution over the spectral range of 4000–500 cm–1 and aperture was fixed at 100 without ATR/DRS correction for wavelength dependence.
Nuclear Magnetic Resonance
The 13C-NMR spectroscopy measurement of CQDs were performed by Bruker NMR spectrophotometer operating at 400 MHz usingD2O (protonated signal at 4.79 ppm) as standard at 298 K. Chemical shift values for CQDs were determined in D2O solutions.
Methods
Synthesis procedure of CQDs
The CQDs have been synthesized by microwave assisted treatment of glucose with PEG-200, according to previous reported method with some modifications [29]. Herein, 1.0 g of glucose is dissolved in 10 mL of PEG-200 and total volume was made-up to 20 mL using distilled water with constant stirring. After that, the solution mixture was placed in microwave oven at the temperature of 180°C for 3 h. Meanwhile, the colour of solution mixture was changed to yellow and subsequently to dark brown which evidences the formation of CQDs. For this process, CQDs were centrifuged at 4000 rpm for 30 min and later dialyzed using dialysis membrane 500 cut-off for 48 h for removing the unfused particles. The synthesized CQDs was stored at 4°C in cold for further experiments. The whole synthesis procedure is shown in
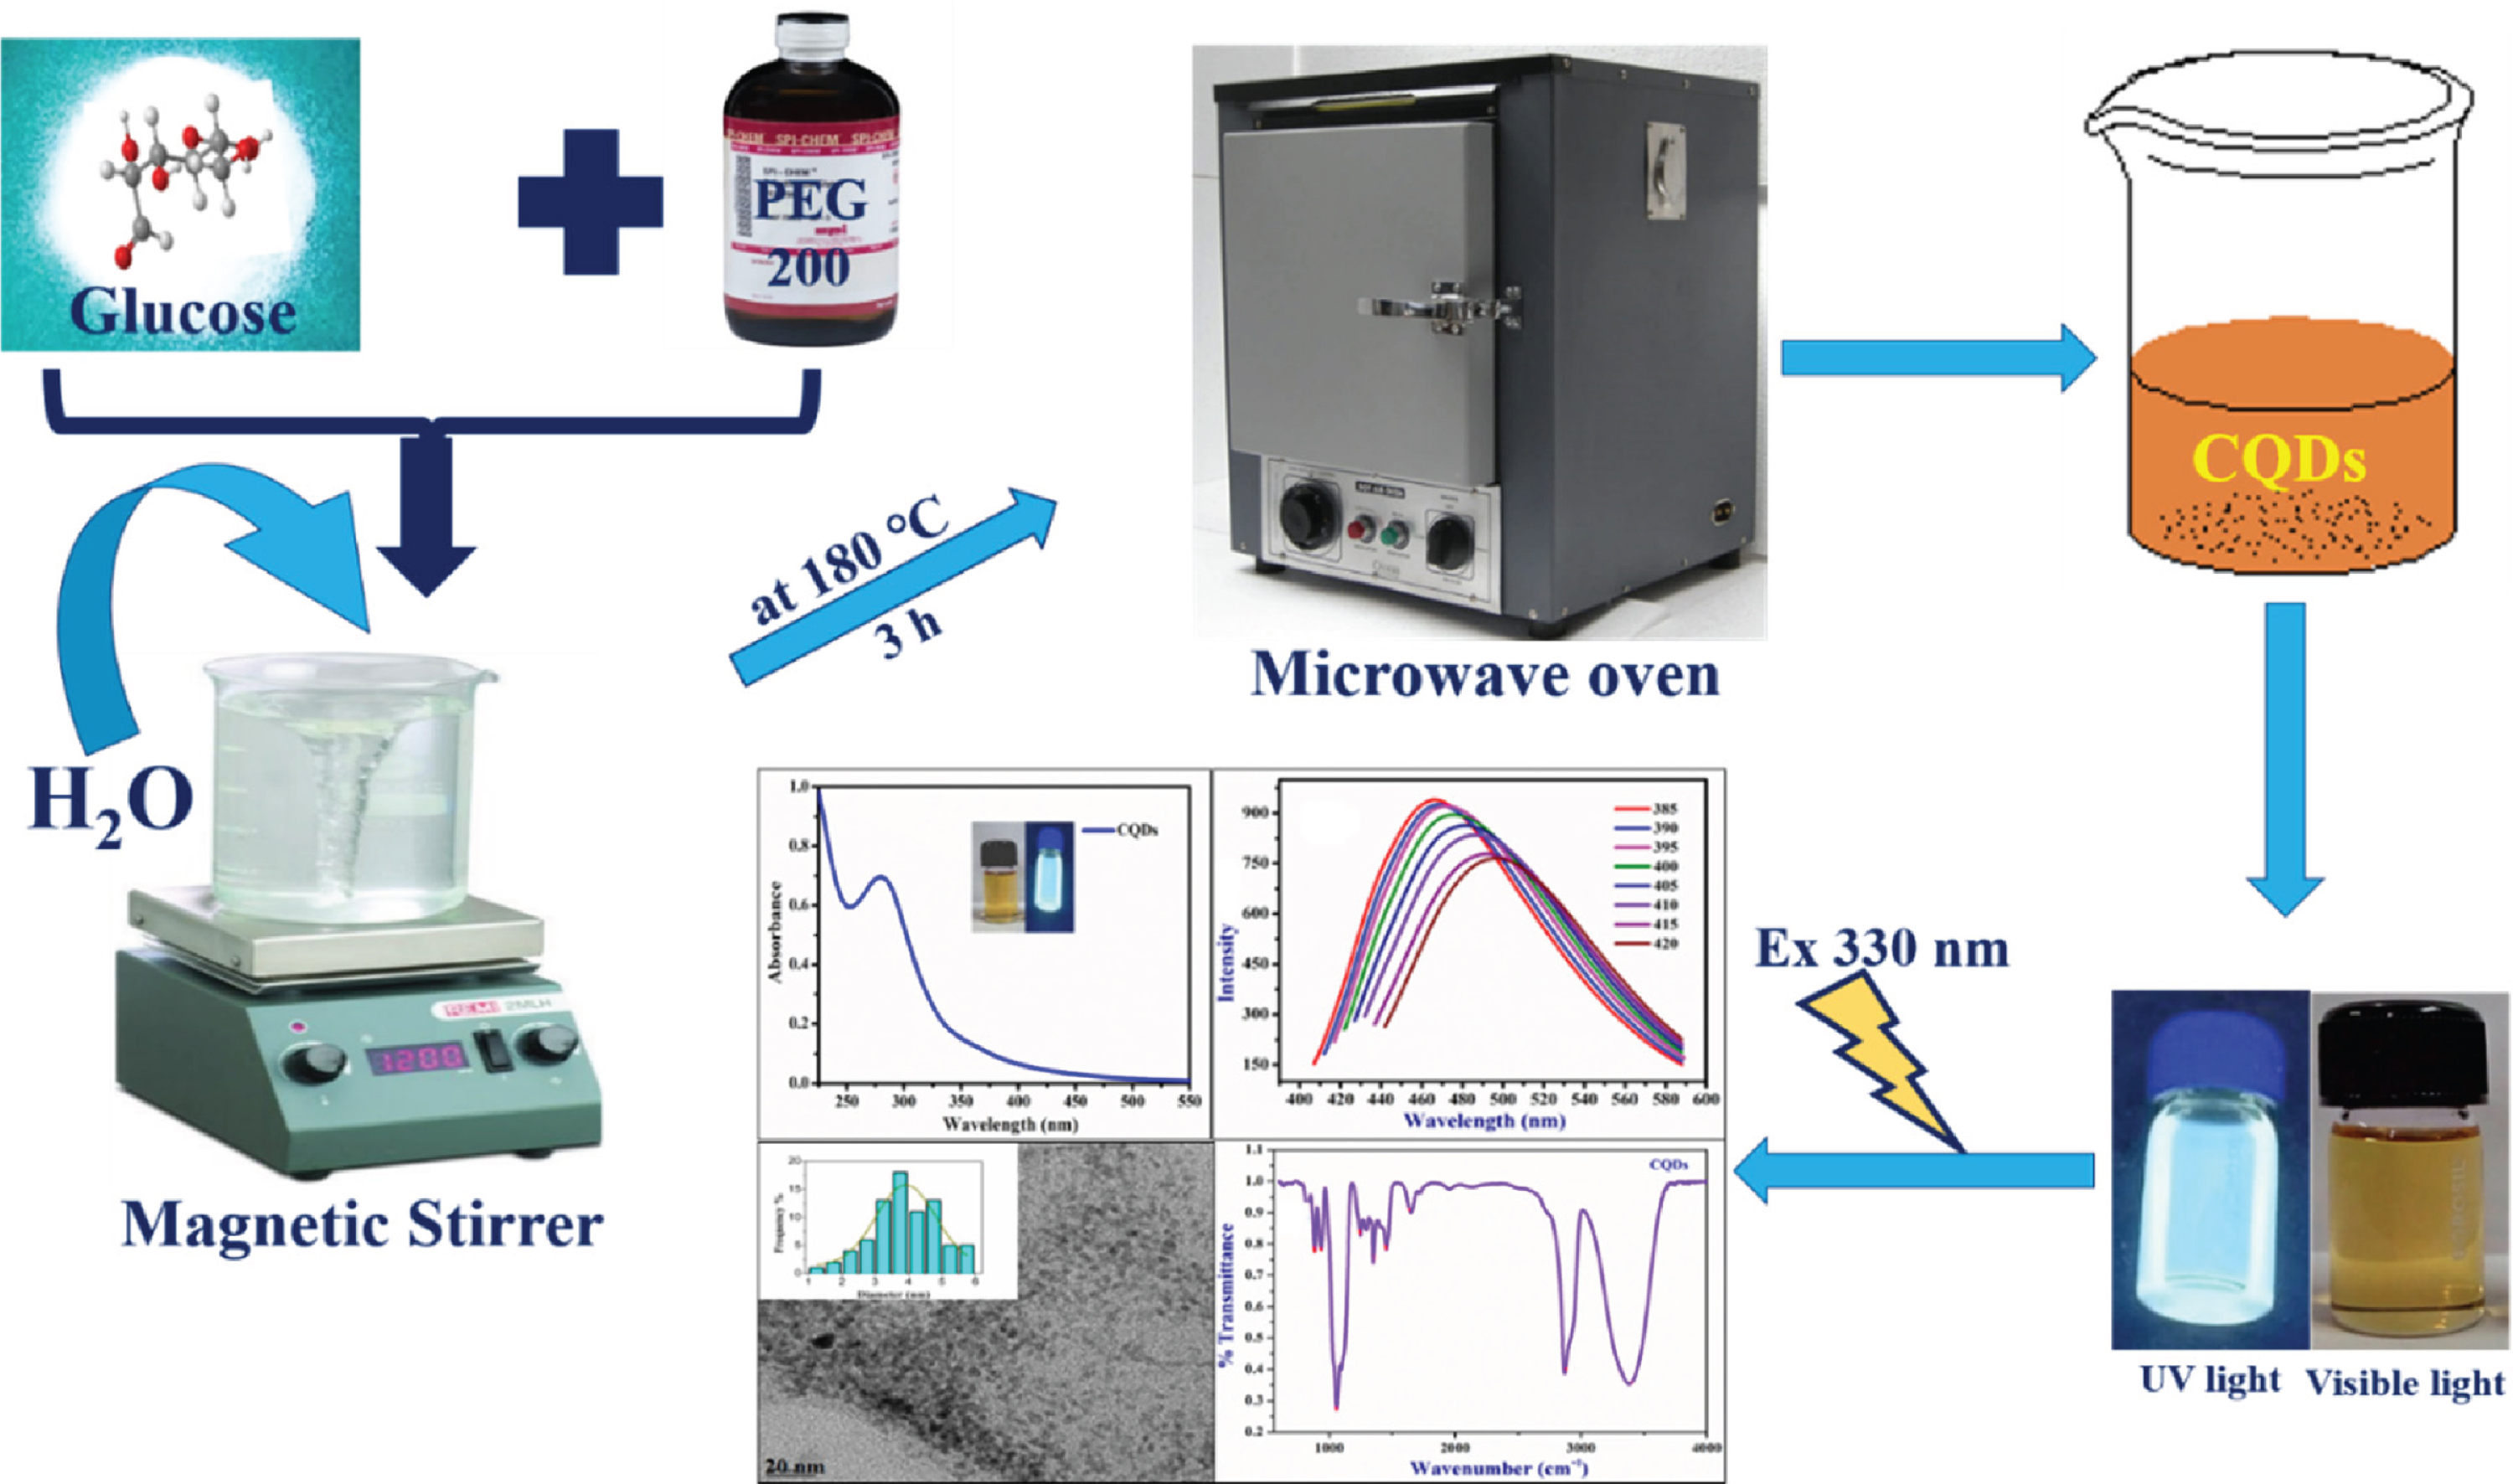
Schematic representation for synthesis and characterization of CQDs
In this assay, 0.1 mL of Hg2+ solution and 0.1 mL of CQDs (0.25 mg mL–1) make up to 3 mL phosphate buffer (pH 7.4). The stock solution of Hg has been prepared with 0.005 mM concentration as stock solution and working solution was prepared using then in the range of 0 to 5.0μM for detection of Hg2+. The fluorescence spectra was recorded at λ ex = 330 nm in a 1 cm quartz cuvette at room temperature. Slit widths for the excitation and emission were fixed at 5 nm respectively. The selectivity of CQDs for Hg2+ was evaluated in presence of other metal ions, such as Mg2+,Ca2+,Ni2+, Na+,Hg2+,Mn2+, Pb2+ and Cd2+.
Collection of water samples and their pre-treatment
The quantitative detection of Hg2+ has been performed in spiked water samples by CQDs collected from different region of Chhattisgarh, as, tap water sample 1 collected from NTPC mining area Korba, tap water sample 2 from Sirgitti, Bilaspur, tap water sample 3 from Urla, Raipur, studied under optimized condition. In this assay, standard concentration of Hg2+ were spiked in tap water sample 1, 2 and 3, in which 100μL of CQDs solution was added and the final volume was adjusted to 3.0 mL using distilled water. After 20 min of reaction time, the sensing method has been performed with spectrophotometric techniques.
Results and discussion
Characterization of CQDs
The spectroscopic characterization of synthesized CQDs was done by UV-vis, fluorescence and FT-IR spectroscopic techniques. It was observed that UV-vis absorption spectrum of CQDs shows a strong peak at 280 nm which is attributed to the π–π* transition of the C=C bonds, then n-π* transition of C=O bonds [26–29]. The photographic images with blue-green fluorescence of the dispersed CQDs under UV chamber at 365 nm has been shown in the inset of Fig. 1(A). The dispersion shows a strong photo-luminescent emission peak centred at 430 nm when excited at 330 nm, shown in Fig. 1(B). Herein, it is shown that when the excitation wavelength was increased from 385 nm to 420 nm then the fluorescent intensity also increased regularly and CQDs shows red shift persistently [30]. It is observed that the most intense excitation and emission wavelength was appeared at 385 nm and 425 nm, respectively. The excitation-dependent fluorescent behaviour was linked to the presence of different size distribution of CQDs based nanomaterials.

(A) UV-vis spectra of CQDs (inset shows the digital picture of synthesized CQDs under visible light and 365 nm of wavelength), (B) Fluorescence spectra of CQDs under different excitaion wavelength and (C) FTIR spectra of CQDs.
The surface functional groups present on CQDs were investigated by FT-IR spectroscopy shown in Fig. 1(C). In the FT-IR spectra absorption peaks appeared about 3350–3450 cm–1 were ascribed to the characteristic absorption bands of –OH stretching vibration mode of the surface of the CQDs [31]. The peaks at 1000–1100 cm–1 are assigned to the CO–O–CO anhydride stretching and absorption peaks at 1449 cm–1 attributes to the C–H bending of alkane, respectively. The characteristic stretching peak of C–O aryl ether observed at 1200–1275 cm–1 and at 2850–2900 cm–1 corresponds to C–H stretching of aldehyde and 850–950 cm–1 assigned to the strong C=C bending of alkene. The above observation confirms that the synthesized quantum dots functionalized with hydroxyl and carboxylic/carbonyl moieties originates from glucose and PEG-200. The transmittance peak appeared at 2850–2900 cm–1 corresponds to the O–H bonds of the carboxylic functional group of CQDs [32]. The FT-IR studies confirms the presence of different functional groups at surface of CQDs. Here, CQDs were found to be very stable for several months without the observation of any floating or precipitated CQDs, due to the presence of high electrostatic repulsion between them.
Transmission electron microscopy (TEM)
TEM technique was used to investigate the size of synthesized CQDs, shown in Fig. 2 (A). The result reveals that the size of CQDs was found under the range of 2–4 nm, which is quite similar to previously reported CQDs [33–35]. The CQDs are found to be mono-dispersed in nature and spherical in shape. The corresponding histogram plot was drawn which indicates that these quantum dots average size of about 2 to 4 nm.

(A) TEM images of the CQDs, inset the corresponding particle size distribution histogram and (B) 13C-NMR spectra of CQDs.
13C-NMR spectrum of CQDs is shown in Fig. 2 (B). It shows that NMR signals in the range of 50–60 ppm are associated with the aliphatic (sp3) carbon atoms and signals from 100 to 200 ppm are indicative of sp2 carbon atoms. Signals in the range of 205–220 ppm correspond to carbonyl ketone [36, 37].
Optimization of proposed method
Herein, the optimization of proposed method was done by optimizing the temperature and pH for quenching assay. The stability of CQDs was assessed at pH ranging from 3 to 11, shown in Fig. S1 (A). It was noted that the optical properties of CQDs were found to be more stable at range of 7.0–7.8 pH in comparison to others. Hence, the quenching assay was conducted at the pH 7.4 for the determination of heavy metal ions. The temperature effect on detection of Hg2+ by CQDs was investigated at the temperature of 295, 298 and 305 K by UV-vis spectroscopy method and the obtained result shows the feasibility of sensing system at standard optimized condition.
The incubation time for the assay has been optimized using fluorescence response time of the CQDs towards Hg2+ shown in Fig. S1 (B). The quenching in fluorescence intensity of CQDs against time upon the addition of Hg2+ was crucially monitored by fluorimetry. The fluorescence intensity of CQDs drops initially and at a time interval of 20 min lowest intensity was observed. After 20 min no other significant change was observed thus, 20 min was selected as the standard incubation time for all experiments.
Selectivity of proposed strategy towards determination of Hg2+
In addition to sensitivity, selectivity is another critical factor, the effect of different metal ions in addition to Hg2+ on the fluorescence intensity of CQDs has been studied (Fig. 3). All of these experiments were carried out at optimal conditions (pH 7.40, 298 K) and the concentration of all metal solutions was kept constant, at 10.0μM. To investigate the selectivity of the CQDs based sensing system the concentration of Hg2+ kept as 0.1μM and induces significant fluorescence quenching of CQDs while other metal ions does not showed any appreciable fluorescence quenching even at the concentration of 10.0μM. The bar graph plot has been shown in Fig. S2(A). This result indicates that the proposed sensing system exhibits better selectivity towards Hg2+ over other competing metal ions. Herein, PL intensity changes has also been examined in the presence of representative cations (including Mg2+, Ca2+, Ni2+, Na+, Hg2+, Mn2+, Pb2+, Cd2+) and anions (including Cl–, NO32–, SO42–) under the same conditions. The effect on fluorescence intensity of CQDs has been shown in bar graph Fig. S2 (B), which demonstrates that fluorescence intensity of CQDs was highly quenched in presence of Hg2+ as compared to other cations and anions [38]. In the presence of other metal ions no significant change was observed in fluorescence spectra of CQDs, which confirms the binding towards the CQDs was lower for these metal ions [39]. This may be due to that these metal ions have less electron accepting properties or low electrostatic interaction with Lewis base COO– and –OH groups to form a coordinate bonds. Thus, the result concluded that CQDs shows high selectivity and specificity to Hg2+ and the strong affinity towards the surface of the CQDs over other metal ions [40, 41]. All these selective results indicated that our developed sensor possess remarkably high selectivity to Hg2+ and could complete the selective requirement for environmental as well as bio-medical applications.

Fluorescence spectra of CQDs in presence of different metal ions.
Fluorescence is one of the finest virtue of CQDs and has been widely applied for the selective determination of heavy metal ions [19, 43]. Herein, we have explored the feasibility of CQDs at room temperature for the detection of Hg2+. It was observed that CQDs solution exhibits strong photoluminescence spectra at 430 nm [25, 26] whereas the fluorescence intensity was found to be decreased in the presence of Hg2+ ion due to the effective quenching property of Hg2+ [34, 35]. This phenomenon attributes that fluorescence quenching of CQDs presumably observed via. transfer of electrons and energy transfer between the molecules [36, 37]. From the previous literature, the fluorescence intensity of CQDs does not show significant changes in presence of 19 amino acids except Cysteine (Cys), demonstrating that the CQDs–Hg2+ system has an excellent selectivity towards Cys [38, 39]. The formation of CQDs-Hg complex was confirmed by removal of quencher (Hg2+) from the surface of CQDs after the addition of Cys. It was observed that the Hg2+ ions removed from CQDs surface when it found more electron rich species group (thiol group) in the sample solution and forms Hg–S bond with thiol group of Cys and fluorescence intensity of CQDs were recovered effectively after the addition of Cys shown in Fig. S3.
The quenching mechanism behind the intrinsic fluorescence intensity of CQDs gradually decreased with rise in the Hg2+ concentration in the range of 0 to 5.0μM. Hence, the current mechanism is found to be more sensitive towards detection of Hg2+. Figure 4(A) shows the concentration dependent spectra of CQDs with Hg2+ which displays the gradual decrease of fluorescence intensity at 430 nm with an increase in the concentration of Hg2+, presumably due to complex formation and irradiative electron annihilation through an effective electron transfer process [40, 41]. Hg2+ ion is a good electron acceptor and act as a Lewis acid hence, it can easily coordinate via. electrostatic interaction with the Lewis base such as O– and NH–, S– etc. ligand. The surface of CQDs functionalized with COO– and –’OH group forms coordinate bond with Hg2+ [42–44]. Here, we report the possible coordination chemistry of functionalized groups (COO– and –OH) at the surface of CQDs to form a coordinate bond with Hg2+ shown in

(A) Fluorescence emission spectra of CQDs dispersion in the presence of different Hg2+ concentrations (excitation and emission slit fixed at 5 nm) and (B) Linear regression plot for quenching of fluorescence intensity of CQDs.
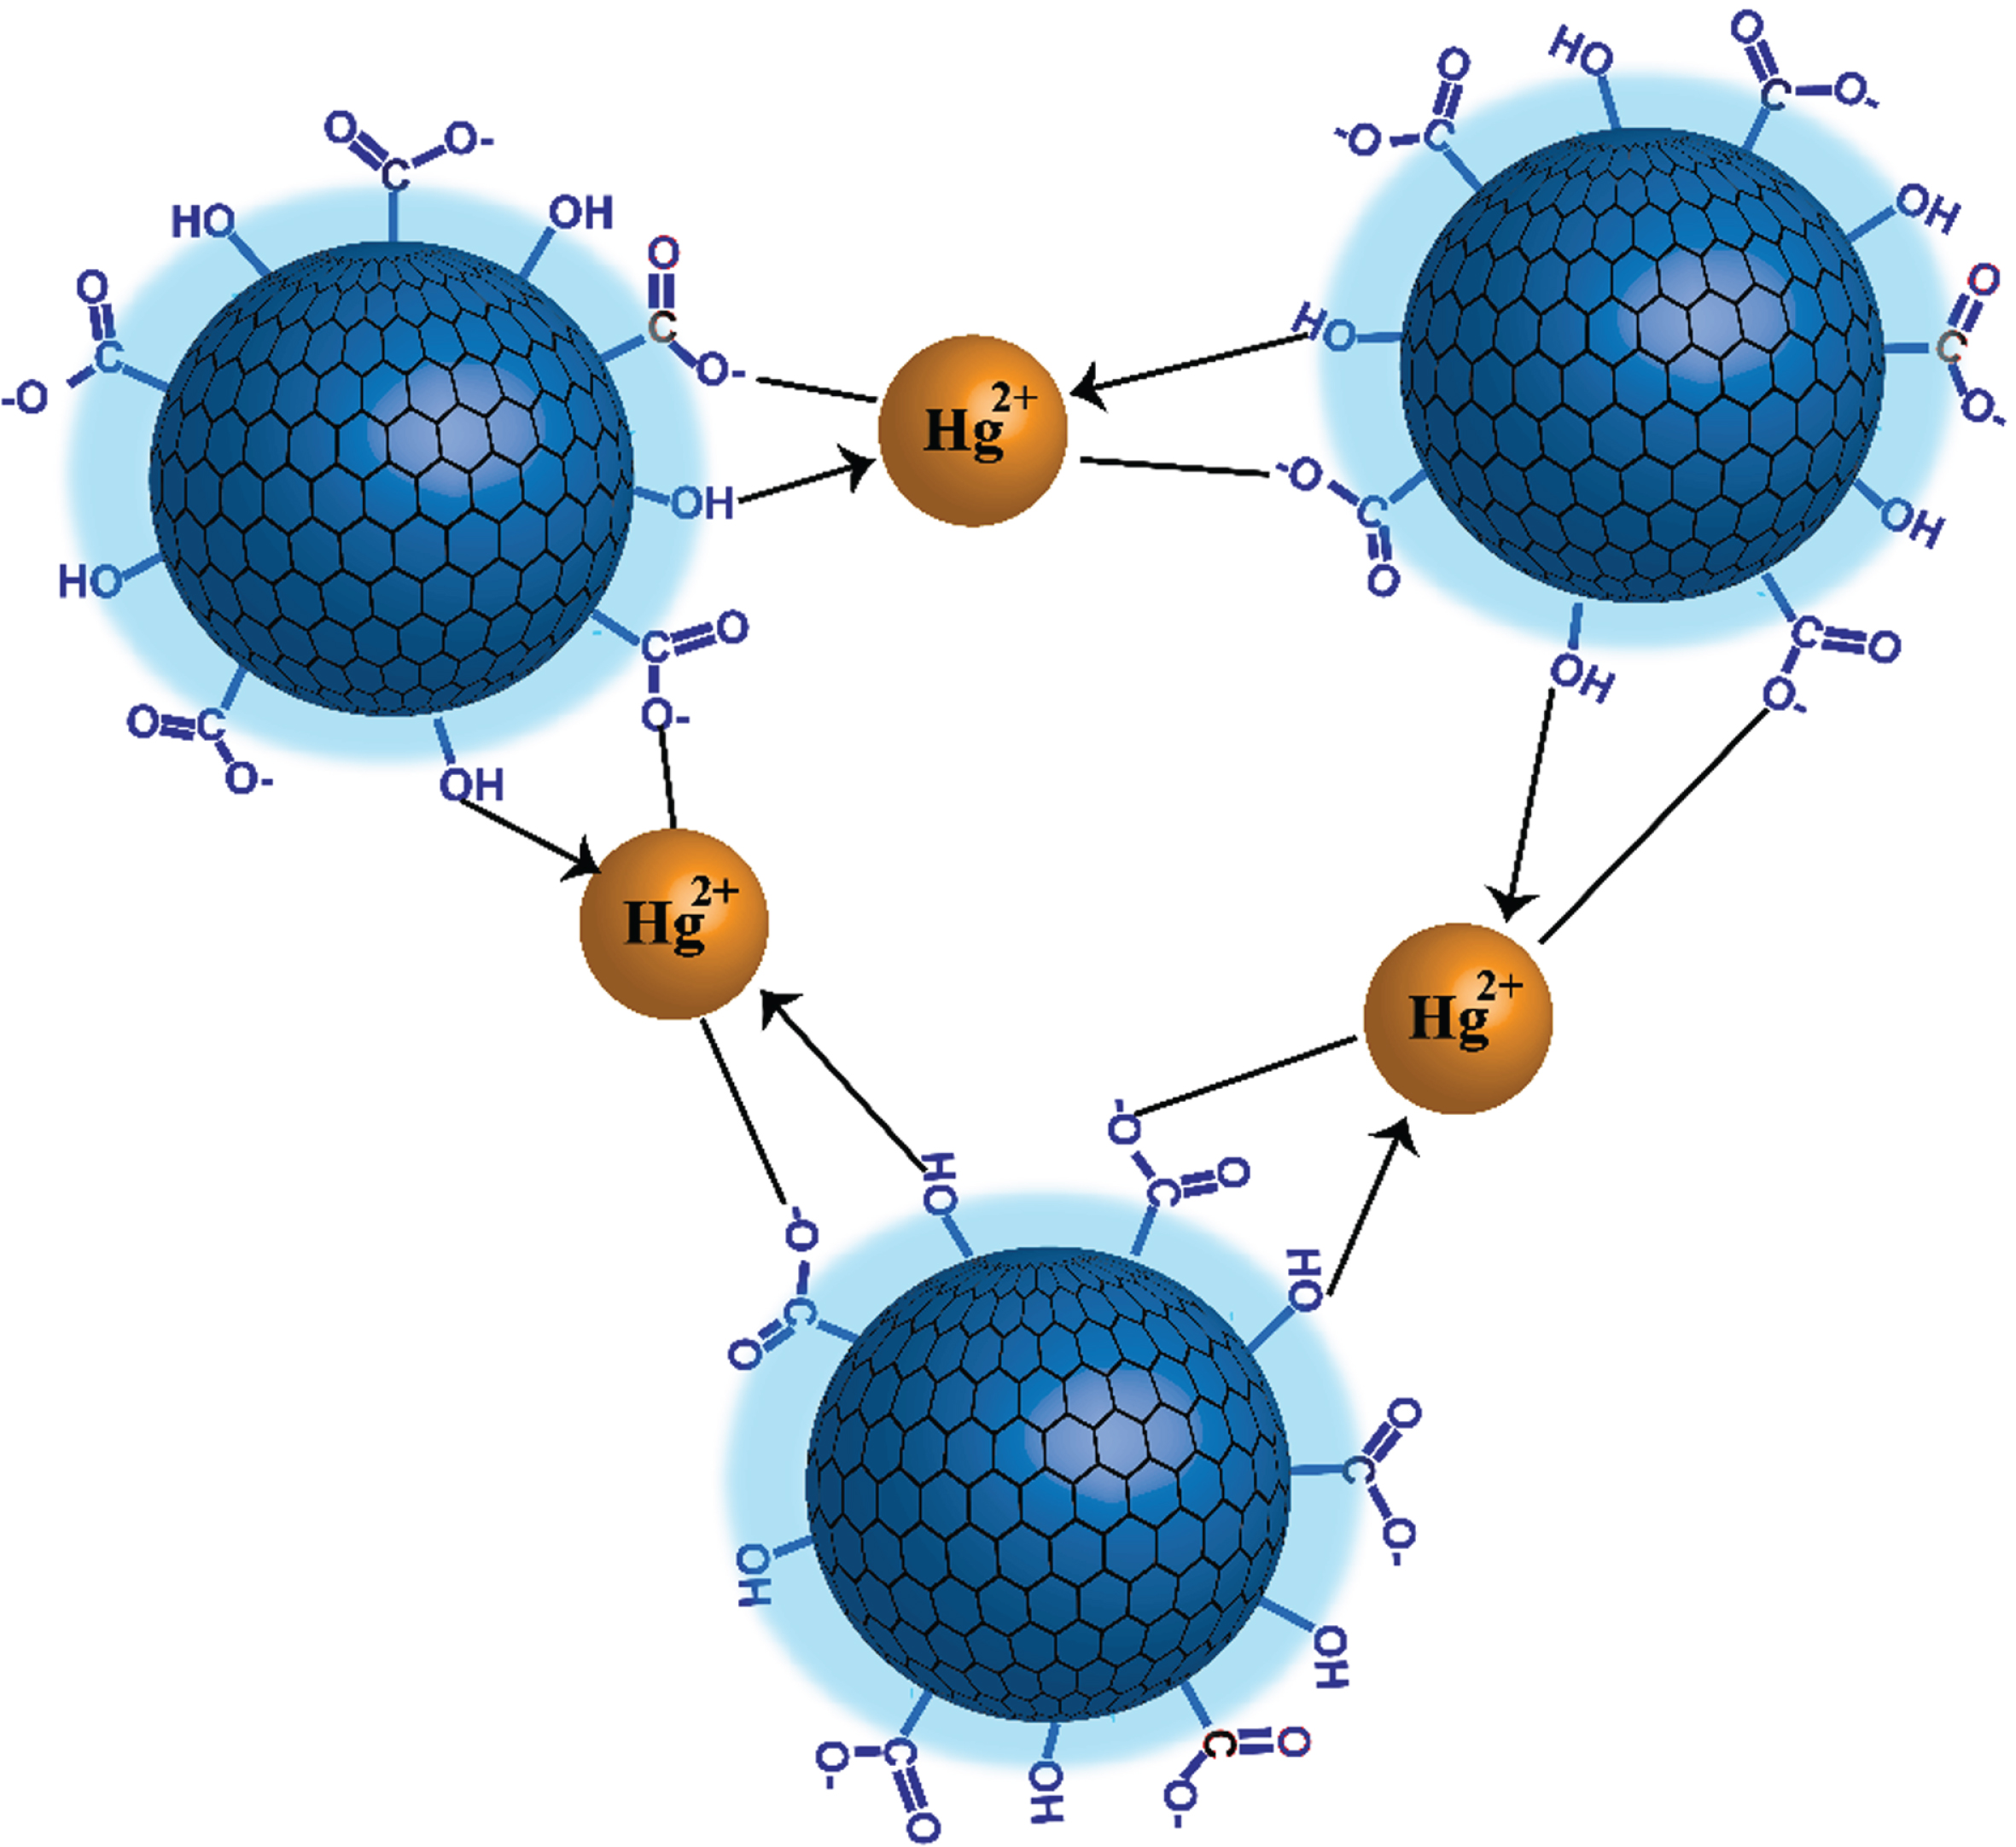
A schematic representation of the expected coordination chemistry between Hg2+ ion and carbon quantum dots (CQDs).

Schematic representation for quenching mechanism of CQDs by Hg2+ and retrieval by Cys.
The linear regression plot is plotted for gradual decrease in fluorescence intensity of CQDs shown in Fig. 4(B), which further used for the calculation of binding constant. The results reveal that the proposed strategy is more feasible towards sensing of Hg2+ ion with high sensitivity.
The fluorescence quenching mechanism is classified as static and dynamic quenching [38, 39]. Sometimes, the quenching of CQDs was found to be static mechanism due to a constant fluorescence quenching spectra with increase or decrease in temperature of CQDs solution [28]The fluorescence quenching constant for the complex of CQDs-Hg at room temperature was calculated by the Stern Volmer equation, shown in equation (1) [45]
where, Ksv is Stern-Volmer quenching constant, [Q] is the concentration of analyte (Hg2+), Fo and F are the FL intensities in the absence and presence of quencher, respectively. Therefore, the value of K sv was calculated by the linear regression plot of Fo/F against [Q].
The calculated K sv , binding constant (Ka) and correlation coefficient (R2) for this experiment are listed in Table 1. Hence, it is clear that the K sv values were decreased with an increase in the concentration of Hg2+ prove that the fluorescence quenching mechanism of CQDs system were static rather than the dynamic mechanism [29].
The values of Stern–Volmer quenching constants (K sv ), binding constants (Ka) and regression constant (R2) for the CQDs-Hg system
The binding constant (Ka) and binding number (n) of small molecules for the CQDs with Hg2+ could be analysed by the double logarithmic equation (2):
The linear regression plots of log (F0–F) / F against log [Q] are shown in Fig. 4(B) for detection of Hg2+ and calculated values are listed in Table 2 which demonstrate that CQDs shows more binding affinity towards Hg2+. Furthermore, the binding number (n) was found to be unity.
Observed values of thermodynamic parameters, such as, entropy (ΔS), enthalpy (ΔH) and Gibb’s free energy (ΔG) for the CQDs-Hg system at various temperature
It was observed that UV-vis absorption spectrum of CQDs shows a strong peak at 280 nm which is attributed to the π–π* transition of the C=C bonds, then n–π* transition of C=O bonds and UV-vis spectra of CQDs-Hg shows λ
max at 280 nm and absorbance increases with increasing concentration of Hg2+ which confirms the complexation of CQDs with Hg2+ shown in Fig. 5. The binding constant of CQDs-Hg complex were determined by UV-vis spectroscopic method using equation (3) [30]
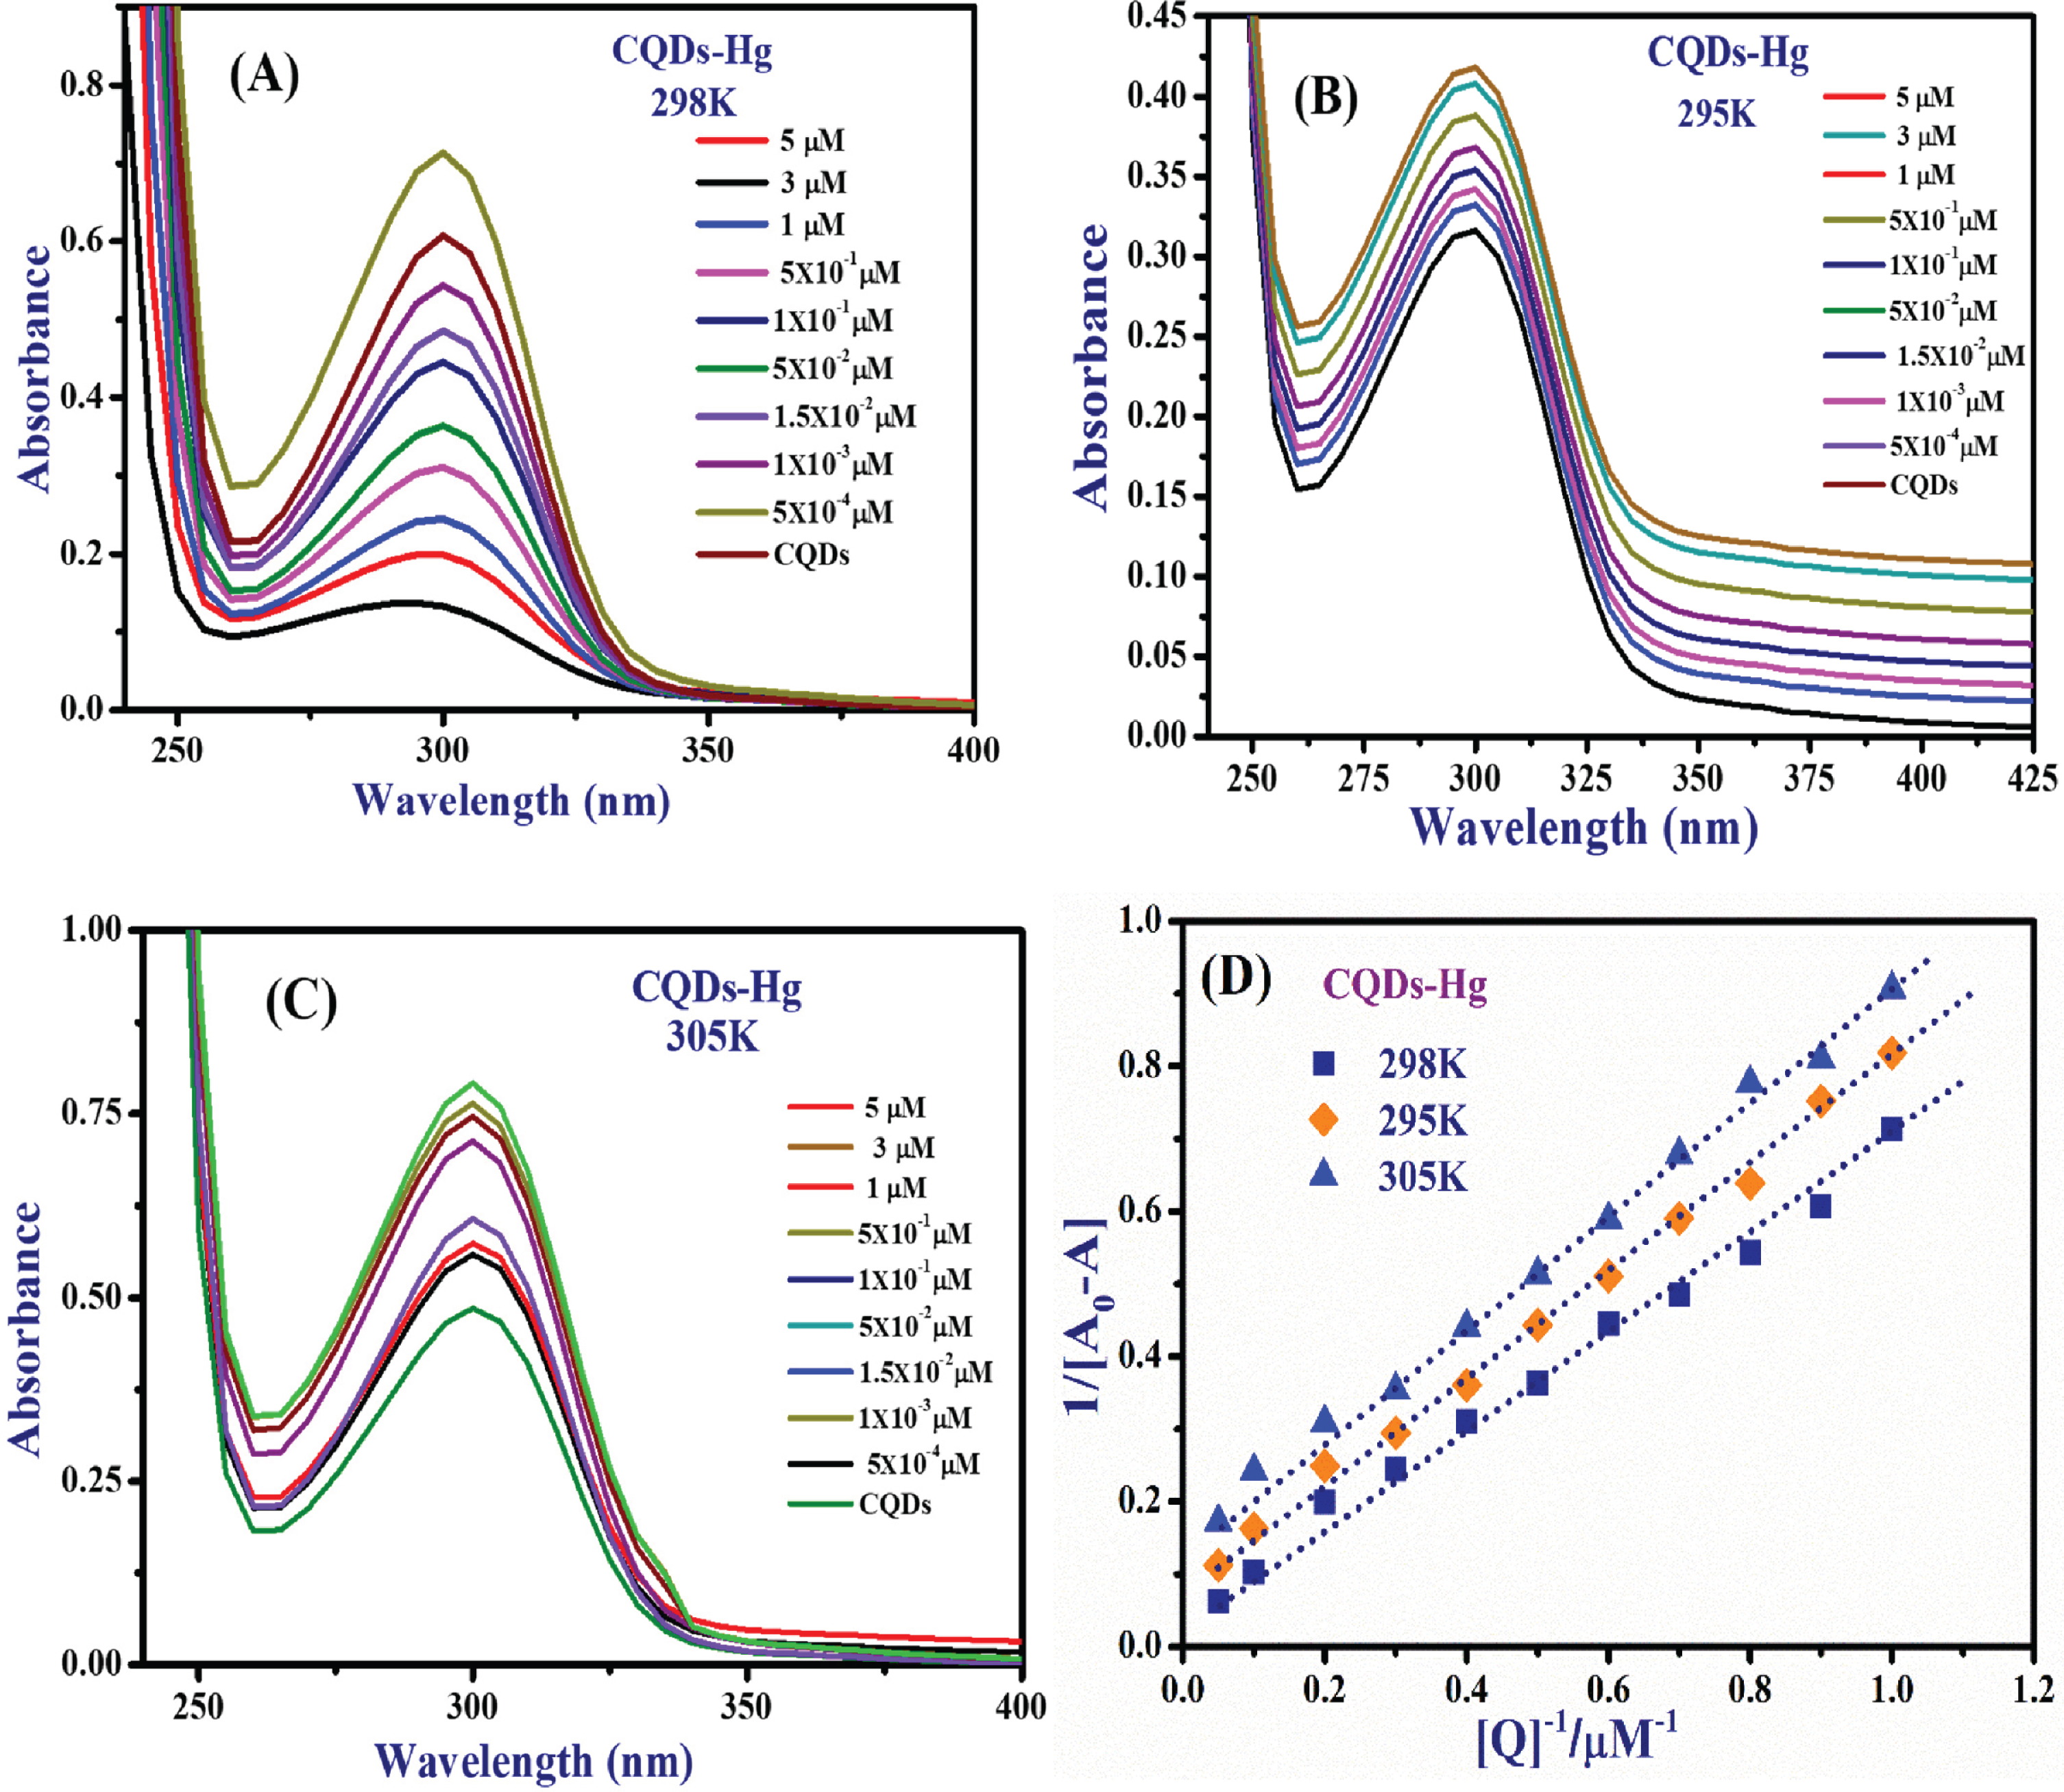
UV-vis spectra of CQDs dispersion in the presence of various concentartion of Hg2 + at three temperature (A) 298 K, (B) 295 K, (C) 305 K and (D) Benesi-Hildebrand plots using changes in absorption spectra of CQDs with Hg.
where, A0, A and Amax are the absorbance in the absence and presence of Hg2+ and maximum absorbance at saturation point, respectively. Ka is the binding constant calculated value listed in Table 1. The plots of 1/[A–A0] versus 1/[Q] provides straight lines, Fig. 5(D) demonstrating the formation of 1 : 1 complex between CQDs and Hg2+ and the results are observed in good agreement with fluorescence study.
Interaction of CQDs with Hg2+ ions and other molecules due to the hydrogen bonding, electrostatic and van der-Waals interaction and hydrophobic forces [31]. Thermodynamic parameters such as enthalpy (ΔH), entropy (ΔS) and Gibb’s free energy (ΔG)for the system derived by binding constant (Ka) using UV-vis spectroscopic study at different temperature is calculated by using Equation (4) and (5):[46]
Here, Ka is the binding constant at the temperature T and R is the gas constant. The values of change in enthalpy (ΔH), entropy (ΔS) and Gibb’s free energy (ΔG) were calculated according to the linear regression plots shown in Fig. 5(D). The calculated values of ΔH, ΔS and ΔG are summarized in Table 2. Herein, the negative value of ΔG demonstrate that the binding procedure of CQDs with Hg2+ were spontaneous and negative value of ΔH shows that energy releases in the binding process of CQDs with Hg2+. The change in entropy (ΔS) during reaction process is very essential to ascertain the driving forces associated with CQDs–Hg. The value of entropy for CQDs–Hg system increases with temperature increase which confirms that the binding of Hg with CQDs is feasible. The enthalpy (ΔH) value of CQDs–Hg system is negative at all three temperature suggest that the heat is released by the system and the reaction is exothermic. The enthalpy (ΔH) value found to be similar at all three temperature and listed in Table 2. The obtained value of various thermodynamic parameters revealed that the detection of Hg2+ by CQDs is thermodynamically favourable.
FT-IR is a simple analytical technique used for the investigation of structural and functional group modification in molecular structure. Here, FT-IR technique has been applied for the detection of Hg2+ using CQDs as sensing probe. Here, the alterations occurring in the absorbance of CQDs in presence of Hg2+ was critically studied by FT-IR. Figure 6 (B) shows the FT-IR spectra of CQDs with Hg2+ in the concentration range of 0 to 50 nM. It was found that a FT-IR spectrum of the pure CQDs loses its intensity with increasing the concentration of Hg2+. The peak at 3400–2800 cm–1 which corresponds to the –OH stretching of carboxylic group was found to have less intensity as compared to pure CQDs spectra and values are shown in Table 3.

FT-IR spectra of (A) CQDs and (B) CQDs-Hg with increasing concentration.
Comparative table based on previously reported CQDs based sensors for Hg2+ detection
Moreover, the C=C stretching of conjugated alkene shifts slightly from 1650 cm–1 to 1630 cm–1, –OH stretching frequency 2850 cm–1 has shifted to 2760 cm–1, symmetric and asymmetric stretching frequency C–H 1449 cm–1 has shifted to 1451 cm–1, 1100 cm–1 of CO–O–CO anhydride stretching frequency has shifted to 1089 cm–1, C=C bending of alkene 850 cm–1 has shifted to 847 cm–1 less intense peaks which may be due to the change of electronic vibrational states of analytes with interaction of Hg2+ to CQDs surface during chemo-sorption process [32].
The outcomes of the FT-IR studies revealed that Hg2+ affects not only the stretching vibration of carboxylic acid in CQDs but also to the C = C stretching of alkene. Hg2+ shows higher affinity to functional groups of the CQDs, meanwhile the FT-IR results are in good agreement with the fluorescence results.
We have also studied the effect of other metal ions using FT-IR spectra of CQDs by taking 10μM concentrations for each metal ions and observed that there were no significant changes in FT-IR spectra of CQDs (Fig. 6A). Therefore, these results have demonstrated that the synthesized CQDs can act as sensing probe for analysis of Hg2+. It was observed that with increasing concentration of Hg2+ binding/complexation with CQDs increases due to capturing of surface functional group by Hg2+ of CQDs. These results confirm the higher affinity of Hg2+ towards carboxylic and other functional groups present on the surface of CQDs.
Quenching of fluorescence spectra by spiked water samples
Several studies revealed that under the optimal conditions pH 7.4 and 20 min incubation time the concentration of Hg2+ ions could be linearly related to the extent of CQDs fluorescence quenching [33, 34]. Figure 7 shows fluorescence spectra of CQDs with Hg2+ from 0 to 5×10⁻²μM in tap water samples and the linear relationship between Hg2+ concentration and magnitude of quenching of fluorescence intensity of CQDs. The calibration curve was obtained by plotting (Fo/F) –1 against the concentration of Hg2+ shown in inset of Fig. 7 and correlation coefficients (R2) 0.998 for detection of Hg2+ in the concentration range of 1 to 5×10⁻²μM respectively. The detection limit is estimated to be 3.25 nM at signal to noise ratio of 3 and limit of quantification was recorded 9.87 nM, which is much lower than other previously reported values. Previously reported detection assay for Hg2+ based on CQDs shown in Table 4 which demonstrate that our sensing system has better sensitivity in comparison to others sensing system.
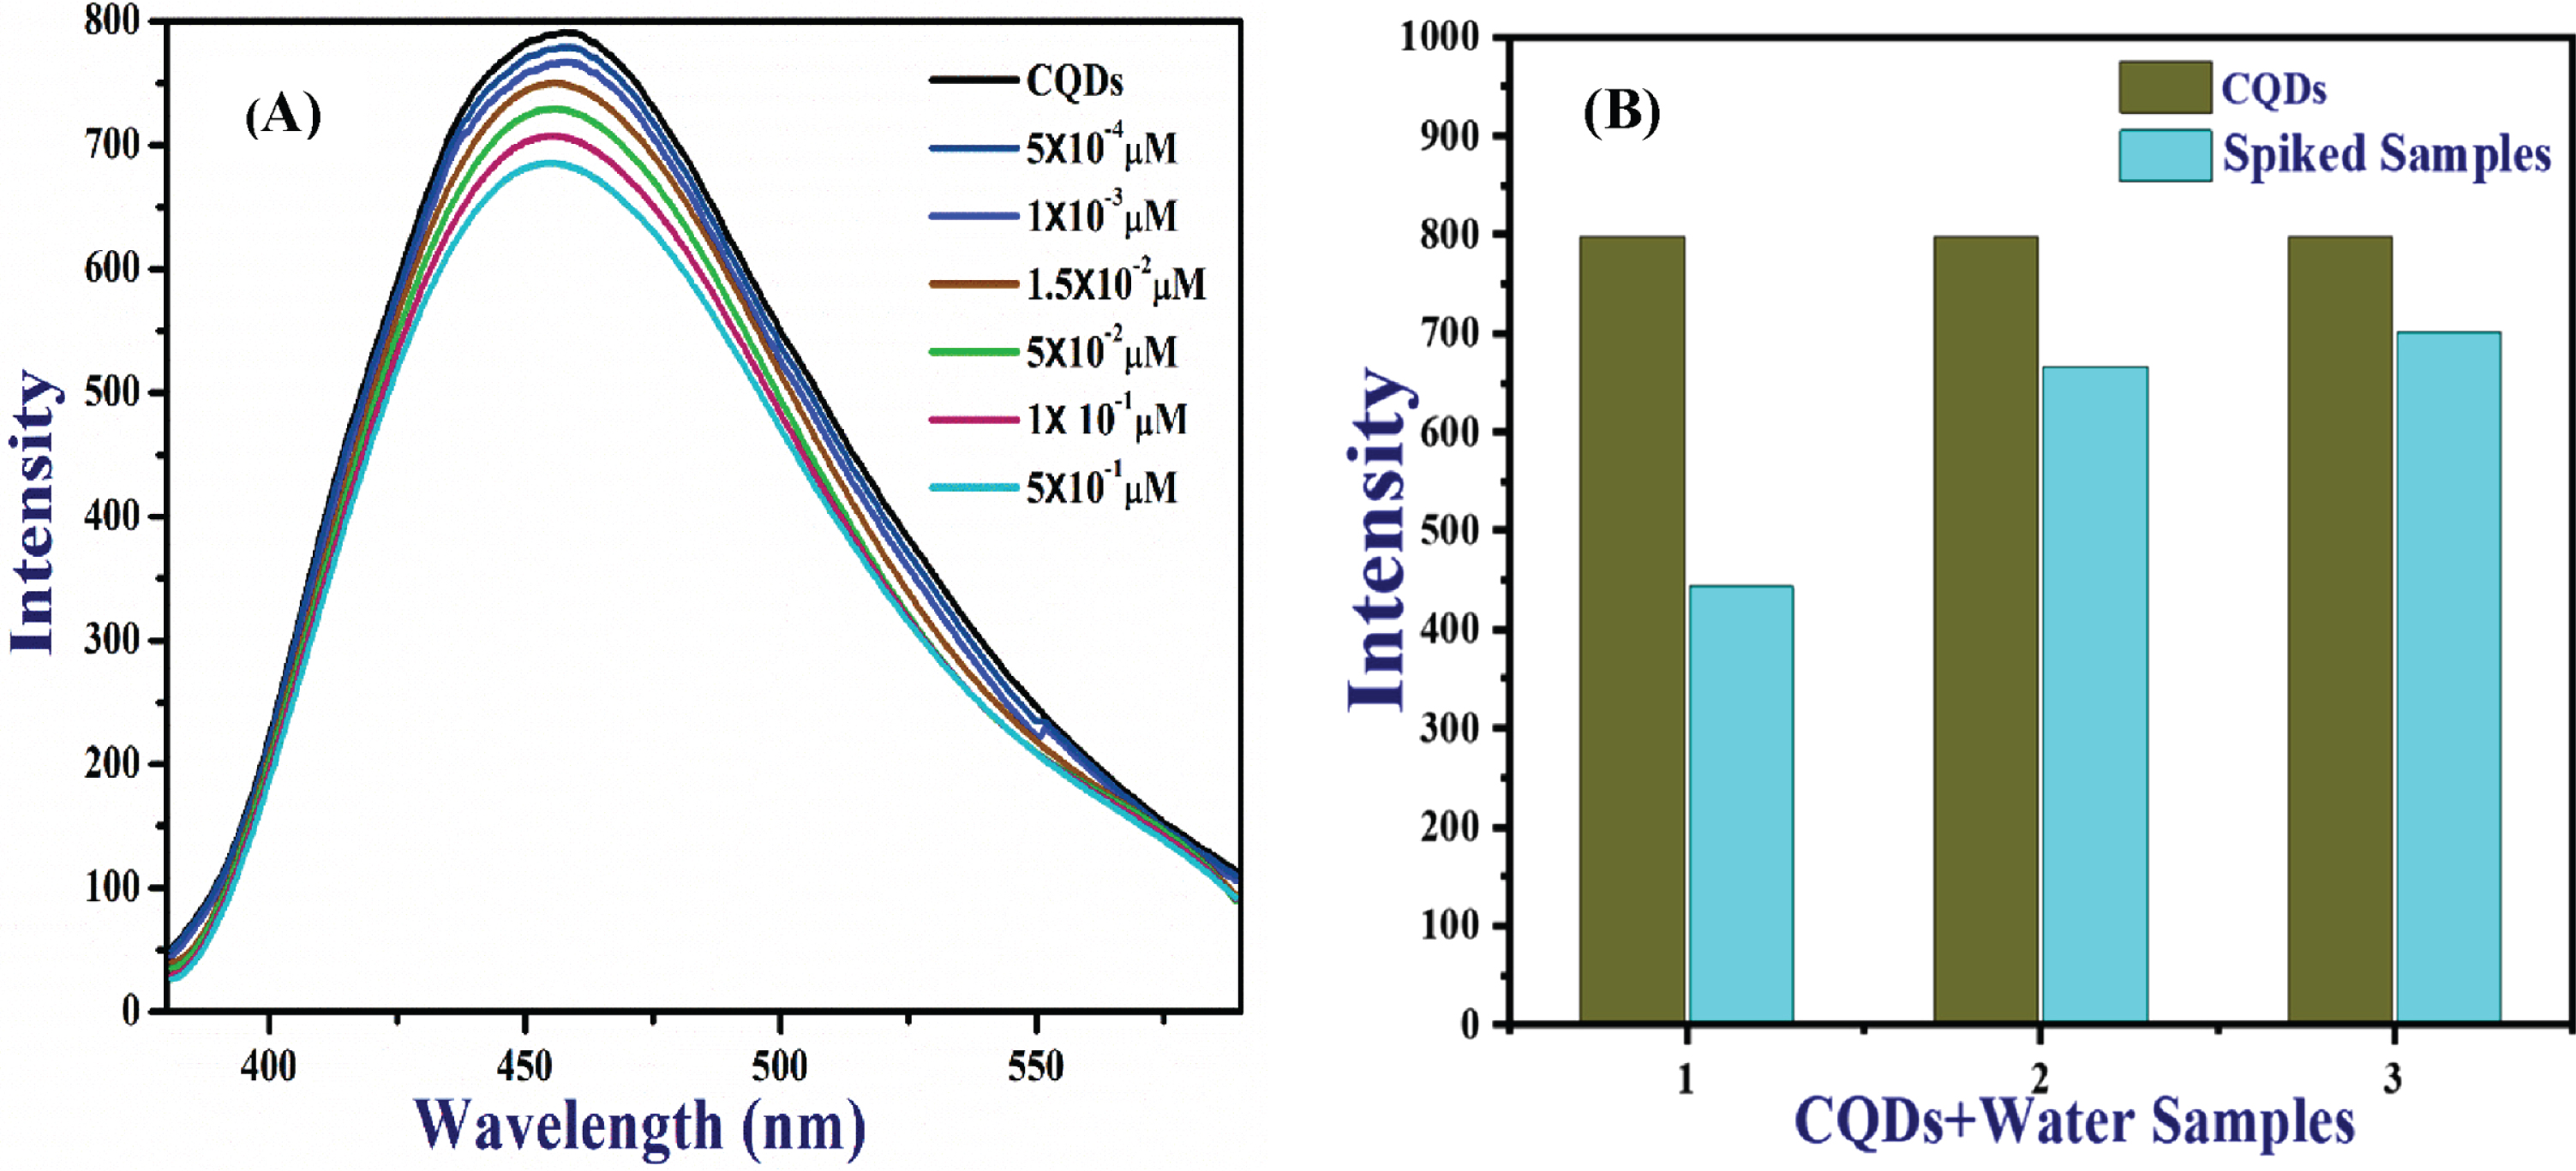
(A) Fluorescence spectra of CQDs in the presence of spiked tap water sample and (B) Bar diagram showing the comprative effect on CQDs intensity.
Recovery and RSD percentage (%) value obtained for Hg2+ detection in spiked tap water samples
The observed limit of detection (LOD) values for the linearity range of 0–5.0μ has also been compared with previously reported detection assay for Hg2+ based on CQDs, shown in Table 4, this demonstrates that our sensing system shows better results in comparison to other reported methods.
UV-vis spectra of CQDs with spiked water samples shown in Fig. 8 and linear regression plot has been plotted as absorbance against the concentration of spiked water samples. It is observed that absorbance at 280 nm gradually increases with increasing the concentration in the range of 0 to 50 nM which confirms the binding of CQDs with Hg2+. The various analytical parameters such as LOD, recovery and RSD percentage has been calculated by linear regression plot. The obtained recovery values are ranging from 95 to 98%. Thus, the results proclaim that the CQDs justified their roles as sensing-probes for the detection of Hg2+ in tap water samples. The calculated values are listed in Table 4 which shows that the LOD has been lowest for the tap water sample 1 which is collected from the mining area of Korba with high recovery percentage in comparison to tap water sample 2 and 3.The various analytical parameters such as LOD, recovery and RSD percentage for spiked water samples shows that the high sensitivity and selectivity for detection of Hg2+ in spiked samples collected from different areas. The obtained results demonstrate that the LOD is lowest 3.25 nM for the tap water sample 1 in the 0 to 5.0μM linear range with 98–99 % recovery percentage, which is lowest reported value in our knowledge for Hg2+ detection in spiked water samples.
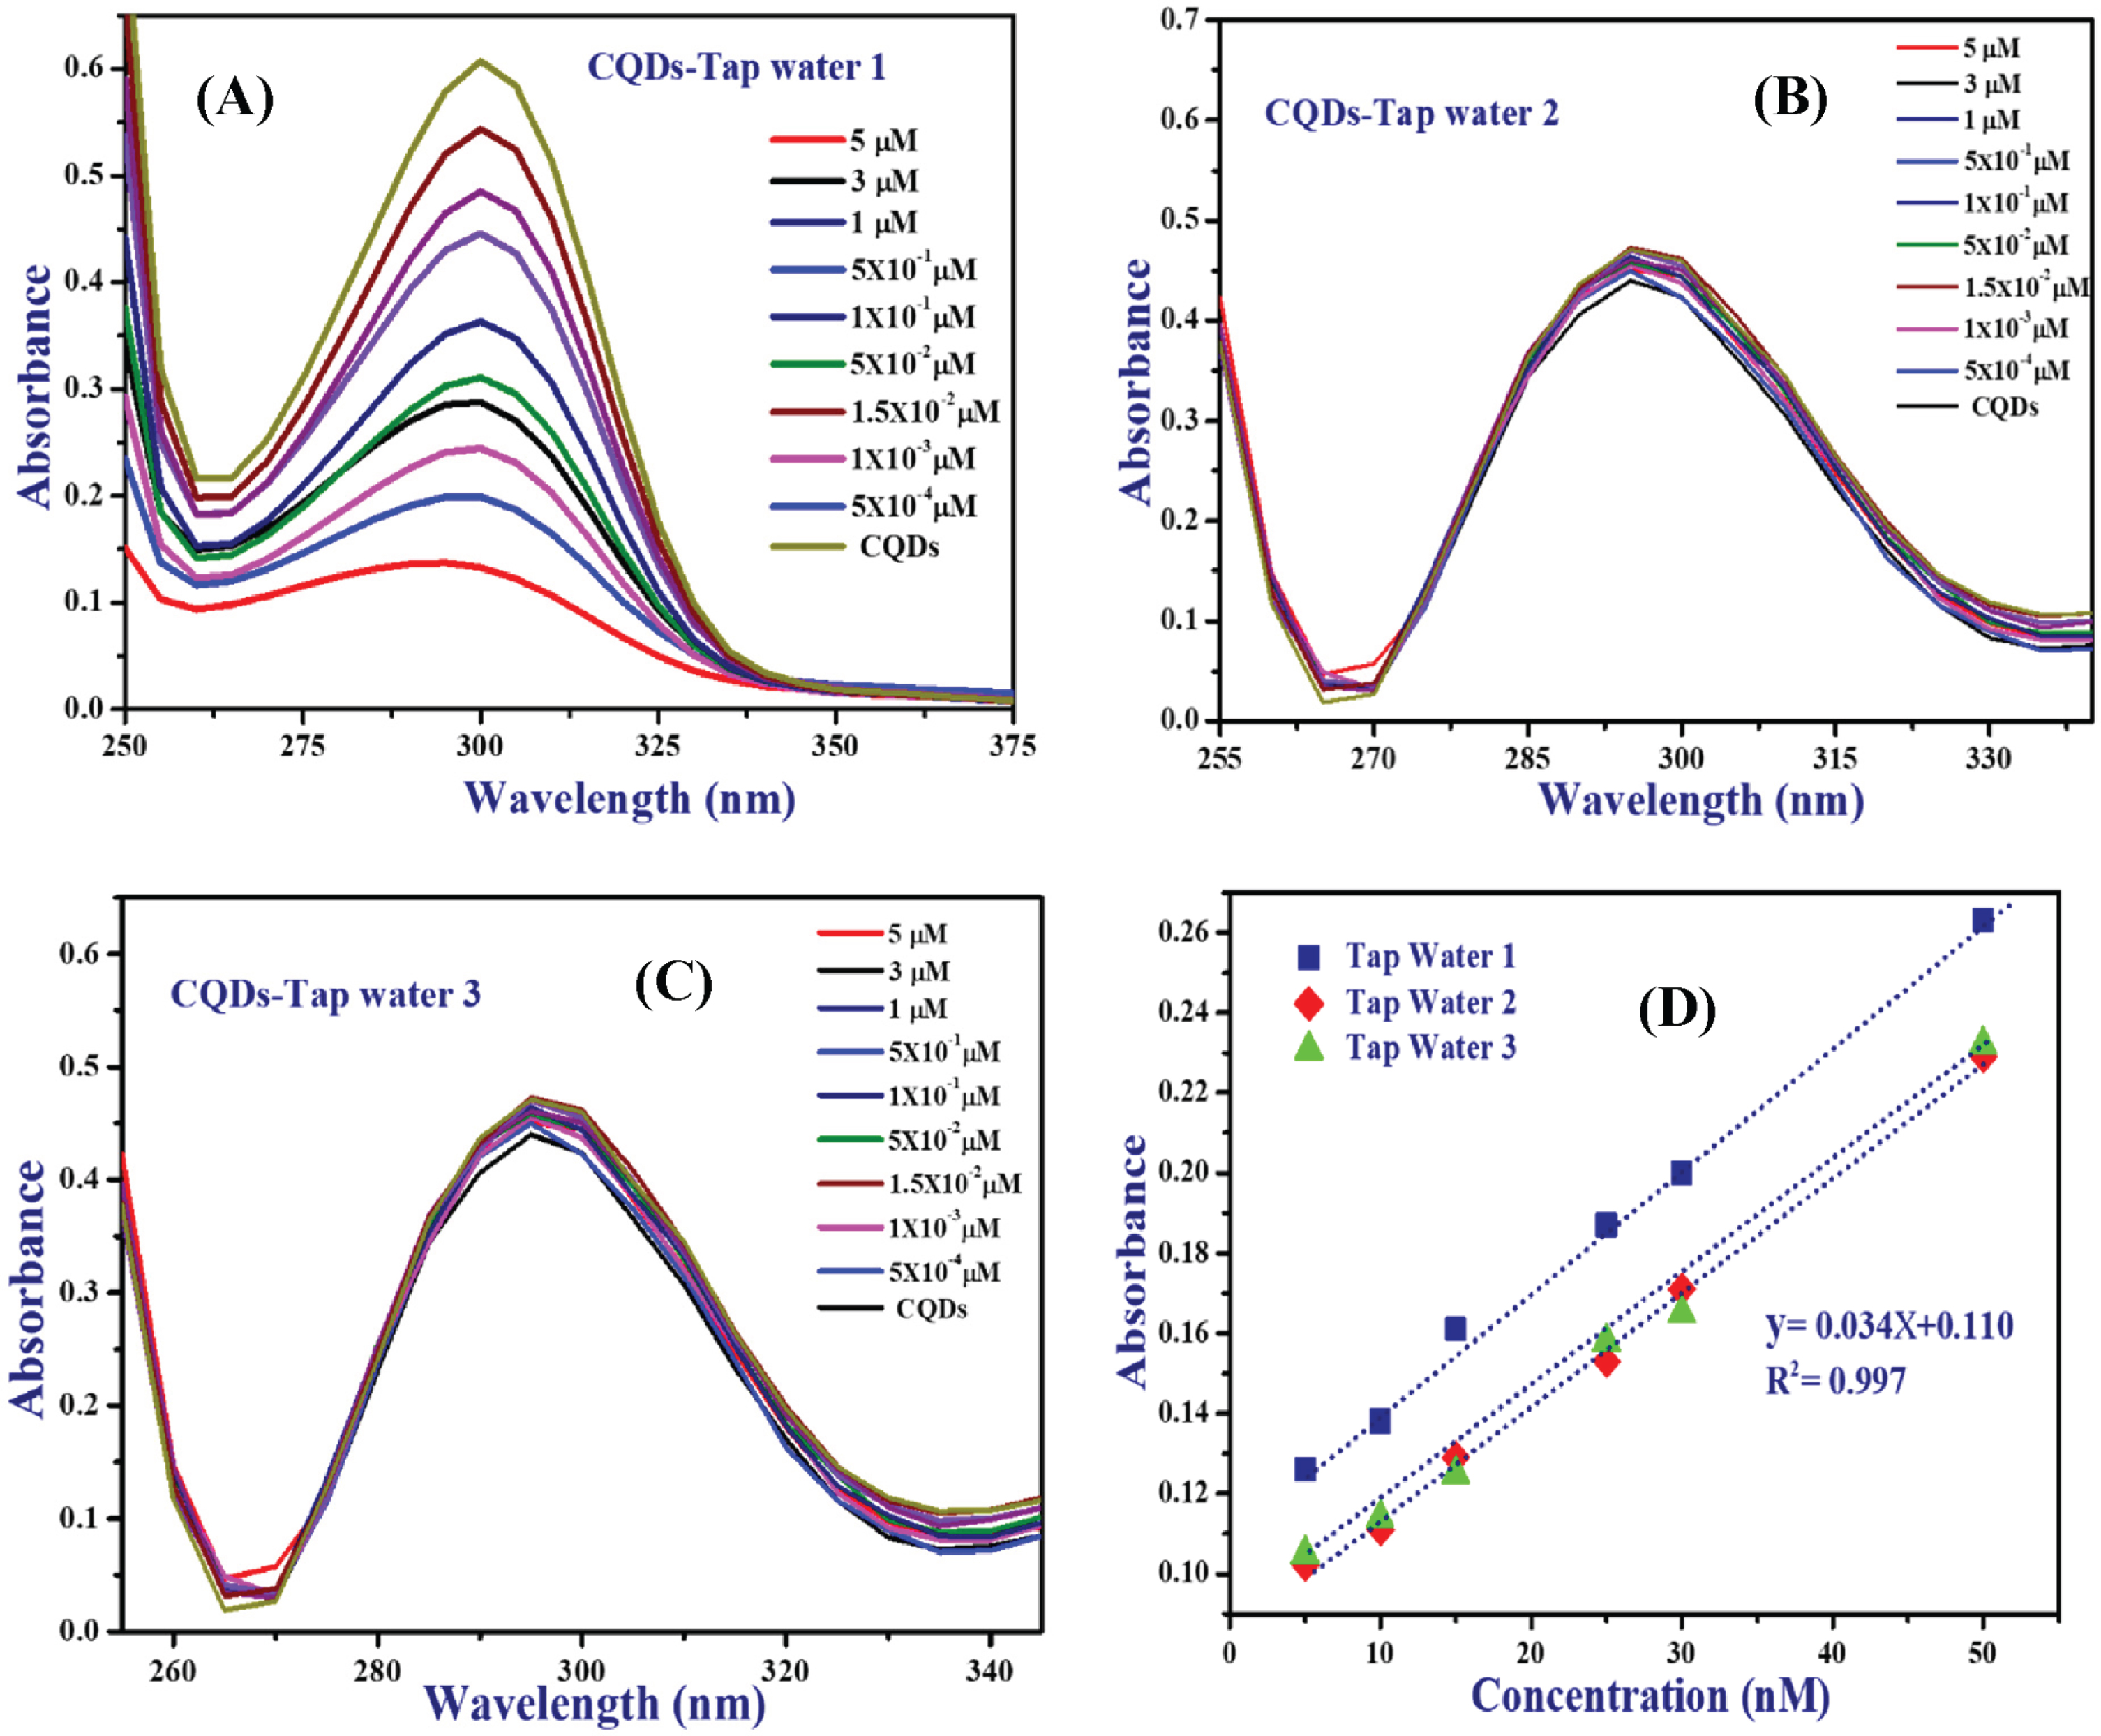
UV-vis spectra of CQDs in the presence of three spiked tap water samples (A) tap water samples 1, (B) tap water samples 2, (C) tap water samples 3 and (D) Linear regression plot of CQDs with spiked water samples.
Herein, the study of CQDs as chemical sensor were successfully synthesized using a simple, cost-effective and eco-friendly process using glucose as carbon precursor. The fabricated CQDs showed excitation dependent green fluorescence emission in aqueous solution. Microscopic investigation reveals that average size of CQDs was between 2–4 nm. The effect of pH on fluorescence intensity was also studied to find the optimum pH at which CQDs shows good stability. These results supported the fact that CQDs are suitable to be used as a sensing-probe for detection of Hg2+. The sensitivity and selectivity of the proposed sensor remarked that the increase in concentration of Hg2+ ions results in gradual decrease in fluorescence intensities and static quenching was proven mechanism for explaining the fluorescent decay. The binding constant of Hg2+ ions with CQDs and thermodynamic parameters were evaluated by fluorescence and UV-vis spectroscopy measurement, which indicated that the detection assay is spontaneous at room temperature. The CQDs exhibits ultra-trace detection of Hg2+ ions with LOD of 3.25 nM in detection range of 0–5μM. The developed method was validated with spiked water samples collected from different region of Chhattisgarh, in which tap water samples 1 shows better results with high recovery percentage of 98 to 99%.This developed fluorescent sensor offers a new strategy for developing simple, cost-effective, highly sensitive and selective nano-probe for detection of heavy metals.
Footnotes
Acknowledgments
Authors are gratefully acknowledges fellowship received from the Pt. Ravishankar Shukla University, Raipur (C.G.). Financial support of this work by the DST-FIST [No. SR/FST/CSI259/2014(C)] and UGC-SAP [No. F-540/7/DRS-II/2016 (SAP-I)] for the financial support. We express our deep gratitude towards Director, NCL Pune for TEM analysis. We are also grateful thanks to National Center for Natural Resources, Pt. Ravishankar Shukla University, Raipur (C.G.) for providing the FT-IR and 13C-NMR analysis.