
Abstract
In today’s world, heavy metal pollution is one of the major problems. Various methods have been developed for the removal of pollution caused by heavy metals. However, adsorption is the most advantageous process among these methods.
Mining waste is another source of pollution. The evaluation of these wastes will both solve the storage problems and prevent environmental pollution.
In this study, Bergama gold mine wastes were evaluated and used in geopolymer production. Alkaline fusion method was used for geopolymer synthesis in the experimental process. The obtained geopolymer sample was suitable for adsorption in terms of porosity and surface area and was used in the adsorption of Cu2+.
According to the results of the studies, the surface area of the gold mine waste increased from 3.845 m2/g to 74.916 m2/g. Adsorption studies were carried out at different parameters such as geopolymer dosage, contact time, temperature and initial concentration. Also, isotherm and kinetic studies were applied. Cu2+ adsorption is suitable for the Langmuir isotherm model (R2 = 1) and the Pseudo-second order kinetic model (R2 = 0.997).
Introduction
Copper (Cu), which is inclusive in heavy metal class, poses a hazard for human health and the environment. Due to industrial developing Cu is generated in various areas such as metal cleaning and plating baths, paper, paperboard mills, wood-pulp production, tire manufacture, and fertilizer industries. Beside the accumulation in the environment by the waste stream of these industries, it also has short and long term negative effects for human body [1, 2]. Because of these reasons, Cu removal from water is an important subject. There are many methods (electrocoagulation, ion exchange, filtration, reverse osmosis, electrochemical treatment) are used for removal of copper from water but they have some disadvantages such as high energy requirements, production of toxic sludge or expensive equipment. Adsorption is one of the methods which uses for heavy metal removal. Unlike other methods, this method is efficient, fast, cost-effective and environmental friendly [2, 3].
Geopolymers, which are amorphous materials, invented by Joseph Davidovits in the late 1970s. They are formed by reaction of the alumina-silicate source with an alkaline solution and constitute a three dimensional (3D) networks structure with covalent bonds. Geopolymer structure consists of SiO4–4 and AlO4–5 tetrahedral units. These units share oxygen atoms. Na+ or K+ ions that came from alkali solutions cavities balance the negative charge of Al. Geopolymers have tremendous adsorption efficiency. The 3D negatively charges framework structure of geopolymers provides this property [2, 4].
In recent years, the various studies about the usage of geopolymer on the adsorption are carried out. Liu et. al investigated the sorbents properties of fly ash, fly ash-based geopolymer and faujasite block, for lead (Pb) [5]. Panda et. al reported geopolymer synthesis from pyrophyllite mine waste and its usage as a heavy metal Cobalt (Co), Nickel (Ni), Lead (Pb), Cadmium (Cd) adsorbent from water [6]. Li et. al investigated the methylene blue adsorption of fly ash based geopolymer [7]. Cheng et. al produced a metakaolin based geopolymer and examined adsorption efficiency of it for Cu, Pb, Cr and Cd [8].
In the present work, the synthesis and characterization of geopolymer manufactured from gold mine tailings and its application as an adsorbent of Cu2+ are investigated. Adsorption dynamics were examined in a batch mode of operations. Different conditions such as contact time, temperature, and initial concentration were examined to understand the adsorption mechanism of Cu2+ on geopolymer. The adsorption isotherm and kinetic models were also evaluated.
Materials and methods
Gold mine tailings slurry that was obtained from Bergama Ovacik Gold Mine Treatment Plant, Turkey, was used as alumina silicate resources for geopolymer production. The slurry sample was dried at 105°C for 2 h. After the drying process it was crushed in a grinder and then sieved to 180 μm. Cyanide analysis was made to gold mine slurry and absence of cyanide in the slurry was confirmed by TS 12271 “Wastes standard test methods for the detection of cyanides” [9]. The chemical composition of gold mine tailings is given in Table 1.
The chemical composition of gold mine tailings
The chemical composition of gold mine tailings
Aluminum oxide (Al2O3), alkali activators of sodium hydroxide (NaOH), sodium silicate (Na2SiO3), and Copper ICP standard were purchased from Merck Chemicals (MerckKgaA, Darmstadt, Germany Prior). Sodium silicate (Na2SiO3) was obtained from Ref-San chemicals.
Bruker D8 Advance X-ray diffraction equipment, by Perkin Elmer Spectrum One FT-IR Spectrometer, ZEISS EVO LS 10 SEM equipment and QUADRASORB Station 2 Gas Sorption Surface Area and Pore Size Analyzer were used for characterization studies.
Gold mine tailings based geopolymer was prepared through alkaline fusion method [10] by adding Al2O3 (wgold mine tailings/walumina ratio equals to 85.36%) and NaOH (wNaOH/(wraw material + walumina equals to 1). The fusion was conducted at 550°C for 1 hour (the heating rate at 10°C/min) [10]. After the fusion process, Na2SiO3 whose wNa2SiO3/(wfusion process mixture) ratio equals to 0.5 was added the mixture. Experimental ratios were determined by previous studies. Homogeneous mixture obtained by fusion method was kept at 36°C for 72 h. specific surface area andsurface topography and composition of gold mine tailings were analysed by XRD, FT-IR, BET, and SEM-EDX instrument, respectively.
Adsorption studies
In the adsorption study, copper nitrate (Cu(NO3)2, 99.99 wt%; Merck) was used to prepare the Cu2+ stock solution. Analysis of adsorption studies was carried out with Perkin Elmer Optima 7000 DV Inductively coupled plasma-Optic emission spectrometer (ICP-OES).
Cu2+ solutions at different concentration (60, 45, 30 and 15 ppm) were prepared by making dilution from of 1000 ppm Cu(NO3)2) solution. pH value was kept constant at 4 in the experiments [11]. 0.02 g of adsorbent was added to 50 ml of Pb2+ solutions at 15 ppm, 30 ppm, 45 ppm, and 60 ppm and mixed for 1, 5,15, 30, 60 and 120 minutes, respectively. After the mixing process, the suspensions were filtered by using blue band filter paper. The filtrate was analysed by ICP-OES. The equilibrium adsorption capacity was calculated as (Equation 1),
The pH of the aqueous solution is an important parameter for adsorption studies. According to Fig. 1 Cu2+ ions start to hydroxide form when the solution became neutral. In order to hinder Cu(OH)2 formation pH was chosen as 4 in the experiments [8].
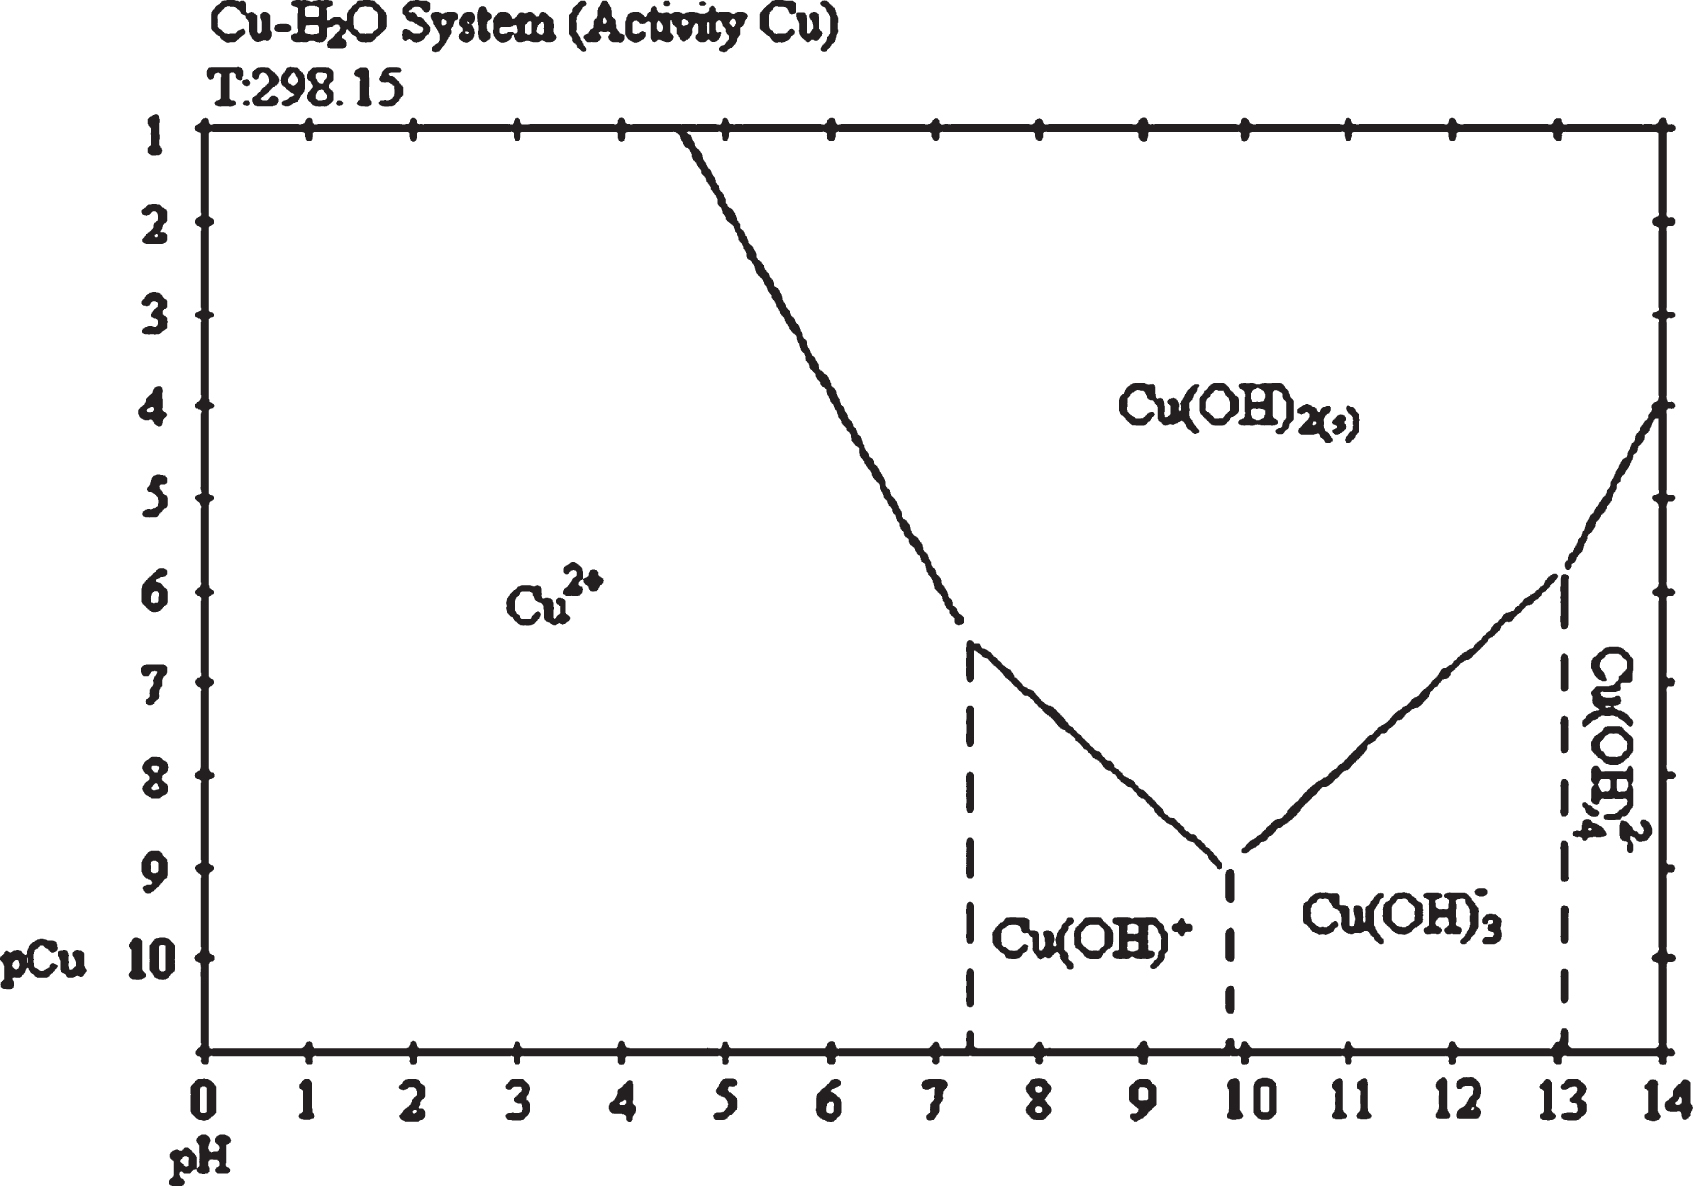
Cu2+ ions and it’shydroxide form [7].
Characterization and comparison of gold mine tailings and geopolymer
Crystal structures of gold mine tailings (GMT) and geopolymer sample were determined by XRD analysis. The XRD patterns of samples were presented in Fig. 2.
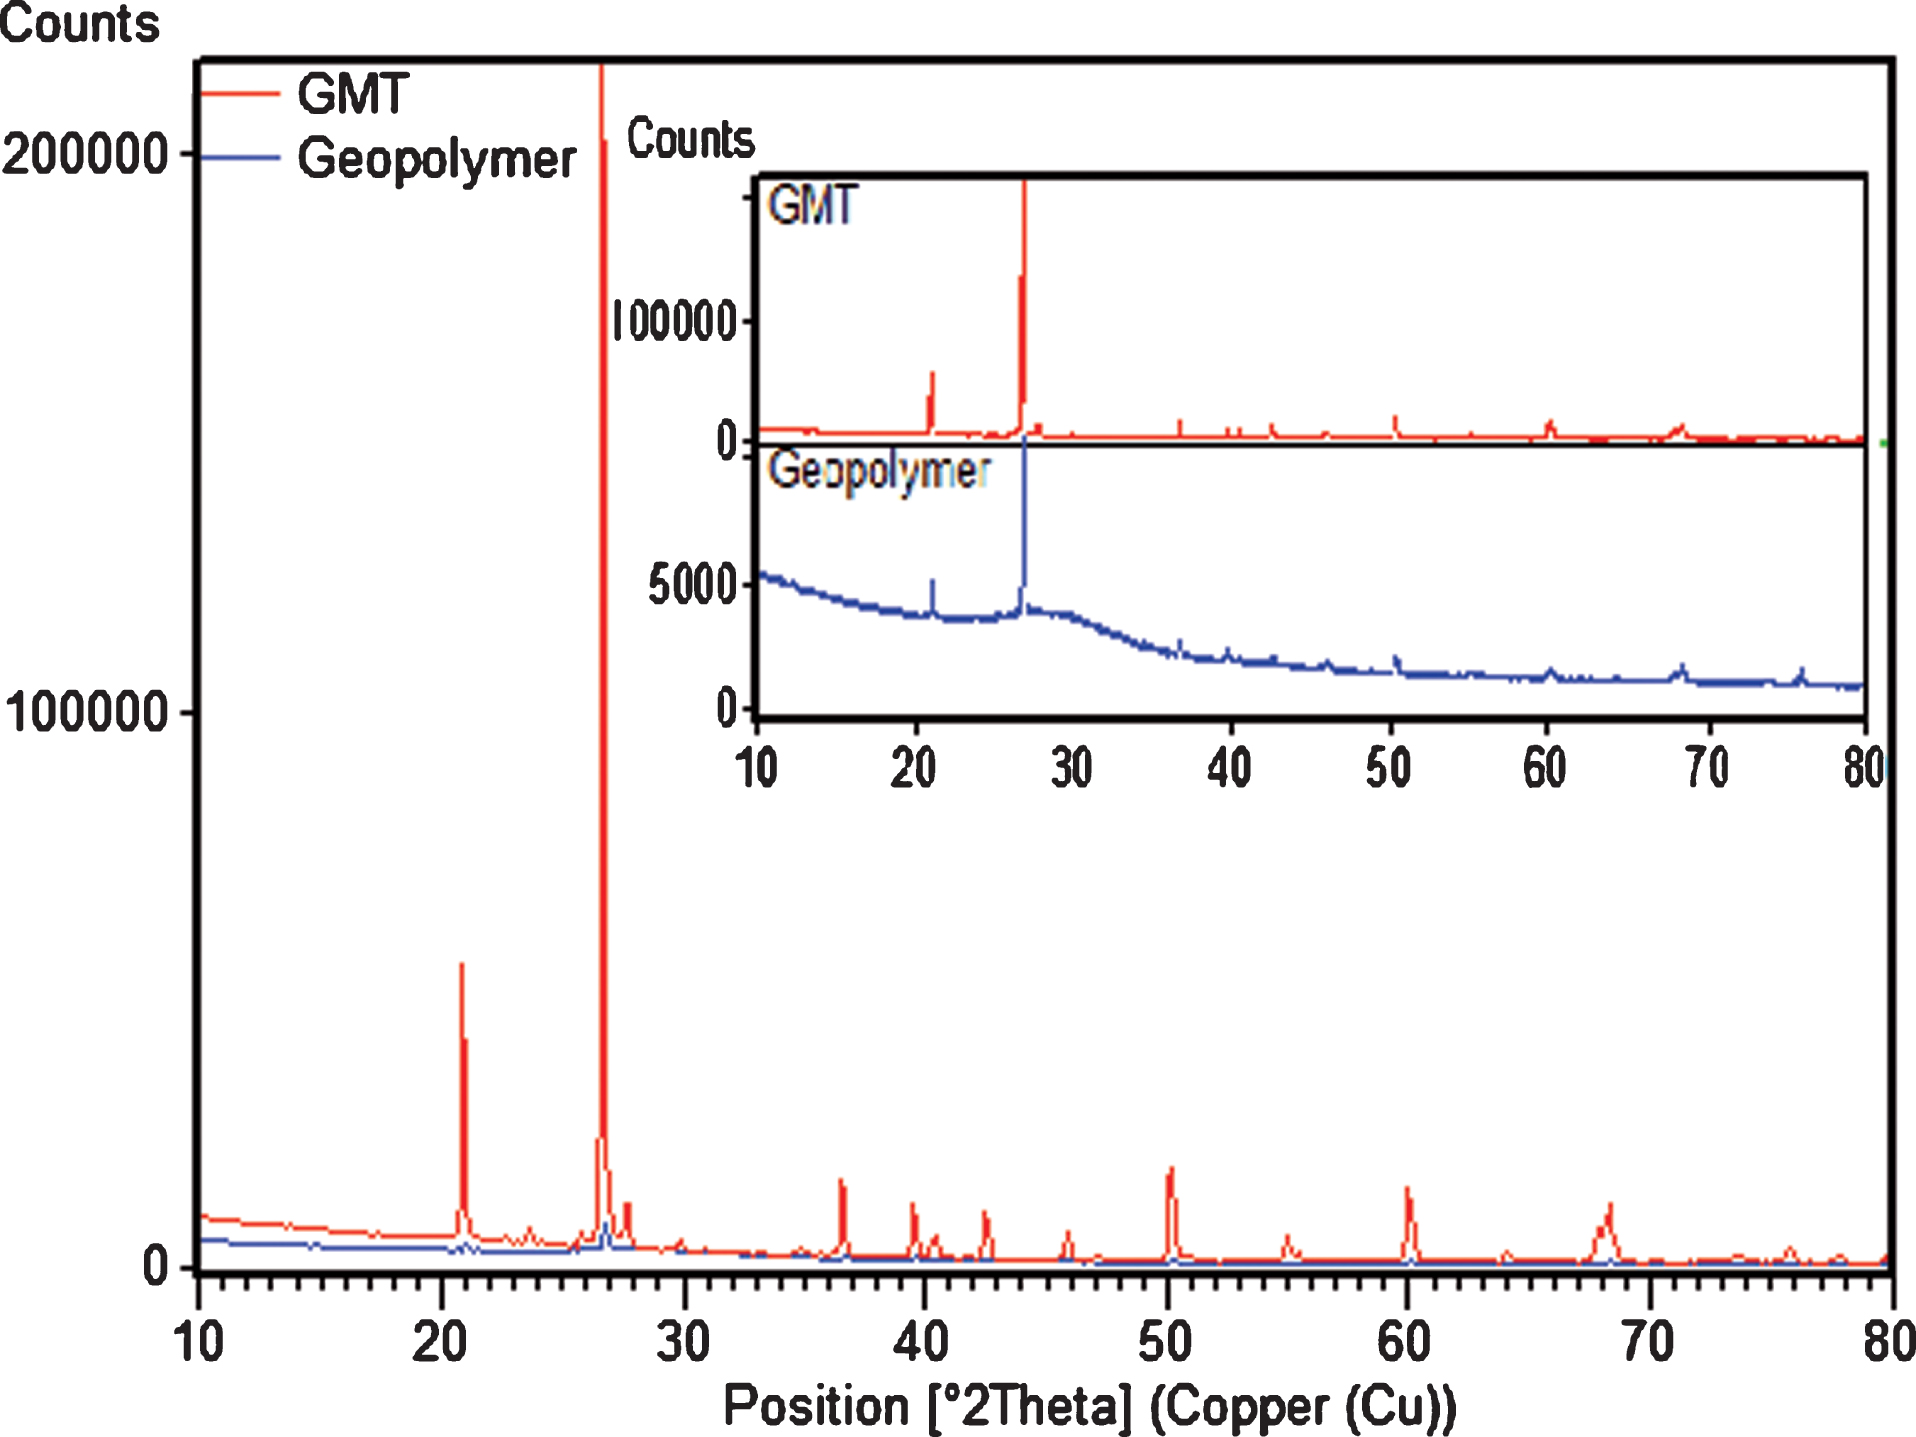
The XRD patterns of the GMT and geopolymer sample.
The peaks which are seen at 2θ= 21° and 26° diffraction angles indicate major crystalline silica phase (Ref Code:00-033-1161). When the XRD pattern of the geopolymer sample was investigated it is seen that silica peaks of geopolymer have lower counts according to GMT at the same diffraction angles. This is compatible with the geopolymer structure.
FT-IR analysis was performed to the geopolymer and Fig. 3 shows the FT-IR graphics.
The bands at 3462 and 3417 cm–1 are related to stretching (–OH) and bending (H–O–H) vibrations of water molecules. The band at around 1079 cm–1 in gold mine tailings attributed to the Si–O–Si or Al–O–Si asymmetric stretching mode. This band shifted to lower wavenumber (991 cm–1) in the FT-IR spectra of geopolymers. This shift indicates an amorphous aluminosilicate gel phase formation. This amorphization is also seen in the XRD results. The band at around 779 cm–1 which is seen on the gold mine tailings structure related to stretching vibration of 6-fold coordinated Al (6) –OH and 6-fold coordinated Al (6) –O. After the geopolymerization process, it is shifted to 708 cm–1 due to conversion to the4-coordinated structure on the framework [12].
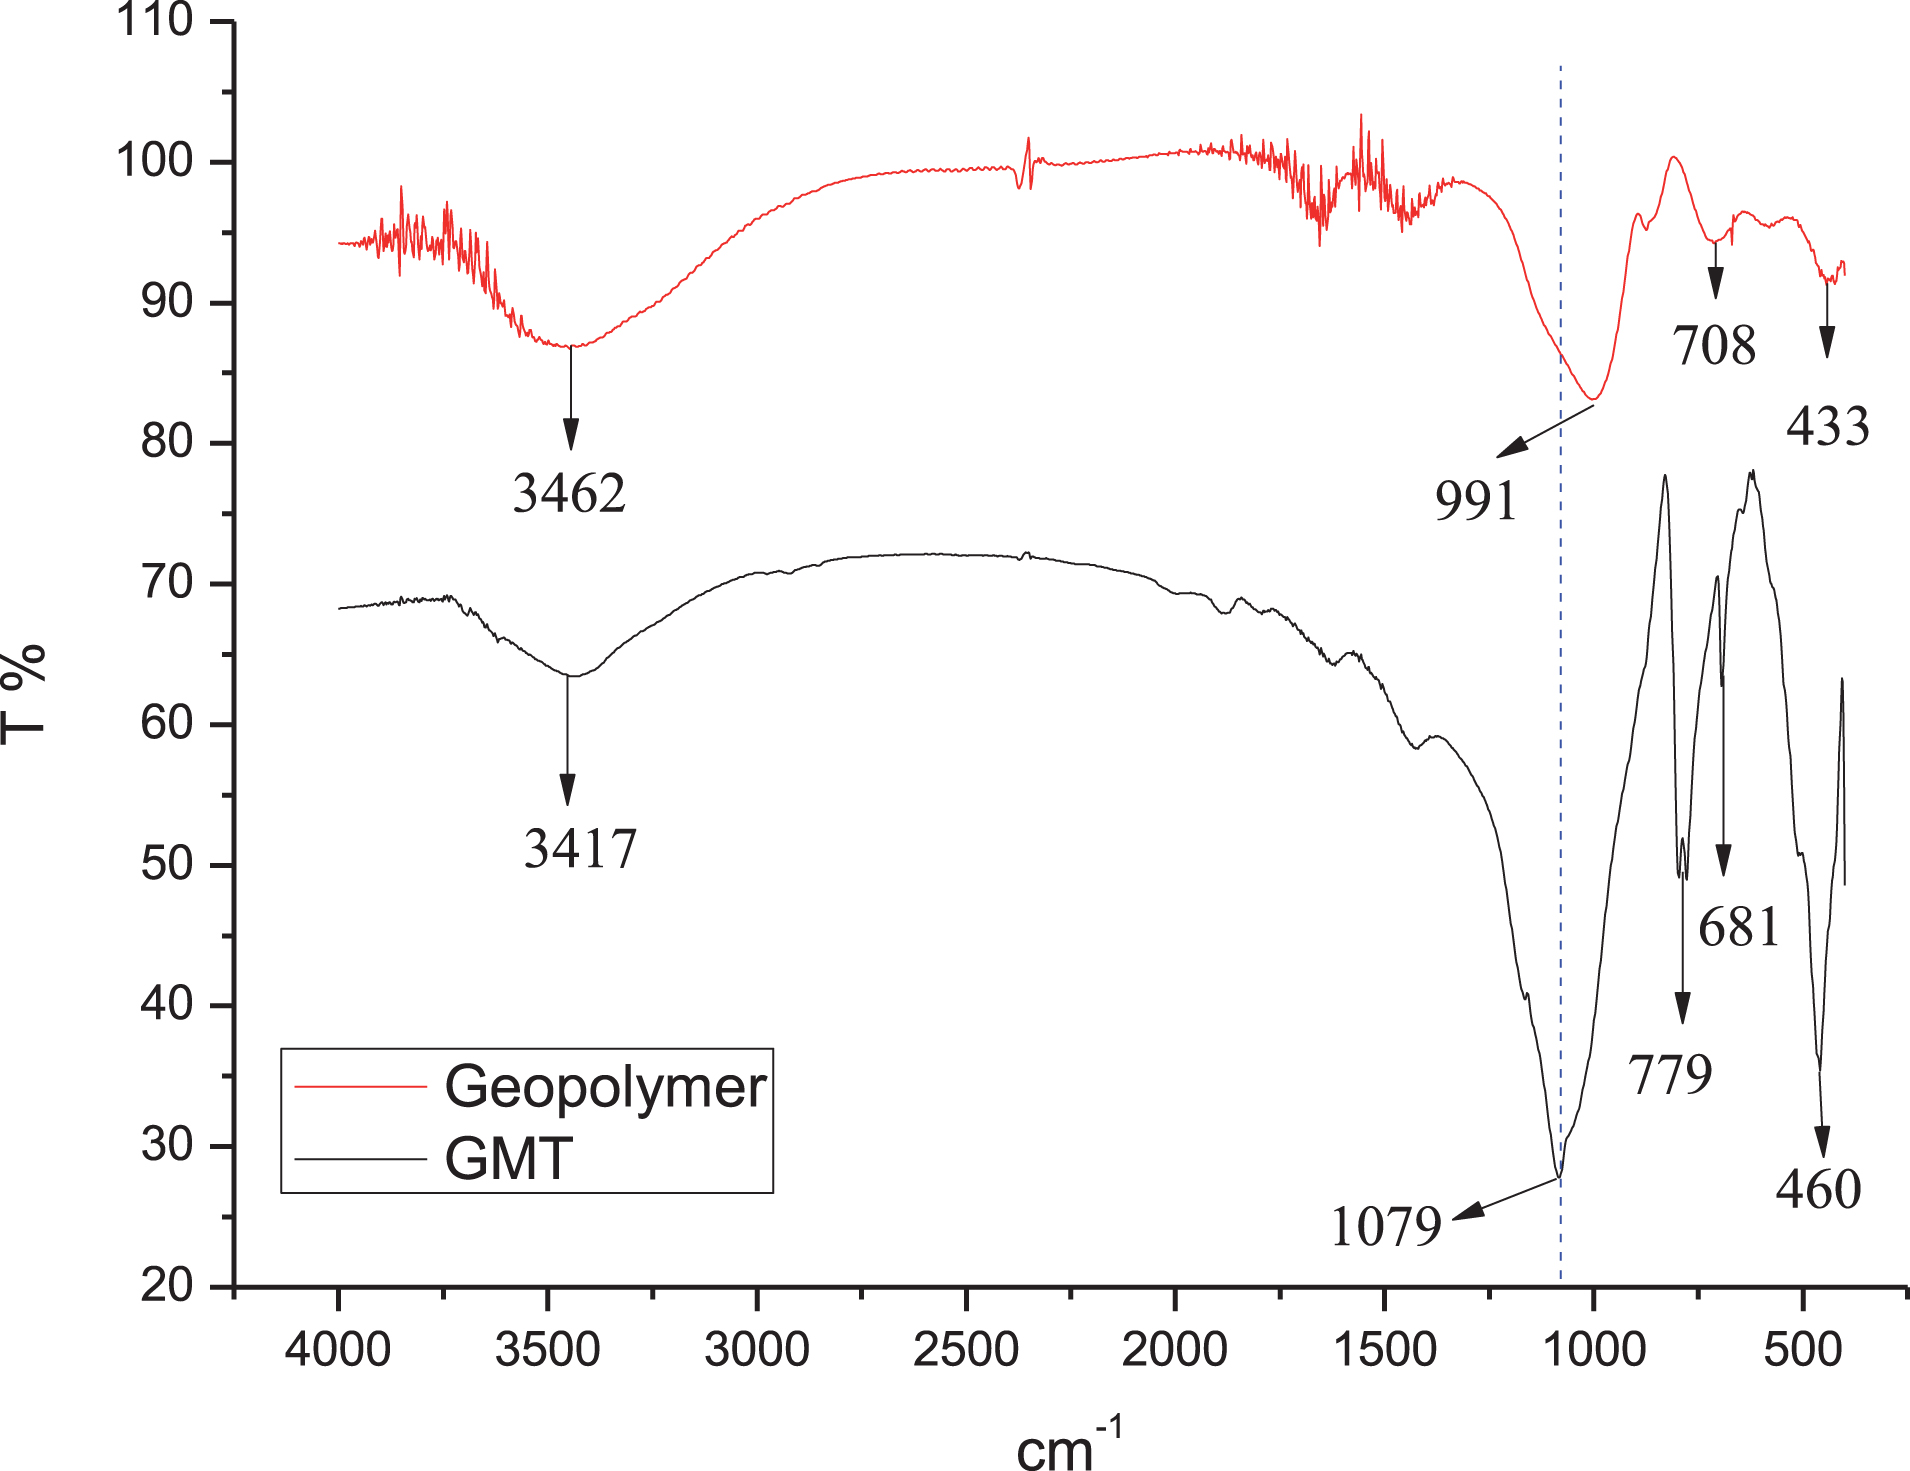
FT-IR spectra of GMT and geopolymer samples.
Morphology changes of gold mine tailings and geopolymer were investigated with SEM analysis. Figures 4 and 5 show the SEM analysis of gold mine tailings and geopolymer sample, respectively. According to the SEM results, surface porosity was increased after geopolymerization.

SEM analysis of gold mine tailings.

SEM analysis of geopolymer sample.
Surface Area and Pore Size Analyzer was used for determining the surface characteristics of the samples. Results of BET Analysis were given in Table 2.
BET analysis results
The results show that the geopolymerization process increases the surface area of gold mine tailings.
Effect of geopolymer dosage
To determine the Cu2+ adsorption efficiency of geopolymer, adsorption experiments were carried out at 60 mg/L Cu2+ ion solutions with varying adsorbent doses between 0.3 g/L–2.4 g/L at 25°C for 120 min. The results are given in Fig. 6.

Effect of geopolymer dosage to Cu2+ removal.
The adsorbent dosage investigation is an important factor which determines the required adsorbent amount for a particular initial concentration [1]. When the results were evaluated, it was seen that the removal efficiency of Cu2+ rises 21.58% to 99.39% as the adsorbent dosage increases from 0.3 g/L to 2.4 g/L. The sharp increase in removal efficiency was noticed in 1.12 g/L. The get up to removal efficiency reaches 99%, shows that the adsorption reaches its maximum efficiency.
When the literature studies was investigated it was seen that Al-Harahsheh et al. studied about Cu adsorption by using fly ash based geopolymer. According to the results, increase of the geopolymer dosage from 0.6 g/L to 3.0 g/L provides increase of the adsorption efficiency from 45% to 88.2% [1].
In order to determine the effect of contact time on Cu2+ removal, 1, 5, 15, 30, 60, 120 min were examined as contact time at 60 mg/L of solution concentration and with 1 g/L of adsorbent. The results are shown in Fig. 7.
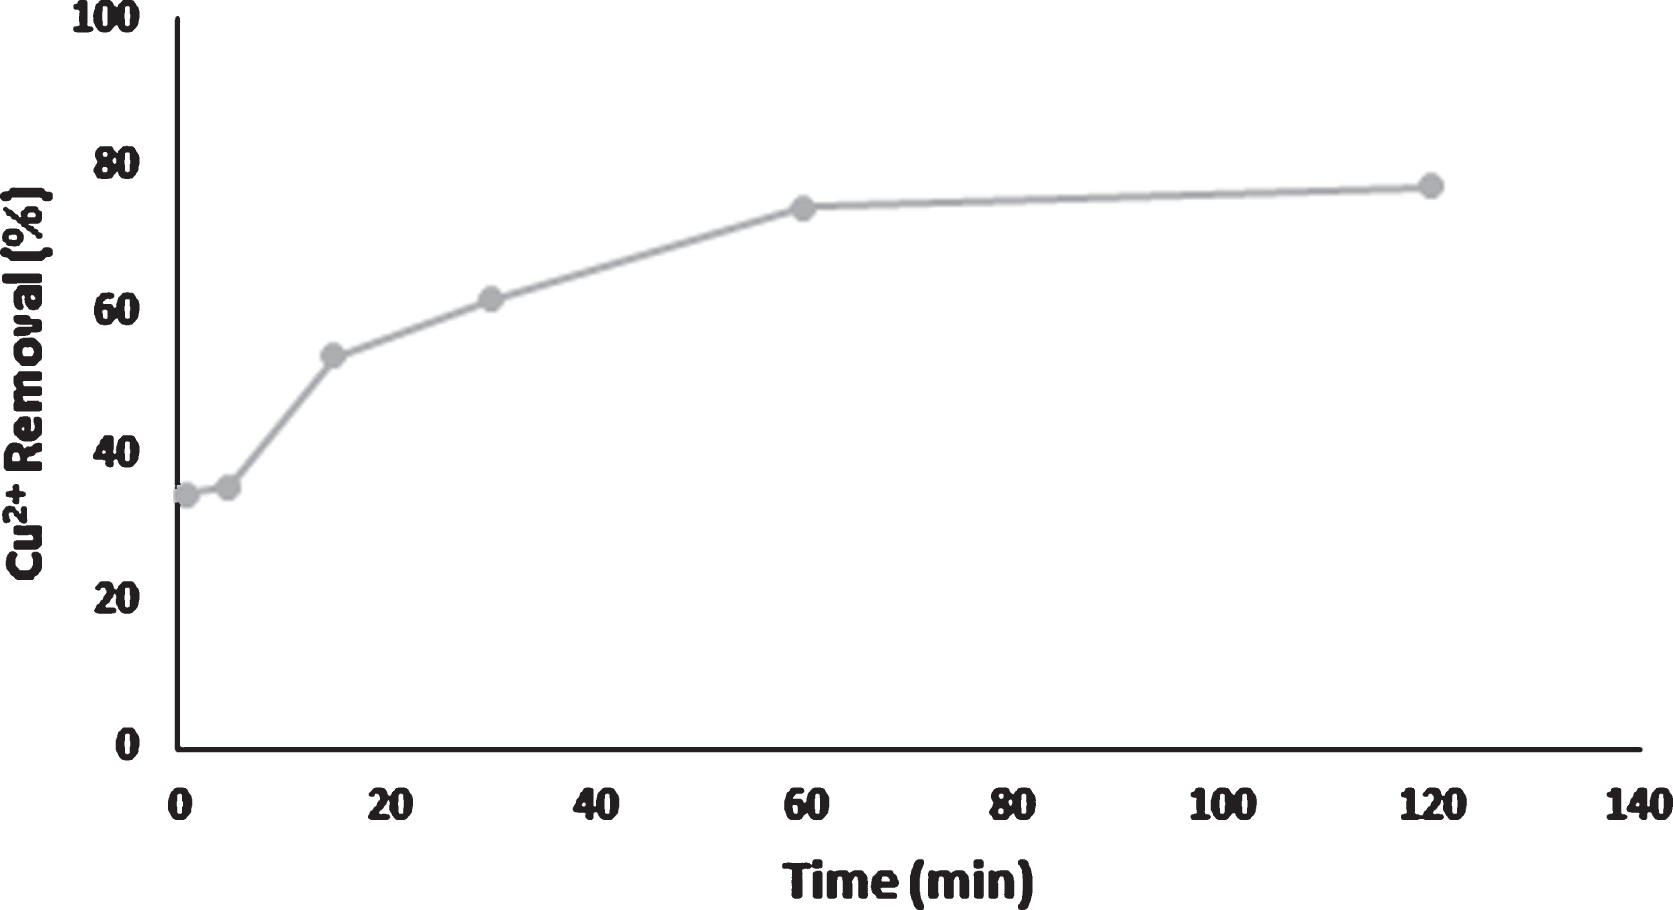
Effect of contact time to Cu2+ removal.
Cu2+ ions adsorption increases with time according to Fig. 7. When the literature studies and examined study take into consideration, 120 min is determined as suitable times for Cu2+ adsorption from the water and the contact time of 120 min was applied in all adsorption studies [13, 14].
Adsorption studies were made at a different temperatures such as 25, 35 and 45°C. Values of pH, geopolymer dosage and contact time were kept constant at 4, 0.4 g/L and 120 min, respectively. Figure 8 shows the change in Cu2+ removal percentage depend on temperature.

Effect of temperature to Cu2+ removal.
When the results are evaluated, it can be seen that adsorption of Cu2+ ions increases with the increase of temperature. Literature studies confirm the results because temperature increase provides the formation of micro-cavities in the geopolymer and this formation increased the adsorption capacity [14, 15]. Also, metal ion removal is enhanced as the temperature increases [1].
Cu2+ removal percentages were determined in the range of 15 ppm to 60 ppm Cu2+ solutions. The experiments were carried out at a temperature of 25°C using a geopolymer dosage of 0.4 g/L for a 120 min contact time. The results are given in Fig. 9. The increase of metal ion concentration from 15 ppm to 60 ppm causes to decrease in adsorption efficiency from 99.64 to 76.88%.

Effect of initial concentration to Cu2+ removal.
Adsorption isotherms show the interaction between adsorbate and adsorbents and they provide to calculate optimum adsorbent yield [15].
When the literature studies about the adsorption are examined it is seen that there are various adsorption isotherms which give information about the adsorption process [16, 17]. In this study, Langmuir, Freundlich and Tempkin isotherm models were used to explain adsorption mechanism. The formulas and explanation of models are given in Table 3.
Adsorption isotherm models of the study
Adsorption isotherm models of the study
Table 3 also shows the R2 values of the models. According to R2 results, the suitable model was chosen as Langmuir. Cu2+ adsorption onto the geopolymer surface is monolayer adsorption. KL, RL and qmax values of Langmuir model was calculated by using the graphic which is given at Fig. 10. KL value and qmax value were calculated as 42087.54 and 46.297 mg/g, respectively. The obtained RL values were between 0 and 1 which shows the adsorption Cu2+ was favourable onto geopolymer structure.
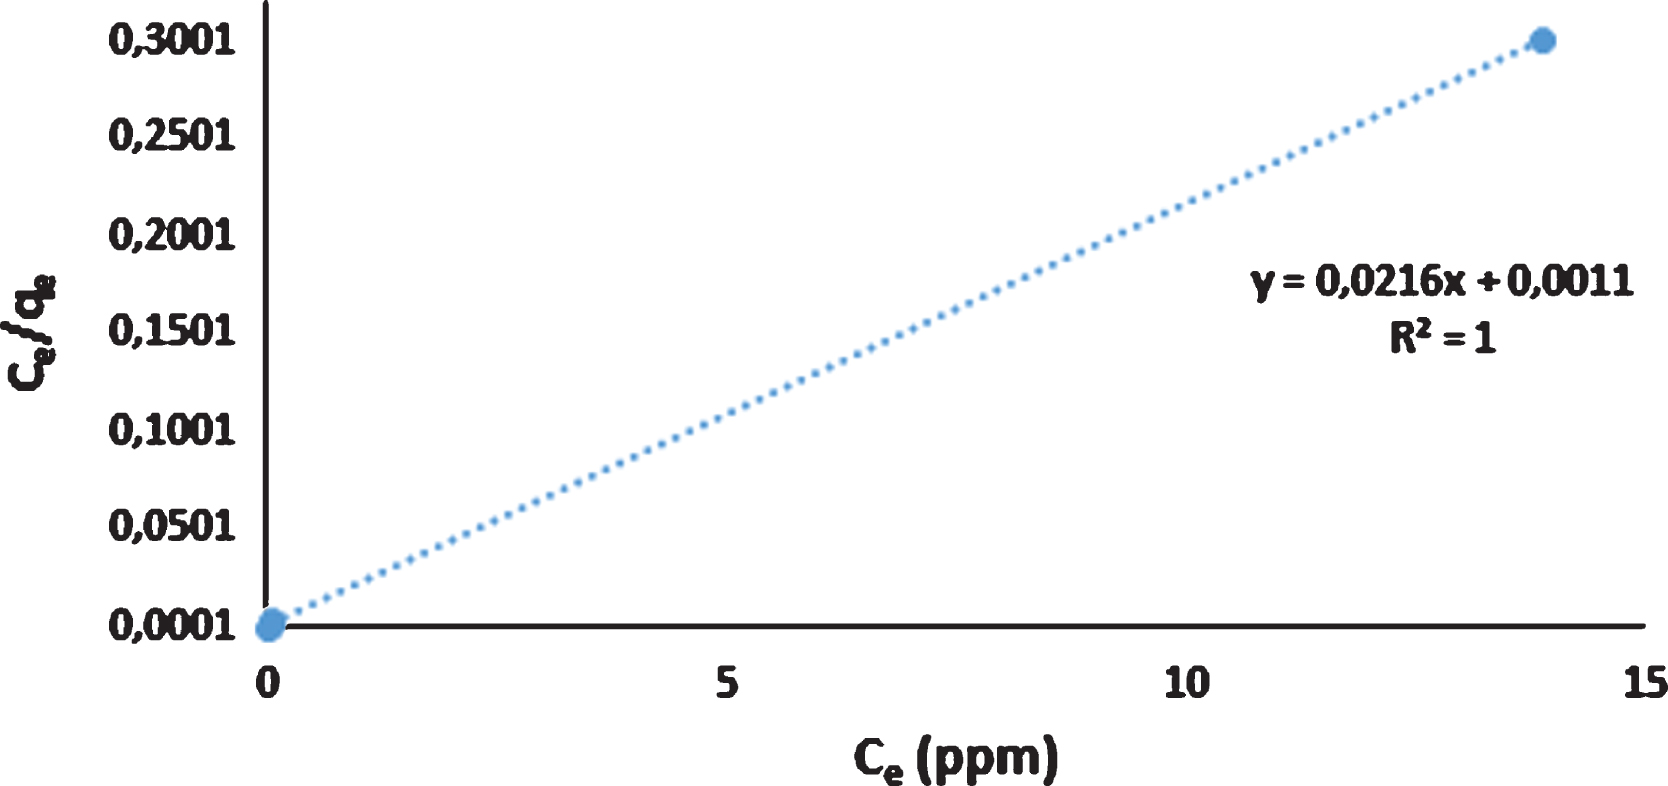
Langmuir isotherm models of adsorption study.
Adsorption kinetic models are used to determine the adsorption rate and mechanism [18]. There are various adsorption kinetic models to take information about the adsorption process. In this study, Pseudo-first-order and Pseudo-second-order kinetic models were used. The formulas, explanation and R2 values of models are given in Table 4.
Adsorption kinetic models of study
Adsorption kinetic models of study
Pseudo first order model is used to explain sorption of solid/liquid systems [19]. Another simple kinetic model is the Pseudo second order kinetic model which is firstly proposed by Blanchard et al to explain the kinetics of heavy metal removal by natural zeolites. Today, this kinetic model is the most commonly used to description and correlation of the kinetic data in solid/solution sorption systems [20]. When the results are investigated it is seen that Pseudo-second order kinetic model is more suitable than Pseudo first order kinetic model. k2 and qe values of Pseudo second-order kinetic model was calculated as 0.00452 and 47.6190 by using the graphic which is given in Fig. 11.
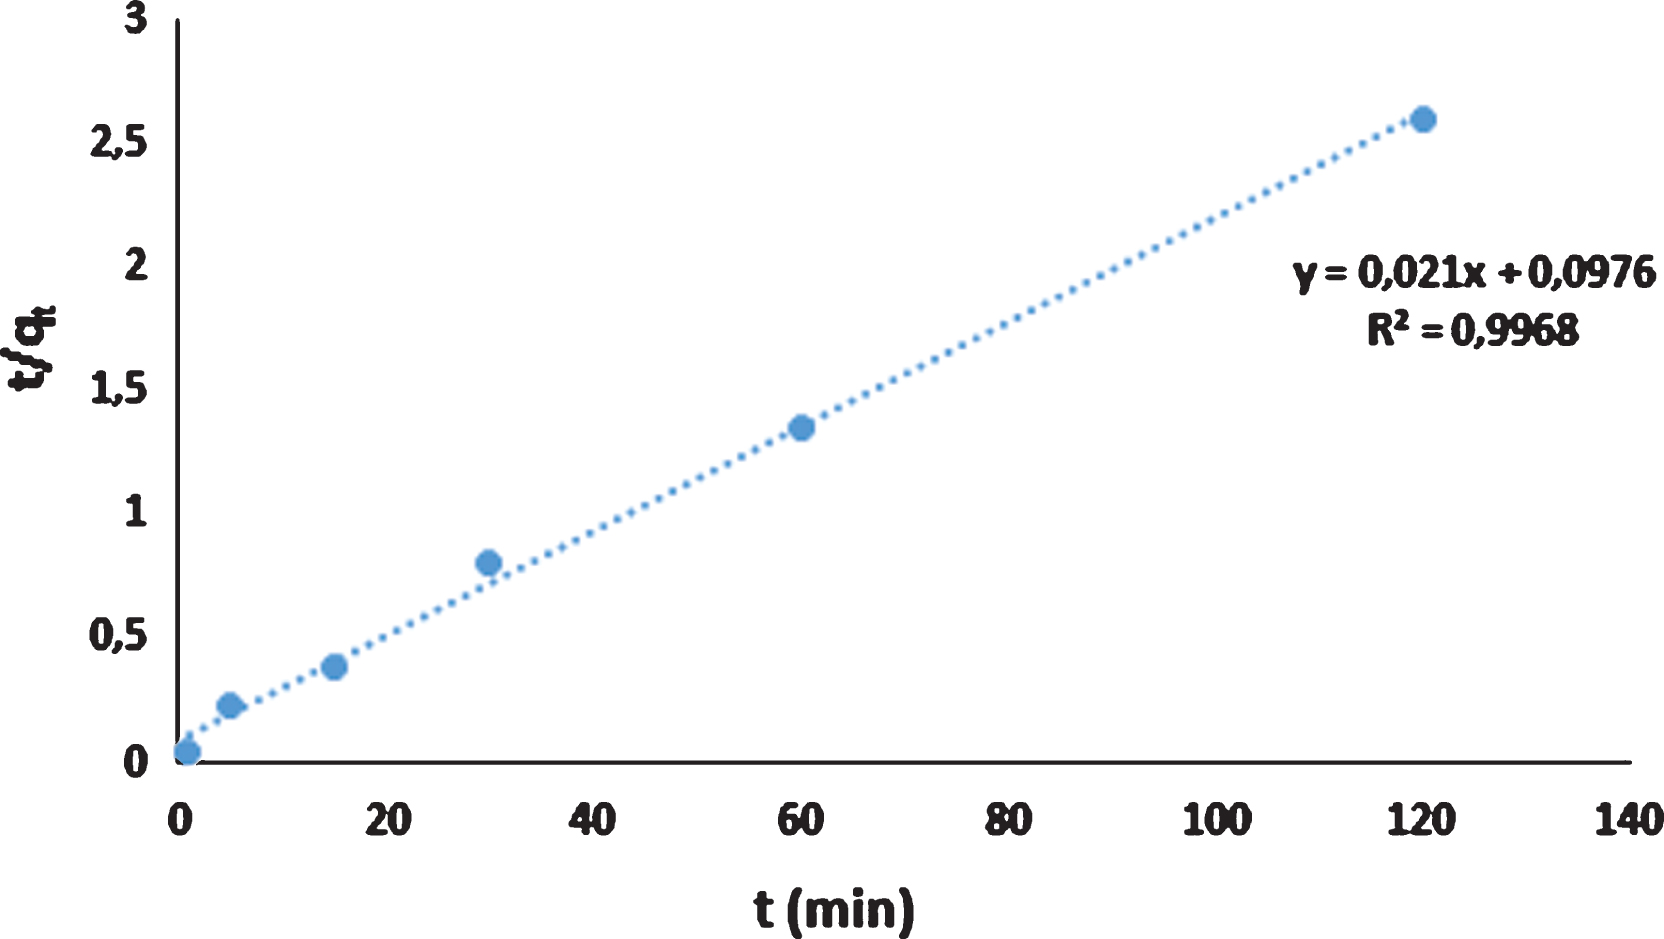
Pseudo-second order isotherm models of adsorption study.
The pseudo-second-order model express that rate limiting step might be chemisorption. For this reason, the adsorption process which carried out by using synthesized geopolymer sample was accepted as chemisorption [1].
In the present study, geopolymer, which was produced by using gold mine tailings, was used in adsorption studies. For characterization of gold mine tailings and geopolymer sample, XRF, XRD, FT-IR, BET and SEM analysis were applied to samples. Characterization results showed that after geopolymerization process the gold mine tailings structure changed to geopolymer structure and surface area increased from 3.845 m2/g to 74.916 m2/g. The SEM analyzes show that the surface becomes porous structure. According to the results synthesized geopolymer sample is suitable for adsorption studies. In the Cu2+ adsorption study, various parameters such as temperature, initial concentration, adsorbent dose were examined and also the adsorption kinetics and isotherms were examined. The results showed that the Langmuir isotherm model is the most suitable model which indicated the monolayer Cu2+ adsorption onto gold mine tailing based geopolymer. The kinetic model studies demonstrated that Pseudo-second order kinetic model was the most appropriate model which explained the adsorption mechanism of Cu2+ occurred as chemical adsorption.
Footnotes
Acknowledgments
This work was supported by Research Fund of the Yildiz Technical University. Project Number: FBA-2017-3053.