



Abstract
In this work, we study the influences of nano-sized WC particles (diameter size of ∼50 nm), concentrations on the structure, surface morphology, mechanical and electrochemical properties of Ni-WC composite coatings electrodeposited on pretreated copper substrates. The corrosion behavior of Ni-WC composite coatings was studied by the potentiodynamic polarization and electrochemical impedance spectroscopy (EIS) methods in two corrosion media (0.1 M HCl) and (3.5% NaCl). EDS analysis affirms that WC is the incorporated particles and nickel is the blinder metal. The incorporation of WC particles in the nickel matrix forms heterogeneous deposits that contain deep and narrow pores. XRD pattern indicates good crystal structure with (110), (111), (200) and (311) preferred growth orientations. The reinforcement of Ni matrix by nan-sized WC particles refines the grains size of the coatings. Microhardness and roughness of the deposits increase with the increase of WC concentration in the electrolyte bath. Based on the lowest corrosion density and the highest charge transfer resistance value, corrosion tests show that the samples 4 g/L and 1 g/L immersed in the corrosive media of 3.5% NaCl and 0.1 M HCl are the optimum conditions, respectively.
Introduction
During the last decades, researchers have tried to improve the properties of metal matrix coatings by reinforcing it with fibers or particles which are characterized generally by rigid, strong and light such as oxide (Al2O3, TiO2, SiO2) or carbide (SiC, WC) particles, diamond, solid lubricant (PTFE, graphite or MoS2), or even microcapsules containing liquid [1–4]. Several methods were used for deposition of metal matrix coatings, such as high velocity oxy-fuel (HVOF) thermal spraying [5], laser [6], and electrodeposition [7–10]. Among these techniques, electrodeposition is one of the most technologically feasible and inexpensive tool to produce materials from thick metallic deposits with very large surface area to ultra-thin metallic films of a few nanometers [11, 12].
In general, MMC Nickel is widely used as metal matrix, reinforced by cemented carbides. These carbide materials are commonly applied in many industrial applications, including cutting tools, geo-engineering equipment and wear-resistant parts [13]. WC is broadly utilized as reinforcement due to its wettability in molten metal and high hardness [8, 14].
In addition, Tungsten carbide (WC) is one of the most suitable candidates, especially for solving corrosion-related problems in various engineering applications due to its high hardness, strength and fracture toughness [15]. Recently, the studies showed that Ni/WC composites have good corrosion resistance in solutions containing chloride [16]. However, the WC particles tended to sink to the bottom of the coating due to agitation movement in the electrolyte bath [17]. Therefore, the fabrication of Ni/WC composite coatings via electro-deposition depend on several parameters such as metal matrix concentration, current density, pH, temperature, and concentration of second phase particles in the suspension [18].
The properties of Ni-WC composite coatings have been investigated in several articles. Surender et al. [19] found that the compositional electroplating efficiency of WC in nickel matrix increased as well as the current density from 0.1 to 0.3 A/cm2. Hui et al. [20] investigated the effect of deposition current density and temperature, it is reported that the grain orientation of the coating gradually changed from (111) to (200) and (220). At 50 A/dm2 and 30°C, the coating has a (111) fully oriented structure [20]. Zakia et al. [21] disclosed that the corrosion rate decreased with increasing WC concentration. The corrosion rate decreased from 0.08 A/cm2 to 0.14 A/cm2 with current density and then increased slightly at current density of 0.20 A/cm2. Hui et al. [20] mentioned that the average microhardness increases with the content of WC particles. This is because the WC particles can help strengthen the coating structure.
In this study, Ni-WC hard metal coatings were electrodeposited on pretreated copper substrates with different WC concentrations to investigate their effects on physical, mechanical and electrochemical properties. The corrosion resistance study of Ni-WC coatings in 3.5% NaCl electrolyte as seawater compensation has been discussed in various studies. Chlorine acid is widely used in the synthetic industry, often for various applications such as chemical pickling of steel and laboratory products [22]. Hydrochloric acid has two types of ionic species that actively attack metallic elements. Hydrochloric acid, containing proton and chloride ion (Cl-), has a higher corrosion rate compared to other types of electrolytes [23]. Cl- ions attack cracks and porous materials [24]. This work investigates the effect of Cl- ions found in NaCl and HCl on the structure of Ni-WC cemented carbide coatings. Corrosion behavior was studied using potentiodynamic polarization and electrochemical impedance spectroscopy.
Materials and methods
Electrodeposition of Ni-WC composite coatings
All the reagents were used without further purification and they were analytically pure. The Ni/WC composite coatings were deposited on a pretreated copper substrate (3 cm * 3 cm) which were used as cathode and nickel plate (2 cm * 2 cm) of commercial purity (99,99%) as anode. The electrolyte contains nickel chloride (NiCl2.H2O), Ammonium chloride (NH4Cl), boric acid (H3BO3), and sodium chloride (NaCl). WC particles (50 nm) were added to the electrolyte in the range of 1–5 g/l (Table 1). The electrolyte premixed and stirred for 24 h. Prior to deposition, the substrates were degreased in alkaline solution containing 50 g/l Na2CO3 + 15 g/l NaOH and at 3 A/dm2 to remove oils and greases. The traces of oxide were removed by pickling the substrates in 10% HCl solution (Fig. 1).
Chemical composition and working conditions of Ni-WC electrolyte
Chemical composition and working conditions of Ni-WC electrolyte

Schematic diagram of the electrodeposition process to synthesis Ni–WC composite coatings.
To evaluate the mechanical properties, microhardness test was conducted using Vickers microhardness tester machine (Zwick/Roell) with a load of 50 gf. An average of vive measurements was obtained. The morphology and the microstructure of the coatings were investigated using a JSM-6390 Lv scanning electron microscopy (SEM). EDS Analysis was used to define the chemical composition of the coatings. Crystallite growth and phase composition of the coatings were analyzed by XRD method using a Bruker diffractometer (D8 Advance model) with Cu Kα-radiation (1.5406 A). The roughness and thickness were determined using a profilometer (Tencor P-7).
The corrosion behavior of Ni-WC composite coatings was studied by potentiodynamic polarization method and electrochemical impedance spectroscopy (EIS) in two electrolytes (0.1 M HCl) and (3.5% NaCl). The electrochemical measurements were performed using a standard three electrode cell with the coated sample (2.85 cm2) as working electrode, a reference electrode of Ag/AgCl, and chemically inert graphite as counter electrode. This cell was connected to a potentiostat galvanostat ZRA Gamry reference 3000 operating at a scanning speed of 0.5 mV/s and in a potential range of±250 mV to the corrosion potential. Corrosion rate (mm/yr), corrosion potential Ecorr (mV), and Tafel slopes (mV/s) were calculated using the Tafel extrapolation technique provided by EC-Lab software 11.36. Electrochemical impedance spectroscopy (EIS) tests were conducted in a frequency ranging from 0.01 Hz to 100 KHz with a small amplitude signal (10 mV). The impedance diagrams are given in the Nyquist representation.
Results and Discussion
EDS analysis is used to confirm the presence of WC in the coating, as shown in Fig. 2. The results confirmed that nickel is a metal matrix with a content ranging from 58.23 to 88.50 wt%. Figure 2b shows that the WC particles are combined with the metal matrix and reach the highest value (41.02 wt%) at 2 g/l (Table 2). It can be clearly observed that the content of WC solid particles in the coating decreases as its concentration in the electrolyte bath increases. The surface structure of the Ni-WC composite coating was studied by SEM, as shown in Fig. 3. The obtained nickel deposits are uniform and dense without pores or cracks (Fig. 3a). The incorporation of WC solid particles in the nickel matrix makes the morphological structure of the deposits heterogeneous and contains deep and narrow pores. This is due to the generation of gases under the effect of applied current (Fig. 3b–f). Obviously, the distribution of WC solid particles is random, forming a cauliflower structure. Table 2 shows a summary of the data analysis of the samples. As shown in Table 2, the thickness of the coating is very close because the values are almost equal. We know that the concentration of deposited particles may slightly affect the thickness of the layer. At the same time, there are other factors that can be changed to control it, such as electrodeposition time, temperature, applied current density, etc. Benea et al. [11] have found that nanohardness of Ni-WC coatings increased by 27% compared to nickel without WC reinforcements. The hardness and roughness of the coating are positively affected by the WC concentration, which may be due to the increase in the heterogeneity of the morphology structure. The increase in hardness is due to the decrease in grains size of the deposits as the WC concentration increases [25]. As well known that the grains refinement reduce the surface roughness of the coating [5, 27]. The incorporated WC particles create new locations of nucleation on surface which leads to refinement of grains. Thus, the grain boundaries expand and hinder motion of dislocations. Hence, hardness increases [5, 28]. However, if the surface structure is porous, the surface roughness is significant [29]. The increase in porosity and surface roughness increases the specific surface area of the coatings [30].
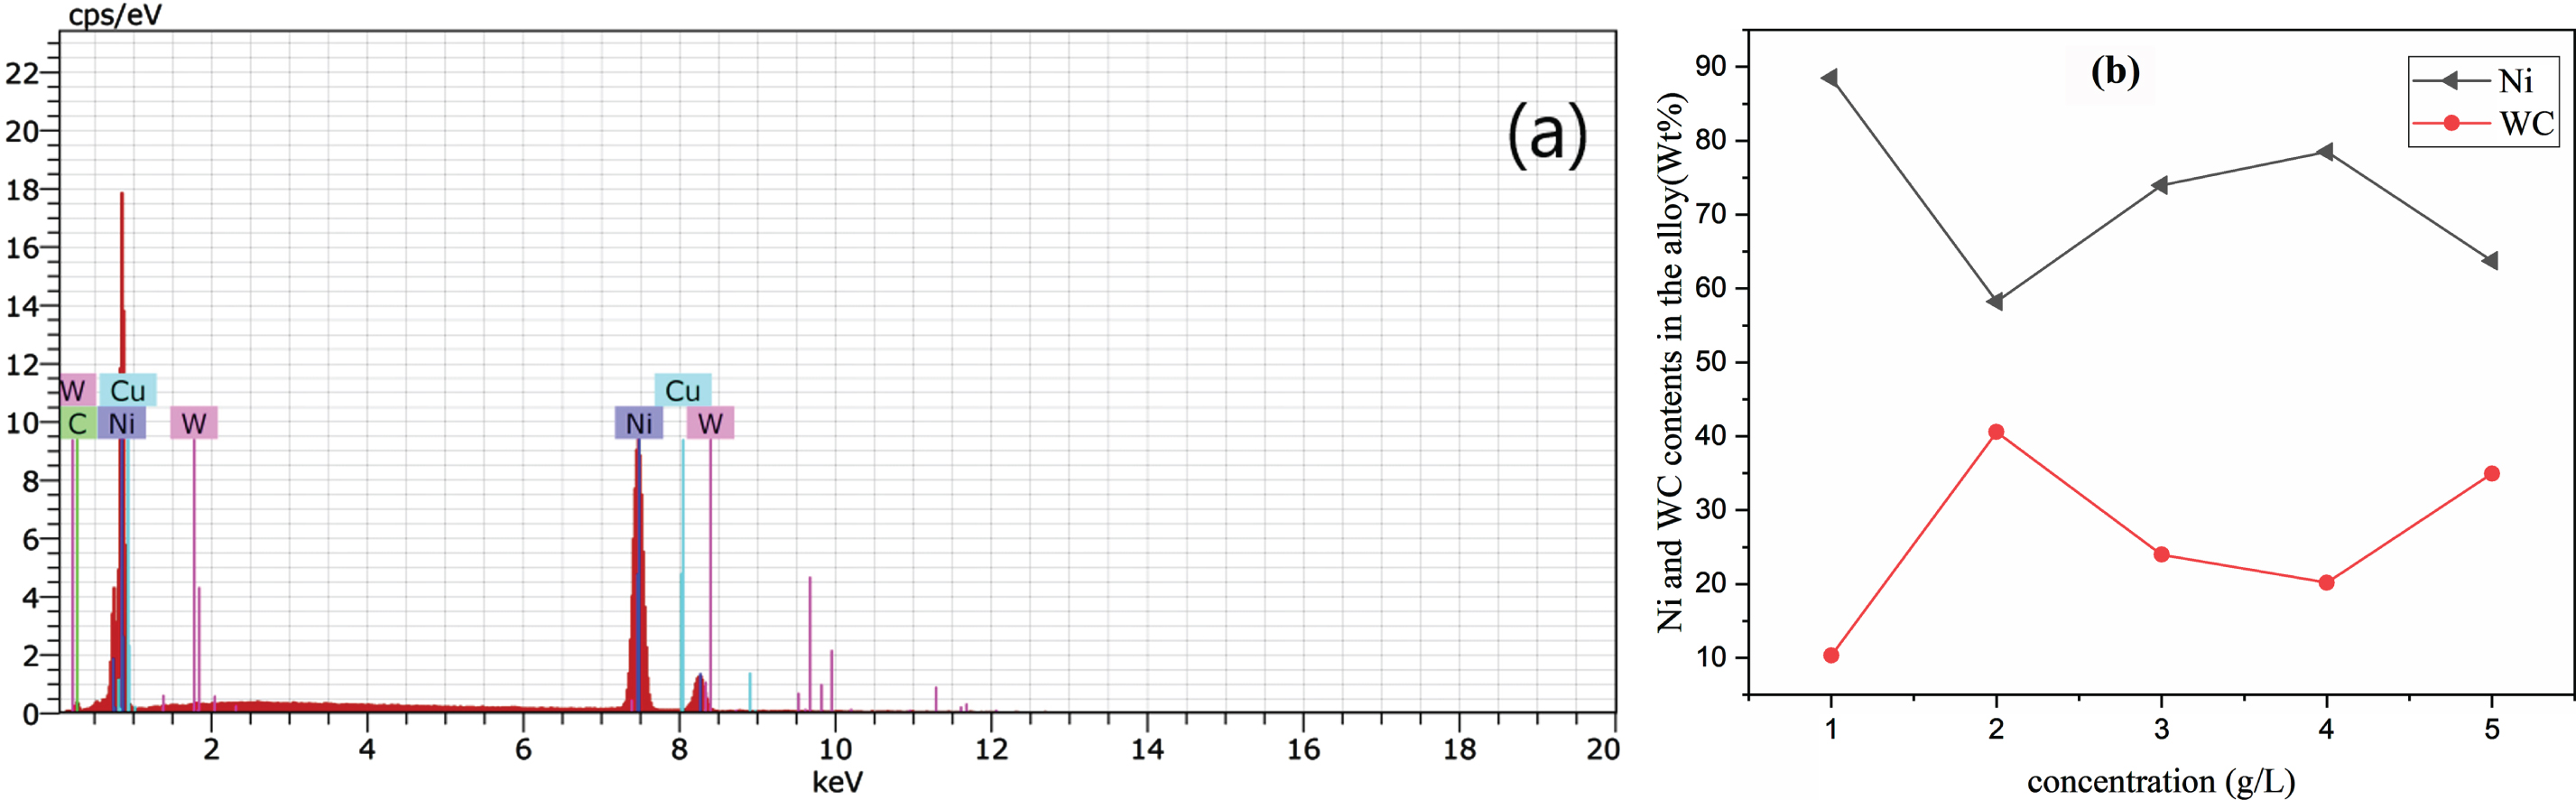
EDS analysis of Ni-WC composite coatings: (a) Ni + 1 g/l WC, (b) Ni and WC content in the samples.
Summary of analytical data

SEM observation of Ni-WC at different concentration: (a) pure Nickel, (b) Nickel + 1 g/l WC, (c) Nickel + 2 g/l WC, (d) Nickel + 3 g/l WC,(e) Nickel + 4 g/l WC, (f) Nickel + 5 g/l WC.

XRD patterns of Ni and Ni-WC composite coatings.
X-ray diffraction analysis was performed to reveal the presence of elements in the Ni-WC composite coating, as shown in Fig. 4. Broadened peaks at 2θ= 40–41 °, 44–45 °, 50–51°, 74–75 ° and 93–94 ° and crystal plants of (110), (111), (200) and (311) are corresponding to nickel (JCPDS No.001-1260), copper (JCPDS No.004-0836), tungsten (JCPDS No. 001-1203) cubic structure and hexagonal tungsten carbide structure (JCPDS No. 002-1055). In addition, it is observed that, as the concentration of WC solid particles in the composite coating increases, the intensity of the Ni peak gradually decreases, especially at a concentration of 5 g/L. The nickel diffraction peak (311) is almost undetectable, while the WC peak increases with the increase of WC concentration. The average crystal size is calculated based on the effective crystal size D calculated using the Scherrer equation modified by Warren and Biscoe, which is given in the form [31]:
where D = the average grain size, λ= the X-ray wavelength, and B = half peak width of X-ray. The average grain size of WC in the matrix varies from 204 to 226 nm. It is remarkable that the largest size is found for the concentration of 4 g/l. The grain size of Ni found between 116 to 170 nm which decreases with the rise of WC peaks intensity due to the increase of solid particle concentration.
The corrosion behavior of Ni-WC composite coating deposited on Cu at room temperature was studied. Figure 5 shows the polarization curves of different concentrations of WC solid particles in two electrolytes (3.5% NaCl, 0.1 M HCl). The electrochemical corrosion parameters were measured using the Tafel line extrapolation method and summarized in Table 3 and Table 4.
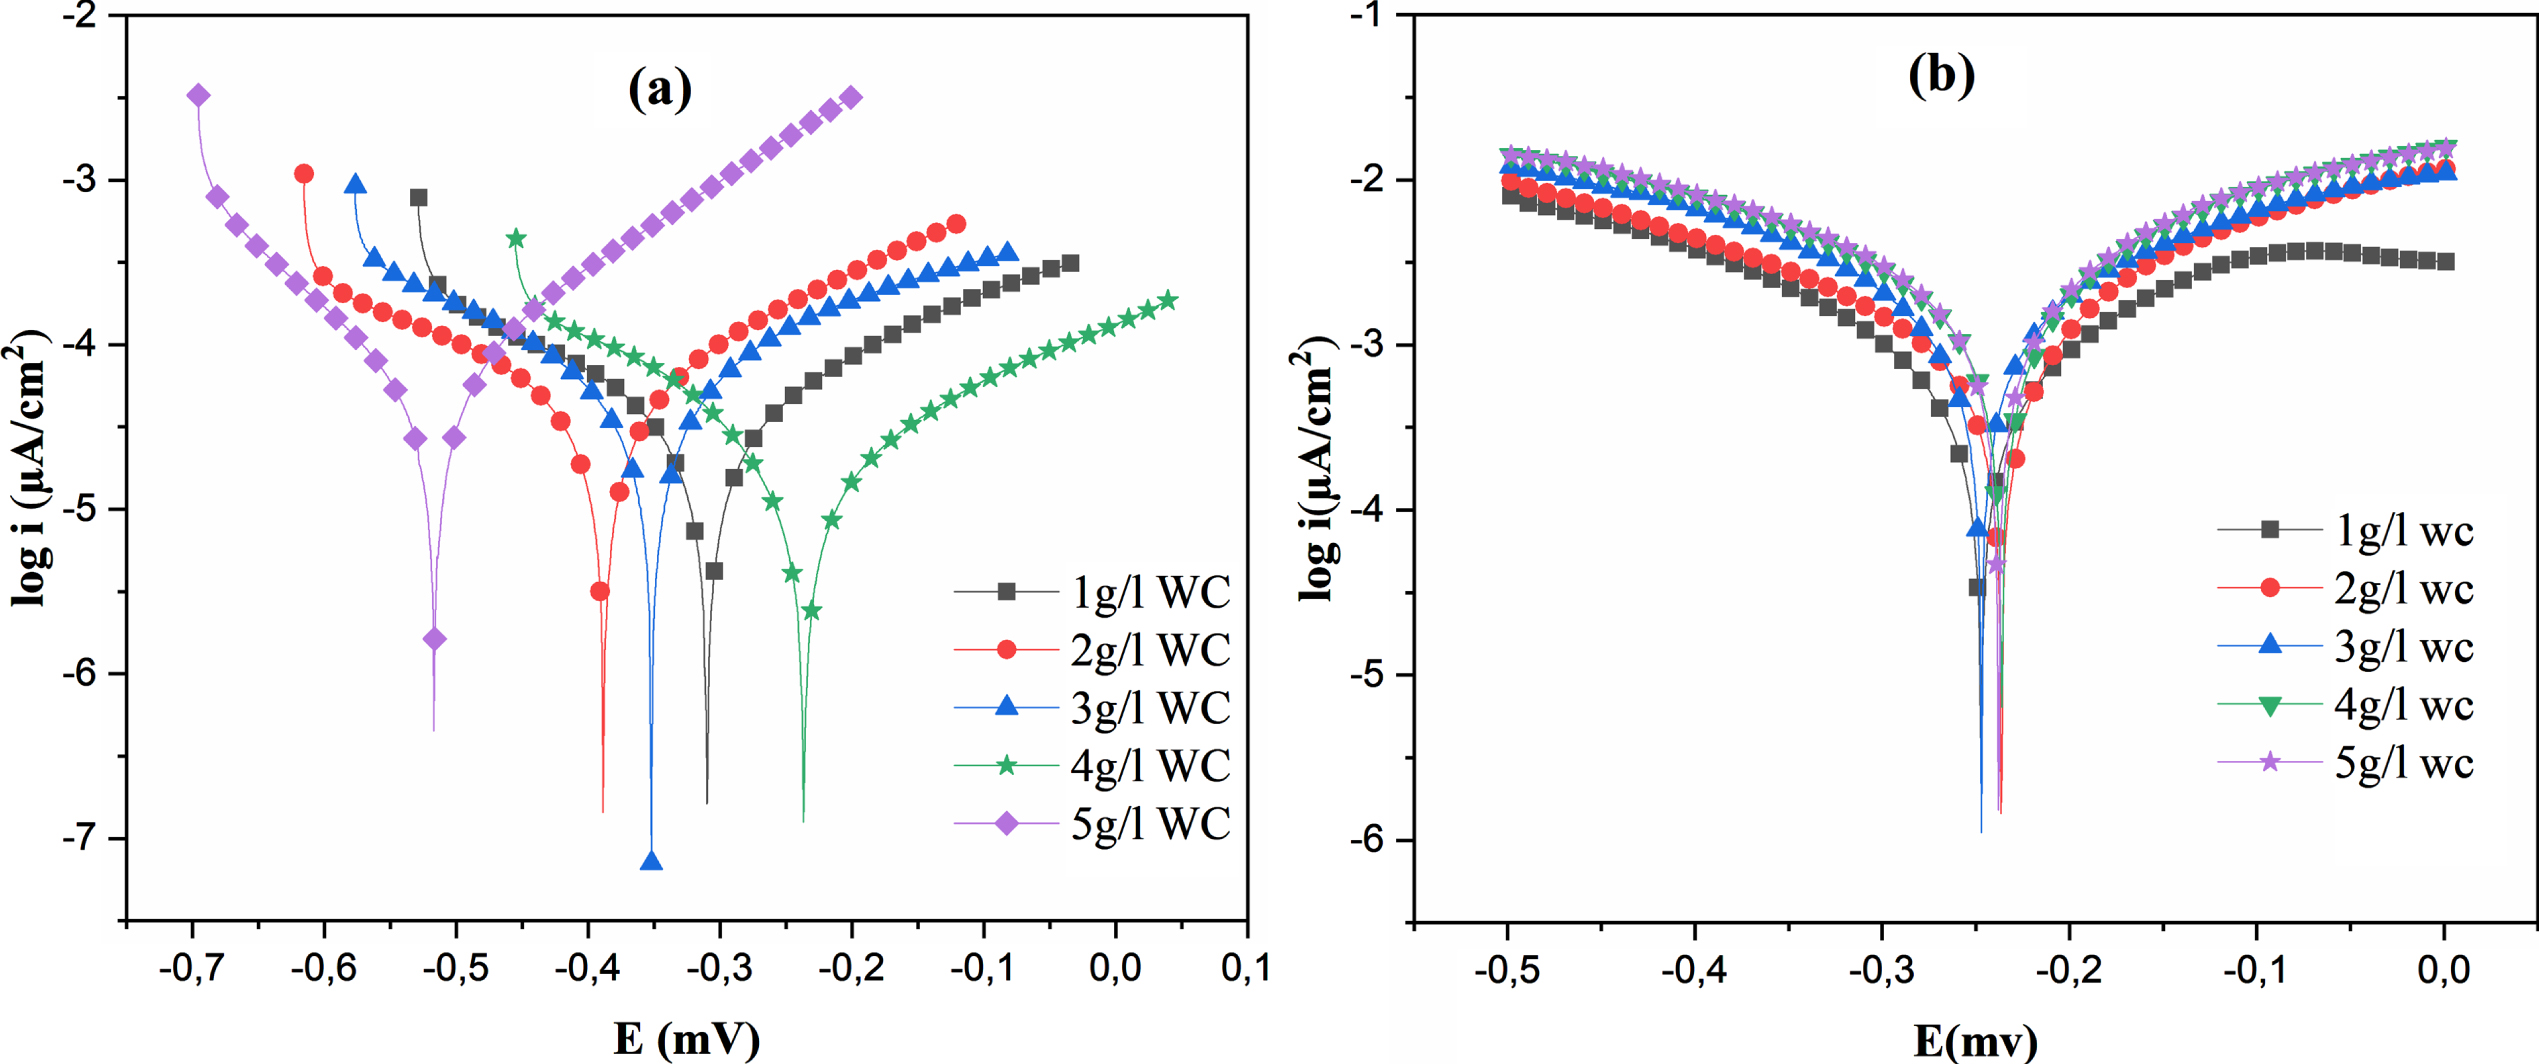
Polarization curves of Ni-WC composites coatings at different concentration of WC: (a) 3.5% NaCl, (b) 0.1 M HCl.
Results of polarization mesurements for Ni-WC samples fabricated at different concentrations in 3.5% NaCl
Results of polarization mesurements for Ni-WC alloys coatings deposited at different concentrations values in 0.1 HCl
The corrosion current density of pure Ni [32], Ni-WC [1], 40% Ni-60% WC [26] samples is found equal to 0.3981, 5.958, and 0.55μA/cm2, respectively. The increase in concentration leads to an increase in Ecorr (Table 3 and Fig. 5a) due to the lowest corrosion current density (11.60μA). 4 g/L was chosen as the optimal WC concentration. It can be clearly seen from Table 4 and Fig. 5b that the lowest current density value of the coating electrodeposited with 1 g/L WC is (75.40μA). Furthermore, the corrosion potential value increases as the increase in concentration of solid particles. In addition, the electrochemical corrosion parameters of the coating vary according to the nature of the corrosive solution, acid or salt water.
Figure 6 shows the Nyquist diagrams of the Ni-WC coating interface, obtained at the amplitude of 10 mV in 3.5% NaCl and 0.1 M HCl solutions. These graphs consist of a capacitive loop in the form of a semicircle in the high frequency (HF) region. Furthermore, this diagram allows the evaluation of solution resistance Rs at the high-frequency intersection point between the loop and the real axis, the charge transfer resistance Rtc and the capacitance CPE. The electrochemical parameters were analysed by the time constant electrochemical equivalent circuit (EEC) model and fitted using the EC-Lab program (Fig. 7).
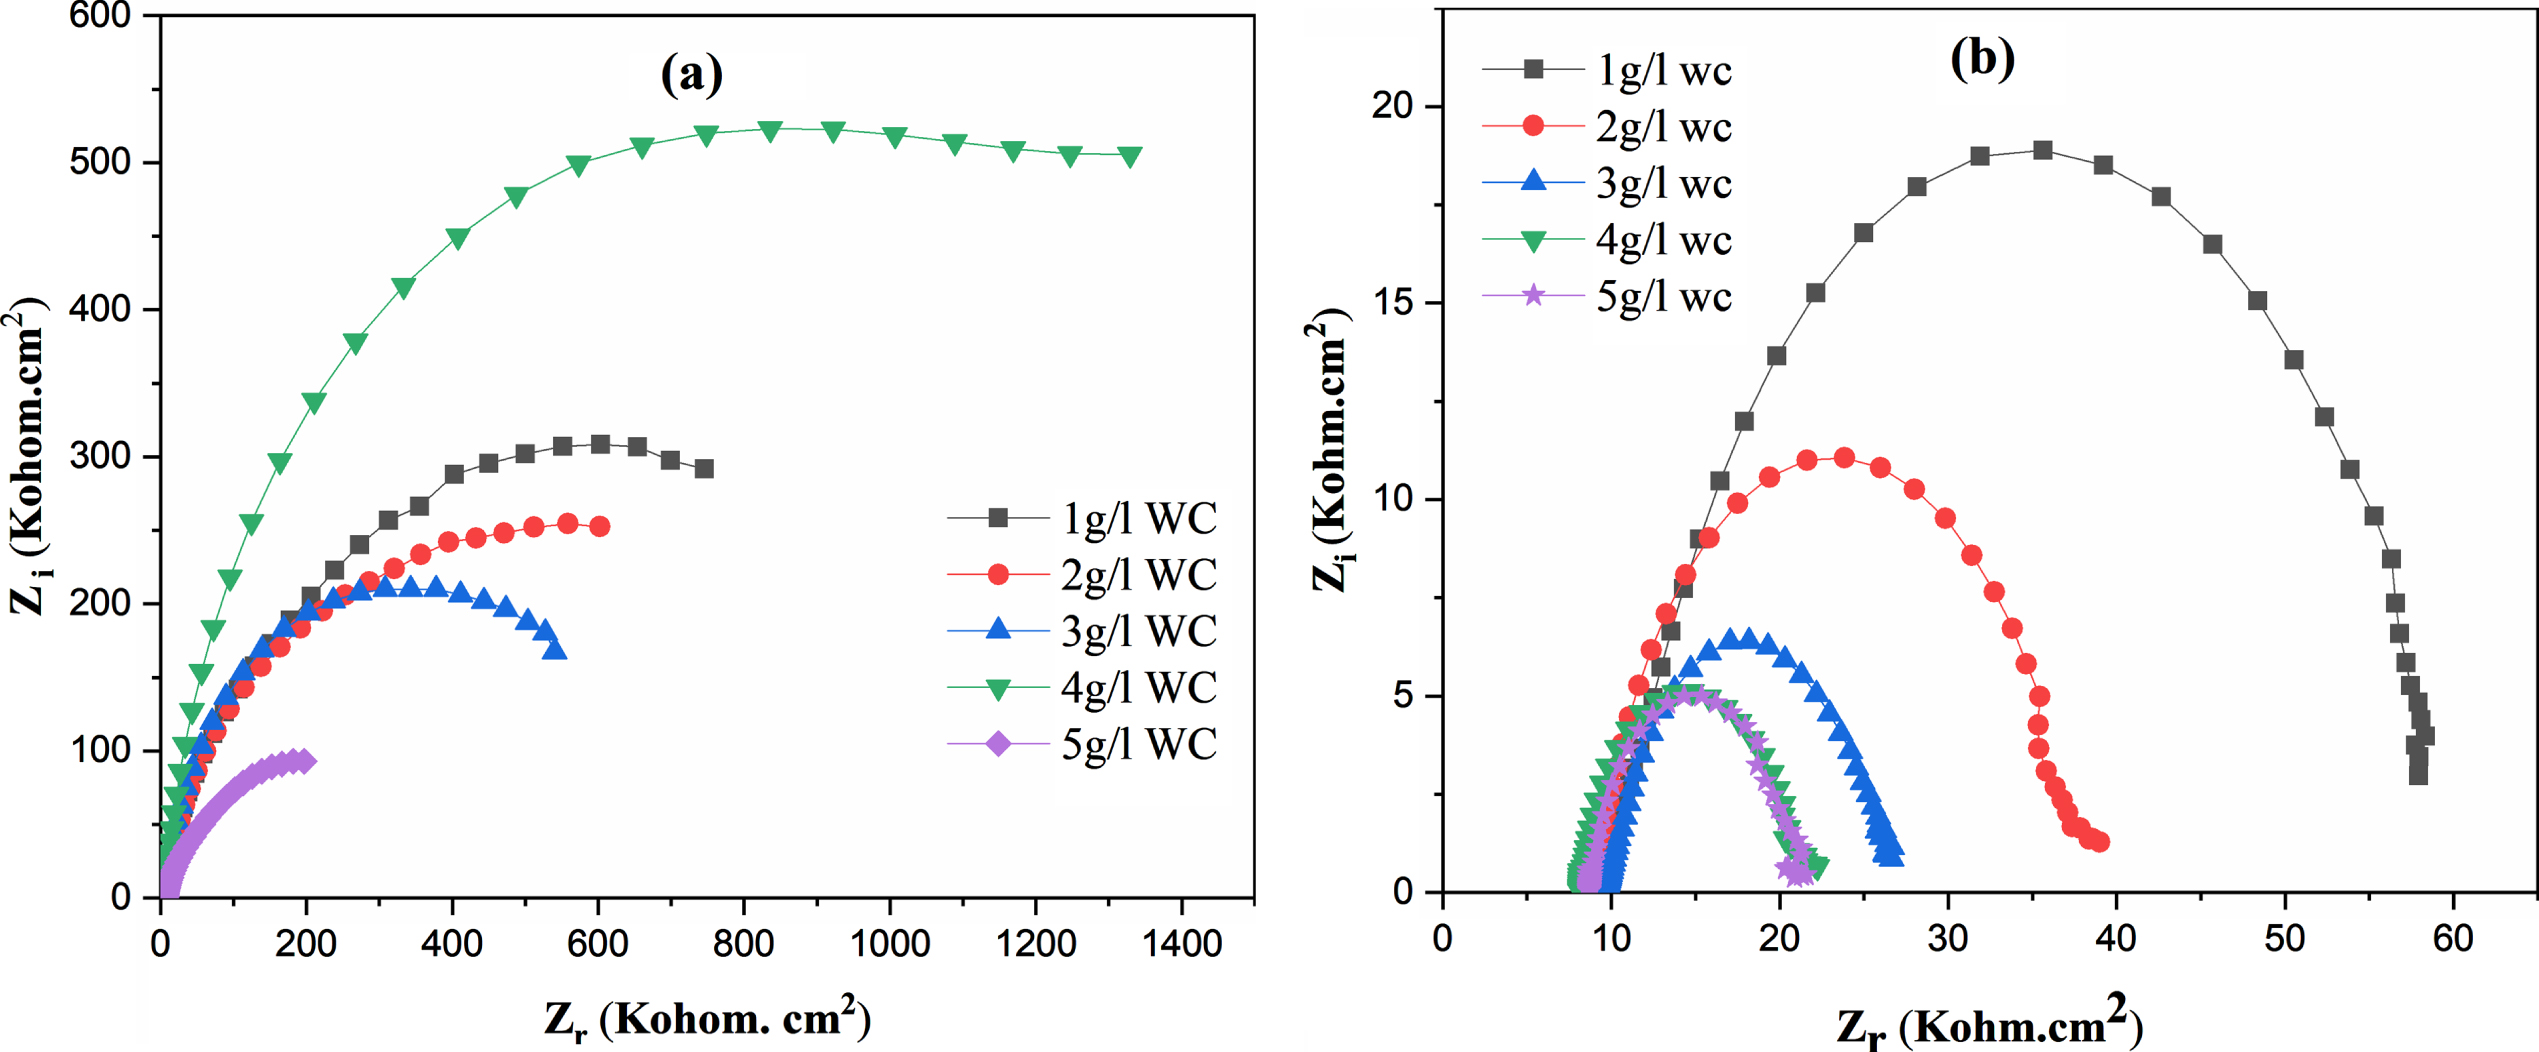
Nyquist plots of Ni-WC samples in: (a) 3.5% NaCl, (b) 0.1 M HCl.
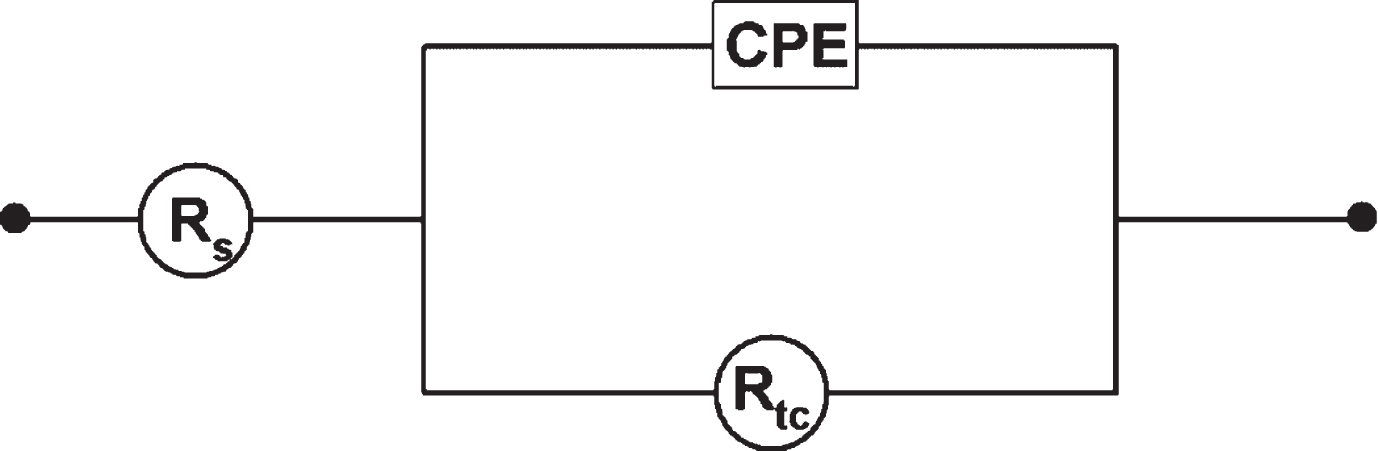
Fitted EIS parameters for Ni-WC composite coatings in 3.5% NaCl and 0.1 M HCl solutions.
Figure 6a shows that all the diagrams have almost the same appearance. Furthermore, it is considered that by increasing the concentration of solid particles WC, the diameters of the semi-circle increases. These results confirm what were obtained through the polarization study. The 4 g/l value gives the best value of Rtc (876,8 ohm. Cm2). The capacity CPE signal for this concentration translates the partial covering by the solid particles WC, and therefore, the reduction of the active surface of the electrode. The values of Rs and Rtc as well as those of the capacity were evaluated from these diagrams and collected in Table 5. The values of Rs, Rtc as well as those of the CPE are summarized in Table 6. The EIS results for 0.1 M HCl solution show that the semi-circle diameter decreases with the increase of solid particles concentration (Fig. 6b). The sample prepared at 1 g/l shows the highest value of charge transfer and the lowest value of capacity, therefore, it represents the best resistant coating.
Fitted EIS parameters for Ni-WC composites coatings in 3.5% NaCl solution
Fitted EIS parameters for Ni-WC allos coatings in 0.1 HCl soltion
This study presents the effect of the concentration of WC solid particles on the properties of electrodeposited Ni-WC composites coatings on copper substrates from nickel chloride bath. The EDS analysis shows that nickel is the matrix and the solid particles are incorporated in the matrix as reinforcement. The SEM images show that the morphology structure of pure nickel is uniform and compact. The codeposition of WC in nickel matrix shows random distribution of WC grains and makes cauliflower form. XRD pattern indicates good crystal structure with (110), (111), (200) and (311) preferred growth orientations. The microhardness and roughness of the coatings increase with the increase of nano-sized WC solid particle concentration. Based on the lowest corrosion density and the highest charge transfer resistance value, the electrochemical study represents 4 g/L in 3.5% NaCl electrolyte and 1 g/L in 0.1 M HCl electrolyte is the optimum conditions.