
Abstract
By the importance of exploring anti-cancer properties of thioguanine (TG), the relationships between quantum chemical indices and lipophilicity of TG tautomers were investigated using the quantitative structure-property relationship (QSPR) approach in two isolated and chitosan-encapsulated states. Accordingly, twenty numbers of different tautomeric forms of TG were selected to predict the logP using the QSPR models. Density functional theory (DFT) calculations along with Dragon package were applied to estimate the required quantum chemical descriptors. The Pearson correlation coefficient statistical test and Kennard-Stone algorithm were used to measure the statistical relationship and data splitting into training and testing set, respectively. Furthermore, the multiple linear regression (MLR) and artificial neural network (ANN) methods were employed for generating the models. In this regard, the analysis of variance (ANOVA) was used to form a basis criterion for testing the significance of MLR and ANN results. Moreover, the leave one out (LOO) method was used for examining the prediction efficiency of select models. The obtained result indicated benefits of proposed models for predicting reliable results of logP.
Introduction
Thioguanine (TG), or 6-thioguanine, has been used as an anti-cancer drug with the metabolic inhibition of acute lymphocytic leukemia, acute myeloid leukemia, and chronic myeloid leukemia [1, 2]. TG is indeed a derivative of purine nucleobases with the sulfur atom instead of the oxygen atom of guanine [3]. Accordingly, TG has been found as a compound with important pharmacological activity in cancer treatment such with the characteristic antitumor and antineoplastic functions [4]. The incorporation of TG into DNA and RNA in place of the original guanine could lead to the death of cancer cells [5]. Being a heterocyclic compound, different tautomeric forms of TG could be found similar to the condition of original nucleobases with impacts on the electronic and structural features of the parent TG compound [6]. Generally, the tautomerism is a common occurring process in biological systems with impacts on pharmacological activity of drug compounds; hence, it is an important issue to explore the features of tautomerism of drug compounds regarding the drug design purposes [7, 8]. To prevent occurrence of such process, additional of functional groups to the molecular structure could help as a protecting agents [9–11]. In this regard, evaluating the electronic features of compounds could help to predict their pharmacological properties for developing new therapeutic agents [12, 13]. The electronic features such as ionization energy, chemical potential, electron affinity, frontier molecular orbitals energy, chemical hardness and softness, electronegativity, and electrophilicity are some of known quantum chemical descriptors for approaching the goals of learning structure-activity (or property) relationships [14]. Accordingly, the quantitative structure-activity relationship (QSAR) and quantitative structure-property relationship (QSPR) analyses have been developed for approaching the prediction of activity and property of compounds with significant roles in various application fields of chemistry, biochemistry, and pharmacology [13]. In both of QSAR and QSPR analyses, the relationship between pharmacological activities and properties and the microscopic electronic features are investigated [14]. Earlier works showed benefits of employing such predicting methods for approaching the goals drug design and development processes [15–17]. Indeed, in the cases of so many problems of complicated systems, performing such molecular modelling study is a must to predict and interpret the investigating results [18–20].
Lipophilicity, as indicated by logP in this work, is an important physicochemical property for conducting the efficiency of a drug by providing insightful information about solubility, adsorption, and membrane penetration of a new synthetic compound [21]. Hence, several works have been dedicated to know about prediction of such important property of a compound even prior to its synthesis [22–24]. Accordingly, the present work was done to find available relationships between the calculated quantum chemical indices and logP of TG anti-cancer drug. To this aim, twenty tautomeric structures of TG were involved in prediction of logP using the QSPR models. In this regard, the electronic features including optimized energy, dipole moment, energies of the highest occupied and the lowest unoccupied molecular orbitals (HOMO and LUMO), energy gap, molecular polarizability, molecular quadrupole moment, and molecular volume were employed as the main quantum chemical descriptors. As earlier works indicated the importance of computer-based works for predicting important features and activity/property of the compounds and processes [25–27], this work was done to see what has been going on during the tautomerism of TG. It is worth to mention that both of compounds and processes are able to be predicted by the computer-based tools to show the advantages/disadvantages of the proposed processes [28–30]. In this regard, several approaches have been developed to approach the goals besides developments of mathematical theories and algorithms [31–33]. In the cases of investigating complicated systems, predicting the desired activity/property is essential before performing expensive experiments [34–36]. Indeed, the field of materials design and developments is a non-stop field depending on developments of more insightful information [37–40]. Both of QSAR and QSPR methods are among the computer-based predicating tools for providing information for the chemical/biochemical related compounds and processes, in which such advantages were employed to perform the current research work.
Materials and methods
The materials of this work were all possible tautomeric structures of TG including twenty structures as shown in Fig. 1 in two isolated and chitosan-encapsulated states [41, 42]. All structures were optimized using the Gaussian program package through the B3LYP/6-31G* density functional theory (DFT) calculations [43]. Subsequently, the quantum chemical descriptors were evaluated for the optimized structures including optimized energy, dipole moment, HOMO, LUMO, energy gap, molecular polarizability, molecular quadrupole moment, and molecular volume. Moreover, other required descriptors were obtained from the Dragon program package [44]. Total numbers of obtained descriptors through DFT calculations and Dragon package evaluation were 572 and 706 for the isolated and chitosan-encapsulated states, respectively. The Pearson correlation coefficient statistical test was used to delete the data which met the R2 > 0.8 using the MATLAB program package [45, 46]. By doing such process, the numbers of descriptors were decreased to 66 and 100 for the isolated and chitosan-encapsulated states, respectively. Finally, the lipophilicity was obtained for the tautomers by calculating the values of partition coefficients (logP) using the Hyperchem program package [47]. To perform the regression analyses, the methods of multiple linear regression (MLR) and artificial neural network (ANN) were selected for generating the models using the SPSS program package [48]. The existing data were divided into training set and testing set groups by including fourteen TG structures in the training set and six TG structures in the testing set. The data splitting procedure was performed based on the Kennard-Stone algorithm using the Chemoface program package [49].
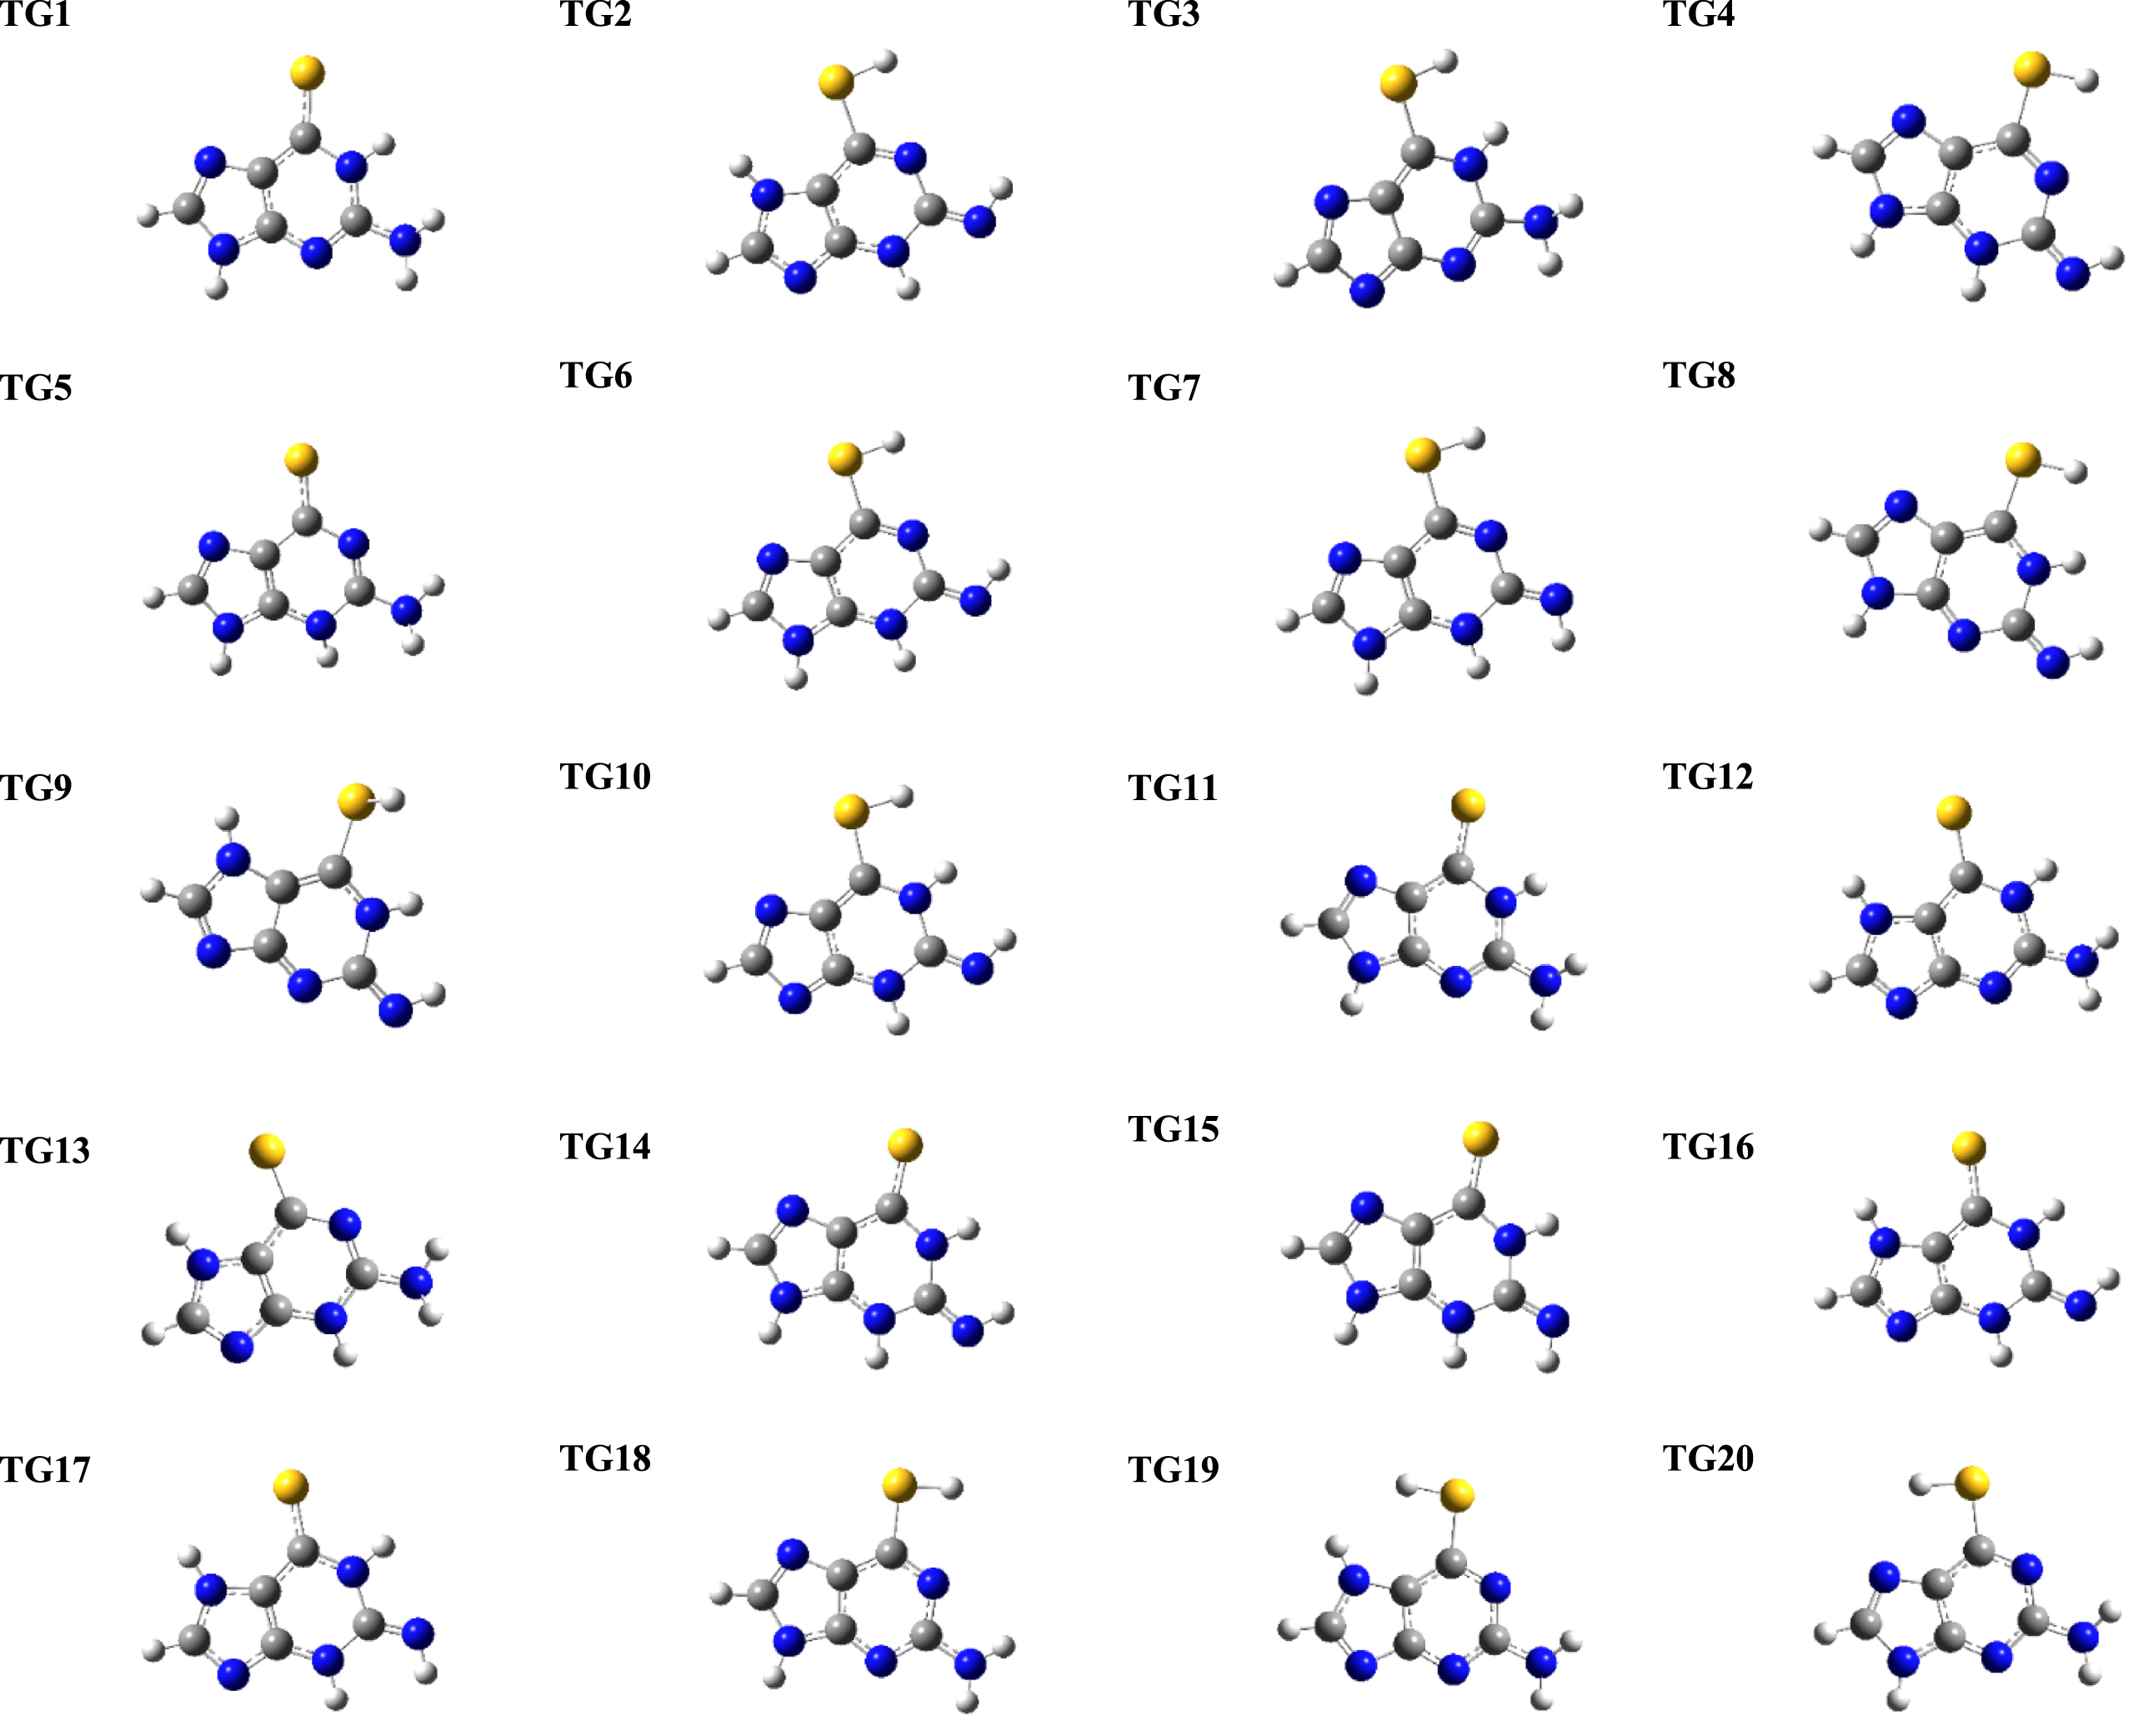
Molecular structures of twenty different tautomeric forms of TG. The ball with white, gray, blue and yellow color shows the hydrogen, carbon, nitrogen, and sulfur atom, respectively.
After obtaining the optimized structures, the required quantum chemical descriptors could be mainly evaluated by the values of HOMO and LUMO. Based on the Koopmans’ approximation [50], each of the ionization energy (I) and the electron affinity (A) could be found by Equations (2).
Accordingly, the Mulliken electronegativity (χ) [51] could be expressed by Equation (3).
Each of the chemical hardness (η) and the chemical softness (S) [52] could be approximated by Equations (5).
Finally, the expressed global electrophilicity (ω) in terms of chemical hardness and chemical potential (µ) [53] could be calculated by Equation (6).
To deal with the number of calculated descriptors and the number of tautomers, MLR and ANN methods were employed for generating the models. The prediction of one dependent variable through relationship description between this dependent (response) variable and two or more independent (explanatory) variables were explored by MLR [54]. Accordingly, ANOVA was used to form a basis criterion for testing the significance of MLR based on the number of explanatory variables reflected by the degree of freedom to show the effects of parameters [55]. For a linear regression model as described by Equation (7), the ANOVA analysis could be described by Equation (8).
Where Y, X, B0, B, ɛ, i, and α are response variable, explanatory variable, intercept term, model parameters, residual or error term, ith observation, and number of explanatory variables, respectively.
Where the first, second, and third term are total sum of squares (SST), sum of squares due to regression (SSR) and sum of squares of error/residuals (SSE), respectively, providing the ANOVA table (Table 1) [55].
The analysis of variance (ANOVA) table
Earlier works have also reported benefits of employing non-linear approaches such as ANN, to predict more efficient characters in comparison with linear based methods [56]. In this regard, ANN needs at least three main layers of input, output, and hidden layers, in which the number of input and output layers and included neurons are dependent on the number of input variables and the associated outputs with each input whereas the number of hidden layers could be different according to the problem state [57]. In this work, the perceptron model of ANN, as a convenient and basic building block of ANN, was applied including four parts of input values, weights and bias, weighted sum, and activation function as described by Equations (10) (Fig. 2) [58].
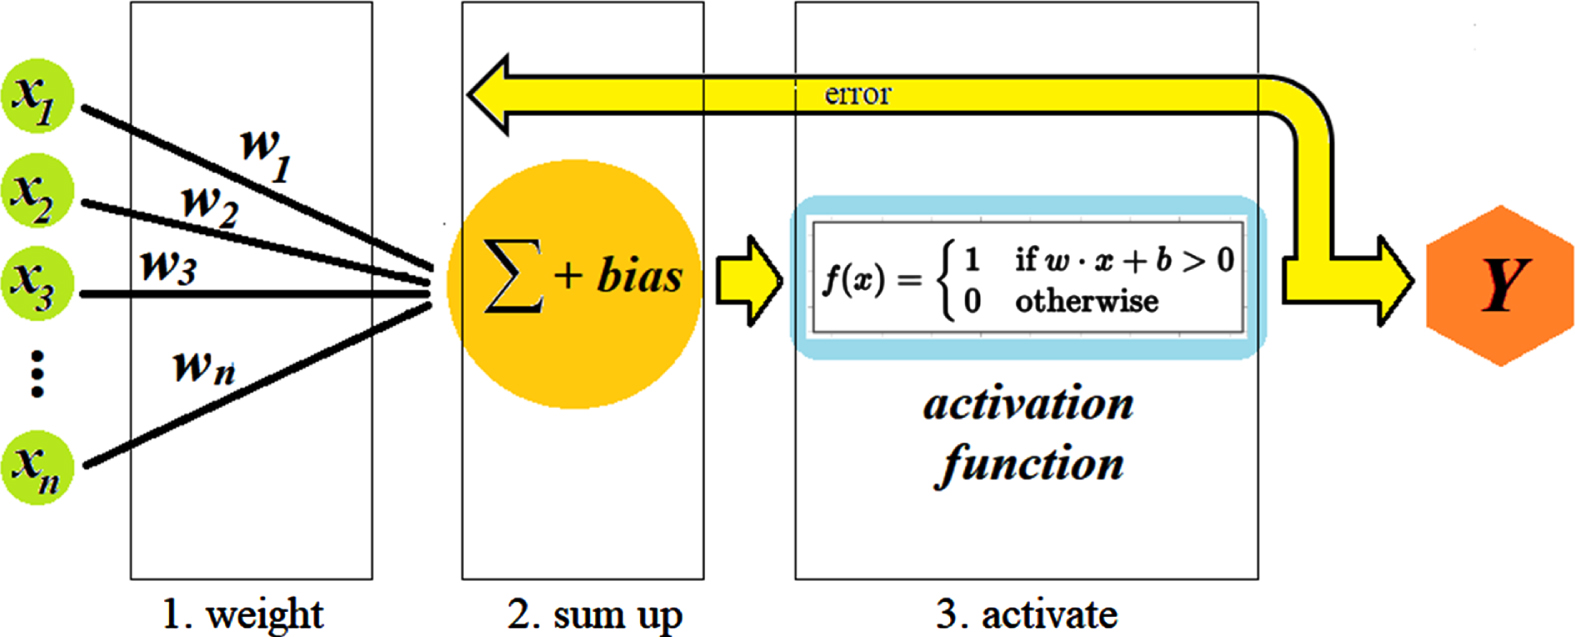
The perceptron rule of ANN.
Where y, w, x, and r are output, weight, input and learning rate, respectively. As described by Equation (9), the numerical inputs multiply with respective weights (called weighted sum) and then those products together are added to bias. Finally, the activation function based on a set of rules, returns a final output by taking the weighted sum and the bias. However, the perceptron must meet the bias as a threshold before the output production.
The Weights’ method was initiated for interpretation of ANN in order to show the relative importance of various inputs [59]. Using connecting weights could provide understanding of an input relative contribution, as well as a hidden neuron itself [60]. Hence, this algorithm works based on partitioning the connecting weights to determine the relation contribution of each input of hidden neuron in hidden-output connection weights of that hidden neuron. Indeed, the relative importance of each input could be calculated through dividing the absolute value of input-hidden layer connecting weight by the sum of absolute value of input-hidden layer connecting weight of all input neurons multiplied by 100. For one hidden layer like our work, the relative importance could be estimated by Equation (11) [61].
Where Q, w, and n are relative importance, connecting weight, and number of inputs, respectively.
Besides developing and employing the models, their validation is at the most importance especially for proposing in QSPR analysis; therefore, the leave one out (LOO) technique was employed in this work for such models validations [62]. The validation process of developed model was done by estimating two statistical parameters including determination coefficient (R2) and cross-validation coefficient of determination
Where
Furthermore, in order to make validation of model robustness and reliability, the prediction coefficient of determination (R2
prediction
) was evaluated by Equation (14) not to use the date of data set composition for developing the prediction models [63].
Where X, Y, and
Multiple Linear Regression (MLR) model
By the employed ANOVA for forming a basis criterion for testing the significance of MLR model, the performed analyses were listed in Table 2. It is known that the F-test is a tool to determine the difference of variances among two populations (between and within the groups) [64]. Accordingly, the ANOVA analysis was run with regarding the H0 and H1 hypotheses for measuring the significant level (α) as described by Equation (15).
ANOVA analysis results
ANOVA analysis results
The null hypotheses (H0) tells no difference in mean values and the against hypotheses (H1) tells inequality in mean values, which could be accepted/rejected by the value of 0.05 at the 95% significant level [64]. Considering the degree of freedom ESS and RSS, the critical values of different tautomeric forms of TG in the isolated and chitosan-encapsulated states are 3.0204 and 2.9480, respectively [64]. Referring to Table (2) and comparing the F values with the critical values, 1.624 < 3.0204 for TG the TG in isolated state and 1.456 < 2.9480 for the TG in chitosan-encapsulated state were found revealing that the H0 could not be rejected. In other words, no significant difference was seen for the mean values revealing insufficiency of MLR model for predicting logP.
In contrast with other common statistical modelling techniques, the PANN model is independent of conditions of normal distribution, linearity, homogeneity of variance, and so on [65]. Hence, based on such characteristic benefits and insufficiency of the MLR model, the PANN model was employed to drive a relationship between the evaluated descriptors and the corresponding logP of TG in the isolated and chitosan-encapsulated states. After splitting existing data into training set and test set, the PANN model was applied using the hyperbolic tangent function as the activation function and setting the initial values of weights to zero. The weights adjustment of network was performed by PANN through back propagating errors to minimize the differences between the target data and the estimated outputs. The data of sum of squared error, relative error, and training time of PANN for training and testing sets of TG were listed in Table 3. Additionally, the content of Table 4 and Fig. 3 show the PANN estimation of existing data of TG in the isolated and chitosan-encapsulated states, numerically and schematically, respectively. By showing the effects of hidden layer on the evaluated values of logP of the isolated TG, it could be mentioned that the independent variables with negative values of weight have positive effects on the evaluated value of logP and vice versa. On the other hand, the effects of hidden layer on the evaluated values of logP of the chitosan-encapsulated TG were positive and negative/positive values of weight of independent variables showed negative/positive effects on the logP. Moreover, the relative contributions of independent variables (inputs) were exhibited in Table 5 and Fig. 4 based on the weight method. In order to clarify the present or absent effects of chitosan-encapsulation on the evaluated values of logP, the differences between relative contributions of isolated and encapsulated states (Qencapsulated –Qisolated) were summarized in Table 5 and Fig. 5. The PANN results indicated that electronegativity and polarizability showed the maximum variation in the presence of chitosan-encapsulation in comparison with the isolated state among all the independent variables.
PANN results
PANN results
PANN estimations
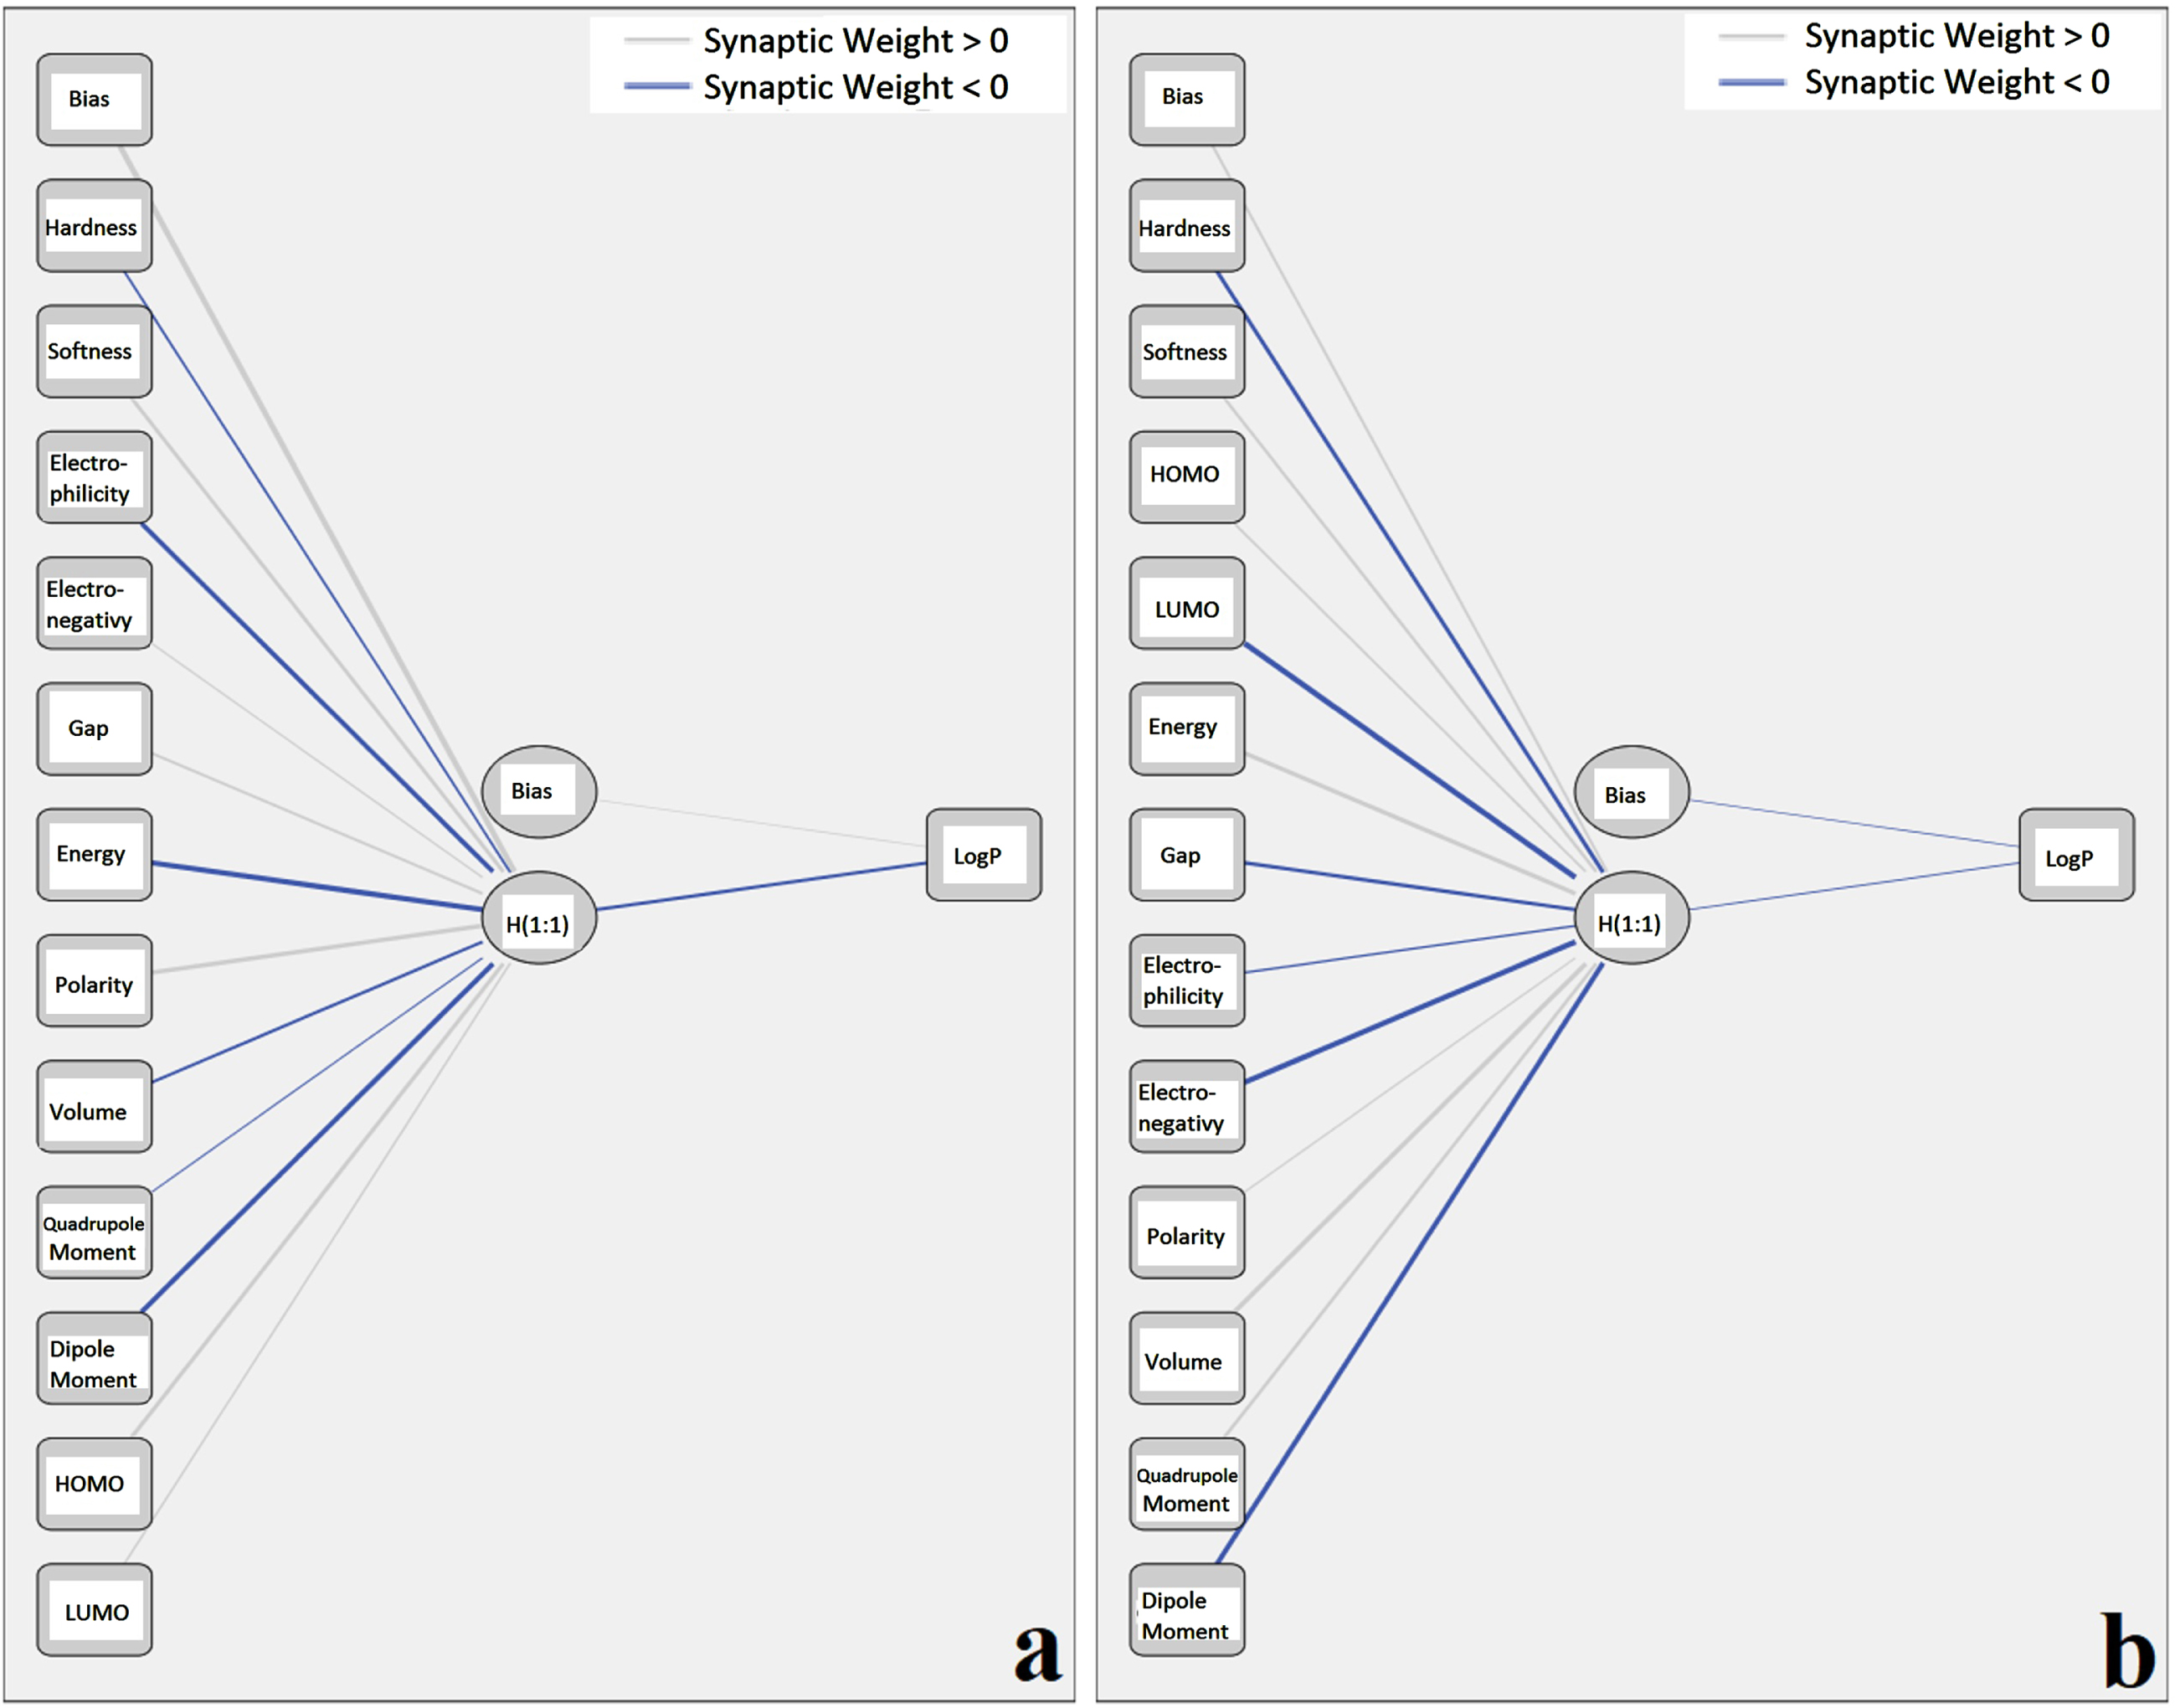
The PANN estimation of TG in (a) isolated and (b) chitosan-encapsulated states.
The relative contribution (%) of each descriptors in the output
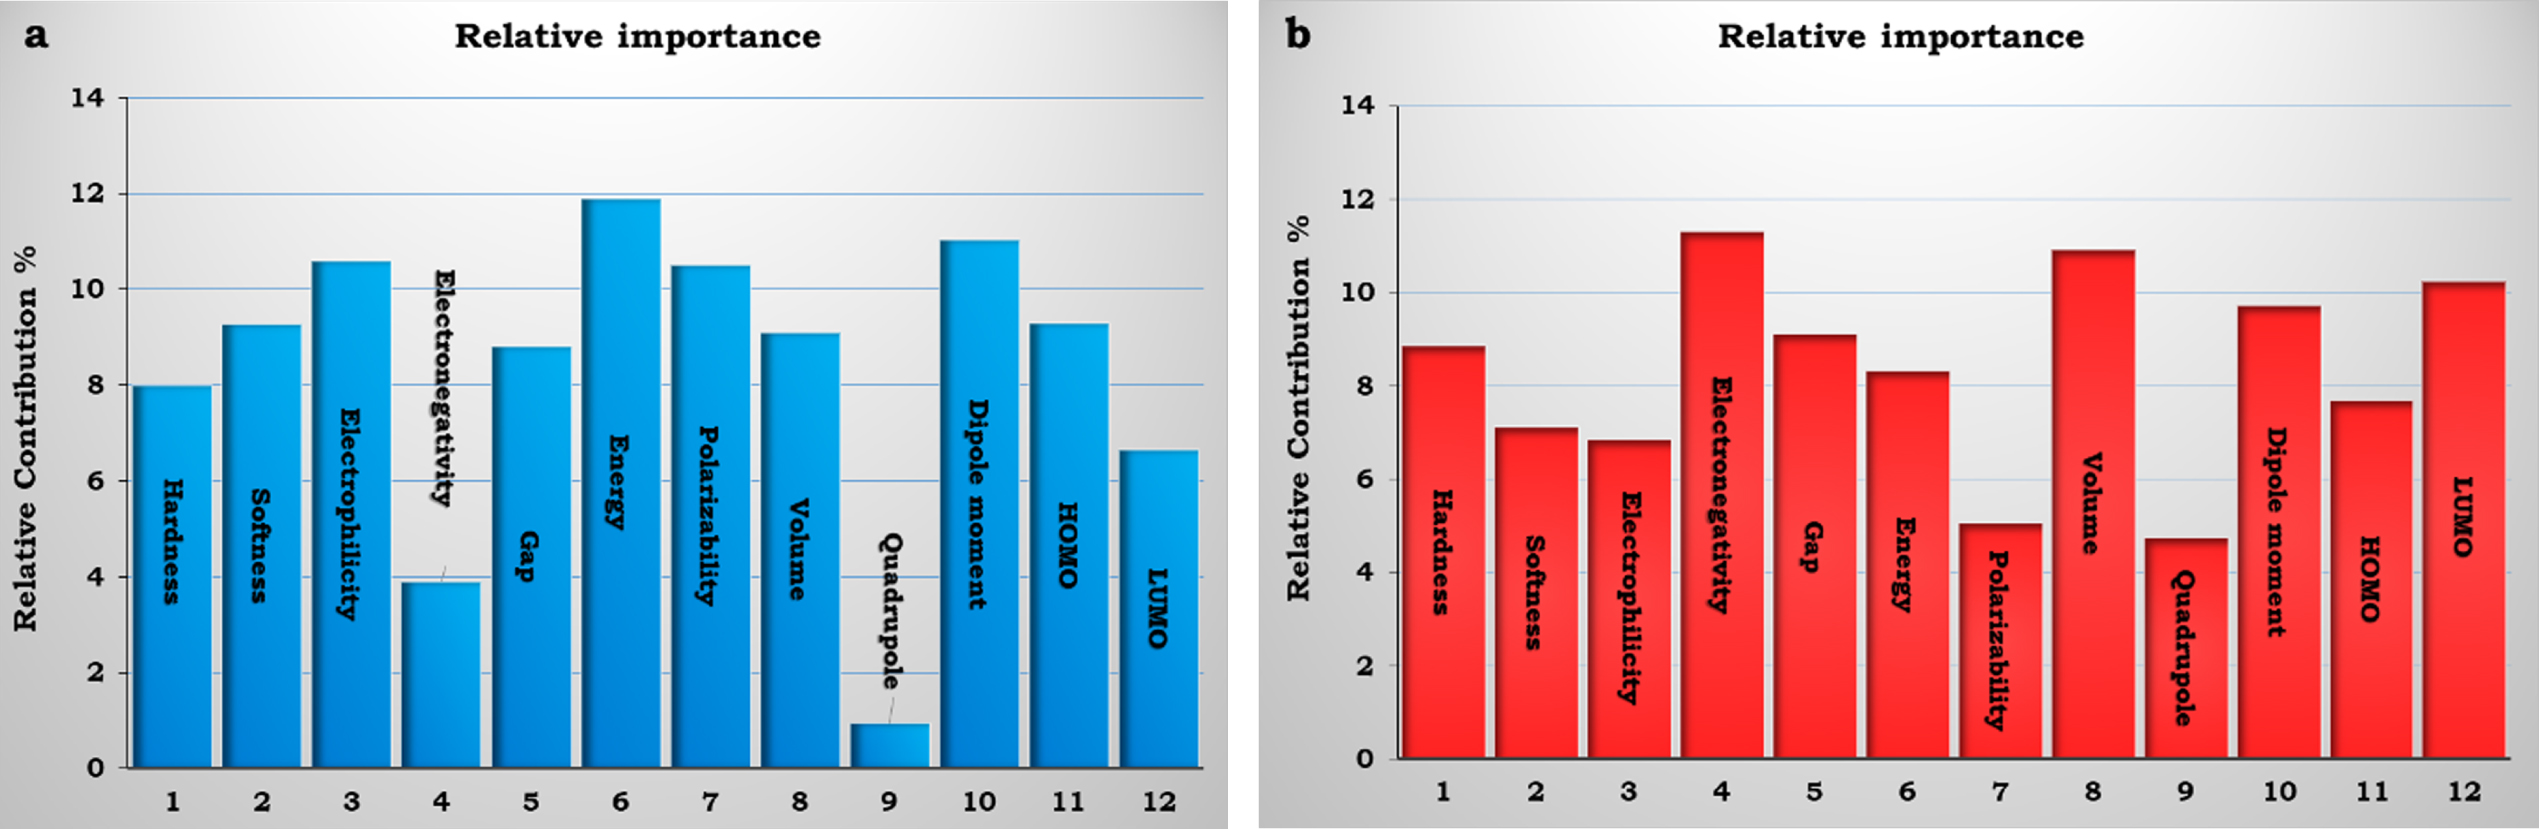
The assessment of relative contribution of TG in (a) isolated and (b) chitosan-encapsulated states.
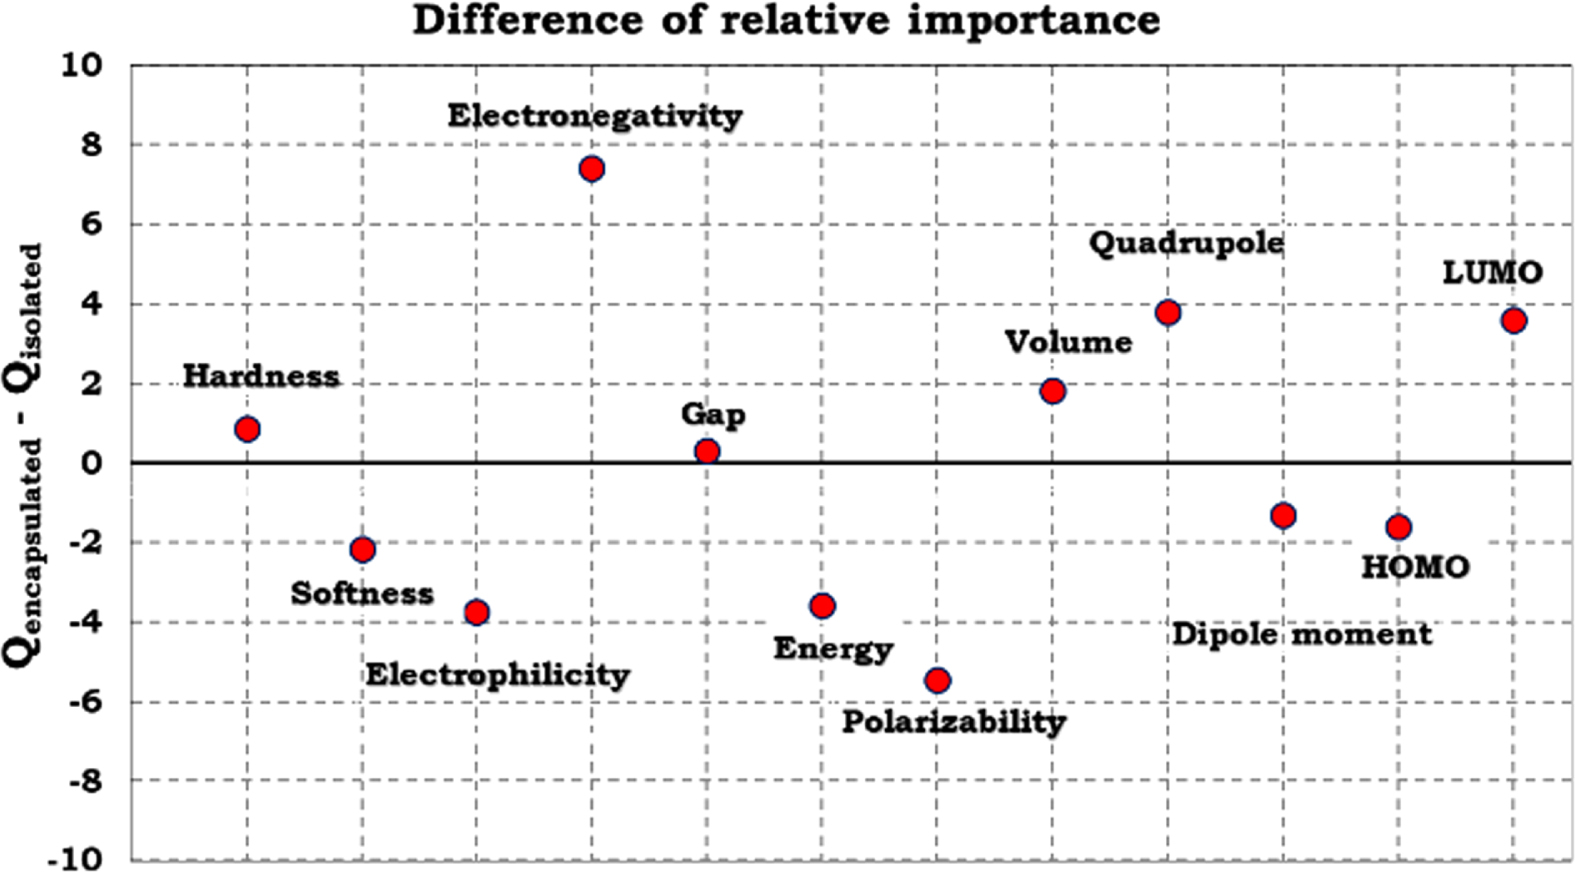
The effect of encapsulated state on the logP using difference of relative importance.
Three linear models were driven using the PANN model between descriptors and logP; one model for TG in the isolated state and two models for TG in the chitosan-encapsulated state.
For the isolated TG, the model was driven as mentioned below:
where N training = 14, N test = 6, R = 0.4617, R2 = 0.2132, RMSE = 0.4359, R cv = 0.0678, R2 cv = 0.0046, RMSE cv = 0.572, R prediction = 0.6797, R2 prediction = 0.4620
For the chitosan-encapsulated TG, two models were driven as mentioned blew:
where N
training
= 14, N
test
= 6, R = 0.9675, R2 = 0.9360, RMSE = 0.6397, R
cv
= 0.9136, R2
cv
= 0.8346, RMSE
cv
= 1.068, R
prediction
= 0.8491, R2
prediction
= 0.7210.
where N training = 14, N test = 6, R = 0.9811, R2 = 0.9625, RMSE = 0.4897, R cv = 0.8631, R2 cv = 0.7450, RMSE cv = 0.9185, R prediction = 0.9110, R2 prediction = 0.829.
In the reported models; logP, Mor32v, volume, lipophilicity, Du, Dm, MATs3p, Mor26u, and H2u are the signal 32 / more weighted by van der Waals volume, the molecular volume calculated by Gaussian, the D total accessibility index/ unweighted, the D total accessibility index / weighted by mass, the Moran autocorrelation of lag weighted by polarizability, the signal 26 / unweighted and H autocorrelation of lag 2 / unweighted, respectively. All the standard deviations were written in the parentheses for each coefficient. In general, a reliable model should possess lower standard errors and higher correlation coefficients. In other words, a developed QSPR model is reliable in the satisfactory levels of R≥0.8 or R2≥0.6, R2 cv ≥0.5, and R2 prediction ≥0.6, for its correlation coefficient, cross-validated coefficient, and correlation coefficient, respectively, with the significant level F higher than 95% [66]. Consequently, the proposed equation of logP showed higher satisfactory in the chitosan-encapsulated stare in comparison with the isolated state. Additionally, the ANOVA analysis for three proposed models were reported in the Table 6. Regarding the degrees of freedom ESS and RSS; 3.9823, 3.6331, and 3.6875, were obtained for the critical values of first, second, and third model of TG [64]. Referring to Table 6 and comparing the F values with critical values, it could be mentioned that the proposed models of PANN were reliable for predicting logP of TG.
ANOVA analysis of three proposed QSPR models
In the present report, the existence of a relationship between the quantum chemical descriptors and the lipophilicity of TG in the isolated and chitosan-encapsulated states was investigated using the QSPR method. Based on the employed methods and obtained results, it was found that the main goal of this work could be achieved by the ANN model better than the MLR model. Accordingly, three QSPR models were obtained based on the ANN model for showing the relationships of descriptors and logP. The results also indicated the chitosan-encapsulated TG structures were more suitable than the isolated sate for achieving such QSPR models. As a consequence, the values of logP of TG, which are important regarding their roles in dug efficiency, could be predicted by the proposed QSPR models of this work.
Authors’ Contribution Statement
The contribution of Somaye Mir Mohammad Hoseini Ahari was to preparing all parts of this manuscript besides conducting the whole project, and the contribution of Mahmoud Mirzaei was to editing the written manuscript.